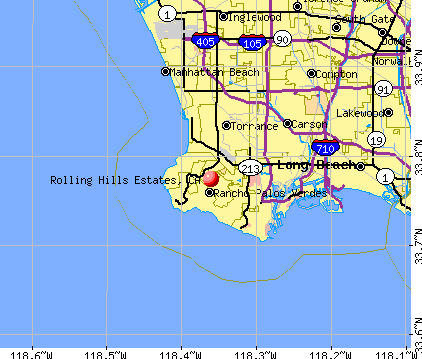
Rolling Hills Estates, California
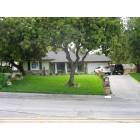
Rolling Hills Estates: Lovely House in Rolling Hills Estates
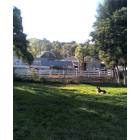
Rolling Hills Estates: View from the landfill looking south near the entrance (near Roanwood) with Roxy the Border Collie
- add
your
Submit your own pictures of this city and show them to the world
- OSM Map
- General Map
- Google Map
- MSN Map
Population change since 2000: +4.5%
 |
| Males: 4,024 | |
| Females: 3,994 |
| Median resident age: | 49.0 years |
| California median age: | 37.9 years |
Zip codes: 90274.
| Rolling Hills Estates: | $177,986 |
| CA: | $91,551 |
Estimated per capita income in 2022: $93,617 (it was $51,849 in 2000)
Rolling Hills Estates city income, earnings, and wages data
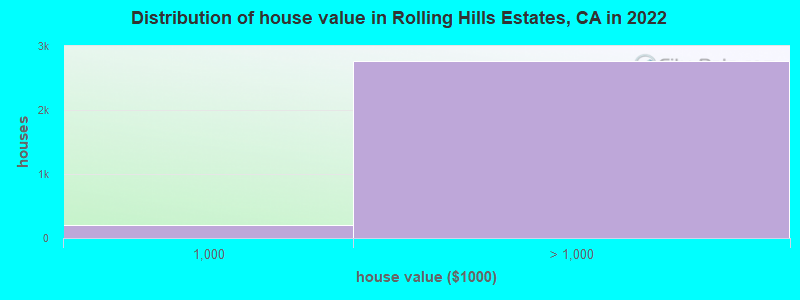
Estimated median house or condo value in 2022: over $1,000,000 (it was $640,200 in 2000)
| Rolling Hills Estates: | over $1,000,000 |
| CA: | $715,900 |
Mean prices in 2022: all housing units: over $1,000,000; detached houses: over $1,000,000; townhouses or other attached units: over $1,000,000; in 3-to-4-unit structures: over $1,000,000; in 5-or-more-unit structures: over $1,000,000
Median gross rent in 2022: $3,501.
Rolling Hills Estates, CA residents, houses, and apartments details
(1.8% for White Non-Hispanic residents, 2.5% for two or more races residents)
Detailed information about poverty and poor residents in Rolling Hills Estates, CA

Compare current foreclosures near Rolling Hills Estates, CA:
| Photo | Address | Area | Beds / Baths | Price | Details |
|---|---|---|---|---|---|

|
#1
Mira Mar Ave
Long Beach, CA 90814
|
1,902 sq. feet
|
2 baths 4 beds |
show details | |

|
#2
Elburg St Unit A
Paramount, CA 90723
|
1,131 sq. feet
|
2 baths 3 beds |
show details | |

|
#3
Marina City Dr Unit 116
Marina Del Rey, CA 90292
|
1,722 sq. feet
|
2 baths 3 beds |
show details | |

|
#4
E 60th St
Los Angeles, CA 90001
|
1,883 sq. feet
|
3 baths 5 beds |
show details | |

|
#5
6th Ave
Venice, CA 90291
|
3,192 sq. feet
|
3 baths 6 beds |
show details | |

|
#6
W Arbor St # 57
Long Beach, CA 90805
|
1,585 sq. feet
|
2 baths 3 beds |
show details | |

|
#7
Dunrobin Ave
Downey, CA 90242
|
3,000 sq. feet
|
4 baths 8 beds |
show details | |

|
#8
Redondo Avenue, Units 5-8
Long Beach, CA 90804
|
3,360 sq. feet
|
4 baths 8 beds |
show details | |

|
#9
W 110th St
Inglewood, CA 90303
|
3,481 sq. feet
|
4 baths 6 beds |
show details | |

|
#10
Walnut Ave
Long Beach, CA 90807
|
1,912 sq. feet
|
3 baths 2 beds |
show details |
| Photo | Address | Area | Beds / Baths | Price | Details |
|---|---|---|---|---|---|

|
#11
Cook St
Los Angeles, CA 90061
|
1,204 sq. feet
|
2 baths 4 beds |
show details | |

|
#12
Bonnie Brae St
Hermosa Beach, CA 90254
|
2,471 sq. feet
|
3 baths 3 beds |
show details | |

|
#13
E Stockwell St
Compton, CA 90222
|
848 sq. feet
|
2 baths 4 beds |
show details | |

|
#14
4th Ave
Los Angeles, CA 90008
|
1,392 sq. feet
|
2 baths 2 beds |
show details | |

|
#15
W 94th St
Los Angeles, CA 90044
|
1,322 sq. feet
|
2 baths 3 beds |
show details | |

|
#16
S Gramercy Pl
Los Angeles, CA 90047
|
1,800 sq. feet
|
2 baths 3 beds |
show details | |

|
#17
Del Amo Blvd
Lakewood, CA 90712
|
1,371 sq. feet
|
2 baths 4 beds |
show details | |

|
#18
S Tamarind Ave
Compton, CA 90220
|
900 sq. feet
|
1 baths 4 beds |
show details | |

|
#19
Santa Fe Ave
Lynwood, CA 90262
|
1,124 sq. feet
|
2 baths 3 beds |
show details | |

|
#20
Dunrobin Ave
Lakewood, CA 90713
|
1,032 sq. feet
|
1 baths 2 beds |
show details |
| Photo | Address | Area | Beds / Baths | Price | Details |
|---|---|---|---|---|---|

|
#21
S Cabrillo Ave
San Pedro, CA 90731
|
1,682 sq. feet
|
2 baths 4 beds |
show details | |

|
#22
Marbella Ave
Carson, CA 90745
|
1,348 sq. feet
|
2 baths 3 beds |
show details | |

|
#23
Walnut Dr
Los Angeles, CA 90001
|
944 sq. feet
|
1 baths 3 beds |
show details | |

|
#24
Playa Vista Dr Apt 15
Los Angeles, CA 90094
|
1,920 sq. feet
|
3 baths 1 beds |
show details | |

|
#25
20th Ave
Venice, CA 90291
|
1,564 sq. feet
|
3 baths 3 beds |
show details | |

|
#26
Ocana Ave
Bellflower, CA 90706
|
1,218 sq. feet
|
2 baths 3 beds |
show details | |

|
#27
Van Ness Ave
Torrance, CA 90504
|
1,093 sq. feet
|
2 baths 2 beds |
show details | |

|
#28
Virginia St
Lynwood, CA 90262
|
1,548 sq. feet
|
2 baths 3 beds |
show details | |

|
#29
S Wilmington Ave Apt A
Compton, CA 90220
|
1,137 sq. feet
|
2 baths 3 beds |
show details | |

|
#30
Cortland Ave
Paramount, CA 90723
|
2,354 sq. feet
|
3 baths 4 beds |
show details |
| Photo | Address | Area | Beds / Baths | Price | Details |
|---|---|---|---|---|---|

|
#31
Harlan Ave
Carson, CA 90746
|
1,422 sq. feet
|
2 baths 3 beds |
show details | |

|
#32
N Adelon Ln
Compton, CA 90221
|
1,900 sq. feet
|
3 baths 3 beds |
show details | |

|
#33
Holmes Ave
Los Angeles, CA 90001
|
1,129 sq. feet
|
2 baths 4 beds |
show details | |

|
#34
Missouri Ave
South Gate, CA 90280
|
1,441 sq. feet
|
2 baths 3 beds |
show details | |

|
#35
S Bentley Ave
Compton, CA 90220
|
1,738 sq. feet
|
2 baths 4 beds |
show details | |

|
#36
Olmsted Ave
Los Angeles, CA 90008
|
1,550 sq. feet
|
2 baths 3 beds |
show details | |

|
#37
Denker Ave
Los Angeles, CA 90062
|
1,196 sq. feet
|
1 baths 2 beds |
show details | |

|
#38
5th Ave
Los Angeles, CA 90043
|
1,315 sq. feet
|
2 baths 3 beds |
show details | |

|
#39
Maie Ave
Los Angeles, CA 90001
|
860 sq. feet
|
1 baths 2 beds |
show details | |

|
#40
S Gramercy Pl
Los Angeles, CA 90062
|
- sq. feet
|
2 baths 4 beds |
show details |
| Photo | Address | Area | Beds / Baths | Price | Details |
|---|---|---|---|---|---|

|
#41
E 92nd St
Los Angeles, CA 90002
|
2,290 sq. feet
|
2 baths 4 beds |
show details | |

|
#42
W 76th St
Inglewood, CA 90305
|
1,668 sq. feet
|
2 baths 3 beds |
show details | |

|
#43
Lees Ave
Long Beach, CA 90808
|
887 sq. feet
|
1 baths 2 beds |
show details | |

|
#44
S Broadway
Los Angeles, CA 90061
|
1,620 sq. feet
|
3 baths 4 beds |
show details | |

|
#45
Johnson Ave
Long Beach, CA 90805
|
1,252 sq. feet
|
2 baths 3 beds |
show details | |

|
#46
W 45th St
Los Angeles, CA 90062
|
1,297 sq. feet
|
1 baths 2 beds |
show details | |

|
#47
Wilmington Ave
Los Angeles, CA 90059
|
850 sq. feet
|
1 baths 2 beds |
show details | |

|
#48
E Barclay St
Long Beach, CA 90805
|
963 sq. feet
|
1 baths 3 beds |
show details | |

|
#49
W 105th St
Los Angeles, CA 90044
|
792 sq. feet
|
1 baths 2 beds |
show details | |

|
Check over 1 million property listings on Foreclosure.com!
|
browse all offers | |||


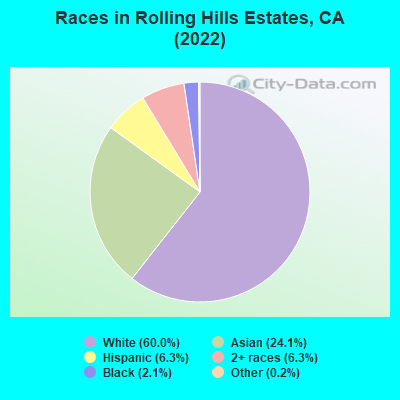
- 4,81960.0%White alone
- 1,94024.1%Asian alone
- 5036.3%Two or more races
- 5106.3%Hispanic
- 1682.1%Black alone
- 130.2%Other race alone
- 60.07%American Indian alone
According to our research of California and other state lists, there were 2 registered sex offenders living in Rolling Hills Estates, California as of April 27, 2024.
The ratio of all residents to sex offenders in Rolling Hills Estates is 4,136 to 1.
The ratio of registered sex offenders to all residents in this city is much lower than the state average.
Type |
2009 |
2010 |
2011 |
2012 |
2013 |
2014 |
2015 |
2016 |
2017 |
2018 |
2019 |
2020 |
2022 |
|---|---|---|---|---|---|---|---|---|---|---|---|---|---|
| Murders (per 100,000) | 1 (12.7) | 0 (0.0) | 0 (0.0) | 0 (0.0) | 0 (0.0) | 0 (0.0) | 0 (0.0) | 0 (0.0) | 0 (0.0) | 1 (12.1) | 0 (0.0) | 0 (0.0) | 0 (0.0) |
| Rapes (per 100,000) | 1 (12.7) | 0 (0.0) | 0 (0.0) | 0 (0.0) | 0 (0.0) | 0 (0.0) | 0 (0.0) | 0 (0.0) | 2 (24.2) | 3 (36.4) | 0 (0.0) | 2 (24.8) | 1 (12.4) |
| Robberies (per 100,000) | 5 (63.5) | 3 (37.2) | 3 (36.8) | 1 (12.2) | 1 (12.2) | 3 (36.4) | 4 (48.2) | 8 (96.4) | 1 (12.1) | 2 (24.2) | 3 (36.8) | 3 (37.2) | 4 (49.7) |
| Assaults (per 100,000) | 7 (88.8) | 12 (148.8) | 3 (36.8) | 8 (97.5) | 2 (24.3) | 4 (48.6) | 5 (60.3) | 3 (36.2) | 9 (109.0) | 2 (24.2) | 7 (85.9) | 6 (74.5) | 4 (49.7) |
| Burglaries (per 100,000) | 43 (545.8) | 30 (371.9) | 43 (526.8) | 36 (438.9) | 29 (352.4) | 26 (315.8) | 48 (578.6) | 33 (397.7) | 42 (508.5) | 33 (400.0) | 35 (429.4) | 27 (335.1) | 48 (596.9) |
| Thefts (per 100,000) | 110 (1,396) | 101 (1,252) | 115 (1,409) | 90 (1,097) | 82 (996.5) | 83 (1,008) | 56 (675.0) | 88 (1,061) | 103 (1,247) | 67 (812.2) | 82 (1,006) | 86 (1,067) | 85 (1,057) |
| Auto thefts (per 100,000) | 3 (38.1) | 6 (74.4) | 4 (49.0) | 3 (36.6) | 7 (85.1) | 5 (60.7) | 5 (60.3) | 5 (60.3) | 8 (96.9) | 8 (97.0) | 9 (110.4) | 6 (74.5) | 2 (24.9) |
| Arson (per 100,000) | 1 (12.7) | 0 (0.0) | 0 (0.0) | 1 (12.2) | 0 (0.0) | 0 (0.0) | 1 (12.1) | 0 (0.0) | 2 (24.2) | 2 (24.2) | 1 (12.3) | 0 (0.0) | 0 (0.0) |
| City-Data.com crime index | 169.4 | 123.0 | 115.5 | 100.7 | 79.8 | 87.9 | 98.8 | 111.2 | 138.0 | 133.7 | 107.3 | 118.0 | 120.9 |
The City-Data.com crime index weighs serious crimes and violent crimes more heavily. Higher means more crime, U.S. average is 246.1. It adjusts for the number of visitors and daily workers commuting into cities.
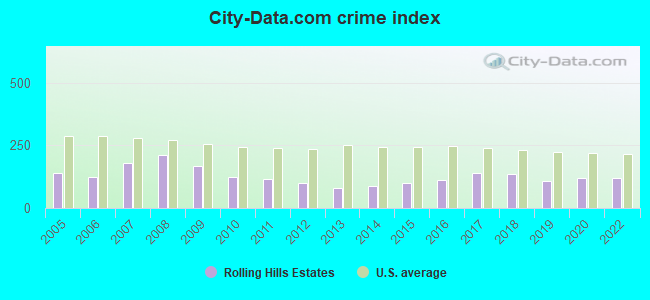
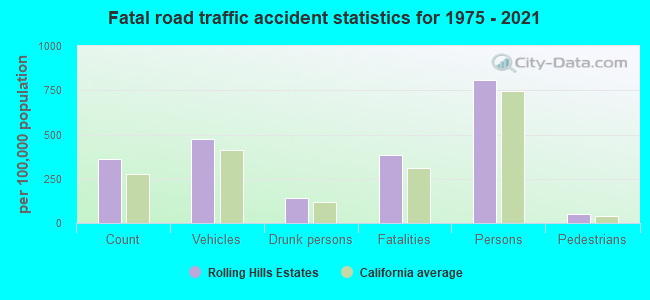
Crime rate in Rolling Hills Estates detailed stats: murders, rapes, robberies, assaults, burglaries, thefts, arson
Full-time law enforcement employees in 2015, including police officers: 1 (1 officers - 1 male; 0 female).
| Officers per 1,000 residents here: | 0.12 |
| California average: | 1.98 |
 Recent articles from our blog. Our writers, many of them Ph.D. graduates or candidates, create easy-to-read articles on a wide variety of topics.


Latest news from Rolling Hills Estates, CA collected exclusively by city-data.com from local newspapers, TV, and radio stations
Ancestries: Italian (6.3%), English (5.6%), German (5.2%), American (3.3%), African (3.1%), European (3.0%).
Current Local Time: PST time zone
Elevation: 500 feet
Land area: 3.59 square miles.
Population density: 2,234 people per square mile (low).
1,875 residents are foreign born (16.9% Asia, 3.9% Europe).
| This city: | 23.3% |
| California: | 26.5% |
Median real estate property taxes paid for housing units with mortgages in 2022: $10,281 (0.6%)
Median real estate property taxes paid for housing units with no mortgage in 2022: $8,646 (0.6%)
Nearest city with pop. 50,000+: Palos Verdes, CA  (3.7 miles , pop. 89,786).
Nearest city with pop. 200,000+: Long Beach, CA (11.8 miles , pop. 461,522).
Nearest city with pop. 1,000,000+: Los Angeles, CA (21.6 miles , pop. 3,694,820).
Nearest cities:
Latitude: 33.77 N, Longitude: 118.36 W
Daytime population change due to commuting: +781 (+9.7%)
Workers who live and work in this city: 967 (30.1%)
Area code commonly used in this area: 310
Property values in Rolling Hills Estates, CA
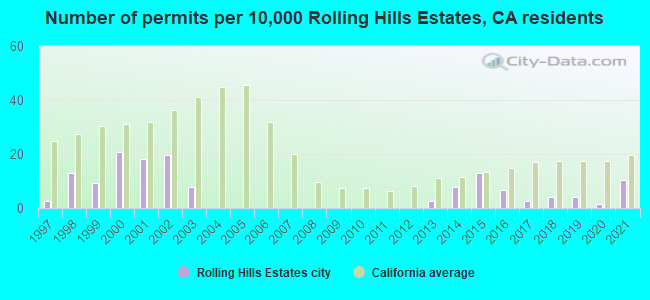
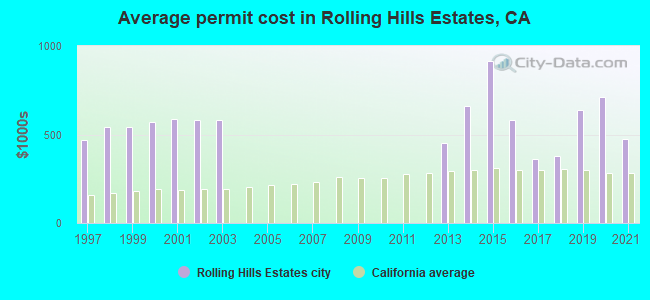
Single-family new house construction building permits:
- 2021: 8 buildings, average cost: $477,200
- 2020: 1 building, cost: $713,000
- 2019: 3 buildings, average cost: $641,000
- 2018: 3 buildings, average cost: $381,200
- 2017: 2 buildings, average cost: $361,000
- 2016: 5 buildings, average cost: $584,000
- 2015: 10 buildings, average cost: $917,200
- 2014: 6 buildings, average cost: $663,300
- 2013: 2 buildings, average cost: $453,500
- 2003: 6 buildings, average cost: $584,000
- 2002: 15 buildings, average cost: $582,100
- 2001: 14 buildings, average cost: $585,900
- 2000: 16 buildings, average cost: $571,400
- 1999: 7 buildings, average cost: $544,400
- 1998: 10 buildings, average cost: $544,400
- 1997: 2 buildings, average cost: $467,000
| Here: | 5.0% |
| California: | 5.1% |
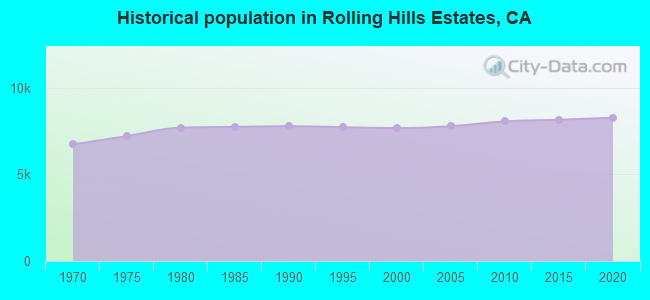
Population change in the 1990s: +97 (+1.3%).
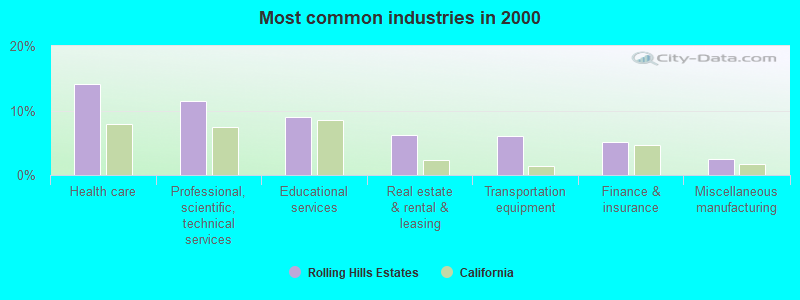
- Health care (14.1%)
- Professional, scientific, technical services (11.5%)
- Educational services (8.9%)
- Real estate & rental & leasing (6.2%)
- Transportation equipment (6.1%)
- Finance & insurance (5.2%)
- Miscellaneous manufacturing (2.5%)
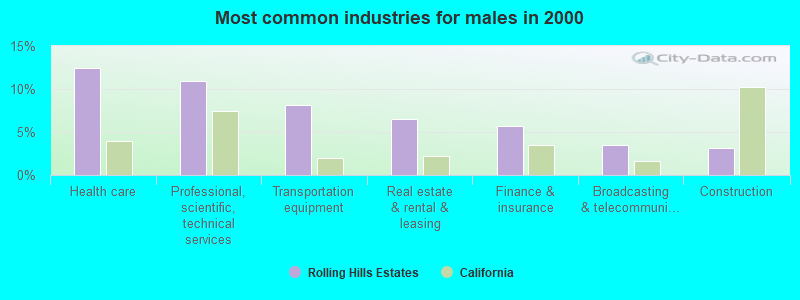
- Health care (12.5%)
- Professional, scientific, technical services (10.9%)
- Transportation equipment (8.1%)
- Real estate & rental & leasing (6.5%)
- Finance & insurance (5.7%)
- Broadcasting & telecommunications (3.5%)
- Construction (3.1%)
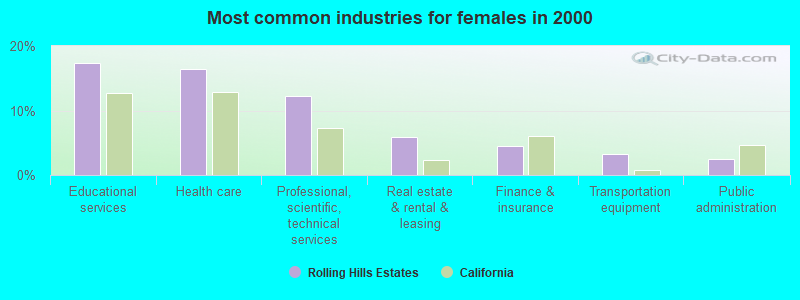
- Educational services (17.3%)
- Health care (16.4%)
- Professional, scientific, technical services (12.3%)
- Real estate & rental & leasing (5.8%)
- Finance & insurance (4.4%)
- Transportation equipment (3.2%)
- Public administration (2.4%)
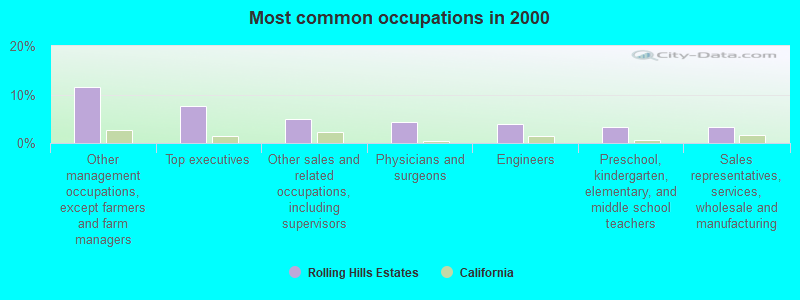
- Other management occupations, except farmers and farm managers (11.5%)
- Top executives (7.7%)
- Other sales and related occupations, including supervisors (5.0%)
- Physicians and surgeons (4.3%)
- Engineers (4.0%)
- Preschool, kindergarten, elementary, and middle school teachers (3.4%)
- Sales representatives, services, wholesale and manufacturing (3.3%)
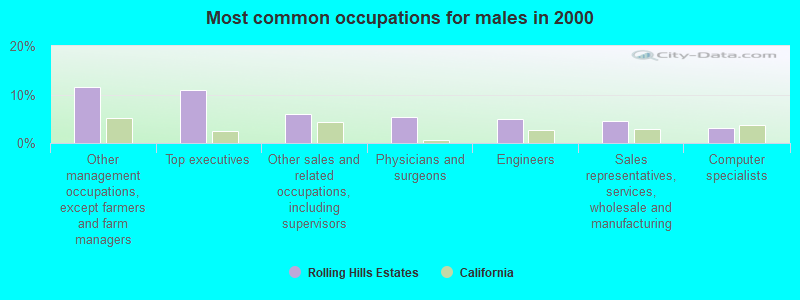
- Other management occupations, except farmers and farm managers (11.6%)
- Top executives (11.0%)
- Other sales and related occupations, including supervisors (6.0%)
- Physicians and surgeons (5.4%)
- Engineers (4.9%)
- Sales representatives, services, wholesale and manufacturing (4.6%)
- Computer specialists (3.2%)
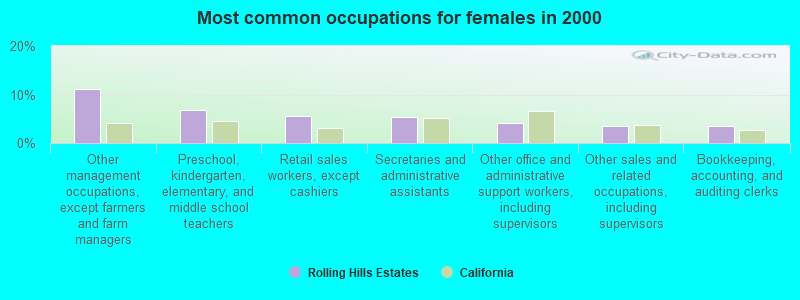
- Other management occupations, except farmers and farm managers (11.2%)
- Preschool, kindergarten, elementary, and middle school teachers (6.7%)
- Retail sales workers, except cashiers (5.5%)
- Secretaries and administrative assistants (5.4%)
- Other office and administrative support workers, including supervisors (4.2%)
- Other sales and related occupations, including supervisors (3.6%)
- Bookkeeping, accounting, and auditing clerks (3.5%)
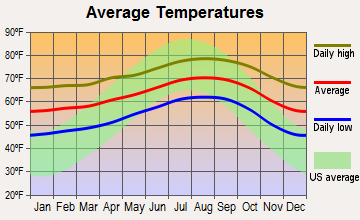
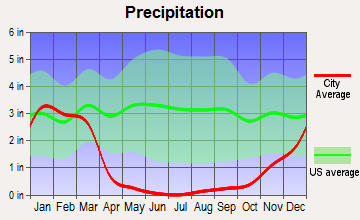
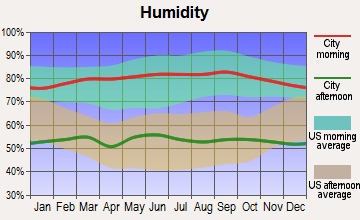
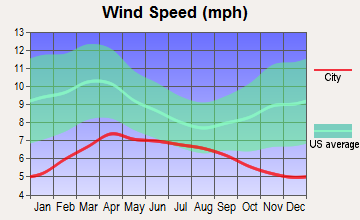
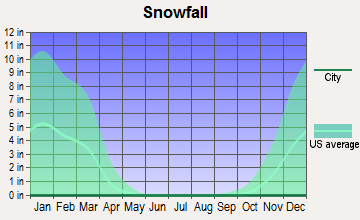
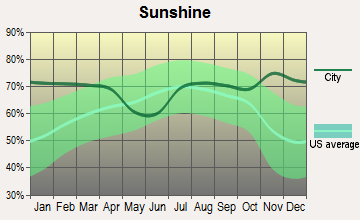
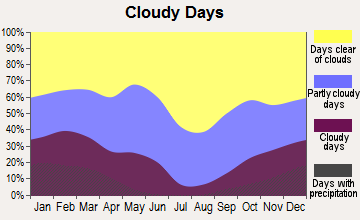
Average climate in Rolling Hills Estates, California
Based on data reported by over 4,000 weather stations
|
|

(lower is better)
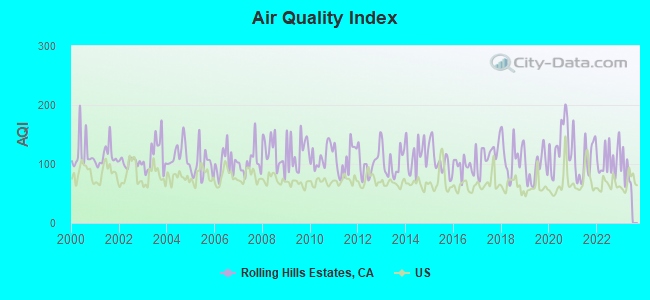
Air Quality Index (AQI) level in 2022 was 107. This is significantly worse than average.
| City: | 107 |
| U.S.: | 73 |
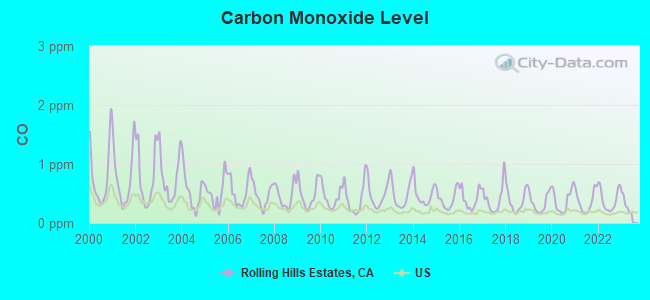
Carbon Monoxide (CO) [ppm] level in 2022 was 0.392. This is significantly worse than average. Closest monitor was 6.6 miles away from the city center.
| City: | 0.392 |
| U.S.: | 0.251 |
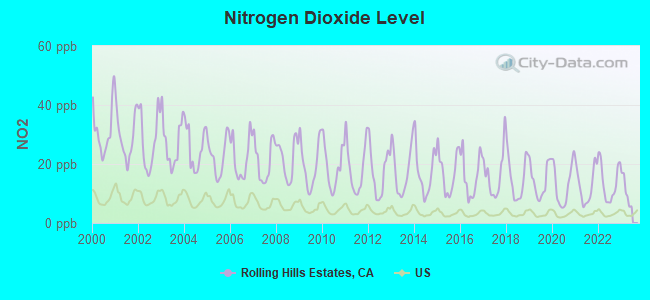
Nitrogen Dioxide (NO2) [ppb] level in 2022 was 13.7. This is significantly worse than average. Closest monitor was 4.5 miles away from the city center.
| City: | 13.7 |
| U.S.: | 5.1 |
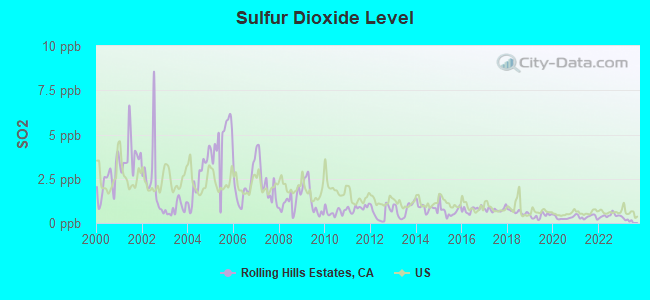
Sulfur Dioxide (SO2) [ppb] level in 2022 was 0.424. This is significantly better than average. Closest monitor was 4.5 miles away from the city center.
| City: | 0.424 |
| U.S.: | 1.515 |
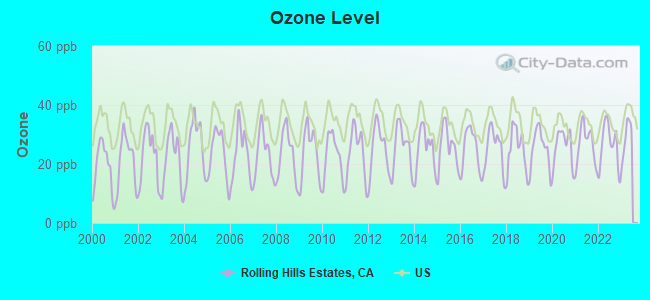
Ozone [ppb] level in 2022 was 26.2. This is better than average. Closest monitor was 6.6 miles away from the city center.
| City: | 26.2 |
| U.S.: | 33.3 |
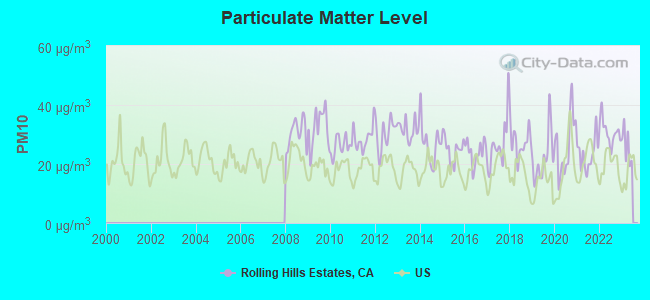
Particulate Matter (PM10) [µg/m3] level in 2022 was 30.9. This is significantly worse than average. Closest monitor was 8.3 miles away from the city center.
| City: | 30.9 |
| U.S.: | 19.2 |
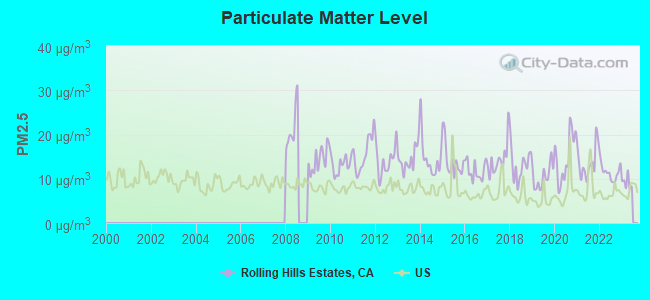
Particulate Matter (PM2.5) [µg/m3] level in 2022 was 11.5. This is significantly worse than average. Closest monitor was 10.5 miles away from the city center.
| City: | 11.5 |
| U.S.: | 8.1 |
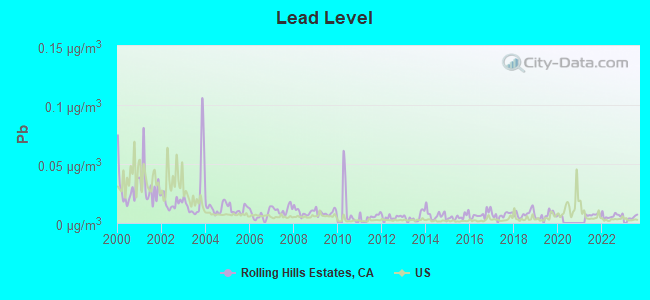
Lead (Pb) [µg/m3] level in 2022 was 0.00604. This is significantly better than average. Closest monitor was 4.5 miles away from the city center.
| City: | 0.00604 |
| U.S.: | 0.00931 |
Earthquake activity:
Rolling Hills Estates-area historical earthquake activity is significantly above California state average. It is 6631% greater than the overall U.S. average.On 7/21/1952 at 11:52:14, a magnitude 7.7 (7.7 UK, Class: Major, Intensity: VIII - XII) earthquake occurred 92.3 miles away from Rolling Hills Estates center, causing $50,000,000 total damage
On 6/28/1992 at 11:57:34, a magnitude 7.6 (6.2 MB, 7.6 MS, 7.3 MW, Depth: 0.7 mi) earthquake occurred 108.7 miles away from the city center, causing 3 deaths (1 shaking deaths, 2 other deaths) and 400 injuries, causing $100,000,000 total damage and $40,000,000 insured losses
On 10/16/1999 at 09:46:44, a magnitude 7.4 (6.3 MB, 7.4 MS, 7.2 MW, 7.3 ML) earthquake occurred 121.6 miles away from Rolling Hills Estates center
On 11/4/1927 at 13:51:53, a magnitude 7.5 (7.5 UK) earthquake occurred 171.7 miles away from the city center
On 1/17/1994 at 12:30:55, a magnitude 6.8 (6.4 MB, 6.8 MS, 6.7 MW, Depth: 11.4 mi, Class: Strong, Intensity: VII - IX) earthquake occurred 29.2 miles away from Rolling Hills Estates center, causing 60 deaths (60 shaking deaths) and 7000 injuries
On 4/21/1918 at 22:32:30, a magnitude 6.8 (6.8 UK) earthquake occurred 53.0 miles away from the city center
Magnitude types: body-wave magnitude (MB), local magnitude (ML), surface-wave magnitude (MS), moment magnitude (MW)
Natural disasters:
The number of natural disasters in Los Angeles County (57) is a lot greater than the US average (15).Major Disasters (Presidential) Declared: 27
Emergencies Declared: 3
Causes of natural disasters: Fires: 37, Floods: 16, Storms: 9, Winter Storms: 6, Landslides: 5, Mudslides: 5, Earthquakes: 3, Freeze: 1, Heavy Rain: 1, Hurricane: 1, Snow: 1, Tornado: 1, Wind: 1, Other: 1 (Note: some incidents may be assigned to more than one category).
Hospitals and medical centers near Rolling Hills Estates:
- CANTERBURY,THE (Nursing Home, about 2 miles away; RANCHO PALOS VERDES, CA)
- PECK HOUSE (Hospital, about 2 miles away; TORRANCE, CA)
- TRINITYCARE HOSPICE (Hospital, about 3 miles away; TORRANCE, CA)
- JUST RIGHT HELP, INC (Home Health Center, about 3 miles away; TORRANCE, CA)
- SKYPARK DIALYSIS (Dialysis Facility, about 3 miles away; TORRANCE, CA)
- TORRANCE MEMORIAL HOME HEALTH (Home Health Center, about 3 miles away; TORRANCE, CA)
- TORRANCE MEMORIAL MEDICAL CENTER Acute Care Hospitals (about 3 miles away; TORRANCE, CA)
Amtrak stations near Rolling Hills Estates:
- 6 miles: SAN PEDRO (CATALINA TERMINAL, BERTH 95) - Bus Station . Services: partially wheelchair accessible, enclosed waiting area, public restrooms, public payphones, snack bar, paid short-term parking, paid long-term parking, call for taxi service.
- 10 miles: LONG BEACH (601 N. LONG BEACH BLVD.) - Bus Station . Services: fully wheelchair accessible, public restrooms, public payphones, full-service food facilities, paid short-term parking, paid long-term parking, call for taxi service, public transit connection.
Colleges/universities with over 2000 students nearest to Rolling Hills Estates:
- Los Angeles Harbor College (about 5 miles; Wilmington, CA; Full-time enrollment: 5,285)
- El Camino Community College District (about 8 miles; Torrance, CA; FT enrollment: 13,952)
- Wyotech-Long Beach (about 9 miles; Long Beach, CA; FT enrollment: 2,453)
- California State University-Dominguez Hills (about 9 miles; Carson, CA; FT enrollment: 9,862)
- El Camino College-Compton Center (about 12 miles; Compton, CA; FT enrollment: 4,506)
- Los Angeles Southwest College (about 12 miles; Los Angeles, CA; FT enrollment: 3,247)
- Long Beach City College (about 14 miles; Long Beach, CA; FT enrollment: 15,602)
Public high school in Rolling Hills Estates:
- PALOS VERDES PENINSULA HIGH (Students: 1,736, Location: 27118 SILVER SPUR RD., Grades: 9-12)
Public elementary/middle schools in Rolling Hills Estates:
- DAPPLEGRAY ELEMENTARY (Students: 470, Location: 3011 PALOS VERDES DR. N., Grades: KG-5)
- RANCHO VISTA ELEMENTARY (Students: 296, Location: 4323 PALOS VERDES DR. N., Grades: KG-5)
Private elementary/middle schools in Rolling Hills Estates:
- ROLLING HILLS COUNTRY DAY SCHOOL (Students: 370, Location: 26444 CRENSHAW BLVD, Grades: KG-8)
- PENINSULA HERITAGE SCHOOL (Students: 109, Location: 26944 ROLLING HILLS RD, Grades: KG-5)
- ROLLING HILLS MONTESSORI (Students: 105, Location: 26825 ROLLING HILLS RD, Grades: PK-1)
Points of interest:
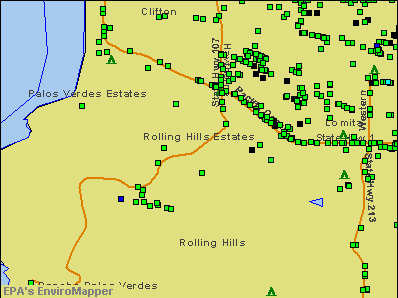
Notable locations in Rolling Hills Estates: Rolling Hills Country Club (A), Jack Kramer Tennis Club (B), Los Angeles County Fire Department Station 106 (C). Display/hide their locations on the map
Shopping Centers: Peninsula Shopping Center (1), Town and Country Shopping Center (2), The Shops at Palos Verdes Shopping Center (3). Display/hide their locations on the map
Reservoir: Palos Verdes Reservoir (A). Display/hide its location on the map
Parks in Rolling Hills Estates include: Dapplegray Park (1), Ernie J Howlett Park (2), George F Canyon Open Space (3), Nansen Field (4), Rockbluff Park (5), Silver Spur Park (6), High Ridge Park (7). Display/hide their locations on the map
Birthplace of: Whitney Engen - Soccer player.
| This city: | 2.7 people |
| California: | 2.9 people |
| This city: | 80.1% |
| Whole state: | 68.7% |
| This city: | 2.3% |
| Whole state: | 7.2% |
Likely homosexual households (counted as self-reported same-sex unmarried-partner households)
- Lesbian couples: 0.4% of all households
- Gay men: 0.3% of all households
6 people in other noninstitutional group quarters in 2000
Banks with branches in Rolling Hills Estates (2011 data):
- Bank of America, National Association: Peninsula Center Branch at 27411 South Hawthorne Boulevard, branch established on 1960/11/14. Info updated 2009/11/18: Bank assets: $1,451,969.3 mil, Deposits: $1,077,176.8 mil, headquarters in Charlotte, NC, positive income, 5782 total offices, Holding Company: Bank Of America Corporation
- Union Bank, National Association: Palos Verdes Center Branch at 507 Silver Spur Road, branch established on 1973/12/07. Info updated 2011/09/01: Bank assets: $88,967.5 mil, Deposits: $65,286.4 mil, headquarters in San Francisco, CA, positive income, Commercial Lending Specialization, 403 total offices, Holding Company: Mitsubishi Ufj Financial Group, Inc.
- Malaga Bank F.S.B.: Peninsula Ctr Branch at 27450 Hawthoene Boulevard, branch established on 1993/10/02. Info updated 2011/07/21: Bank assets: $826.4 mil, Deposits: $550.3 mil, headquarters in Palos Verdes Peninsula, CA, positive income, Commercial Lending Specialization, 4 total offices
- Wells Fargo Bank, National Association: Palos Verdes Branch at 27440 Hawthorne Boulevard, branch established on 1960/10/10. Info updated 2011/04/05: Bank assets: $1,161,490.0 mil, Deposits: $905,653.0 mil, headquarters in Sioux Falls, SD, positive income, 6395 total offices, Holding Company: Wells Fargo & Company
- Citibank, National Association: Palos Verdes Branch at 935 Silver Spur Road, branch established on 1987/06/30. Info updated 2012/01/10: Bank assets: $1,288,658.0 mil, Deposits: $882,541.0 mil, headquarters in Sioux Falls, SD, positive income, International Specialization, 1048 total offices, Holding Company: Citigroup Inc.
- HSBC Bank USA, National Association: Rolling Hills Estates at 449 S Silver Spur Rd, Suite 100, branch established on 2011/06/06. Info updated 2010/11/30: Bank assets: $206,009.7 mil, Deposits: $149,026.8 mil, headquarters in Mc Lean, VA, positive income, 474 total offices, Holding Company: Hsbc Holdings Plc
- Opus Bank: Peninsula Branch at 395 Silver Spur Road, branch established on 1982/07/09. Info updated 2011/11/08: Bank assets: $2,404.2 mil, Deposits: $1,831.2 mil, headquarters in Irvine, CA, negative income in the last year, Commercial Lending Specialization, 38 total offices
For population 15 years and over in Rolling Hills Estates:
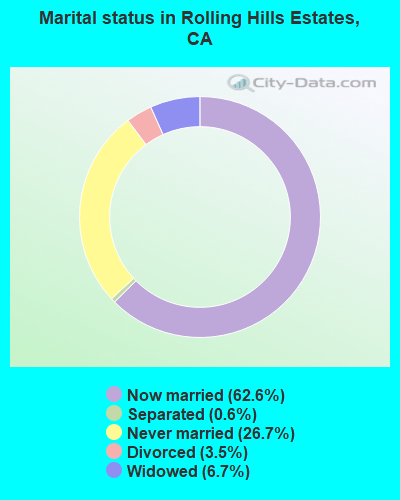
- Never married: 26.7%
- Now married: 62.6%
- Separated: 0.6%
- Widowed: 6.7%
- Divorced: 3.5%
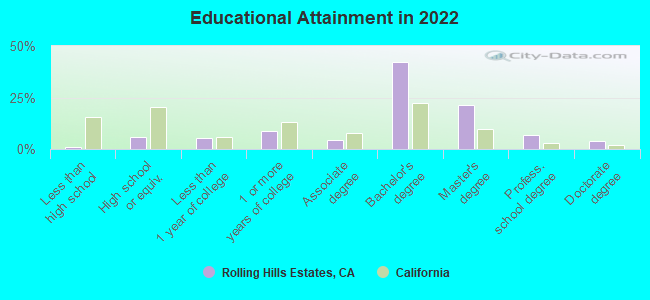
For population 25 years and over in Rolling Hills Estates:
- High school or higher: 99.1%
- Bachelor's degree or higher: 73.7%
- Graduate or professional degree: 31.3%
- Unemployed: 2.1%
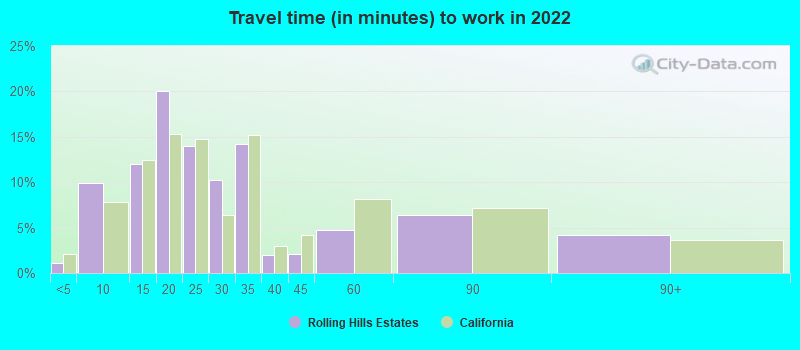
- Mean travel time to work (commute): 21.8 minutes
| Here: | 7.8 |
| California average: | 15.5 |


Graphs represent county-level data. Detailed 2008 Election Results
Political contributions by individuals in Rolling Hills Estates, CA
Religion statistics for Rolling Hills Estates, CA (based on Los Angeles County data)


| Religion | Adherents | Congregations |
|---|---|---|
| Catholic | 3,542,994 | 275 |
| Evangelical Protestant | 814,611 | 3,249 |
| Other | 451,594 | 1,023 |
| Mainline Protestant | 229,056 | 860 |
| Black Protestant | 112,338 | 290 |
| Orthodox | 63,517 | 76 |
| None | 4,604,495 | - |
Food Environment Statistics:
| Los Angeles County: | 2.12 / 10,000 pop. |
| State: | 2.14 / 10,000 pop. |
| Los Angeles County: | 0.03 / 10,000 pop. |
| California: | 0.04 / 10,000 pop. |
| Los Angeles County: | 0.58 / 10,000 pop. |
| California: | 0.62 / 10,000 pop. |
| This county: | 1.23 / 10,000 pop. |
| California: | 1.49 / 10,000 pop. |
| This county: | 7.15 / 10,000 pop. |
| California: | 7.42 / 10,000 pop. |
| Los Angeles County: | 7.5% |
| California: | 7.3% |
| Los Angeles County: | 20.4% |
| California: | 21.3% |
| Los Angeles County: | 18.6% |
| State: | 17.9% |
Health and Nutrition:
| Rolling Hills Estates: | 56.6% |
| California: | 49.4% |
| This city: | 53.6% |
| State: | 48.0% |
| Here: | 27.8 |
| State: | 28.1 |
| This city: | 16.8% |
| California: | 20.2% |
| Here: | 13.3% |
| California: | 11.2% |
| Rolling Hills Estates: | 6.9 |
| State: | 6.8 |
| Rolling Hills Estates: | 33.7% |
| California: | 31.5% |
| Rolling Hills Estates: | 59.8% |
| California: | 56.4% |
| Rolling Hills Estates: | 78.5% |
| California: | 80.9% |
More about Health and Nutrition of Rolling Hills Estates, CA Residents
| Local government employment and payroll (March 2022) | |||||
| Function | Full-time employees | Monthly full-time payroll | Average yearly full-time wage | Part-time employees | Monthly part-time payroll |
|---|---|---|---|---|---|
| Other Government Administration | 12 | $135,897 | $135,897 | 1 | $441 |
| Parks and Recreation | 5 | $30,925 | $74,220 | 3 | $4,046 |
| Financial Administration | 3 | $31,567 | $126,268 | 0 | $0 |
| Totals for Government | 20 | $198,389 | $119,033 | 4 | $4,486 |
Rolling Hills Estates government finances - Expenditure in 2017 (per resident):
- Construction - Regular Highways: $292,000 ($36.42)
- Current Operations - Central Staff Services: $5,133,000 ($640.18)
Regular Highways: $2,376,000 ($296.33)
Police Protection: $2,012,000 ($250.94)
Parks and Recreation: $1,692,000 ($211.03)
Financial Administration: $541,000 ($67.47)
Protective Inspection and Regulation - Other: $93,000 ($11.60)
General - Other: $80,000 ($9.98)
Solid Waste Management: $27,000 ($3.37)
Health - Other: $25,000 ($3.12)
- General - Interest on Debt: $40,000 ($4.99)
- Intergovernmental to Local - Other - Police Protection: $4,015,000 ($500.75)
Other - Regular Highways: $837,000 ($104.39)
Other - General - Other: $413,000 ($51.51)
Other - Transit Utilities: $265,000 ($33.05)
- Other Capital Outlay - Central Staff Services: $9,000 ($1.12)
Rolling Hills Estates government finances - Revenue in 2017 (per resident):
- Charges - Other: $249,000 ($31.06)
Parks and Recreation: $217,000 ($27.06)
Solid Waste Management: $201,000 ($25.07)
- Federal Intergovernmental - Other: $142,000 ($17.71)
Housing and Community Development: $46,000 ($5.74)
- Miscellaneous - Fines and Forfeits: $86,000 ($10.73)
Rents: $83,000 ($10.35)
General Revenue - Other: $44,000 ($5.49)
Interest Earnings: $10,000 ($1.25)
Special Assessments: $2,000 ($0.25)
- State Intergovernmental - Other: $611,000 ($76.20)
Highways: $158,000 ($19.71)
- Tax - Other License: $3,062,000 ($381.89)
Property: $2,802,000 ($349.46)
General Sales and Gross Receipts: $2,179,000 ($271.76)
Public Utilities Sales: $571,000 ($71.21)
Occupation and Business License - Other: $238,000 ($29.68)
Documentary and Stock Transfer: $89,000 ($11.10)
Rolling Hills Estates government finances - Debt in 2017 (per resident):
- Long Term Debt - Beginning Outstanding - Unspecified Public Purpose: $1,150,000 ($143.43)
Outstanding Unspecified Public Purpose: $953,000 ($118.86)
Retired Unspecified Public Purpose: $197,000 ($24.57)
Rolling Hills Estates government finances - Cash and Securities in 2017 (per resident):
- Bond Funds - Cash and Securities: $1,385,000 ($172.74)
- Other Funds - Cash and Securities: $2,183,000 ($272.26)
2.98% of this county's 2021 resident taxpayers lived in other counties in 2020 ($81,235 average adjusted gross income)
| Here: | 2.98% |
| California average: | 5.19% |
0.01% of residents moved from foreign countries ($155 average AGI)
Los Angeles County: 0.01% California average: 0.03%
Top counties from which taxpayers relocated into this county between 2020 and 2021:
| from Orange County, CA | |
| from San Bernardino County, CA | |
| from Riverside County, CA |
4.68% of this county's 2020 resident taxpayers moved to other counties in 2021 ($97,324 average adjusted gross income)
| Here: | 4.68% |
| California average: | 6.14% |
0.01% of residents moved to foreign countries ($196 average AGI)
Los Angeles County: 0.01% California average: 0.02%
Top counties to which taxpayers relocated from this county between 2020 and 2021:
| to Orange County, CA | |
| to San Bernardino County, CA | |
| to Riverside County, CA |
| Businesses in Rolling Hills Estates, CA | ||||
| Name | Count | Name | Count | |
|---|---|---|---|---|
| Blockbuster | 1 | Safeway | 1 | |
| Chico's | 1 | Starbucks | 2 | |
| Coldwater Creek | 1 | Taco Bell | 1 | |
| FedEx | 5 | Talbots | 1 | |
| J.Crew | 1 | UPS | 3 | |
| Jamba Juice | 1 | Vons | 1 | |
Strongest AM radio stations in Rolling Hills Estates:
- KNX (1070 AM; 50 kW; LOS ANGELES, CA; Owner: INFINITY BROADCASTING OPERATIONS, INC.)
- KFI (640 AM; 50 kW; LOS ANGELES, CA; Owner: CAPSTAR TX LIMITED PARTNERSHIP)
- KFWB (980 AM; 50 kW; LOS ANGELES, CA; Owner: INFINITY BROADCASTING OPERATIONS, INC.)
- KSPN (710 AM; 50 kW; LOS ANGELES, CA; Owner: KABC-AM RADIO, INC.)
- KLAC (570 AM; 50 kW; LOS ANGELES, CA; Owner: AMFM RADIO LICENSES, L.L.C.)
- KBLA (1580 AM; 50 kW; SANTA MONICA, CA)
- KTNQ (1020 AM; 50 kW; LOS ANGELES, CA; Owner: KTNQ-AM LICENSE CORP.)
- KMPC (1540 AM; 50 kW; LOS ANGELES, CA; Owner: ROSE CITY RADIO CORPORATION)
- KXTA (1150 AM; 50 kW; LOS ANGELES, CA; Owner: CITICASTERS LICENSES, L.P.)
- KDIS (1110 AM; 50 kW; PASADENA, CA; Owner: ABC,INC.)
- KXMX (1190 AM; 25 kW; ANAHEIM, CA; Owner: NEW INSPIRATION BROADCASTING COMPANY)
- KRLA (870 AM; 20 kW; GLENDALE, CA; Owner: NEW INSPIRATION BROADCASTING COMPANY)
- KPLS (830 AM; 50 kW; ORANGE, CA; Owner: CRN LICENSES, LLC)
Strongest FM radio stations in Rolling Hills Estates:
- KZAB (93.5 FM; REDONDO BEACH, CA; Owner: KZAB LICENSING, INC.)
- KKBT (100.3 FM; LOS ANGELES, CA; Owner: RADIO ONE LICENSES, LLC)
- KZLA-FM (93.9 FM; LOS ANGELES, CA; Owner: EMMIS RADIO LICENSE CORPORATION)
- KPWR (105.9 FM; LOS ANGELES, CA; Owner: EMMIS RADIO LICENSE CORPORATION)
- KLSX (97.1 FM; LOS ANGELES, CA; Owner: INFINITY BROADCASTING OPERATIONS, INC.)
- KRTH-FM (101.1 FM; LOS ANGELES, CA; Owner: INFINITY BROADCASTING OPERATIONS, INC.)
- KUSC (91.5 FM; LOS ANGELES, CA; Owner: UNIVERSITY OF SOUTHERN CALIFORNIA)
- KKLA-FM (99.5 FM; LOS ANGELES, CA; Owner: NEW INSPIRATION BROADCASTING CO., INC.)
- KCBS-FM (93.1 FM; LOS ANGELES, CA; Owner: INFINITY BROADCASTING OPERATIONS, INC.)
- KSCA (101.9 FM; GLENDALE, CA; Owner: HBC LICENSE CORPORATION)
- KLOS (95.5 FM; LOS ANGELES, CA; Owner: KLOS-FM RADIO, INC.)
- K212FA (90.3 FM; TEMPLE CITY, CA; Owner: EDUCATIONAL MEDIA FOUNDATION)
- KOST (103.5 FM; LOS ANGELES, CA; Owner: CAPSTAR TX LIMITED PARTNERSHIP)
- KLVE (107.5 FM; LOS ANGELES, CA; Owner: KLVE-FM LICENSE CORP.)
- KIIS-FM (102.7 FM; LOS ANGELES, CA; Owner: CITICASTERS LICENSES, L.P.)
- KPCC (89.3 FM; PASADENA, CA; Owner: PASADENA AREA COMMUNITY COLLEGE DISTRICT)
- KHHT (92.3 FM; LOS ANGELES, CA; Owner: AMFM RADIO LICENSES, L.L.C.)
- KBIG-FM (104.3 FM; LOS ANGELES, CA; Owner: AMFM RADIO LICENSES, L.L.C.)
- KMZT-FM (105.1 FM; LOS ANGELES, CA; Owner: MOUNT WILSON FM BROADCASTERS, INC.)
- KPFK (90.7 FM; LOS ANGELES, CA; Owner: PACIFICA FOUNDATION, INC)
TV broadcast stations around Rolling Hills Estates:
- KTRO-LP (Channel 50; LANCASTER, CA; Owner: ROBERT D. ADELMAN)
- KCBS-TV (Channel 2; LOS ANGELES, CA; Owner: CBS BROADCASTING INC.)
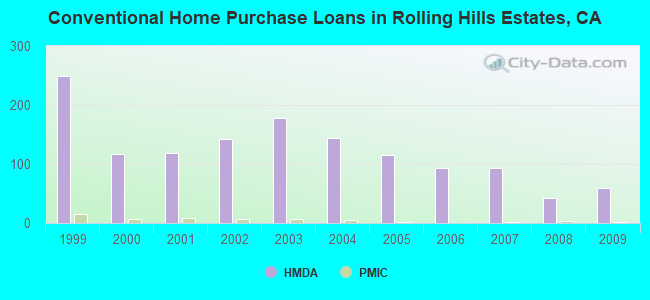
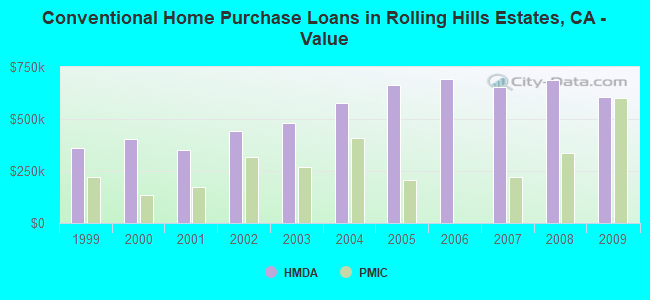
| Home Mortgage Disclosure Act Aggregated Statistics For Year 2009 (Based on 1 full and 4 partial tracts) | ||||||||||
| A) FHA, FSA/RHS & VA Home Purchase Loans | B) Conventional Home Purchase Loans | C) Refinancings | D) Home Improvement Loans | F) Non-occupant Loans on < 5 Family Dwellings (A B C & D) | ||||||
|---|---|---|---|---|---|---|---|---|---|---|
| Number | Average Value | Number | Average Value | Number | Average Value | Number | Average Value | Number | Average Value | |
| LOANS ORIGINATED | 7 | $432,197 | 59 | $604,975 | 303 | $443,533 | 16 | $285,002 | 11 | $408,574 |
| APPLICATIONS APPROVED, NOT ACCEPTED | 0 | $0 | 5 | $652,462 | 29 | $579,016 | 3 | $338,323 | 0 | $0 |
| APPLICATIONS DENIED | 2 | $513,835 | 11 | $686,066 | 66 | $500,910 | 3 | $431,747 | 4 | $375,745 |
| APPLICATIONS WITHDRAWN | 1 | $177,150 | 13 | $620,166 | 43 | $503,341 | 2 | $228,215 | 4 | $458,008 |
| FILES CLOSED FOR INCOMPLETENESS | 0 | $0 | 2 | $635,130 | 11 | $501,899 | 0 | $0 | 1 | $174,310 |
Detailed HMDA statistics for the following Tracts: 6702.01 , 6702.02, 6704.03, 6704.05, 6707.02
| Private Mortgage Insurance Companies Aggregated Statistics For Year 2009 (Based on 3 partial tracts) | ||
| A) Conventional Home Purchase Loans | ||
|---|---|---|
| Number | Average Value | |
| LOANS ORIGINATED | 1 | $603,240 |
| APPLICATIONS APPROVED, NOT ACCEPTED | 1 | $528,320 |
| APPLICATIONS DENIED | 0 | $0 |
| APPLICATIONS WITHDRAWN | 1 | $471,210 |
| FILES CLOSED FOR INCOMPLETENESS | 0 | $0 |
Detailed PMIC statistics for the following Tracts: 6702.01 , 6702.02, 6704.03, 6704.05, 6707.02

- 80.6%Utility gas
- 16.8%Electricity
- 1.2%Bottled, tank, or LP gas
- 0.8%Solar energy
- 0.4%No fuel used
- 0.2%Fuel oil, kerosene, etc.
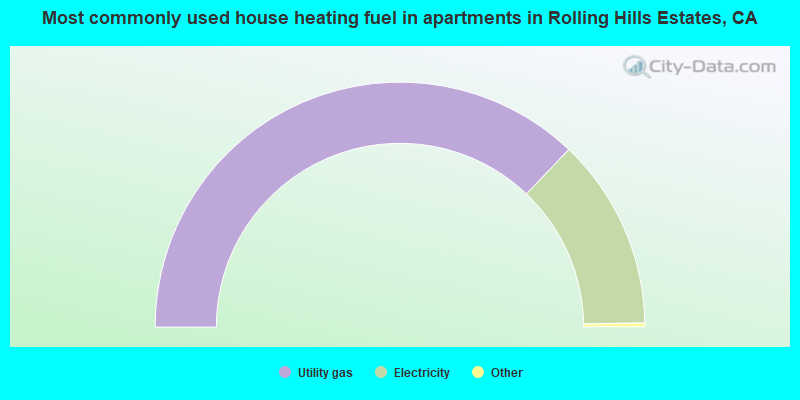
- 74.6%Utility gas
- 25.4%Electricity
Rolling Hills Estates compared to California state average:
- Median household income above state average.
- Median house value significantly above state average.
- Unemployed percentage significantly below state average.
- Black race population percentage below state average.
- Hispanic race population percentage significantly below state average.
- Median age significantly above state average.
- Renting percentage significantly below state average.
- Length of stay since moving in significantly above state average.
- Number of rooms per house above state average.
- Percentage of population with a bachelor's degree or higher significantly above state average.
Rolling Hills Estates on our top lists:
- #18 on the list of "Top 101 cities with the most residents born in Japan (population 500+)"
- #36 on the list of "Top 101 cities with the most residents born in Korea (population 500+)"
- #40 on the list of "Top 101 cities with the most residents born in Lebanon (population 500+)"
- #45 on the list of "Top 101 cities with the most residents born in Nigeria (population 500+)"
- #51 on the list of "Top 100 cities with highest median house value (pop. 5,000+)"
- #57 on the list of "Top 101 cities with the most residents born in Eastern Asia (population 500+)"
- #68 on the list of "Top 101 cities with the most residents born in Other Southern Europe (population 500+)"
- #69 on the list of "Top 101 cities with largest percentage of males in occupations: architecture and engineering occupations (population 5,000+)"
- #72 on the list of "Top 101 cities with largest percentage of females in occupations: architecture and engineering occupations (population 5,000+)"
- #81 on the list of "Top 101 cities with largest percentage of females in industries: real estate and rental and leasing (population 5,000+)"
- #82 on the list of "Top 101 cities with largest percentage of males in occupations: management occupations (population 5,000+)"
- #87 on the list of "Top 100 cities with highest median household income (pop. 5,000+)"
- #47 (90274) on the list of "Top 101 zip codes with the largest percentage of taxpayers reporting taxable interest in 2012 (pop 5,000+)"
- #60 (90274) on the list of "Top 101 zip codes with the highest 2012 average Adjusted Gross Income (AGI) for individuals (pop 5,000+)"
- #68 (90274) on the list of "Top 101 zip codes with the largest percentage of taxpayers using charity contributions deductions in 2012 (pop 5,000+)"
- #76 (90274) on the list of "Top 101 zip codes with the largest percentage of taxpayers reporting net capital gain/loss in 2012 (pop 5,000+)"
- #81 (90274) on the list of "Top 101 zip codes with the highest 2012 average reported profit/loss from business (pop 5,000+)"
- #92 (90274) on the list of "Top 101 zip codes with the highest average reported salary/wage in 2012 (pop 5,000+)"
- #1 on the list of "Top 101 counties with the most Evangelical Protestant congregations"
- #1 on the list of "Top 101 counties with the most Mainline Protestant congregations"
- #1 on the list of "Top 101 counties with the most Orthodox adherents"
- #1 on the list of "Top 101 counties with the highest ground withdrawal of fresh water for public supply (pop. 50,000+)"
- #1 on the list of "Top 101 counties with the most Catholic adherents (pop. 50,000+)"

|
|
Total of 243 patent applications in 2008-2024.