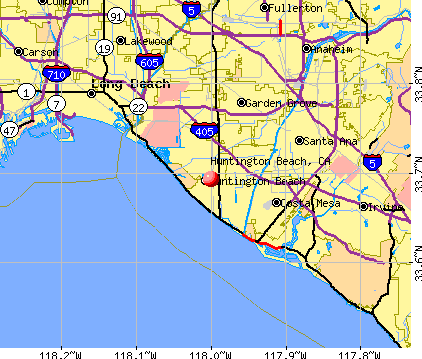
Huntington Beach, California
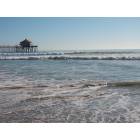
Huntington Beach: Huntington Beach
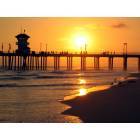
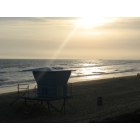
Huntington Beach: Huntington Beach at sunset
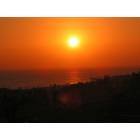
Huntington Beach: Californian Sunset
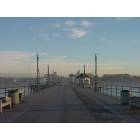
Huntington Beach: The other end of the pier: Ruby's
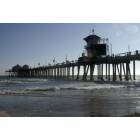
Huntington Beach: The Huntington Beach Pier.
Huntington Beach: The Real HB
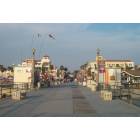
Huntington Beach: huntington beach pier
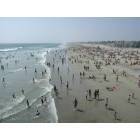
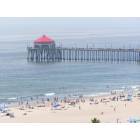
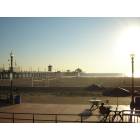
Huntington Beach: View of Huntington Beach from the Pier
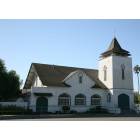
Huntington Beach: 100 year old church at Gothard and Warner
Huntington Beach: Huntington Beach Pier
Huntington Beach: Sunset near Bolsa Chica
- see
32
more - add
your
Submit your own pictures of this city and show them to the world
- OSM Map
- General Map
- Google Map
- MSN Map
Population change since 2000: +2.5%
 |
| Males: 95,409 | |
| Females: 98,901 |
| Median resident age: | 44.0 years |
| California median age: | 37.9 years |
Zip codes: 90740, 92647, 92648, 92649.
Huntington Beach Zip Code Map| Huntington Beach: | $111,122 |
| CA: | $91,551 |
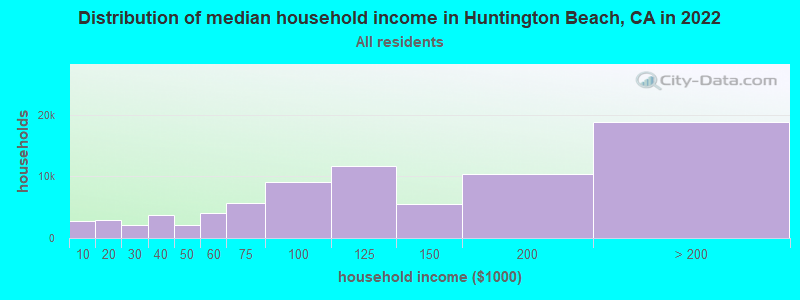
Estimated per capita income in 2022: $63,044 (it was $31,964 in 2000)
Huntington Beach city income, earnings, and wages data
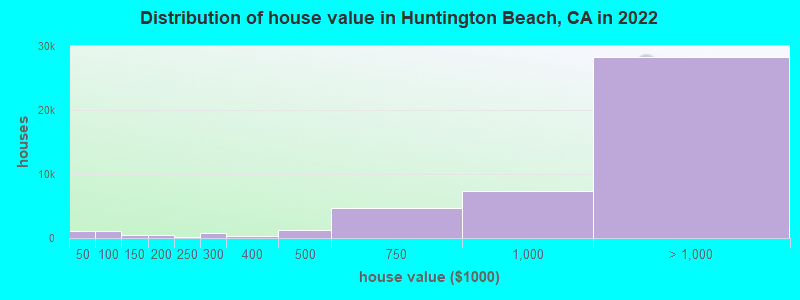
Estimated median house or condo value in 2022: over $1,000,000 (it was $292,000 in 2000)
| Huntington Beach: | over $1,000,000 |
| CA: | $715,900 |
Mean prices in 2022: all housing units: over $1,000,000; detached houses: over $1,000,000; townhouses or other attached units: over $1,000,000; in 2-unit structures: $697,292; in 3-to-4-unit structures: $907,899; in 5-or-more-unit structures: $682,013; mobile homes: $167,485
Median gross rent in 2022: $2,451.
Huntington Beach, CA residents, houses, and apartments details
(7.2% for White Non-Hispanic residents, 8.0% for Black residents, 8.7% for Hispanic or Latino residents, 17.9% for American Indian residents, 2.3% for Native Hawaiian and other Pacific Islander residents, 14.2% for other race residents, 5.0% for two or more races residents)
Detailed information about poverty and poor residents in Huntington Beach, CA


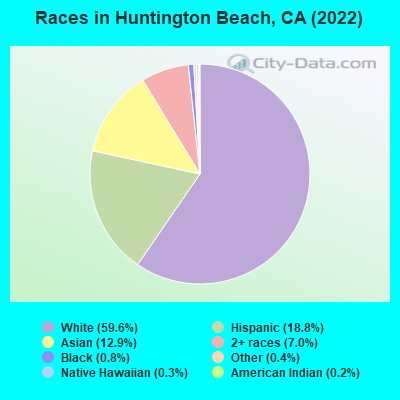
- 115,81759.6%White alone
- 36,44318.8%Hispanic
- 25,06712.9%Asian alone
- 13,5377.0%Two or more races
- 1,6400.8%Black alone
- 8430.4%Other race alone
- 6360.3%Native Hawaiian and Other
Pacific Islander alone - 3230.2%American Indian alone
According to our research of California and other state lists, there were 89 registered sex offenders living in Huntington Beach, California as of April 27, 2024.
The ratio of all residents to sex offenders in Huntington Beach is 2,254 to 1.
The ratio of registered sex offenders to all residents in this city is much lower than the state average.
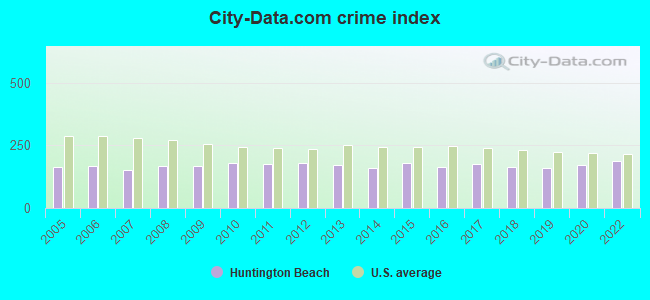
The City-Data.com crime index weighs serious crimes and violent crimes more heavily. Higher means more crime, U.S. average is 246.1. It adjusts for the number of visitors and daily workers commuting into cities.
- means the value is smaller than the state average.- means the value is about the same as the state average.
- means the value is bigger than the state average.
- means the value is much bigger than the state average.
Crime rate in Huntington Beach detailed stats: murders, rapes, robberies, assaults, burglaries, thefts, arson
Full-time law enforcement employees in 2021, including police officers: 289 (183 officers - 162 male; 21 female).
| Officers per 1,000 residents here: | 0.92 |
| California average: | 2.30 |
 Recent articles from our blog. Our writers, many of them Ph.D. graduates or candidates, create easy-to-read articles on a wide variety of topics.

 | OC Real Estate: Huntington Beach Condos on Leased Land (2 replies) |
| Advice on the Huntington Beach area (4 replies) |
| Need help deciding between San Clemete, Dana Point or Huntington Beach (34 replies) |
| Any bad parts of Huntington Beach I should avoid? (21 replies) |
| Relocating to Huntington beach from Midwest (32 replies) |
| Looking to potentially move to SoCal - sell me on OC (15 replies) |
Latest news from Huntington Beach, CA collected exclusively by city-data.com from local newspapers, TV, and radio stations
Huntington Beach, CA City Guides:
Ancestries: English (6.5%), German (5.6%), Irish (5.0%), American (4.9%), European (4.6%), Italian (4.4%).
Current Local Time: PST time zone
Elevation: 28 feet
Land area: 26.4 square miles.
Population density: 7,362 people per square mile (high).
32,685 residents are foreign born (7.9% Asia, 4.4% Latin America, 2.5% Europe).
| This city: | 16.7% |
| California: | 26.5% |
Median real estate property taxes paid for housing units with mortgages in 2022: $7,383 (0.6%)
Median real estate property taxes paid for housing units with no mortgage in 2022: $4,320 (0.4%)
Nearest city with pop. 200,000+: North Coast, CA (1.4 miles  , pop. 363,603).
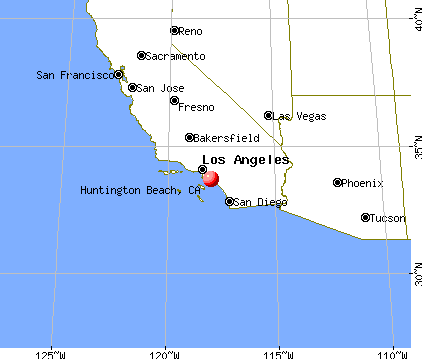
Nearest city with pop. 1,000,000+: Los Angeles, CA (34.7 miles , pop. 3,694,820).
Nearest cities:
), ), ), Latitude: 33.69 N, Longitude: 118.00 W
Daytime population change due to commuting: -12,285 (-6.3%)
Workers who live and work in this city: 39,998 (38.9%)
Area code: 714
Huntington Beach tourist attractions:
- Huntington Dog Beach, Huntington Beach, California - Huntington Beach, CA - Canine Cavorting Catered to at CA Beach
- Hyatt Regency Huntington Beach Resort and Spa
- Bolsa Chica Ecological Reserve
- Gage Bowl
- Shorebreak Hotel
- Best Friend Dog Park
- Huntington Central Park
- International Surfing Museum
- Hilton Waterfront Beach Resort
- Orange County Coast
- Shipley Nature Center
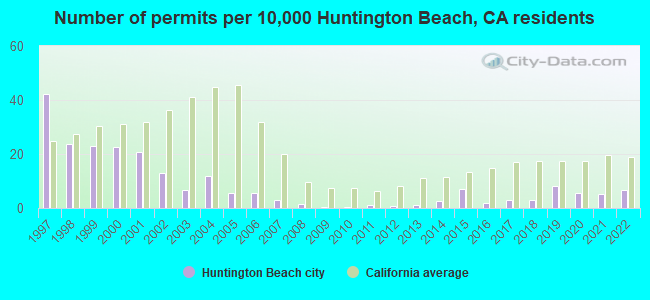
Single-family new house construction building permits:
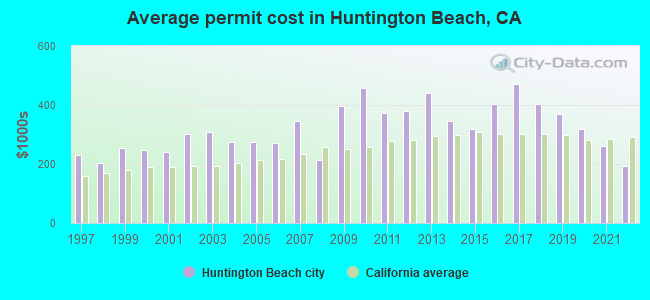
- 2022: 126 buildings, average cost: $194,400
- 2021: 100 buildings, average cost: $261,900
- 2020: 104 buildings, average cost: $318,600
- 2019: 154 buildings, average cost: $370,700
- 2018: 53 buildings, average cost: $403,000
- 2017: 53 buildings, average cost: $470,700
- 2016: 32 buildings, average cost: $403,000
- 2015: 131 buildings, average cost: $320,300
- 2014: 52 buildings, average cost: $346,500
- 2013: 24 buildings, average cost: $439,500
- 2012: 17 buildings, average cost: $379,700
- 2011: 24 buildings, average cost: $373,900
- 2010: 4 buildings, average cost: $456,900
- 2009: 9 buildings, average cost: $396,900
- 2008: 28 buildings, average cost: $212,200
- 2007: 53 buildings, average cost: $346,700
- 2006: 106 buildings, average cost: $271,200
- 2005: 104 buildings, average cost: $276,300
- 2004: 223 buildings, average cost: $274,000
- 2003: 124 buildings, average cost: $306,600
- 2002: 244 buildings, average cost: $301,700
- 2001: 394 buildings, average cost: $239,600
- 2000: 427 buildings, average cost: $249,200
- 1999: 432 buildings, average cost: $255,300
- 1998: 446 buildings, average cost: $202,800
- 1997: 797 buildings, average cost: $231,900
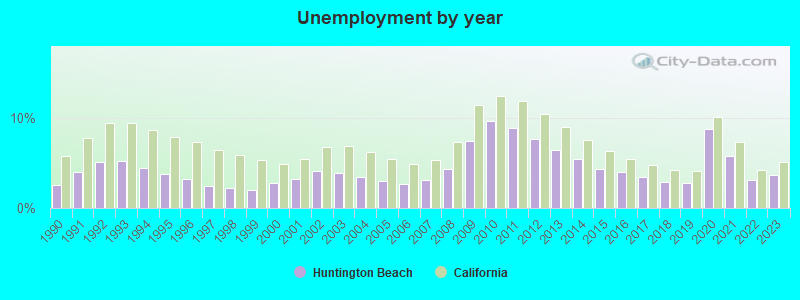
| Here: | 3.7% |
| California: | 5.1% |
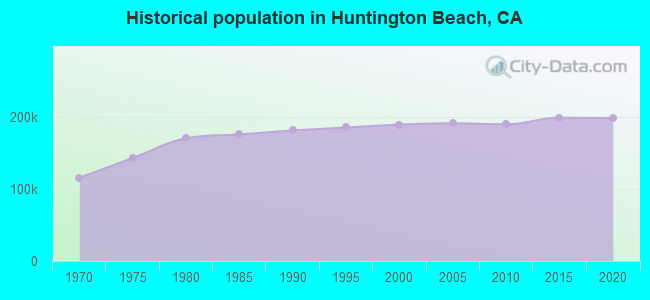
Population change in the 1990s: +6,165 (+3.4%).
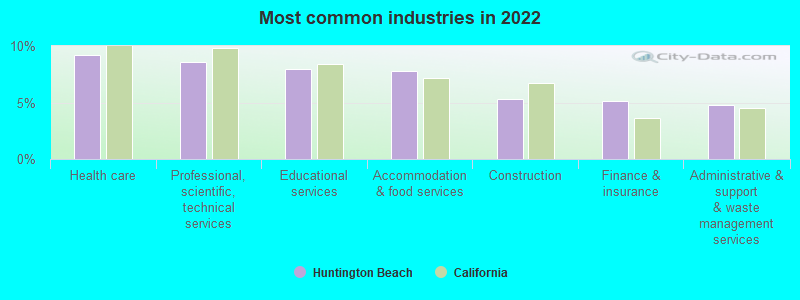
- Health care (9.2%)
- Professional, scientific, technical services (8.5%)
- Educational services (8.0%)
- Accommodation & food services (7.8%)
- Construction (5.3%)
- Finance & insurance (5.1%)
- Administrative & support & waste management services (4.8%)
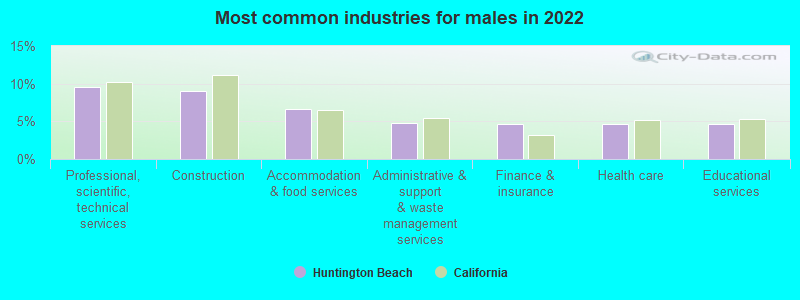
- Professional, scientific, technical services (9.5%)
- Construction (9.0%)
- Accommodation & food services (6.7%)
- Administrative & support & waste management services (4.8%)
- Finance & insurance (4.6%)
- Health care (4.6%)
- Educational services (4.6%)
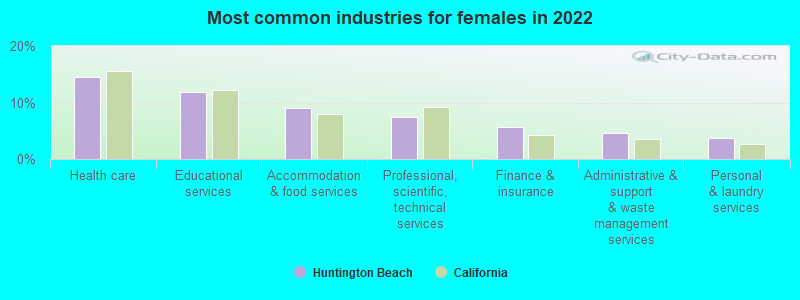
- Health care (14.5%)
- Educational services (11.8%)
- Accommodation & food services (9.0%)
- Professional, scientific, technical services (7.4%)
- Finance & insurance (5.7%)
- Administrative & support & waste management services (4.7%)
- Personal & laundry services (3.6%)
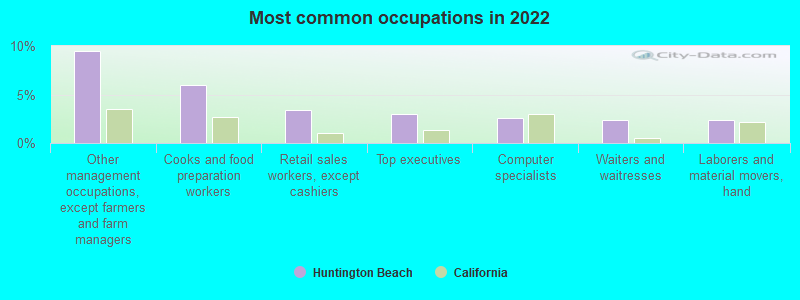
- Other management occupations, except farmers and farm managers (9.5%)
- Cooks and food preparation workers (5.9%)
- Retail sales workers, except cashiers (3.4%)
- Top executives (3.0%)
- Computer specialists (2.6%)
- Waiters and waitresses (2.4%)
- Laborers and material movers, hand (2.3%)
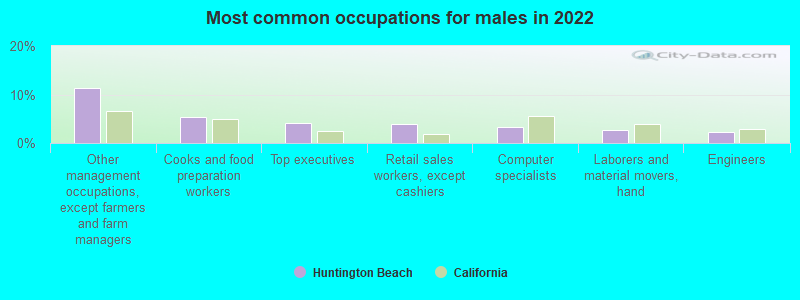
- Other management occupations, except farmers and farm managers (11.4%)
- Cooks and food preparation workers (5.3%)
- Top executives (4.1%)
- Retail sales workers, except cashiers (4.0%)
- Computer specialists (3.4%)
- Laborers and material movers, hand (2.6%)
- Engineers (2.3%)
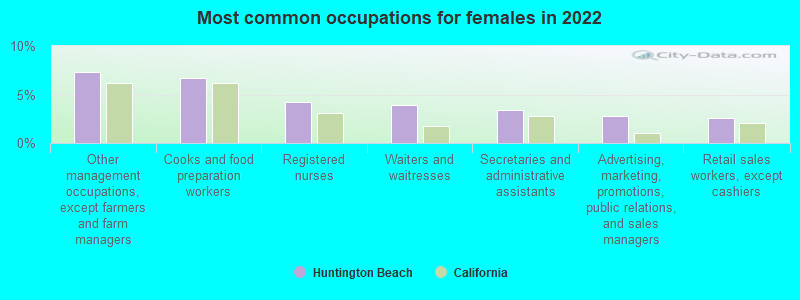
- Other management occupations, except farmers and farm managers (7.3%)
- Cooks and food preparation workers (6.7%)
- Registered nurses (4.2%)
- Waiters and waitresses (3.9%)
- Secretaries and administrative assistants (3.4%)
- Advertising, marketing, promotions, public relations, and sales managers (2.8%)
- Retail sales workers, except cashiers (2.6%)
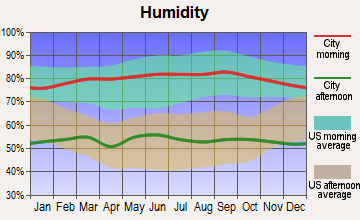
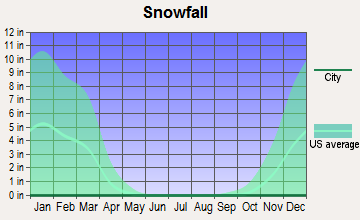
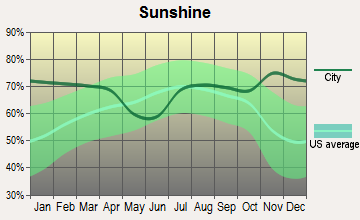
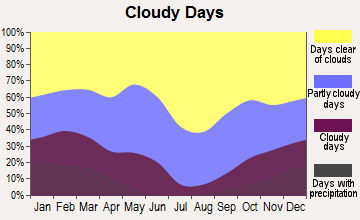
Average climate in Huntington Beach, California
Based on data reported by over 4,000 weather stations


|
|

(lower is better)
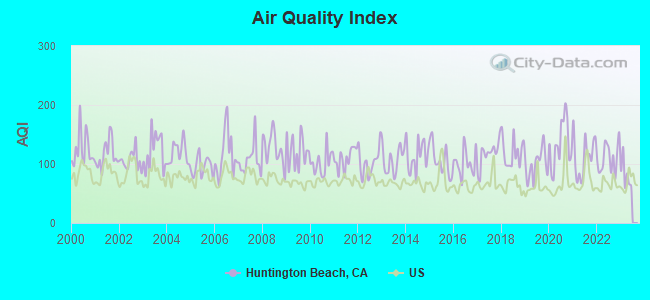
Air Quality Index (AQI) level in 2022 was 110. This is significantly worse than average.
| City: | 110 |
| U.S.: | 73 |
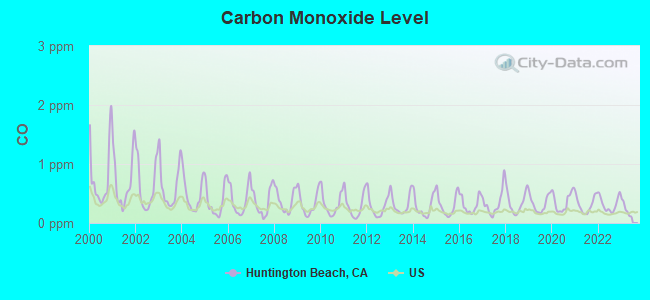
Carbon Monoxide (CO) [ppm] level in 2022 was 0.319. This is worse than average. Closest monitor was 4.5 miles away from the city center.
| City: | 0.319 |
| U.S.: | 0.251 |
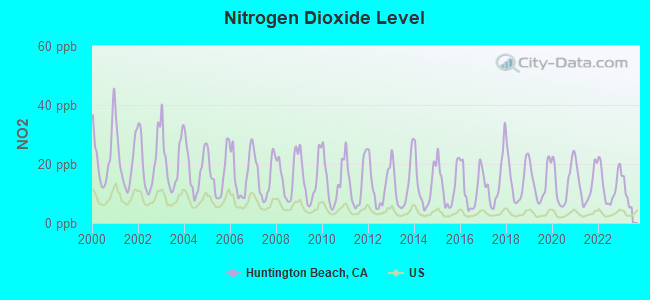
Nitrogen Dioxide (NO2) [ppb] level in 2022 was 12.9. This is significantly worse than average. Closest monitor was 4.5 miles away from the city center.
| City: | 12.9 |
| U.S.: | 5.1 |
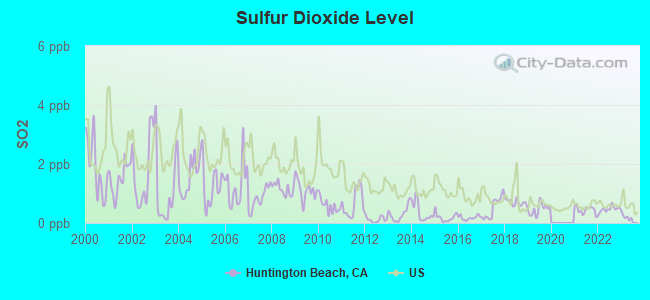
Sulfur Dioxide (SO2) [ppb] level in 2022 was 0.466. This is significantly better than average. Closest monitor was 4.5 miles away from the city center.
| City: | 0.466 |
| U.S.: | 1.515 |
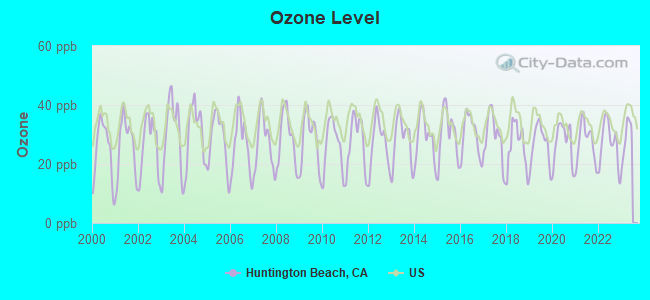
Ozone [ppb] level in 2022 was 26.9. This is better than average. Closest monitor was 4.5 miles away from the city center.
| City: | 26.9 |
| U.S.: | 33.3 |
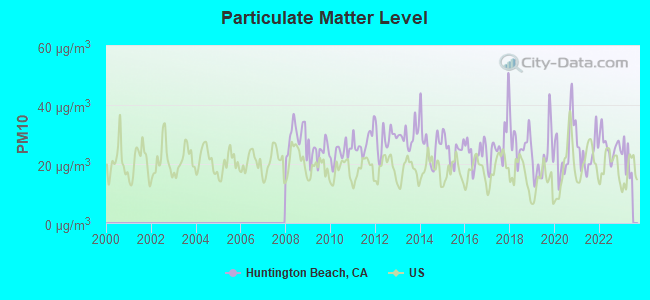
Particulate Matter (PM10) [µg/m3] level in 2022 was 26.3. This is worse than average. Closest monitor was 7.1 miles away from the city center.
| City: | 26.3 |
| U.S.: | 19.2 |
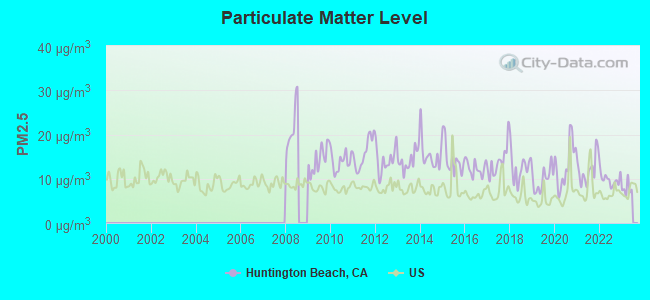
Particulate Matter (PM2.5) [µg/m3] level in 2022 was 9.92. This is worse than average. Closest monitor was 10.2 miles away from the city center.
| City: | 9.92 |
| U.S.: | 8.11 |
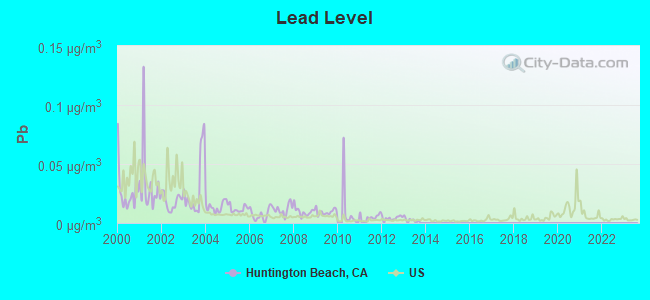
Lead (Pb) [µg/m3] level in 2013 was 0.00274. This is significantly better than average. Closest monitor was 4.7 miles away from the city center.
| City: | 0.00274 |
| U.S.: | 0.00931 |
Earthquake activity:
Huntington Beach-area historical earthquake activity is significantly above California state average. It is 6718% greater than the overall U.S. average.On 7/21/1952 at 11:52:14, a magnitude 7.7 (7.7 UK, Class: Major, Intensity: VIII - XII) earthquake occurred 106.9 miles away from Huntington Beach center, causing $50,000,000 total damage
On 6/28/1992 at 11:57:34, a magnitude 7.6 (6.2 MB, 7.6 MS, 7.3 MW, Depth: 0.7 mi) earthquake occurred 90.8 miles away from the city center, causing 3 deaths (1 shaking deaths, 2 other deaths) and 400 injuries, causing $100,000,000 total damage and $40,000,000 insured losses
On 10/16/1999 at 09:46:44, a magnitude 7.4 (6.3 MB, 7.4 MS, 7.2 MW, 7.3 ML) earthquake occurred 106.2 miles away from the city center
On 11/4/1927 at 13:51:53, a magnitude 7.5 (7.5 UK) earthquake occurred 192.7 miles away from the city center
On 4/21/1918 at 22:32:30, a magnitude 6.8 (6.8 UK, Class: Strong, Intensity: VII - IX) earthquake occurred 33.3 miles away from the city center
On 5/19/1940 at 04:36:40, a magnitude 7.2 (7.2 UK) earthquake occurred 136.8 miles away from the city center, causing $33,000,000 total damage
Magnitude types: body-wave magnitude (MB), local magnitude (ML), surface-wave magnitude (MS), moment magnitude (MW)
Natural disasters:
The number of natural disasters in Orange County (32) is a lot greater than the US average (15).Major Disasters (Presidential) Declared: 22
Emergencies Declared: 2
Causes of natural disasters: Floods: 15, Fires: 13, Storms: 9, Landslides: 6, Winter Storms: 6, Mudslides: 5, Earthquakes: 2, Heavy Rain: 1, Hurricane: 1, Snow: 1, Tornado: 1, Wind: 1, Other: 1 (Note: some incidents may be assigned to more than one category).

Main business address for: QUIKSILVER INC (MEN'S & BOYS' FURNISHINGS, WORK CLOTHING, AND ALLIED GARMENTS), WORLD WIDE MOTION PICTURES CORP (SERVICES-MOTION PICTURE & VIDEO TAPE DISTRIBUTION), BJs RESTAURANTS INC (RETAIL-EATING PLACES).
Hospitals and medical centers in Huntington Beach:
- HUNTINGTON BEACH HOSPITAL (Proprietary, provides emergency services, 17772 BEACH BLVD)
- HUNTINGTON SURGERY CENTER (7801 CENTRAL AVE SUITE 102)
- BEACHSIDE NURSING CENTER (7781 GARFIELD AVENUE)
- HUNTINGTON VALLEY HEALTHCARE CENTER (8382 NEWMAN AVENUE)
- PACIFICA HOSPITAL D/P SNF (18800 DELAWARE ST)
- SEA CLIFF HEALTHCARE CENTER (18811 FLORIDA ST)
- HUNTINGTON BEACH DIALYSIS (16892 BOLSA CHICA AVENUE, SUITE 100)
- A-1 HOME HEALTH CARE (5011 ARGOSY AVE, #5)
Heliports located in Huntington Beach:
- Heliports: 7
Amtrak stations near Huntington Beach:
- 10 miles: SANTA ANA (1000 E. SANTA ANA BLVD.) . Services: ticket office, fully wheelchair accessible, enclosed waiting area, public restrooms, public payphones, snack bar, free short-term parking, free long-term parking, call for car rental service, taxi stand, intercity bus service, public transit connection.
- 10 miles: NEWPORT BEACH (NEWPORT TRANS. CENTER, 1550 AVOCADO AVE.) - Bus Station . Services: fully wheelchair accessible, public payphones, public transit connection.
- 11 miles: ANAHEIM (2150 KATELLA AVE.) . Services: ticket office, fully wheelchair accessible, enclosed waiting area, public restrooms, public payphones, vending machines, free short-term parking, free long-term parking, call for car rental service, call for taxi service.
Colleges/Universities in Huntington Beach:
Other colleges/universities with over 2000 students near Huntington Beach:
- Orange Coast College (about 6 miles; Costa Mesa, CA; Full-time enrollment: 12,918)
- Vanguard University of Southern California (about 7 miles; Costa Mesa, CA; FT enrollment: 2,104)
- University of Phoenix-Southern California Campus (about 7 miles; Costa Mesa, CA; FT enrollment: 8,110)
- Santa Ana College (about 8 miles; Santa Ana, CA; FT enrollment: 11,756)
- Trident University International (about 9 miles; Cypress, CA; FT enrollment: 5,974)
- California State University-Long Beach (about 9 miles; Long Beach, CA; FT enrollment: 28,287)
- Cypress College (about 10 miles; Cypress, CA; FT enrollment: 8,732)
Public high schools in Huntington Beach:
- MARINA HIGH (Students: 2,023, Location: 15871 SPRINGDALE ST., Grades: 9-12)
- HUNTINGTON BEACH HIGH (Students: 1,834, Location: 1905 MAIN ST., Grades: 9-12)
- OCEAN VIEW HIGH (Students: 1,118, Location: 17071 GOTHARD ST., Grades: 9-12)
- COAST HIGH (Students: 51, Location: 17231 GOTHARD ST., Grades: 9-12)
- EDISON HIGH (Location: 21400 MAGNOLIA, Grades: 9-12)
Private high schools in Huntington Beach:
Biggest public elementary/middle schools in Huntington Beach:
- ISAAC L. SOWERS MIDDLE (Students: 1,206, Location: 9300 INDIANAPOLIS AVE., Grades: 6-8)
- HELEN STACEY MIDDLE (Students: 1,134, Location: 6311 LARCHWOOD DR., Grades: 6-8)
- ETHEL DWYER MIDDLE (Students: 1,113, Location: 1502 PALM AVE., Grades: 6-8)
- MARINE VIEW MIDDLE (Students: 843, Location: 5682 TILBURG DR., Grades: 6-8)
- SPRING VIEW MIDDLE (Students: 803, Location: 16662 TRUDY LN., Grades: 6-8)
- MESA VIEW MIDDLE (Students: 715, Location: 17601 AVILLA LN., Grades: 6-8)
- AGNES L. SMITH ELEMENTARY (Students: 538, Location: 770 17TH ST., Grades: KG-5)
- TALBERT (SAMUEL E.) MIDDLE (Students: 499, Location: 9101 BRABHAM DR., Grades: 6-8)
- HARBOUR VIEW ELEMENTARY (Students: 488, Location: 4343 PICKWICK CIR., Grades: KG-5)
- CIRCLE VIEW ELEMENTARY (Students: 477, Location: 6261 HOOKER DR., Grades: KG-5)
Biggest private elementary/middle schools in Huntington Beach:
- ST BONAVENTURE (Students: 629, Location: 16390 SPRINGDALE ST, Grades: KG-8)
- HUNTINGTON CHRISTIAN SCHOOL (Students: 581, Location: 9700 LEVEE DR, Grades: KG-8)
- THE PEGASUS SCHOOL (Students: 565, Location: 19692 LEXINGTON LN, Grades: PK-8)
- STS SIMON & JUDE SCHOOL (Students: 546, Location: 20400 MAGNOLIA ST, Grades: KG-8)
- GRACE LUTHERAN SCHOOL & PRESCHOOL (Students: 437, Location: 5172 MCFADDEN AVE, Grades: PK-8)
- MY FIRST MONTESSORI (Students: 267, Location: 19118 BROOKHURST ST, Grades: PK-1)
- HERITAGE MONTESSORI (Students: 125, Location: 15881 GOLDENWEST ST, Grades: PK-4)
- CARDEN ACADEMY HUNTINGTON BEACH (Students: 116, Location: 721 UTICA AVE, Grades: KG-8)
- MONTESSORI CHILD DEVELOPMENT CTR (Students: 78, Location: 5702 CLARK DR STE 1 BLDG B, Grades: PK-5)
- CARDEN CONSERVATORY ELEMENTARY SCHOOL (Students: 73, Location: 5702 CLARK DR, Grades: PK-8)
User-submitted facts and corrections:
- Can you add our school information to your website? Liberty Christian School 7661 Warner Ave. Huntington Beach, CA 92647 714-842-5992 www.libertychristian.org Preschool - High School (Pre-12) Established 1970
Points of interest:
Notable locations in Huntington Beach: Meadowlark Country Club (A), Huntington Beach Country Club (B), Warner Avenue Boat Launch (C), Huntington Sea Cliff Country Club (D), Main Street Branch Huntington Beach Public Library (E), Graham Branch Huntington Beach Public Library (F), Banning Branch Huntington Beach Public Library (G), Shoreline Ambulance (H), Huntington Beach Fire Department Station 8 Heil (I), Huntington Beach Fire Department Station 5 Lake (J), Huntington Beach Fire Department Station 7 Warner (K), Huntington Beach Fire Department Station 2 Murdy (L), Huntington Beach Fire Department Station 1 Gothard (M), Huntington Beach Fire Department Station 3 Bushard (N), Huntington Beach Fire Department Station 4 Magnolia (O), Central Net Training Center (P), Huntington Beach Generating Station (Q), Huntington Beach City Hall (R). Display/hide their locations on the map
Shopping Centers: Landmark Plaza Shopping Center (1), Garfield Plaza Shopping Center (2), Edinger Plaza Shopping Center (3), Old World Shopping Center (4), Newland Shopping Center (5), Huntington Beach Shopping Center (6), Five Points Plaza Shopping Center (7), College Country Shopping Center (8), Albertsons Shopping Center (9). Display/hide their locations on the map
Main business address in Huntington Beach include: QUIKSILVER INC (A), WORLD WIDE MOTION PICTURES CORP (B), BJs RESTAURANTS INC (C). Display/hide their locations on the map
Churches in Huntington Beach include: Saint Bonaventure Church (A), Harbour Community Church (B), Saint Mary's by the Sea Church (C), Church of Jesus Christ of Latter Day Saints (D), First Christian Church (E), First Church of Christ Scientist (F), Central Baptist Church (G), Evangelical Free Church of Huntington Beach (H), Faith Lutheran Church (I). Display/hide their locations on the map
Cemetery: The Good Shepherd Cemetery (1). Display/hide its location on the map
Reservoir: Lake Huntington (A). Display/hide its location on the map
Parks in Huntington Beach include: Seventeenth Street Park (1), Bolsa Chica State Beach (2), Brunswick Park (3), Circle Park (4), Farquhar Plaza (5), Huntington State Beach (6), Wheeler Park (7), Huntington Central Park (8), Franklin Park (9). Display/hide their locations on the map
Beach: Huntington City Beach (A). Display/hide its location on the map
Tourist attractions: Inside Hollywood Tours (Tourism Consultants; 18685 Main Street Suite A-397) (1), Eastern Nishikigoi (Aquariums; 14562 Zane Cir) (2), Banning Branch (Cultural Attractions- Events- & Facilities; 9281 Banning Avenue) (3). Display/hide their approximate locations on the map
Hotels: Beach Comfort Motel (118 11th Street) (1), 777 Motor Inn (16240 Pacific Coast Highway) (2), Beach Inn Motel (18112 Beach Boulevard) (3), Best Western Regency Inn (19360 Beach Boulevard) (4), Bolsa Chica Inn (17101 Pacific Coast Highway) (5). Display/hide their approximate locations on the map
Birthplace of: James Irvin (fighter) - Martial artist, Collin Balester - Baseball player, Ian Kennedy - Baseball player, Daniele Donato - Television personality, Rob McCullough - Martial artist, Ali Hillis - Film actor, Gordon Kljestan - Soccer player, Amy Sanders - Women's basketball player, Andrew Berardini - Curator, Bao Quach - Martial artist.
Drinking water stations with addresses in Huntington Beach and their reported violations in the past:
HIDDEN HOLLOW MHC (Address: 101 MAIN ST, STE 280 , Serves AZ, Population served: 400, Groundwater):Past monitoring violations:
- Follow-up Or Routine LCR Tap M/R - In OCT-01-2007, Contaminant: Lead and Copper Rule. Follow-up actions: St Violation/Reminder Notice (MAY-19-2008), St Compliance achieved (JUN-10-2008)
- Initial Tap Sampling for Pb and Cu - In JUL-01-2004, Contaminant: Lead and Copper Rule. Follow-up actions: St Compliance achieved (SEP-05-2007)
- One routine major monitoring violation
- 2 regular monitoring violations
| This city: | 2.5 people |
| California: | 2.9 people |
| This city: | 64.9% |
| Whole state: | 68.7% |
| This city: | 6.6% |
| Whole state: | 7.2% |
Likely homosexual households (counted as self-reported same-sex unmarried-partner households)
- Lesbian couples: 0.4% of all households
- Gay men: 0.3% of all households
People in group quarters in Huntington Beach in 2010:
- 391 people in nursing facilities/skilled-nursing facilities
- 327 people in group homes intended for adults
- 82 people in other noninstitutional facilities
- 32 people in emergency and transitional shelters (with sleeping facilities) for people experiencing homelessness
- 24 people in residential treatment centers for adults
- 22 people in workers' group living quarters and job corps centers
- 9 people in group homes for juveniles (non-correctional)
- 3 people in residential treatment centers for juveniles (non-correctional)
People in group quarters in Huntington Beach in 2000:
- 434 people in nursing homes
- 225 people in other noninstitutional group quarters
- 46 people in wards in general hospitals for patients who have no usual home elsewhere
- 31 people in other nonhousehold living situations
- 26 people in homes or halfway houses for drug/alcohol abuse
- 11 people in mental (psychiatric) hospitals or wards
- 5 people in local jails and other confinement facilities (including police lockups)
- 5 people in homes for the mentally retarded
- 5 people in religious group quarters
- 3 people in other group homes
Banks with most branches in Huntington Beach (2011 data):
- Wells Fargo Bank, National Association: 7 branches. Info updated 2011/04/05: Bank assets: $1,161,490.0 mil, Deposits: $905,653.0 mil, headquarters in Sioux Falls, SD, positive income, 6395 total offices, Holding Company: Wells Fargo & Company
- U.S. Bank National Association: 7 branches. Info updated 2012/01/30: Bank assets: $330,470.8 mil, Deposits: $236,091.5 mil, headquarters in Cincinnati, OH, positive income, 3121 total offices, Holding Company: U.S. Bancorp
- Bank of America, National Association: Main And Ellis Branch, Brookhurst - Adams Branch, Huntington-Harbour Branch, Springdale-Edinger Branch, Seacliff Village Branch, Beach-Edinger Branch. Info updated 2009/11/18: Bank assets: $1,451,969.3 mil, Deposits: $1,077,176.8 mil, headquarters in Charlotte, NC, positive income, 5782 total offices, Holding Company: Bank Of America Corporation
- JPMorgan Chase Bank, National Association: Huntington Harbour Branch, Huntington Beach Albertsons Banking, 7830 Edinger Ave Branch, Huntington Beach Branch, Huntington Beach/Seal Branch. Info updated 2011/11/10: Bank assets: $1,811,678.0 mil, Deposits: $1,190,738.0 mil, headquarters in Columbus, OH, positive income, International Specialization, 5577 total offices, Holding Company: Jpmorgan Chase & Co.
- Union Bank, National Association: Seacliff Village Branch, Huntington Beach Branch, Adams Avenue Branch. Info updated 2011/09/01: Bank assets: $88,967.5 mil, Deposits: $65,286.4 mil, headquarters in San Francisco, CA, positive income, Commercial Lending Specialization, 403 total offices, Holding Company: Mitsubishi Ufj Financial Group, Inc.
- Citibank, National Association: Huntington Beach Branch at 7552 Edinger Avenue, branch established on 1987/06/30; Huntington Beach Branch at 20981 Magnolia Street, branch established on 1987/06/30. Info updated 2012/01/10: Bank assets: $1,288,658.0 mil, Deposits: $882,541.0 mil, headquarters in Sioux Falls, SD, positive income, International Specialization, 1048 total offices, Holding Company: Citigroup Inc.
- First Bank: Huntington Beach Branch at 501 Main Street Suite H, branch established on 1988/07/15; Goldenwest Branch at 16900 Goldenwest Street, branch established on 1983/09/19. Info updated 2007/12/04: Bank assets: $6,579.8 mil, Deposits: $5,800.6 mil, headquarters in Creve Coeur, MO, negative income in the last year, Commercial Lending Specialization, 148 total offices, Holding Company: First Banks, Inc.
- Comerica Bank: South Huntington Beach Branch at 10111 Adams Avenue, Suite 101, branch established on 2007/03/09; Huntington Beach Branch at 17011 Beach Blvd., Suite 100, branch established on 2004/10/25. Info updated 2011/07/29: Bank assets: $60,970.5 mil, Deposits: $48,300.9 mil, headquarters in Dallas, TX, positive income, Commercial Lending Specialization, 497 total offices, Holding Company: Comerica Incorporated
- Bank of the West: South Huntington Beach Branch at 19006 Brookhurst Street, branch established on 1973/05/19; Huntington Beach Branch at 6881 Warner Avenue, branch established on 1969/05/02. Info updated 2009/11/16: Bank assets: $62,408.3 mil, Deposits: $43,995.2 mil, headquarters in San Francisco, CA, positive income, 647 total offices, Holding Company: Bnp Paribas
- 10 other banks with 10 local branches
For population 15 years and over in Huntington Beach:
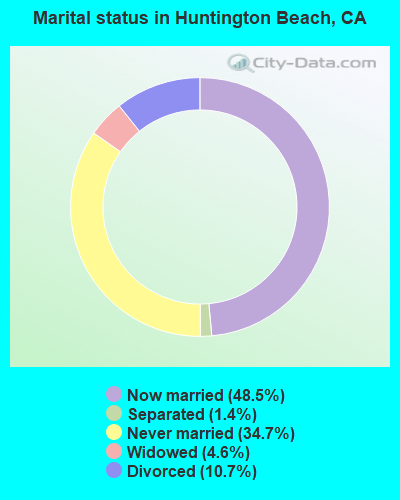
- Never married: 34.7%
- Now married: 48.5%
- Separated: 1.4%
- Widowed: 4.6%
- Divorced: 10.7%
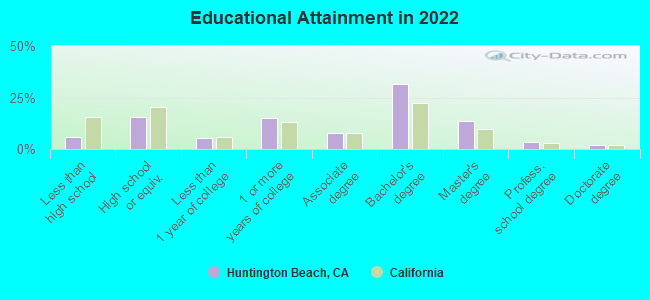
For population 25 years and over in Huntington Beach:
- High school or higher: 94.2%
- Bachelor's degree or higher: 50.4%
- Graduate or professional degree: 18.8%
- Unemployed: 3.9%
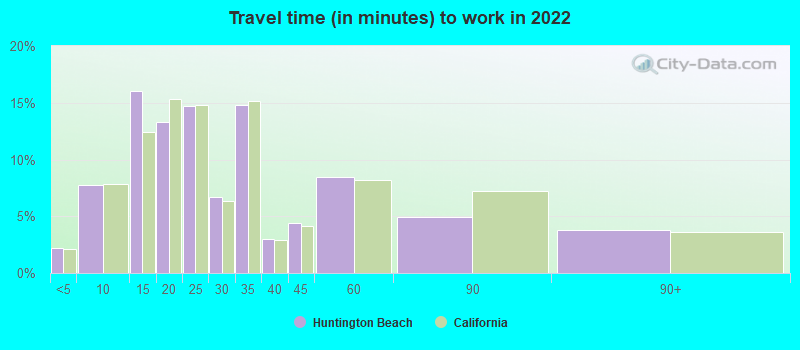
- Mean travel time to work (commute): 22.7 minutes
| Here: | 11.1 |
| California average: | 15.5 |


Graphs represent county-level data. Detailed 2008 Election Results
Political contributions by individuals in Huntington Beach, CA
Neighborhoods in Huntington Beach:
(Huntington Beach, California Neighborhood Map)- Beach neighborhood
- Beach Boulevard neighborhood
- Downtown neighborhood
- Edinger neighborhood
- Ellis-Golden West (Ellis-Goldenwest) neighborhood
- Gothard neighborhood
- Holly-Seacliff neighborhood
- Huntington Beach neighborhood
- Huntington Harbor (Huntington Harbour) neighborhood
- McDonnell Center neighborhood
- Meadowlark neighborhood
Religion statistics for Huntington Beach, CA (based on Orange County data)


| Religion | Adherents | Congregations |
|---|---|---|
| Catholic | 797,473 | 67 |
| Evangelical Protestant | 345,893 | 894 |
| Other | 141,815 | 329 |
| Mainline Protestant | 76,574 | 202 |
| Orthodox | 13,406 | 19 |
| Black Protestant | 2,424 | 8 |
| None | 1,632,647 | - |
Food Environment Statistics:
| Here: | 1.78 / 10,000 pop. |
| California: | 2.14 / 10,000 pop. |
| Orange County: | 0.06 / 10,000 pop. |
| California: | 0.04 / 10,000 pop. |
| Here: | 0.49 / 10,000 pop. |
| State: | 0.62 / 10,000 pop. |
| Orange County: | 1.46 / 10,000 pop. |
| California: | 1.49 / 10,000 pop. |
| Orange County: | 8.19 / 10,000 pop. |
| California: | 7.42 / 10,000 pop. |
| Orange County: | 6.3% |
| California: | 7.3% |
| Orange County: | 18.5% |
| State: | 21.3% |
| This county: | 16.4% |
| California: | 17.9% |
Health and Nutrition:
| Huntington Beach: | 50.7% |
| State: | 49.4% |
| Here: | 48.6% |
| California: | 48.0% |
| This city: | 28.2 |
| California: | 28.1 |
| Huntington Beach: | 19.8% |
| State: | 20.2% |
| Huntington Beach: | 10.8% |
| State: | 11.2% |
| Huntington Beach: | 6.8 |
| California: | 6.8 |
| Huntington Beach: | 32.2% |
| State: | 31.5% |
| Huntington Beach: | 57.8% |
| California: | 56.4% |
| Here: | 80.3% |
| California: | 80.9% |
More about Health and Nutrition of Huntington Beach, CA Residents
| Local government employment and payroll (March 2022) | |||||
| Function | Full-time employees | Monthly full-time payroll | Average yearly full-time wage | Part-time employees | Monthly part-time payroll |
|---|---|---|---|---|---|
| Police Protection - Officers | 220 | $2,461,931 | $134,287 | 8 | $19,479 |
| Firefighters | 121 | $1,601,298 | $158,806 | 0 | $0 |
| Other and Unallocable | 105 | $911,305 | $104,149 | 8 | $14,760 |
| Police - Other | 89 | $718,153 | $96,830 | 20 | $49,035 |
| Water Supply | 75 | $564,612 | $90,338 | 15 | $30,599 |
| Financial Administration | 48 | $435,375 | $108,844 | 13 | $40,147 |
| Fire - Other | 40 | $437,525 | $131,258 | 51 | $123,500 |
| Streets and Highways | 32 | $268,650 | $100,744 | 10 | $17,238 |
| Local Libraries | 27 | $156,523 | $69,566 | 68 | $96,200 |
| Other Government Administration | 23 | $221,484 | $115,557 | 15 | $34,178 |
| Welfare | 21 | $149,130 | $85,217 | 42 | $57,186 |
| Sewerage | 16 | $131,750 | $98,813 | 0 | $0 |
| Parks and Recreation | 14 | $118,943 | $101,951 | 163 | $223,056 |
| Judicial and Legal | 10 | $118,531 | $142,237 | 0 | $0 |
| Housing and Community Development (Local) | 6 | $54,697 | $109,394 | 3 | $9,581 |
| Solid Waste Management | 3 | $23,164 | $92,656 | 0 | $0 |
| Totals for Government | 850 | $8,373,071 | $118,208 | 416 | $714,960 |
Huntington Beach government finances - Expenditure in 2021 (per resident):
- Construction - Regular Highways: $29,230,000 ($150.43)
Parks and Recreation: $13,150,000 ($67.68)
Housing and Community Development: $7,455,000 ($38.37)
Water Utilities: $4,265,000 ($21.95)
Health - Other: $2,757,000 ($14.19)
General - Other: $1,514,000 ($7.79)
Police Protection: $925,000 ($4.76)
Sewerage: $203,000 ($1.04)
Libraries: $46,000 ($0.24)
- Current Operations - General - Other: $360,339,000 ($1854.45)
Police Protection: $94,161,000 ($484.59)
Local Fire Protection: $46,392,000 ($238.75)
Water Utilities: $39,800,000 ($204.83)
Central Staff Services: $27,553,000 ($141.80)
Parks and Recreation: $18,564,000 ($95.54)
Regular Highways: $15,676,000 ($80.68)
Solid Waste Management: $13,150,000 ($67.68)
Protective Inspection and Regulation - Other: $7,403,000 ($38.10)
Sewerage: $7,320,000 ($37.67)
Financial Administration: $5,638,000 ($29.02)
Libraries: $5,586,000 ($28.75)
Health - Other: $4,272,000 ($21.99)
Housing and Community Development: $3,811,000 ($19.61)
Parking Facilities: $3,367,000 ($17.33)
Judicial and Legal Services: $2,635,000 ($13.56)
Transit Utilities: $67,000 ($0.34)
- General - Interest on Debt: $2,613,000 ($13.45)
- Intergovernmental to Local - Other - General - Other: $10,718,000 ($55.16)
- Other Capital Outlay - General - Other: $9,662,000 ($49.72)
Water Utilities: $858,000 ($4.42)
Sewerage: $503,000 ($2.59)
Parks and Recreation: $316,000 ($1.63)
Police Protection: $225,000 ($1.16)
Local Fire Protection: $2,000 ($0.01)
- Water Utilities - Interest on Debt: $91,000 ($0.47)
Huntington Beach government finances - Revenue in 2021 (per resident):
- Charges - Other: $24,361,000 ($125.37)
Parking Facilities: $13,508,000 ($69.52)
Solid Waste Management: $13,280,000 ($68.34)
Sewerage: $10,981,000 ($56.51)
Parks and Recreation: $1,669,000 ($8.59)
- Federal Intergovernmental - Other: $3,931,000 ($20.23)
Housing and Community Development: $420,000 ($2.16)
- Local Intergovernmental - Other: $10,117,000 ($52.07)
- Miscellaneous - General Revenue - Other: $17,516,000 ($90.14)
Fines and Forfeits: $4,673,000 ($24.05)
Interest Earnings: $3,241,000 ($16.68)
Rents: $1,772,000 ($9.12)
Special Assessments: $1,370,000 ($7.05)
Donations From Private Sources: $508,000 ($2.61)
Royalties: $140,000 ($0.72)
- Revenue - Water Utilities: $42,521,000 ($218.83)
- State Intergovernmental - Other: $16,679,000 ($85.84)
Highways: $6,783,000 ($34.91)
General Local Government Support: $322,000 ($1.66)
- Tax - Property: $99,638,000 ($512.78)
General Sales and Gross Receipts: $48,485,000 ($249.52)
Public Utilities Sales: $26,424,000 ($135.99)
Other Selective Sales: $10,379,000 ($53.41)
Other License: $6,237,000 ($32.10)
Occupation and Business License - Other: $2,133,000 ($10.98)
Documentary and Stock Transfer: $1,761,000 ($9.06)
Other: $534,000 ($2.75)
Huntington Beach government finances - Debt in 2021 (per resident):
- Long Term Debt - Outstanding Unspecified Public Purpose: $468,654,000 ($2411.89)
Issue, Unspecified Public Purpose: $387,810,000 ($1995.83)
Beginning Outstanding - Unspecified Public Purpose: $113,100,000 ($582.06)
Retired Unspecified Public Purpose: $32,256,000 ($166.00)
Beginning Outstanding - Public Debt for Private Purpose: $5,800,000 ($29.85)
Outstanding Nonguaranteed - Industrial Revenue: $5,800,000 ($29.85)
Huntington Beach government finances - Cash and Securities in 2021 (per resident):
- Bond Funds - Cash and Securities: $284,444,000 ($1463.87)
- Other Funds - Cash and Securities: $142,286,000 ($732.26)
- Sinking Funds - Cash and Securities: $32,317,000 ($166.32)
4.86% of this county's 2021 resident taxpayers lived in other counties in 2020 ($95,983 average adjusted gross income)
| Here: | 4.86% |
| California average: | 5.19% |
0.01% of residents moved from foreign countries ($132 average AGI)
Orange County: 0.01% California average: 0.03%
Top counties from which taxpayers relocated into this county between 2020 and 2021:
| from Los Angeles County, CA | |
| from Riverside County, CA | |
| from San Diego County, CA |
5.71% of this county's 2020 resident taxpayers moved to other counties in 2021 ($106,828 average adjusted gross income)
| Here: | 5.71% |
| California average: | 6.14% |
0.01% of residents moved to foreign countries ($180 average AGI)
Orange County: 0.01% California average: 0.02%
Top counties to which taxpayers relocated from this county between 2020 and 2021:
| to Los Angeles County, CA | |
| to Riverside County, CA | |
| to San Diego County, CA |
| Businesses in Huntington Beach, CA | ||||
| Name | Count | Name | Count | |
|---|---|---|---|---|
| 24 Hour Fitness | 4 | Justice | 1 | |
| 7-Eleven | 10 | KFC | 3 | |
| 99 Cents Only Stores | 3 | Kohl's | 2 | |
| AT&T | 2 | Kroger | 3 | |
| Ace Hardware | 2 | LA Fitness | 1 | |
| Aerosoles | 1 | Lane Furniture | 1 | |
| Albertsons | 4 | LensCrafters | 1 | |
| Ann Taylor | 1 | Little Caesars Pizza | 2 | |
| Arby's | 2 | Lowe's | 1 | |
| AutoZone | 1 | Marshalls | 1 | |
| Baja Fresh Mexican Grill | 1 | MasterBrand Cabinets | 5 | |
| Bally Total Fitness | 1 | Mazda | 1 | |
| Barnes & Noble | 1 | McDonald's | 7 | |
| Baskin-Robbins | 5 | Men's Wearhouse | 1 | |
| Bath & Body Works | 1 | New Balance | 1 | |
| Bed Bath & Beyond | 1 | Nike | 9 | |
| Best Western | 2 | Nissan | 1 | |
| Big O Tires | 2 | Office Depot | 1 | |
| Blockbuster | 3 | OfficeMax | 1 | |
| Burlington Coat Factory | 1 | Old Navy | 1 | |
| CVS | 6 | Olive Garden | 1 | |
| Carl\s Jr. | 7 | Panda Express | 1 | |
| Chevrolet | 1 | Payless | 2 | |
| Chico's | 1 | Penske | 1 | |
| Chipotle | 1 | PetSmart | 1 | |
| Chuck E. Cheese's | 1 | Pier 1 Imports | 1 | |
| Circle K | 2 | Pizza Hut | 2 | |
| Cold Stone Creamery | 2 | Quiznos | 3 | |
| Comfort Suites | 1 | Rite Aid | 1 | |
| Curves | 3 | SAS Shoes | 1 | |
| DHL | 2 | Safeway | 2 | |
| Dairy Queen | 2 | Skechers USA | 1 | |
| Dennys | 2 | Staples | 2 | |
| Domino's Pizza | 3 | Starbucks | 16 | |
| El Pollo Loco | 3 | T-Mobile | 7 | |
| Extended Stay America | 1 | Taco Bell | 4 | |
| FedEx | 21 | Target | 1 | |
| Firestone Complete Auto Care | 1 | The Cheesecake Factory | 1 | |
| Forever 21 | 1 | The Room Place | 1 | |
| GNC | 2 | Toyota | 1 | |
| GameStop | 3 | Toys"R"Us | 2 | |
| Gap | 1 | Trader Joe's | 2 | |
| Goodwill | 1 | U-Haul | 3 | |
| H&R Block | 6 | UPS | 21 | |
| Hilton | 2 | Vans | 8 | |
| Home Depot | 2 | Verizon Wireless | 1 | |
| Howard Johnson | 1 | Volkswagen | 1 | |
| IHOP | 2 | Vons | 2 | |
| Jamba Juice | 2 | Walgreens | 3 | |
| JoS. A. Bank | 1 | Walmart | 1 | |
| Johnny Rockets | 2 | Wet Seal | 1 | |
| Jones New York | 10 | Whole Foods Market | 1 | |
Strongest AM radio stations in Huntington Beach:
- KFI (640 AM; 50 kW; LOS ANGELES, CA; Owner: CAPSTAR TX LIMITED PARTNERSHIP)
- KLAC (570 AM; 50 kW; LOS ANGELES, CA; Owner: AMFM RADIO LICENSES, L.L.C.)
- KTNQ (1020 AM; 50 kW; LOS ANGELES, CA; Owner: KTNQ-AM LICENSE CORP.)
- KNX (1070 AM; 50 kW; LOS ANGELES, CA; Owner: INFINITY BROADCASTING OPERATIONS, INC.)
- KVNR (1480 AM; 5 kW; SANTA ANA, CA; Owner: LBI RADIO LICENSE CORP.)
- KXTA (1150 AM; 50 kW; LOS ANGELES, CA; Owner: CITICASTERS LICENSES, L.P.)
- KPLS (830 AM; 50 kW; ORANGE, CA; Owner: CRN LICENSES, LLC)
- KFWB (980 AM; 50 kW; LOS ANGELES, CA; Owner: INFINITY BROADCASTING OPERATIONS, INC.)
- KDIS (1110 AM; 50 kW; PASADENA, CA; Owner: ABC,INC.)
- KSPN (710 AM; 50 kW; LOS ANGELES, CA; Owner: KABC-AM RADIO, INC.)
- KMPC (1540 AM; 50 kW; LOS ANGELES, CA; Owner: ROSE CITY RADIO CORPORATION)
- KBLA (1580 AM; 50 kW; SANTA MONICA, CA)
- KXMX (1190 AM; 25 kW; ANAHEIM, CA; Owner: NEW INSPIRATION BROADCASTING COMPANY)
Strongest FM radio stations in Huntington Beach:
- KDLE (103.1 FM; NEWPORT BEACH, CA; Owner: ENTRAVISION HOLDINGS, LLC.)
- KWVE (107.9 FM; SAN CLEMENTE, CA; Owner: CALVARY CHAPEL OF COSTA MESA)
- KZLA-FM (93.9 FM; LOS ANGELES, CA; Owner: EMMIS RADIO LICENSE CORPORATION)
- KCBS-FM (93.1 FM; LOS ANGELES, CA; Owner: INFINITY BROADCASTING OPERATIONS, INC.)
- KPWR (105.9 FM; LOS ANGELES, CA; Owner: EMMIS RADIO LICENSE CORPORATION)
- KLSX (97.1 FM; LOS ANGELES, CA; Owner: INFINITY BROADCASTING OPERATIONS, INC.)
- KUSC (91.5 FM; LOS ANGELES, CA; Owner: UNIVERSITY OF SOUTHERN CALIFORNIA)
- KKLA-FM (99.5 FM; LOS ANGELES, CA; Owner: NEW INSPIRATION BROADCASTING CO., INC.)
- KSCA (101.9 FM; GLENDALE, CA; Owner: HBC LICENSE CORPORATION)
- KLOS (95.5 FM; LOS ANGELES, CA; Owner: KLOS-FM RADIO, INC.)
- K212FA (90.3 FM; TEMPLE CITY, CA; Owner: EDUCATIONAL MEDIA FOUNDATION)
- KOST (103.5 FM; LOS ANGELES, CA; Owner: CAPSTAR TX LIMITED PARTNERSHIP)
- KRTH-FM (101.1 FM; LOS ANGELES, CA; Owner: INFINITY BROADCASTING OPERATIONS, INC.)
- KKBT (100.3 FM; LOS ANGELES, CA; Owner: RADIO ONE LICENSES, LLC)
- KLVE (107.5 FM; LOS ANGELES, CA; Owner: KLVE-FM LICENSE CORP.)
- KIIS-FM (102.7 FM; LOS ANGELES, CA; Owner: CITICASTERS LICENSES, L.P.)
- KPCC (89.3 FM; PASADENA, CA; Owner: PASADENA AREA COMMUNITY COLLEGE DISTRICT)
- KHHT (92.3 FM; LOS ANGELES, CA; Owner: AMFM RADIO LICENSES, L.L.C.)
- KBIG-FM (104.3 FM; LOS ANGELES, CA; Owner: AMFM RADIO LICENSES, L.L.C.)
- KMZT-FM (105.1 FM; LOS ANGELES, CA; Owner: MOUNT WILSON FM BROADCASTERS, INC.)
TV broadcast stations around Huntington Beach:
- KTRO-LP (Channel 50; LANCASTER, CA; Owner: ROBERT D. ADELMAN)
- KCBS-TV (Channel 2; LOS ANGELES, CA; Owner: CBS BROADCASTING INC.)
- National Bridge Inventory (NBI) Statistics
- 51Number of bridges
- 600ft / 183mTotal length
- $3,847,000Total costs
- 2,440,595Total average daily traffic
- 103,165Total average daily truck traffic
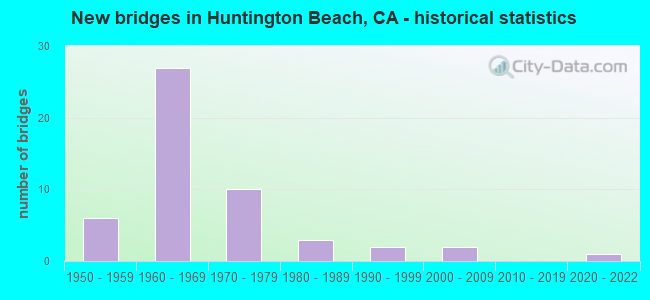
- New bridges - historical statistics
- 61950-1959
- 271960-1969
- 101970-1979
- 31980-1989
- 21990-1999
- 22000-2009
- 12020-2022
FCC Registered Antenna Towers: 111 (See the full list of FCC Registered Antenna Towers)
FCC Registered Commercial Land Mobile Towers: 2 (See the full list of FCC Registered Commercial Land Mobile Towers in Huntington Beach, CA)
FCC Registered Private Land Mobile Towers: 5 (See the full list of FCC Registered Private Land Mobile Towers)
FCC Registered Broadcast Land Mobile Towers: 64 (See the full list of FCC Registered Broadcast Land Mobile Towers)
FCC Registered Microwave Towers: 189 (See the full list of FCC Registered Microwave Towers in this town)
FCC Registered Paging Towers: 1 (See the full list of FCC Registered Paging Towers)
FCC Registered Maritime Coast & Aviation Ground Towers: 16 (See the full list of FCC Registered Maritime Coast & Aviation Ground Towers)
FCC Registered Amateur Radio Licenses: 2,029 (See the full list of FCC Registered Amateur Radio Licenses in Huntington Beach)
FAA Registered Aircraft Manufacturers and Dealers: 6 (See the full list of FAA Registered Manufacturers and Dealers in Huntington Beach)
FAA Registered Aircraft: 156 (See the full list of FAA Registered Aircraft)
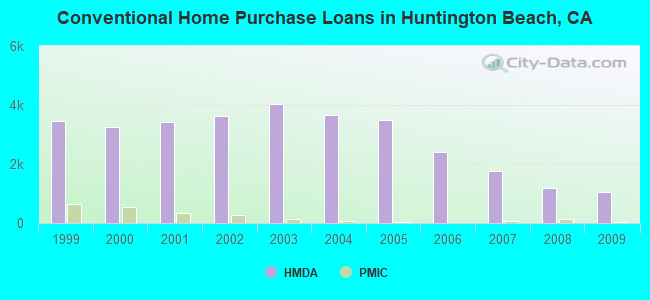
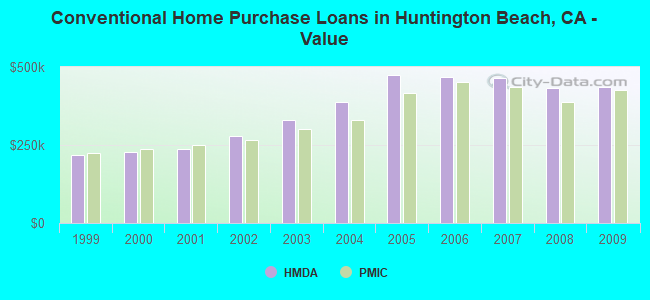
| Home Mortgage Disclosure Act Aggregated Statistics For Year 2009 (Based on 37 full and 8 partial tracts) | ||||||||||||||
| A) FHA, FSA/RHS & VA Home Purchase Loans | B) Conventional Home Purchase Loans | C) Refinancings | D) Home Improvement Loans | E) Loans on Dwellings For 5+ Families | F) Non-occupant Loans on < 5 Family Dwellings (A B C & D) | G) Loans On Manufactured Home Dwelling (A B C & D) | ||||||||
|---|---|---|---|---|---|---|---|---|---|---|---|---|---|---|
| Number | Average Value | Number | Average Value | Number | Average Value | Number | Average Value | Number | Average Value | Number | Average Value | Number | Average Value | |
| LOANS ORIGINATED | 329 | $442,326 | 1,066 | $435,926 | 5,388 | $357,404 | 248 | $254,695 | 7 | $12,034,354 | 434 | $372,706 | 26 | $86,514 |
| APPLICATIONS APPROVED, NOT ACCEPTED | 35 | $443,845 | 140 | $435,600 | 552 | $385,373 | 37 | $156,294 | 0 | $0 | 60 | $394,489 | 29 | $81,103 |
| APPLICATIONS DENIED | 62 | $424,633 | 232 | $402,442 | 1,456 | $412,066 | 74 | $194,906 | 0 | $0 | 187 | $349,633 | 32 | $76,672 |
| APPLICATIONS WITHDRAWN | 54 | $424,217 | 205 | $419,606 | 932 | $389,527 | 53 | $213,979 | 2 | $5,929,500 | 100 | $352,380 | 6 | $80,933 |
| FILES CLOSED FOR INCOMPLETENESS | 14 | $410,674 | 36 | $403,190 | 246 | $444,568 | 8 | $249,842 | 1 | $175,000 | 28 | $322,182 | 1 | $70,000 |
Detailed mortgage data for all 45 tracts in Huntington Beach, CA
| Private Mortgage Insurance Companies Aggregated Statistics For Year 2009 (Based on 31 full and 7 partial tracts) | ||||||
| A) Conventional Home Purchase Loans | B) Refinancings | C) Non-occupant Loans on < 5 Family Dwellings (A & B) | ||||
|---|---|---|---|---|---|---|
| Number | Average Value | Number | Average Value | Number | Average Value | |
| LOANS ORIGINATED | 48 | $426,183 | 15 | $445,094 | 1 | $365,000 |
| APPLICATIONS APPROVED, NOT ACCEPTED | 22 | $383,689 | 15 | $442,634 | 0 | $0 |
| APPLICATIONS DENIED | 26 | $485,557 | 16 | $439,917 | 0 | $0 |
| APPLICATIONS WITHDRAWN | 7 | $542,227 | 9 | $487,149 | 0 | $0 |
| FILES CLOSED FOR INCOMPLETENESS | 3 | $399,923 | 2 | $389,805 | 0 | $0 |
2005 - 2018 National Fire Incident Reporting System (NFIRS) incidents
- Fire incident types reported to NFIRS in Huntington Beach, CA
- 86339.5%Structure Fires
- 75834.7%Outside Fires
- 33015.1%Mobile Property/Vehicle Fires
- 23310.7%Other
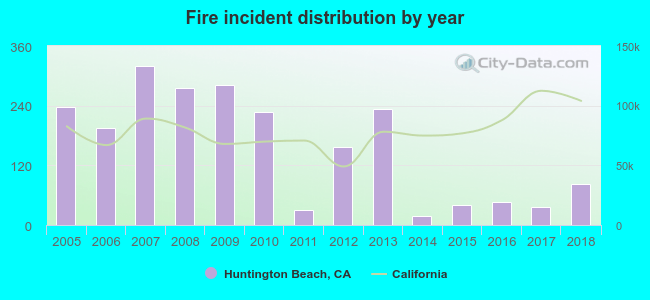 Based on the data from the years 2005 - 2018 the average number of fires per year is 156. The highest number of fire incidents - 320 took place in 2007, and the least - 19 in 2014. The data has a declining trend.
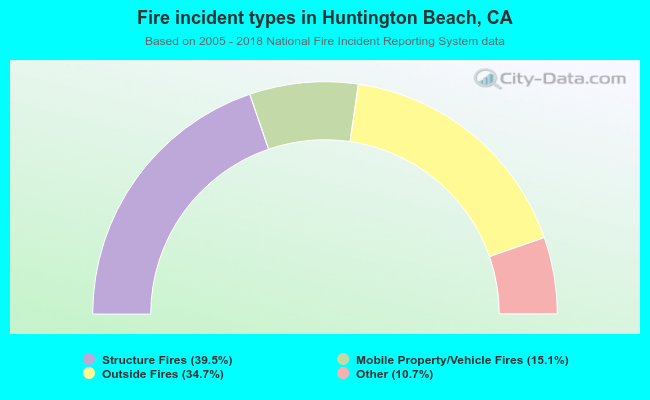 When looking into fire subcategories, the most incidents belonged to: Structure Fires (39.5%), and Outside Fires (34.7%).
Fire-safe hotels and motels in Huntington Beach, California:
- Comfort Suites Huntington Beach, 16301 Beach Blvd, Huntington Beach, California 92647 , Phone: (714) 841-1812, Fax: (714) 841-0214
- Hotel Huntington Beach, 7667 Center Ave, Huntington Beach, California 92647 , Phone: (714) 891-0123, Fax: (714) 895-4591
- Extended Stay America - Orange County - Huntington Beach, 5050 Skylab West Cir, Huntington Beach, California 92647 , Phone: (714) 799-4887, Fax: (714) 799-4897
- Quality Inn and suites, 17251 Bch Bl, Huntington Beach, California 92647 , Phone: (714) 375-0250, Fax: (714) 375-0251
- Hyatt Regency Huntington Beach Resort & Spa, 21500 Pacific Coast Hwy, Huntington Beach, California 92648 , Phone: (714) 698-1234, Fax: (714) 845-4635
- Pacific View Inn & Suites, 16220 Pacific Coast Hwy, Huntington Beach, California 92649 , Phone: (562) 592-4959, Fax: (562) 592-2107
- Shorebreak Hotel, 500 Pacific Coast Hwy, Huntington Beach, California 92648 , Phone: (714) 861-4470, Fax: (714) 861-4475
- SpringHill Suites by Marriott Huntington Beach Orange County, 7872 Edinger Ave, Huntington beach, California 92647 , Phone: (888) 236-2427, Fax: (657) 200-7501
- Pasea Hotel & Spa, 21080 Pacific Coast Hwy, Huntington beach, California 92648 , Phone: (714) 698-6109
| Most common first names in Huntington Beach, CA among deceased individuals | ||
| Name | Count | Lived (average) |
|---|---|---|
| John | 722 | 73.8 years |
| William | 674 | 73.6 years |
| Mary | 669 | 79.3 years |
| Robert | 593 | 70.6 years |
| James | 485 | 71.1 years |
| Charles | 373 | 74.0 years |
| Margaret | 359 | 80.5 years |
| George | 351 | 75.2 years |
| Helen | 351 | 80.9 years |
| Dorothy | 335 | 79.4 years |
| Most common last names in Huntington Beach, CA among deceased individuals | ||
| Last name | Count | Lived (average) |
|---|---|---|
| Smith | 273 | 75.5 years |
| Johnson | 179 | 77.3 years |
| Miller | 147 | 72.7 years |
| Brown | 144 | 74.8 years |
| Williams | 131 | 77.3 years |
| Jones | 124 | 75.6 years |
| Anderson | 110 | 75.2 years |
| Wilson | 107 | 78.0 years |
| Davis | 93 | 75.4 years |
| Taylor | 89 | 75.9 years |
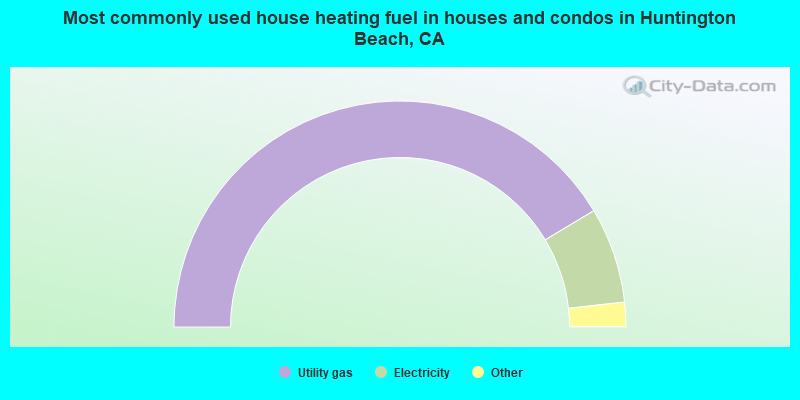
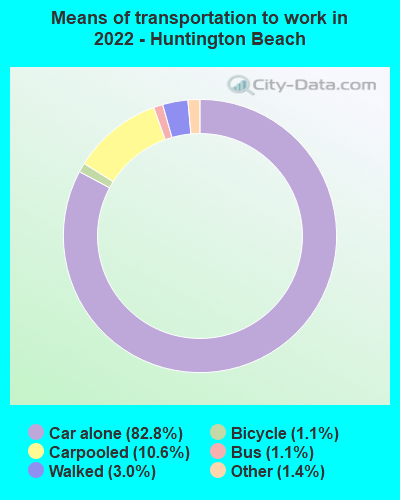
- 82.8%Utility gas
- 13.7%Electricity
- 1.4%No fuel used
- 1.1%Bottled, tank, or LP gas
- 0.6%Solar energy
- 0.2%Other fuel
- 0.1%Wood
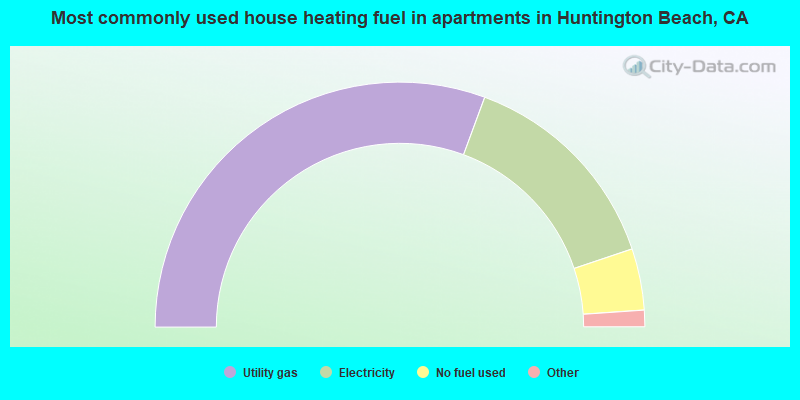
- 61.2%Utility gas
- 28.4%Electricity
- 8.1%No fuel used
- 1.9%Bottled, tank, or LP gas
- 0.1%Fuel oil, kerosene, etc.
- 0.1%Other fuel
Huntington Beach compared to California state average:
- Median house value above state average.
- Unemployed percentage significantly below state average.
- Black race population percentage significantly below state average.
- Hispanic race population percentage below state average.
- Median age significantly above state average.
- Foreign-born population percentage below state average.
- Percentage of population with a bachelor's degree or higher above state average.
Huntington Beach, CA compared to other similar cities:
Huntington Beach on our top lists:
- #11 on the list of "Top 101 cities with largest percentage of females in occupations: installation, maintenance, and repair occupations (population 50,000+)"
- #15 on the list of "Top 101 cities with the largest racial income disparity between any two races with at least 2,000 householders"
- #31 on the list of "Top 101 larger cities with the highest increase in house/condo value from 2000 (population 50,000+)"
- #32 on the list of "Top 101 cities with the largest city-data.com crime index increase from 2002 to 2012 (population 50,000+)"
- #35 on the list of "Top 100 cities with highest median house value (pop. 50,000+)"
- #44 on the list of "Top 101 cities with largest percentage of males in occupations: legal occupations (population 50,000+)"
- #53 on the list of "Top 101 cities with the highest cost per building permit(population 50,000+)"
- #59 on the list of "Top 100 cities with highest ratio of median house value to median household income (pop. 50,000+)"
- #69 on the list of "Top 101 cities with the lowest number of police officers per 1000 residents (population 50,000+)"
- #77 on the list of "Top 101 cities with largest percentage of males in industries: information (population 50,000+)"
- #79 on the list of "Top 101 cities with largest percentage of females in industries: real estate and rental and leasing (population 50,000+)"
- #80 on the list of "Top 101 cities with largest percentage of females in occupations: personal care and service occupations (population 50,000+)"
- #83 on the list of "Top 101 cities with the smallest temperature differences during a year (population 50,000+)"
- #84 on the list of "Top 101 cities with largest percentage of males in occupations: management occupations (population 50,000+)"
- #84 on the list of "Top 101 cities with the most residents born in Other Western Europe (population 500+)"
- #96 on the list of "Top 101 cities with fewest building permits per 10,000 residents (population 50,000+)"
- #97 on the list of "Top 101 cities with largest percentage of males in industries: utilities (population 50,000+)"
- #99 on the list of "Top 101 cities with the lowest average yearly precipitation (population 50,000+)"
- #47 (90740) on the list of "Top 101 zip codes with the smallest percentage of returns reporting salary or wage in 2012 (pop 5,000+)"
- #4 on the list of "Top 101 counties with the highest total withdrawal of fresh water for public supply"
- #5 on the list of "Top 101 counties with the most Catholic adherents"
- #6 on the list of "Top 101 counties with the highest ground withdrawal of fresh water for public supply"
- #7 on the list of "Top 101 counties with the most Evangelical Protestant adherents"
- #8 on the list of "Top 101 counties with the highest Particulate Matter (PM2.5) Annual air pollution readings in 2012 (µg/m3)"

|
|
Total of 2666 patent applications in 2008-2024.