Housing density: 3,177 houses/condos per square mile
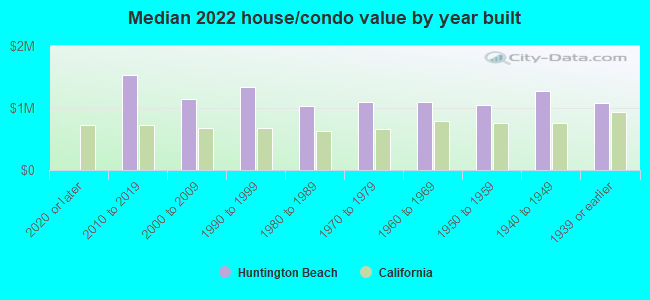
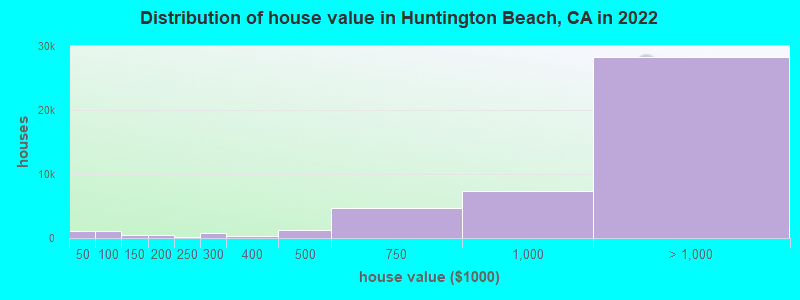
Median price asked for vacant for-sale houses and condos in 2022: $2,078,346.
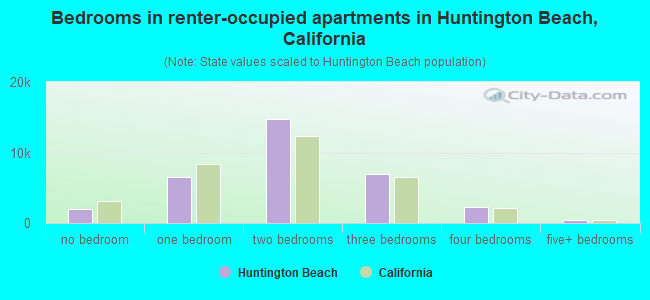
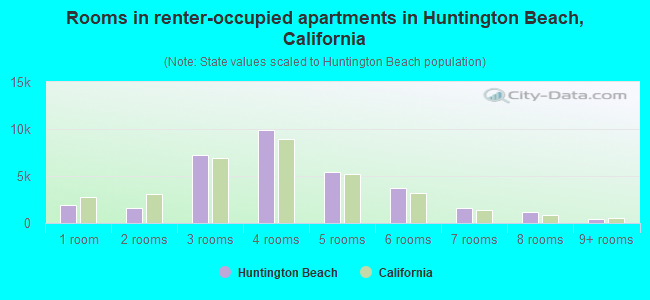
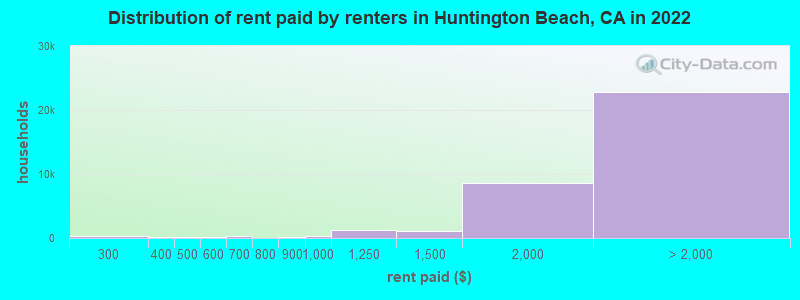
Median contract rent in 2022: over $2,000 (lower quartile is $1,811, upper quartile is over $2,000)
Median rent asked for vacant for-rent units in 2022: $3,238
Median gross rent in Huntington Beach, CA in 2022: over $2,000
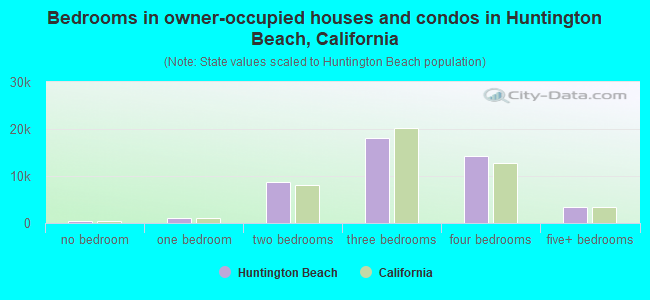
Housing units in Huntington Beach with a mortgage: 29,025 (2,540 second mortgage, 55 home equity loan, 2,273 both second mortgage and home equity loan) Houses without a mortgage: 774
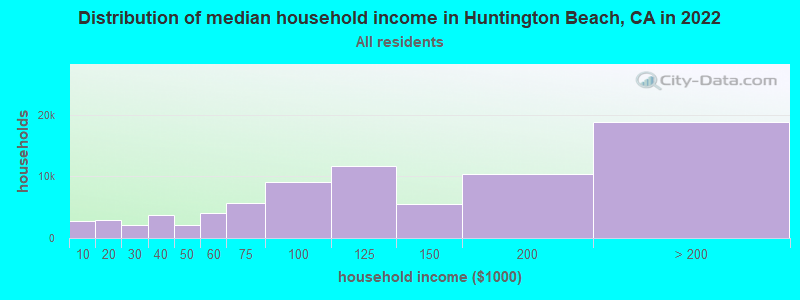
Median household income for houses/condos with a mortgage: $153,601
Median household income for apartments without a mortgage: $101,538
Median monthly housing costs: $2,394
Compare current foreclosures in Huntington Beach, CA:
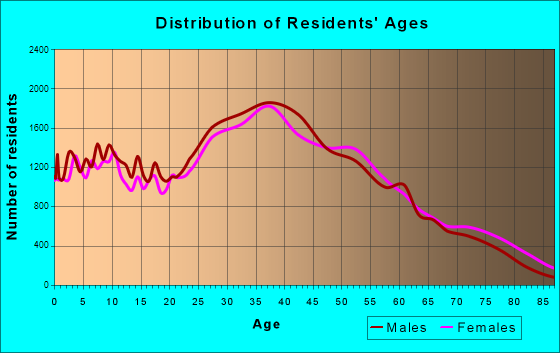
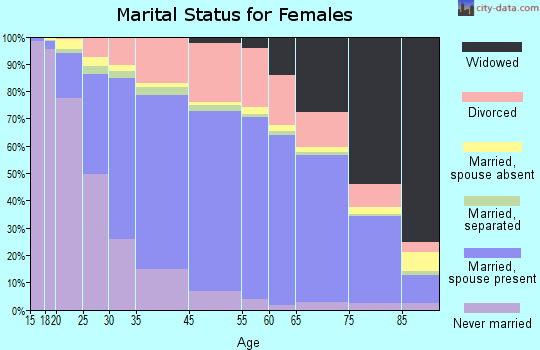
22,643 married couples with children.
6,544 single-parent households (2,457 men, 4,087 women).
72.8% of residents of Huntington Beach speak English at home.
11.3% of residents speak Spanish at home (80% speak English very well, 11% speak English well, 9% speak English not well).
3.2% of residents speak other Indo-European language at home (75% speak English very well, 24% speak English well, 1% don't speak English at all).
10.9% of residents speak Asian or Pacific Island language at home (58% speak English very well, 20% speak English well, 18% speak English not well, 4% don't speak English at all).
1.8% of residents speak other language at home (81% speak English very well, 6% speak English well, 7% speak English not well, 6% don't speak English at all).
Foreign born population: 34,920 (18.0%)
(66.0% of them are naturalized citizens)
Percentage of workers working in this county: 84.3% Number of people working at home: 20,927 (20.4% of all workers)
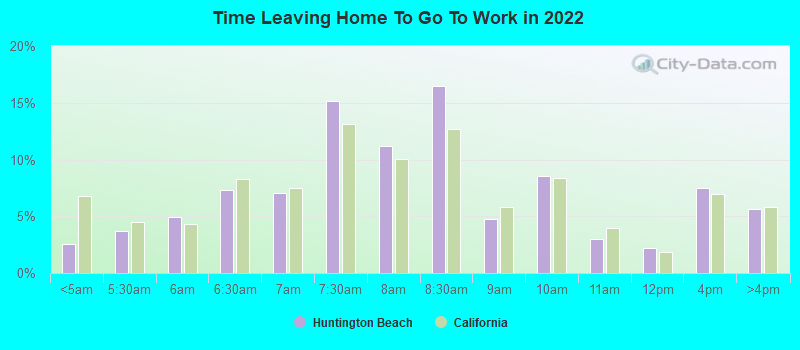
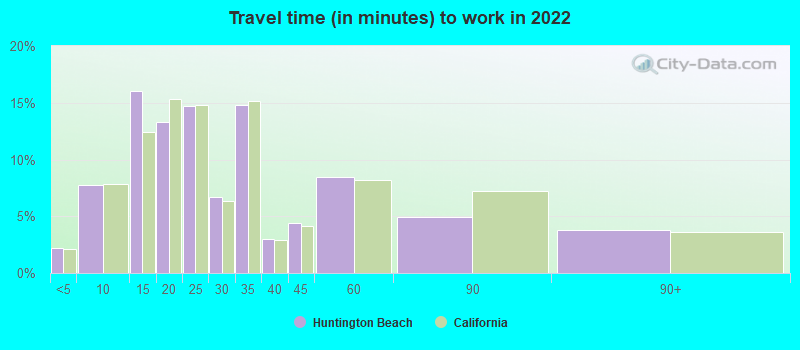
Travel time to work (commute)
Less than 5 minutes: 1,464
5 to 9 minutes: 6,766
10 to 14 minutes: 10,229
15 to 19 minutes: 11,582
20 to 24 minutes: 11,113
25 to 29 minutes: 4,718
30 to 34 minutes: 12,994
35 to 39 minutes: 2,388
40 to 44 minutes: 4,098
45 to 59 minutes: 7,473
60 to 89 minutes: 6,760
90 or more minutes: 2,296
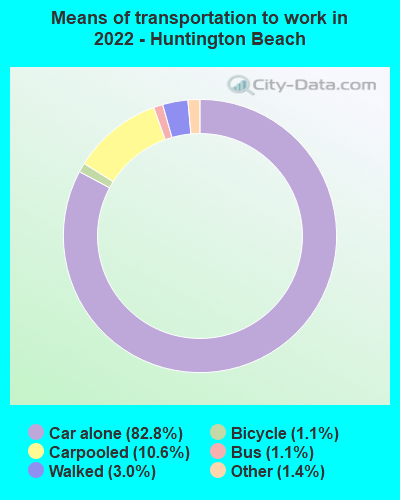
Means of transportation to work:
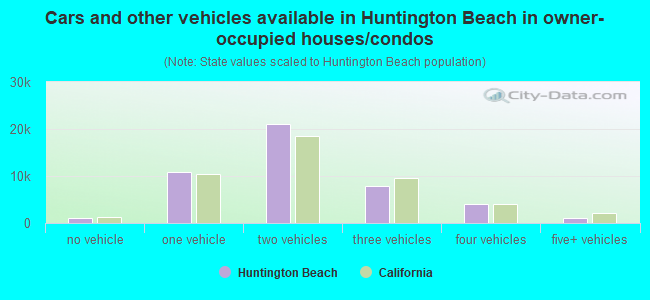
Drove a car alone: 57,601 (63.6%)
Carpooled: 7,345 (8.1%)
Bus: 796 (0.9%)
Taxi: 995 (1.1%)
Bicycle: 756 (0.8%)
Walked: 2,103 (2.3%)
Worked at home: 20,927 (23.1%)
Unemployment by race in 2022
Unemployment rate for White non-Hispanic residents
5.8%Males
2.5%Females
Unemployment rate for Black residents
15.1%Males
19.4%Females
Unemployment rate for American Indian and Alaska Native residents
3.0%Males
3.7%Females
Unemployment rate for Asian residents
6.6%Males
2.9%Females
Unemployment rate for other race residents
0.8%Males
3.1%Females
Unemployment rate for two or more race residents
4.9%Males
4.5%Females
Unemployment rate for Hispanic or Latino residents
2.8%Males
4.7%Females
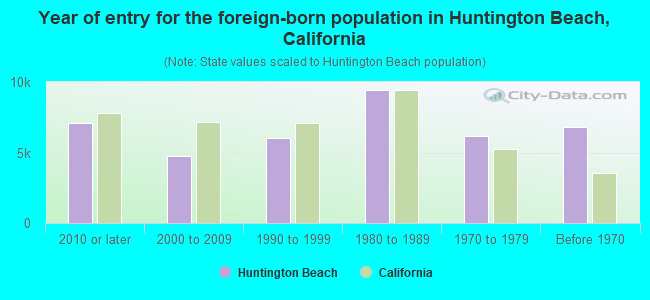
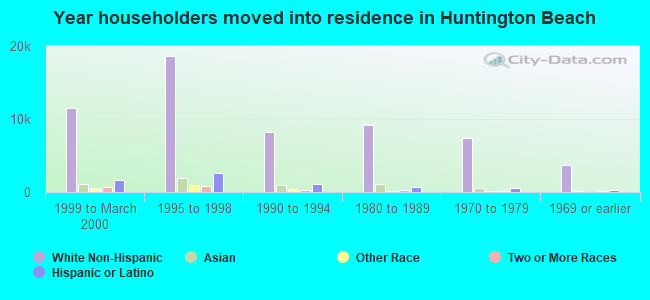
Year of entry for the foreign-born population in Huntington Beach, California
7,0672010 or later
4,7222000 to 2009
6,0371990 to 1999
9,4351980 to 1989
6,1461970 to 1979
6,792Before 1970
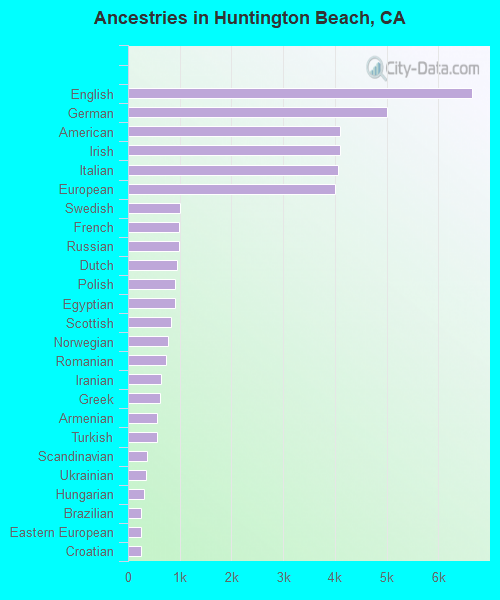
First ancestries reported:
English: 6,648 (7.7%)
German: 5,014 (5.8%)
American: 4,094 (4.7%)
Irish: 4,091 (4.7%)
Italian: 4,066 (4.7%)
European: 4,004 (4.6%)
Swedish: 1,009 (1.2%)
French: 995 (1.2%)
Russian: 984 (1.1%)
Dutch: 948 (1.1%)
Polish: 911 (1.1%)
Egyptian: 910 (1.1%)
Scottish: 841 (1.0%)
Norwegian: 776 (0.9%)
Romanian: 729 (0.8%)
Iranian: 637 (0.7%)
Greek: 615 (0.7%)
Armenian: 570 (0.7%)
Turkish: 559 (0.6%)
Scandinavian: 372 (0.4%)
Ukrainian: 342 (0.4%)
Hungarian: 308 (0.4%)
Brazilian: 258 (0.3%)
Eastern European: 249 (0.3%)
Croatian: 242 (0.3%)
French Canadian: 242 (0.3%)
Welsh: 223 (0.3%)
British: 219 (0.3%)
Portuguese: 212 (0.2%)
Scotch-Irish: 204 (0.2%)
Canadian: 193 (0.2%)
African: 182 (0.2%)
Swiss: 176 (0.2%)
Slavic: 162 (0.2%)
Northern European: 158 (0.2%)
Palestinian: 157 (0.2%)
West Indian: 152 (0.2%)
Danish: 151 (0.2%)
Jordanian: 149 (0.2%)
Lebanese: 142 (0.2%)
Ethiopian: 140 (0.2%)
Czech: 133 (0.2%)
Austrian: 122 (0.1%)
Finnish: 82 (0.09%)
Celtic: 75 (0.09%)
Australian: 71 (0.08%)
Trinidadian and Tobagonian: 66 (0.08%)
Yugoslavian: 62 (0.07%)
Slovak: 59 (0.07%)
South African: 57 (0.07%)
Afghan: 54 (0.06%)
Lithuanian: 54 (0.06%)
Syrian: 53 (0.06%)
Basque: 49 (0.06%)
Arab: 42 (0.05%)
Icelander: 42 (0.05%)
Belgian: 32 (0.04%)
Maltese: 30 (0.03%)
Soviet Union: 24 (0.03%)
Czechoslovakian: 22 (0.03%)
Iraqi: 20 (0.02%)
Israeli: 19 (0.02%)
Ghanaian: 19 (0.02%)
Latvian: 16 (0.02%)
Bulgarian: 14 (0.02%)
Cajun: 12 (0.01%)
Slovene: 9 (0.01%)
Serbian: 9 (0.01%)
Most common places of birth for foreign-born residents (%):
Vietnam
Huntington Beach:
21.5% (7,013)
California:
4.9% (512,335)
Mexico
Huntington Beach:
14.9% (4,862)
California:
37.2% (3,881,193)
Philippines
Huntington Beach:
4.9% (1,589)
California:
7.8% (818,297)
Canada
Huntington Beach:
3.6% (1,184)
California:
1.2% (127,477)
China, excluding Hong Kong and Taiwan
Huntington Beach:
3.2% (1,058)
California:
6.6% (684,672)
Taiwan
Huntington Beach:
3.1% (998)
California:
1.7% (176,274)
Korea
Huntington Beach:
2.5% (821)
California:
3.0% (315,248)
Egypt
Huntington Beach:
2.0% (662)
California:
0.4% (42,718)
England
Huntington Beach:
1.9% (631)
California:
0.6% (57,953)
El Salvador
Huntington Beach:
1.9% (629)
California:
4.2% (440,287)
Japan
Huntington Beach:
1.9% (616)
California:
1.0% (103,575)
Peru
Huntington Beach:
1.8% (582)
California:
0.7% (74,025)
Turkey
Huntington Beach:
1.7% (559)
California:
0.2% (20,474)
India
Huntington Beach:
1.7% (543)
California:
5.2% (539,184)
Brazil
Huntington Beach:
1.6% (528)
California:
0.5% (53,222)
Place of birth for U.S.-born residents:
This state: 112,182
Other state: 44,378
Northeast: 10,231
Midwest: 16,003
South: 9,285
West: 8,859
87.8% of Huntington Beach residents lived in the same house 1 years ago. Out of people who lived in different houses, 41.2% lived in this county. Out of people who lived in different counties, 45.2% lived in California.
Huntington Beach:
87.8%
State average:
88.9%
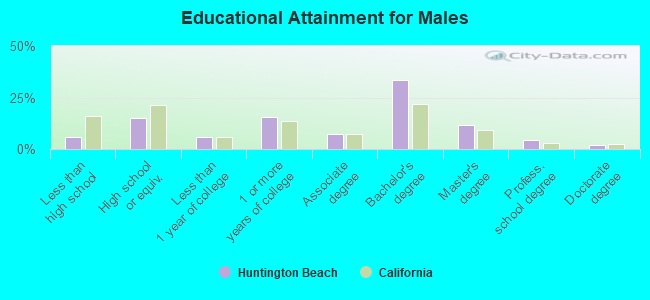
Education attainment for males 25 years and older:
No schooling: 956
Nursery to 4th grade: 244
5th and 6th grade: 88
7th and 8th grade: 423
9th grade: 331
10th grade: 42
11th grade: 726
12th grade, no diploma: 1,260
High school graduate (or equivalency): 10,974
Less than 1 year of college: 4,036
Some college more than 1 year, no degree: 11,175
Associate degree: 5,080
Bachelor's degree: 24,006
Master's degree: 8,440
Professional school degree: 3,019
Doctorate degree: 1,222
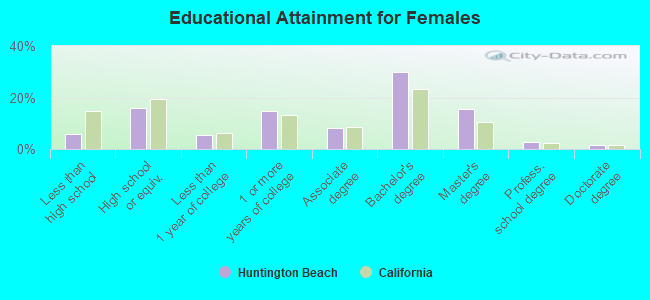
Education attainment for females 25 years and older:
No schooling: 2,141
Nursery to 4th grade: 338
5th and 6th grade: 292
7th and 8th grade: 376
9th grade: 48
10th grade: 148
11th grade: 302
12th grade, no diploma: 704
High school graduate (or equivalency): 11,600
Less than 1 year of college: 3,956
Some college more than 1 year, no degree: 10,876
Associate degree: 6,054
Bachelor's degree: 22,025
Master's degree: 11,390
Professional school degree: 2,092
Doctorate degree: 1,254
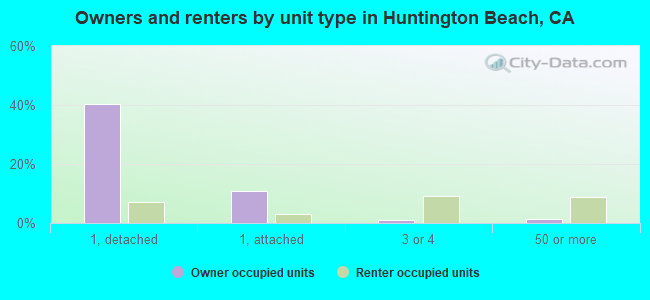
Housing units in structures:
One, detached: 39,560
One, attached: 11,901
Two: 1,744
3 or 4: 8,903
5 to 9: 5,027
10 to 19: 2,799
20 to 49: 2,700
50 or more: 8,163
Mobile homes: 2,969
Boats, RVs, vans, etc.: 86
Median worth of mobile homes: $175,500
Housing units lacking complete kitchen facilities in 2022: 1.0%
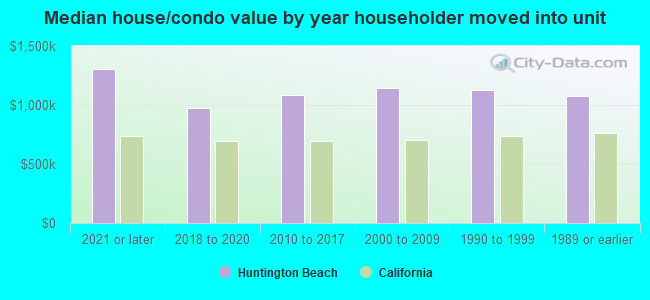
House/condo owner moved in on average 16 years ago