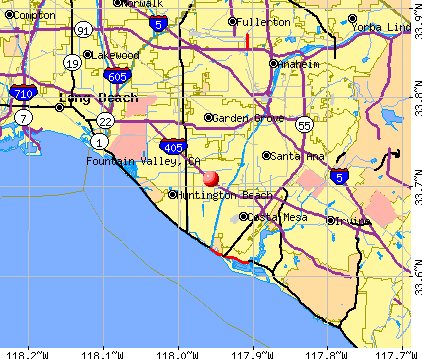
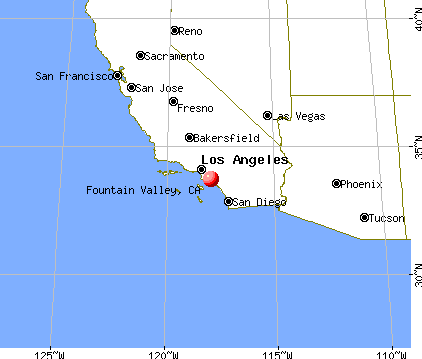
Fountain Valley, California
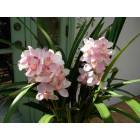
Fountain Valley: Orchids grow wild in Fountain valley
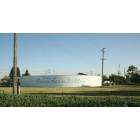
Fountain Valley: Water tank at Euclid St. as seen from 405 freeway onramp.
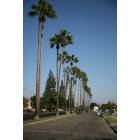
Fountain Valley: Line of palm trees along Tabert Ave. with Saddleback in the distance
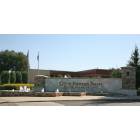
Fountain Valley: Fountain Valley City Hall
- add
your
Submit your own pictures of this city and show them to the world
- OSM Map
- General Map
- Google Map
- MSN Map
Population change since 2000: +1.7%
 |
| Males: 28,039 | |
| Females: 27,891 |
| Median resident age: | 45.2 years |
| California median age: | 37.9 years |
| Fountain Valley: | $105,722 |
| CA: | $91,551 |
Estimated per capita income in 2022: $47,216 (it was $26,521 in 2000)
Fountain Valley city income, earnings, and wages data
Estimated median house or condo value in 2022: over $1,000,000 (it was $285,700 in 2000)
| Fountain Valley: | over $1,000,000 |
| CA: | $715,900 |
Mean prices in 2022: all housing units: over $1,000,000; detached houses: over $1,000,000; townhouses or other attached units: $732,831; in 3-to-4-unit structures: $744,526; in 5-or-more-unit structures: $703,473; mobile homes: $166,029
Median gross rent in 2022: $2,415.
Fountain Valley, CA residents, houses, and apartments details
(6.5% for White Non-Hispanic residents, 2.9% for Black residents, 8.8% for Hispanic or Latino residents, 11.9% for American Indian residents, 3.0% for Native Hawaiian and other Pacific Islander residents, 10.3% for other race residents, 4.5% for two or more races residents)
Detailed information about poverty and poor residents in Fountain Valley, CA


Compare current foreclosures near Fountain Valley, CA:
| Photo | Address | Area | Beds / Baths | Price | Details |
|---|---|---|---|---|---|

|
#1
Calendula Ave
Fountain Valley, CA 92708
|
1,615 sq. feet
|
2 baths 4 beds |
show details | |

|
#2
Ponderosa St
Fountain Valley, CA 92708
|
2,108 sq. feet
|
3 baths 5 beds |
show details | |

|
#3
Santa Andrea St
Fountain Valley, CA 92708
|
- sq. feet
|
2 baths 4 beds |
show details | |

|
#4
Marigold Ave
Fountain Valley, CA 92708
|
1,459 sq. feet
|
2 baths 4 beds |
show details | |

|
#5
Aberdene Mtn Unit 111
Fountain Valley, CA 92708
|
910 sq. feet
|
1 baths 2 beds |
show details | |

|
#6
Peony Cir
Fountain Valley, CA 92708
|
2,404 sq. feet
|
3 baths 4 beds |
show details | |

|
#7
Mcelwee River Cir
Fountain Valley, CA 92708
|
3,022 sq. feet
|
3 baths 4 beds |
show details | |

|
#8
Mount Dana Cir
Fountain Valley, CA 92708
|
2,189 sq. feet
|
3 baths 4 beds |
show details | |

|
#9
Sylvan Riv Unit 132
Fountain Valley, CA 92708
|
1,064 sq. feet
|
2 baths 2 beds |
show details | |

|
#10
El Arroyo Ave
Fountain Valley, CA 92708
|
1,417 sq. feet
|
4 baths 3 beds |
show details |
| Photo | Address | Area | Beds / Baths | Price | Details |
|---|---|---|---|---|---|

|
#11
Vireo Cir
Fountain Valley, CA 92708
|
1,433 sq. feet
|
2 baths 3 beds |
show details | |

|
#12
Azalea Cir
Fountain Valley, CA 92708
|
1,459 sq. feet
|
2 baths 4 beds |
show details | |

|
#13
Sioux River Cir
Fountain Valley, CA 92708
|
2,628 sq. feet
|
3 baths 5 beds |
show details | |

|
#14
Cobalt Ct
Fountain Valley, CA 92708
|
1,345 sq. feet
|
2 baths 3 beds |
show details | |

|
#15
Warner Ave Apt A116
Fountain Valley, CA 92708
|
- sq. feet
|
- baths - beds |
show details | |

|
#16
Azalea Ave
Fountain Valley, CA 92708
|
2,251 sq. feet
|
- baths - beds |
show details | |

|
#17
Slater Ave Apt 20
Fountain Valley, CA 92708
|
- sq. feet
|
- baths - beds |
show details | |

|
#18
La Alameda Ave
Fountain Valley, CA 92708
|
- sq. feet
|
- baths - beds |
show details | |

|
#19
Santa Arabella St
Fountain Valley, CA 92708
|
- sq. feet
|
- baths - beds |
show details | |

|
#20
Santa Isadora St
Fountain Valley, CA 92708
|
- sq. feet
|
- baths - beds |
show details |
| Photo | Address | Area | Beds / Baths | Price | Details |
|---|---|---|---|---|---|

|
#21
Brookhurst St # 1618
Fountain Valley, CA 92708
|
- sq. feet
|
- baths - beds |
show details | |

|
#22
Via Mariposa E Unit C
Laguna Hills, CA 92637
|
1,325 sq. feet
|
2 baths 2 beds |
$409,000
|
show details |

|
#23
Newhope St Apt 313
Fountain Valley, CA 92708
|
- sq. feet
|
- baths - beds |
show details | |

|
#24
Crow Ln
Fountain Valley, CA 92708
|
- sq. feet
|
- baths - beds |
show details | |

|
#25
Norwalk Blvd Apt
Hawaiian Gardens, CA 90716
|
800 sq. feet
|
2 baths 1 beds |
show details | |

|
#26
E Jackson Ave Unit C
Anaheim, CA 92806
|
1,266 sq. feet
|
2 baths 3 beds |
show details | |

|
#27
Starburst Ct # 8
Newport Beach, CA 92663
|
1,157 sq. feet
|
2 baths 2 beds |
show details | |

|
#28
Redondo Avenue, Units 5-8
Long Beach, CA 90804
|
3,360 sq. feet
|
4 baths 8 beds |
show details | |

|
#29
W Arbor St # 57
Long Beach, CA 90805
|
1,585 sq. feet
|
2 baths 3 beds |
show details | |

|
#30
Mira Mar Ave
Long Beach, CA 90814
|
1,902 sq. feet
|
2 baths 4 beds |
show details |
| Photo | Address | Area | Beds / Baths | Price | Details |
|---|---|---|---|---|---|

|
#31
Molette St
Norwalk, CA 90650
|
1,082 sq. feet
|
1 baths 4 beds |
show details | |

|
#32
W Willow Ave
Anaheim, CA 92804
|
1,502 sq. feet
|
2 baths 4 beds |
show details | |

|
#33
Dunrobin Ave
Lakewood, CA 90713
|
1,032 sq. feet
|
1 baths 2 beds |
show details | |

|
#34
Village Way
Signal Hill, CA 90755
|
1,524 sq. feet
|
3 baths 3 beds |
show details | |

|
#35
S Towner St
Santa Ana, CA 92707
|
1,669 sq. feet
|
2 baths 3 beds |
show details | |

|
#36
Eastbridge St
Westminster, CA 92683
|
1,781 sq. feet
|
3 baths 3 beds |
show details | |

|
#37
Fanwood Dr
Huntington Beach, CA 92649
|
2,336 sq. feet
|
2 baths 3 beds |
show details | |

|
#38
W Berkeley St
Santa Ana, CA 92707
|
973 sq. feet
|
1 baths 3 beds |
show details | |

|
#39
Gabbett Dr
La Mirada, CA 90638
|
1,764 sq. feet
|
3 baths 4 beds |
show details | |

|
#40
Walnut Ave
Long Beach, CA 90807
|
1,912 sq. feet
|
3 baths 2 beds |
show details |
| Photo | Address | Area | Beds / Baths | Price | Details |
|---|---|---|---|---|---|

|
#41
Ibex Ave
Cerritos, CA 90703
|
2,424 sq. feet
|
3 baths 4 beds |
show details | |

|
#42
Ibbetson Ave
Lakewood, CA 90713
|
1,044 sq. feet
|
1 baths 3 beds |
show details | |

|
#43
Johnson Ave
Long Beach, CA 90805
|
1,252 sq. feet
|
2 baths 3 beds |
show details | |

|
#44
Del Amo Blvd
Lakewood, CA 90712
|
1,371 sq. feet
|
2 baths 4 beds |
show details | |

|
#45
Dittmar Dr
Whittier, CA 90603
|
1,094 sq. feet
|
1 baths 3 beds |
show details | |

|
#46
Riata St
Midway City, CA 92655
|
1,039 sq. feet
|
1 baths 3 beds |
show details | |

|
#47
Shady Ln
Laguna Beach, CA 92651
|
995 sq. feet
|
2 baths 3 beds |
show details | |

|
#48
Gettysburg Dr
Norwalk, CA 90650
|
1,136 sq. feet
|
1 baths 3 beds |
show details | |

|
#49
Spry St
Norwalk, CA 90650
|
1,142 sq. feet
|
1 baths 3 beds |
show details | |

|
Check over 1 million property listings on Foreclosure.com!
|
browse all offers | |||


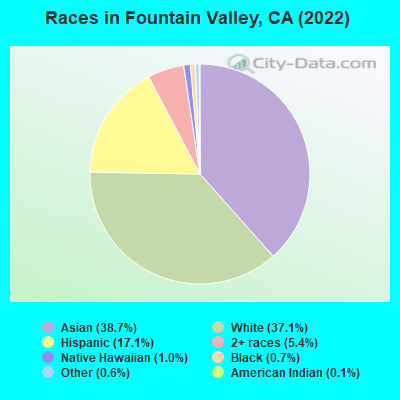
- 21,82438.7%Asian alone
- 20,90637.1%White alone
- 9,64517.1%Hispanic
- 3,0565.4%Two or more races
- 5401.0%Native Hawaiian and Other
Pacific Islander alone - 3800.7%Black alone
- 3320.6%Other race alone
- 760.1%American Indian alone
According to our research of California and other state lists, there were 25 registered sex offenders living in Fountain Valley, California as of April 27, 2024.
The ratio of all residents to sex offenders in Fountain Valley is 2,296 to 1.
The ratio of registered sex offenders to all residents in this city is much lower than the state average.
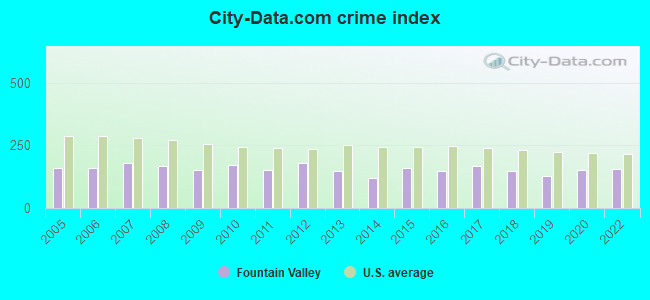
The City-Data.com crime index weighs serious crimes and violent crimes more heavily. Higher means more crime, U.S. average is 246.1. It adjusts for the number of visitors and daily workers commuting into cities.
- means the value is smaller than the state average.- means the value is about the same as the state average.
- means the value is bigger than the state average.
Crime rate in Fountain Valley detailed stats: murders, rapes, robberies, assaults, burglaries, thefts, arson
Full-time law enforcement employees in 2021, including police officers: 78 (58 officers - 48 male; 10 female).
| Officers per 1,000 residents here: | 1.05 |
| California average: | 2.30 |
 Recent articles from our blog. Our writers, many of them Ph.D. graduates or candidates, create easy-to-read articles on a wide variety of topics.


Latest news from Fountain Valley, CA collected exclusively by city-data.com from local newspapers, TV, and radio stations
Fountain Valley, CA City Guides:
Ancestries: English (3.8%), American (3.5%), Egyptian (3.2%), German (3.0%), European (2.8%), Irish (2.6%).
Current Local Time: PST time zone
Elevation: 28 feet
Land area: 8.91 square miles.
Population density: 6,275 people per square mile (high).
18,360 residents are foreign born (23.3% Asia, 4.4% Latin America).
| This city: | 32.6% |
| California: | 26.5% |
Median real estate property taxes paid for housing units with mortgages in 2022: $6,297 (0.6%)
Median real estate property taxes paid for housing units with no mortgage in 2022: $4,641 (0.5%)
Nearest city with pop. 200,000+: North Coast, CA (2.5 miles  , pop. 363,603).
Nearest city with pop. 1,000,000+: Los Angeles, CA (35.5 miles , pop. 3,694,820).
Nearest cities:
), ), )Latitude: 33.71 N, Longitude: 117.96 W
Daytime population change due to commuting: +1,780 (+3.2%)
Workers who live and work in this city: 6,311 (23.2%)
Area code commonly used in this area: 714
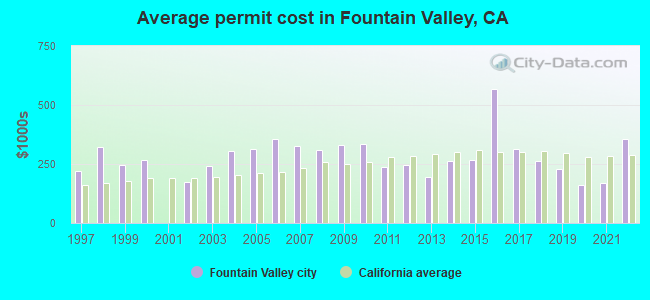
Single-family new house construction building permits:
- 2022: 63 buildings, average cost: $354,000
- 2021: 30 buildings, average cost: $168,600
- 2020: 39 buildings, average cost: $160,500
- 2019: 24 buildings, average cost: $228,400
- 2018: 11 buildings, average cost: $263,900
- 2017: 16 buildings, average cost: $314,600
- 2016: 8 buildings, average cost: $567,300
- 2015: 4 buildings, average cost: $264,700
- 2014: 7 buildings, average cost: $261,200
- 2013: 38 buildings, average cost: $192,900
- 2012: 32 buildings, average cost: $244,100
- 2011: 26 buildings, average cost: $238,800
- 2010: 3 buildings, average cost: $334,000
- 2009: 55 buildings, average cost: $331,200
- 2008: 68 buildings, average cost: $311,000
- 2007: 5 buildings, average cost: $328,000
- 2006: 2 buildings, average cost: $357,500
- 2005: 5 buildings, average cost: $313,800
- 2004: 9 buildings, average cost: $302,900
- 2003: 64 buildings, average cost: $240,900
- 2002: 3 buildings, average cost: $172,600
- 2000: 3 buildings, average cost: $265,400
- 1999: 2 buildings, average cost: $243,700
- 1998: 1 building, cost: $323,000
- 1997: 58 buildings, average cost: $218,700
| Here: | 3.6% |
| California: | 5.1% |
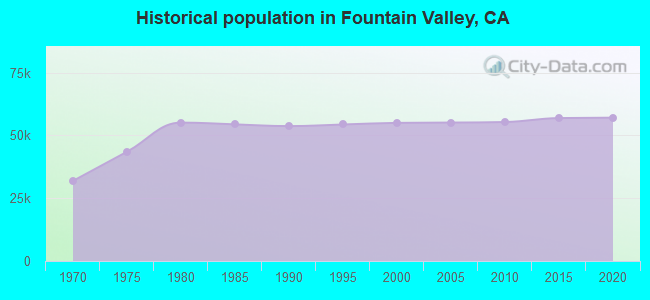
Population change in the 1990s: +1,039 (+1.9%).
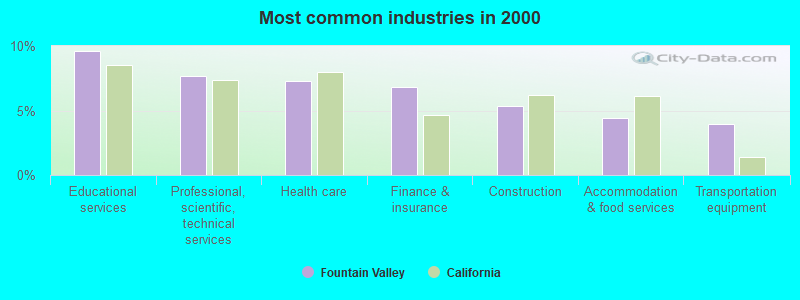
- Educational services (9.6%)
- Professional, scientific, technical services (7.7%)
- Health care (7.3%)
- Finance & insurance (6.8%)
- Construction (5.4%)
- Accommodation & food services (4.4%)
- Transportation equipment (4.0%)
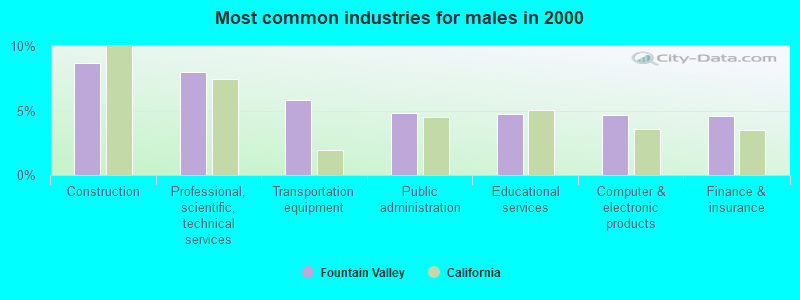
- Construction (8.7%)
- Professional, scientific, technical services (8.0%)
- Transportation equipment (5.8%)
- Public administration (4.8%)
- Educational services (4.8%)
- Computer & electronic products (4.7%)
- Finance & insurance (4.6%)
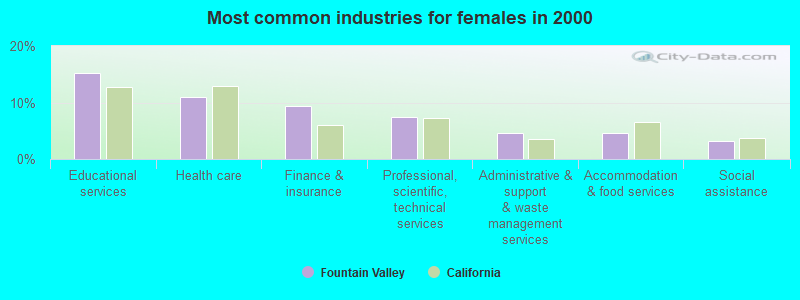
- Educational services (15.2%)
- Health care (11.0%)
- Finance & insurance (9.4%)
- Professional, scientific, technical services (7.4%)
- Administrative & support & waste management services (4.6%)
- Accommodation & food services (4.6%)
- Social assistance (3.2%)
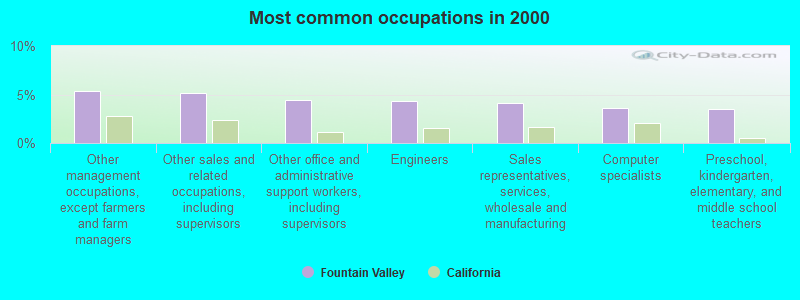
- Other management occupations, except farmers and farm managers (5.3%)
- Other sales and related occupations, including supervisors (5.1%)
- Other office and administrative support workers, including supervisors (4.4%)
- Engineers (4.4%)
- Sales representatives, services, wholesale and manufacturing (4.2%)
- Computer specialists (3.6%)
- Preschool, kindergarten, elementary, and middle school teachers (3.5%)
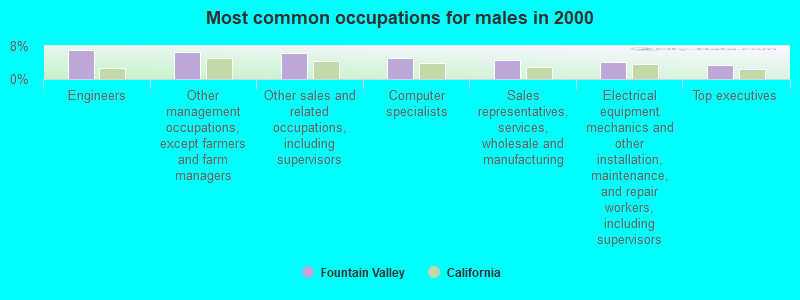
- Engineers (7.1%)
- Other management occupations, except farmers and farm managers (6.5%)
- Other sales and related occupations, including supervisors (6.2%)
- Computer specialists (5.2%)
- Sales representatives, services, wholesale and manufacturing (4.7%)
- Electrical equipment mechanics and other installation, maintenance, and repair workers, including supervisors (4.1%)
- Top executives (3.5%)
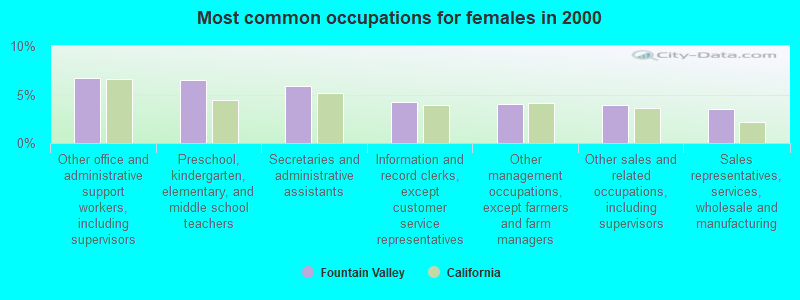
- Other office and administrative support workers, including supervisors (6.7%)
- Preschool, kindergarten, elementary, and middle school teachers (6.5%)
- Secretaries and administrative assistants (5.9%)
- Information and record clerks, except customer service representatives (4.2%)
- Other management occupations, except farmers and farm managers (4.0%)
- Other sales and related occupations, including supervisors (3.9%)
- Sales representatives, services, wholesale and manufacturing (3.5%)
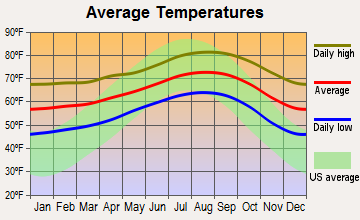
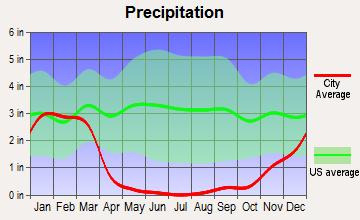
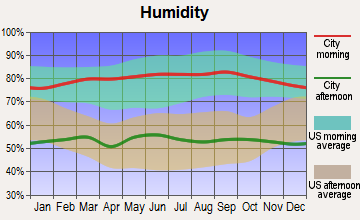
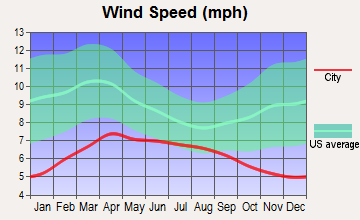
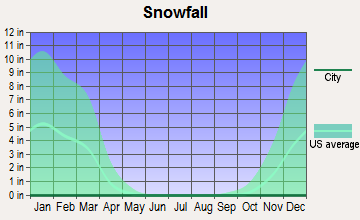
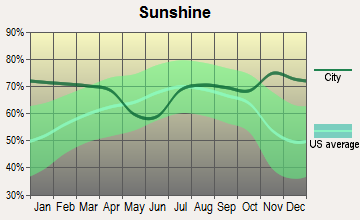
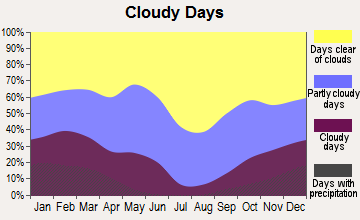
Average climate in Fountain Valley, California
Based on data reported by over 4,000 weather stations
|
|

(lower is better)
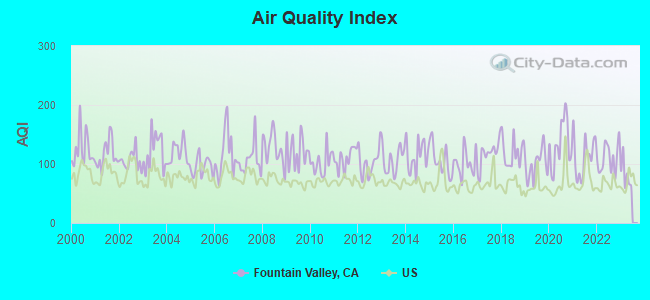
Air Quality Index (AQI) level in 2022 was 110. This is significantly worse than average.
| City: | 110 |
| U.S.: | 73 |
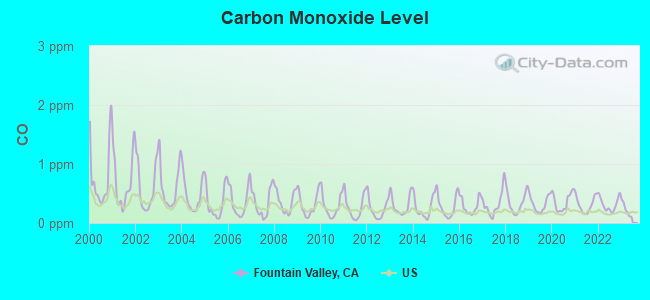
Carbon Monoxide (CO) [ppm] level in 2022 was 0.317. This is worse than average. Closest monitor was 2.9 miles away from the city center.
| City: | 0.317 |
| U.S.: | 0.251 |
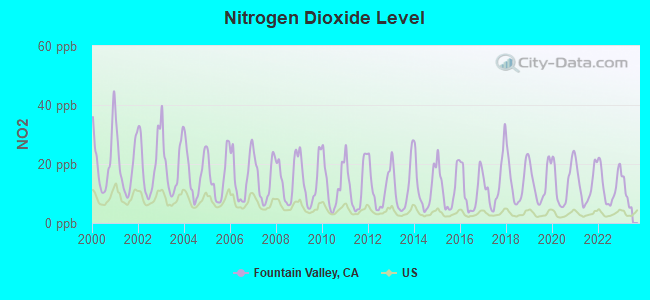
Nitrogen Dioxide (NO2) [ppb] level in 2022 was 12.7. This is significantly worse than average. Closest monitor was 2.9 miles away from the city center.
| City: | 12.7 |
| U.S.: | 5.1 |
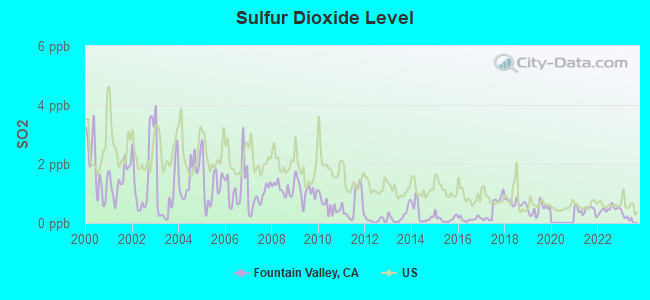
Sulfur Dioxide (SO2) [ppb] level in 2022 was 0.466. This is significantly better than average. Closest monitor was 2.9 miles away from the city center.
| City: | 0.466 |
| U.S.: | 1.515 |
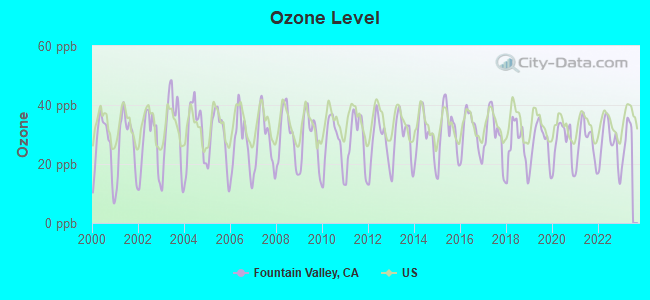
Ozone [ppb] level in 2022 was 26.9. This is better than average. Closest monitor was 2.9 miles away from the city center.
| City: | 26.9 |
| U.S.: | 33.3 |
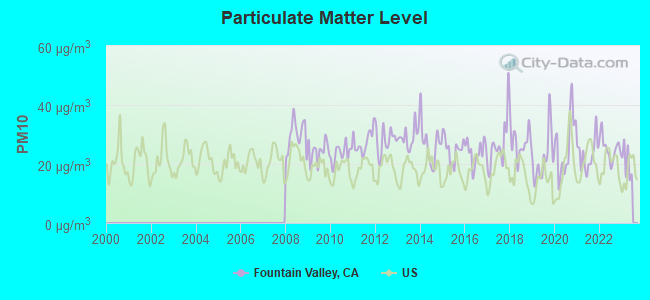
Particulate Matter (PM10) [µg/m3] level in 2022 was 25.3. This is worse than average. Closest monitor was 5.5 miles away from the city center.
| City: | 25.3 |
| U.S.: | 19.2 |
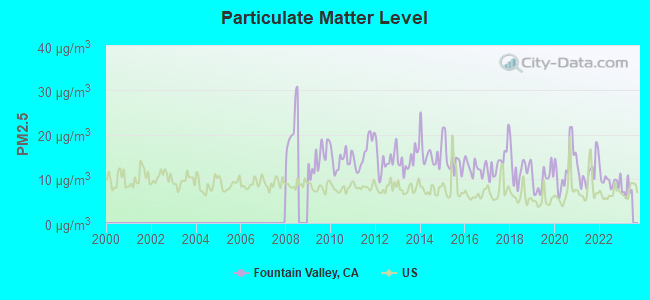
Particulate Matter (PM2.5) [µg/m3] level in 2022 was 9.66. This is about average. Closest monitor was 8.2 miles away from the city center.
| City: | 9.66 |
| U.S.: | 8.11 |

Lead (Pb) [µg/m3] level in 2013 was 0.00274. This is significantly better than average. Closest monitor was 3.9 miles away from the city center.
| City: | 0.00274 |
| U.S.: | 0.00931 |
Earthquake activity:
Fountain Valley-area historical earthquake activity is significantly above California state average. It is 6758% greater than the overall U.S. average.On 7/21/1952 at 11:52:14, a magnitude 7.7 (7.7 UK, Class: Major, Intensity: VIII - XII) earthquake occurred 107.4 miles away from the city center, causing $50,000,000 total damage
On 6/28/1992 at 11:57:34, a magnitude 7.6 (6.2 MB, 7.6 MS, 7.3 MW, Depth: 0.7 mi) earthquake occurred 88.1 miles away from the city center, causing 3 deaths (1 shaking deaths, 2 other deaths) and 400 injuries, causing $100,000,000 total damage and $40,000,000 insured losses
On 10/16/1999 at 09:46:44, a magnitude 7.4 (6.3 MB, 7.4 MS, 7.2 MW, 7.3 ML) earthquake occurred 103.4 miles away from Fountain Valley center
On 11/4/1927 at 13:51:53, a magnitude 7.5 (7.5 UK) earthquake occurred 194.5 miles away from Fountain Valley center
On 4/21/1918 at 22:32:30, a magnitude 6.8 (6.8 UK, Class: Strong, Intensity: VII - IX) earthquake occurred 30.5 miles away from the city center
On 5/19/1940 at 04:36:40, a magnitude 7.2 (7.2 UK) earthquake occurred 134.6 miles away from Fountain Valley center, causing $33,000,000 total damage
Magnitude types: body-wave magnitude (MB), local magnitude (ML), surface-wave magnitude (MS), moment magnitude (MW)
Natural disasters:
The number of natural disasters in Orange County (32) is a lot greater than the US average (15).Major Disasters (Presidential) Declared: 22
Emergencies Declared: 2
Causes of natural disasters: Floods: 15, Fires: 13, Storms: 9, Landslides: 6, Winter Storms: 6, Mudslides: 5, Earthquakes: 2, Heavy Rain: 1, Hurricane: 1, Snow: 1, Tornado: 1, Wind: 1, Other: 1 (Note: some incidents may be assigned to more than one category).
Main business address for: HYUNDAI ABS FUNDING CORP (ASSET-BACKED SECURITIES), CAM COMMERCE SOLUTIONS INC (SERVICES-COMPUTER INTEGRATED SYSTEMS DESIGN).
Hospitals and medical centers in Fountain Valley:
- CHARTER HOSPITAL OF FOUNTAIN VALLEY (11250 WARNER AVE)
- ENRICHING, INC (9514 SMOKETREE AVENUE)
- FOUNTAIN VALLEY REGIONAL HOSPITAL & MEDICAL CENTER (Proprietary, provides emergency services, 17100 EUCLID STREET)
- ORANGE COAST MEMORIAL MEDICAL CENTER (Proprietary, 9920 TALBERT AVENUE)
- FOUNTAIN VALLEY REG HOSPMED CTR DP/SNF (11250 WARNER AVE)
- MANORCARE HEALTH SERVICES (FOUNTAIN VALLEY) (11680 WARNER AVENUE)
- FOUNTAIN VALLEY REGIONAL DIALYSIS CENTER (17150 EUCLID STREET, SUITE 111)
- RAI-NEWHOPE-FOUNTAIN VALLEY (17197 NEWHOPE STREET, SUITE A, B, C & D)
- HEALTH FORCE OR ORANGE COUNTY (17151 NEWHOPE ST, SUITE 211)
- SUNRISE HOME HEALTH CARE LLC (10840 WARNER AVE SUITE 105)
Heliports located in Fountain Valley:
Amtrak stations near Fountain Valley:
- 7 miles: SANTA ANA (1000 E. SANTA ANA BLVD.) . Services: ticket office, fully wheelchair accessible, enclosed waiting area, public restrooms, public payphones, snack bar, free short-term parking, free long-term parking, call for car rental service, taxi stand, intercity bus service, public transit connection.
- 8 miles: ANAHEIM (2150 KATELLA AVE.) . Services: ticket office, fully wheelchair accessible, enclosed waiting area, public restrooms, public payphones, vending machines, free short-term parking, free long-term parking, call for car rental service, call for taxi service.
- 9 miles: NEWPORT BEACH (NEWPORT TRANS. CENTER, 1550 AVOCADO AVE.) - Bus Station . Services: fully wheelchair accessible, public payphones, public transit connection.
Colleges/Universities in Fountain Valley:
- Coastline Community College (Full-time enrollment: 4,591; Location: 11460 Warner Ave.; Public; Website: www.coastline.edu)
- Modern Technology School (Full-time enrollment: 209; Location: 16560 Harbor Blvd., Units K-Q; Private, for-profit; Website: www.mtschool.edu)
- Coastline Beauty College (Full-time enrollment: 152; Location: 16151 Harbor Blvd; Private, for-profit; Website: www.coastlinebeauty.edu)
Other colleges/universities with over 2000 students near Fountain Valley:
- Golden West College (about 4 miles; Huntington Beach, CA; Full-time enrollment: 7,358)
- Orange Coast College (about 4 miles; Costa Mesa, CA; FT enrollment: 12,918)
- University of Phoenix-Southern California Campus (about 5 miles; Costa Mesa, CA; FT enrollment: 8,110)
- Vanguard University of Southern California (about 5 miles; Costa Mesa, CA; FT enrollment: 2,104)
- Santa Ana College (about 6 miles; Santa Ana, CA; FT enrollment: 11,756)
- West Coast University-Orange County (about 8 miles; Anaheim, CA; FT enrollment: 2,464)
- University of California-Irvine (about 8 miles; Irvine, CA; FT enrollment: 28,587)
Public high schools in Fountain Valley:
- FOUNTAIN VALLEY HIGH (Students: 2,359, Location: 17816 BUSHARD, Grades: 9-12)
- LOS AMIGOS HIGH (Students: 1,634, Location: 16566 NEWHOPE ST., Grades: 9-12)
- VALLEY VISTA HIGH (CONTINUATION) (Students: 107, Location: 9600 DOLPHIN ST., Grades: 9-12)
Private high school in Fountain Valley:
Biggest public elementary/middle schools in Fountain Valley:
- MASUDA (KAZUO) MIDDLE (Students: 799, Location: 17415 LOS JARDINES W., Grades: 6-8)
- FULTON (HARRY C.) MIDDLE (Students: 780, Location: 8778 EL LAGO ST., Grades: 6-8)
- VISTA VIEW MIDDLE (Students: 747, Location: 16250 HICKORY ST., Grades: 6-8)
- ETHAN B. ALLEN ELEMENTARY (Students: 536, Location: 16200 BUSHARD ST., Grades: KG-6)
- COX (JAMES H.) ELEMENTARY (Students: 478, Location: 17615 LOS JARDINES E., Grades: KG-5)
- COURREGES (ROCH) ELEMENTARY (Students: 437, Location: 18313 SANTA CARLOTTA, Grades: KG-5)
- GISLER (ROBERT) ELEMENTARY (Students: 339, Location: 18720 LAS FLORES ST., Grades: KG-5)
- MAMIE L. NORTHCUTT ELEMENTARY (Students: 322, Location: 11303 SANDSTONE ST., Grades: KG-6)
- PLAVAN (URBAIN H.) ELEMENTARY (Students: 274, Location: 9675 WARNER AVE., Grades: KG-5)
- TAMURA (HISAMATSU) ELEMENTARY (Students: 274, Location: 17340 SANTA SUZANNE ST., Grades: KG-5)
Private elementary/middle schools in Fountain Valley:
Points of interest:
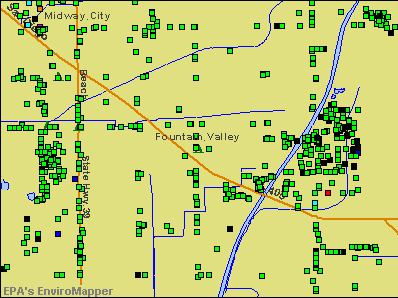
Notable locations in Fountain Valley: Fountain Valley Commerce Center (A), Mile Square Golf Course (B), David L Baker Golf Course (C), Fountain Valley Branch Orange County Public Library (D), Fountain Valley Fire Station 2 (E), Fountain Valley Fire Department Station 1 (F), Fountain Valley Recreational and Cultural Center (G), Fountain Valley City Hall (H). Display/hide their locations on the map
Shopping Centers: Warner Plaza Shopping Center (1), Brookhurst Plaza Shopping Center (2), Plavan Plaza Shopping Center (3), Fountain Shopping Center (4), Fountain Valley Promenade Shopping Center (5), Fountain Valley Plaza Shopping Center (6), Callens Corner Shopping Center (7). Display/hide their locations on the map
Main business address in Fountain Valley include: HYUNDAI ABS FUNDING CORP (A), CAM COMMERCE SOLUTIONS INC (B). Display/hide their locations on the map
Parks in Fountain Valley include: Ellis Park (1), Green Valley Park (2), Heritage Park (3), Los Alamos Park (4), Allen Park (5), Cordata Park (6), Courreges Park (7), Fountain Valley Park (8), Fulton Park (9). Display/hide their locations on the map
Tourist attraction: Casa de Tortuga (10455 Circulo De Zapata).
Birthplace of: Jack Evans - Professional wrestler, Keri Russell - (born 1976), actress, Andre Sommersell - 2005 NFL player (Indianapolis Colts, born: Jun 26, 1980), Brian Brushwood - Magician, Craig Wilson - 2005 Major League Baseball player (Pittsburgh Pirates, born: Nov 30, 1976), Freddie Freeman - Baseball player, Iakopo - Recording artist, Luke Hudson - 2005 Major League Baseball player (Cincinnati Reds, born: May 2, 1977), Mike Hessman - Baseball player, Ryan Hansen - Television actor.
| This city: | 2.9 people |
| California: | 2.9 people |
| This city: | 76.2% |
| Whole state: | 68.7% |
| This city: | 4.0% |
| Whole state: | 7.2% |
Likely homosexual households (counted as self-reported same-sex unmarried-partner households)
- Lesbian couples: 0.4% of all households
- Gay men: 0.2% of all households
People in group quarters in Fountain Valley in 2010:
- 160 people in nursing facilities/skilled-nursing facilities
- 154 people in group homes intended for adults
- 51 people in workers' group living quarters and job corps centers
- 47 people in other noninstitutional facilities
- 8 people in in-patient hospice facilities
- 6 people in group homes for juveniles (non-correctional)
- 6 people in residential treatment centers for juveniles (non-correctional)
- 5 people in residential treatment centers for adults
People in group quarters in Fountain Valley in 2000:
- 174 people in other nonhousehold living situations
- 167 people in nursing homes
- 155 people in other noninstitutional group quarters
- 6 people in other group homes
- 4 people in homes for the mentally retarded
- 4 people in religious group quarters
- 2 people in hospitals/wards and hospices for chronically ill
- 2 people in other hospitals or wards for chronically ill
Banks with most branches in Fountain Valley (2011 data):
- Wells Fargo Bank, National Association: Brookhurst-Edinger Branch at 16025 Brookhurst Street, branch established on 1974/03/01; Fountain Valley Branch at 10060 Slater Ave, branch established on 1938/01/01. Info updated 2011/04/05: Bank assets: $1,161,490.0 mil, Deposits: $905,653.0 mil, headquarters in Sioux Falls, SD, positive income, 6395 total offices, Holding Company: Wells Fargo & Company
- Bank of America, National Association: Harbor-Edinger Branch at 16192 Harbor Boulevard, branch established on 1970/09/24; Fountain Valley Branch at 17430 Brookhurst Street, branch established on 1964/01/16. Info updated 2009/11/18: Bank assets: $1,451,969.3 mil, Deposits: $1,077,176.8 mil, headquarters in Charlotte, NC, positive income, 5782 total offices, Holding Company: Bank Of America Corporation
- JPMorgan Chase Bank, National Association: Fountain Valley At Costco at 17870 Newhope Street, Suite 106, branch established on 2005/12/05; Fountain Valley Branch at 18975 Brookhurst Avenue, branch established on 1889/01/01. Info updated 2011/11/10: Bank assets: $1,811,678.0 mil, Deposits: $1,190,738.0 mil, headquarters in Columbus, OH, positive income, International Specialization, 5577 total offices, Holding Company: Jpmorgan Chase & Co.
- U.S. Bank National Association: Brookhurst & Edinger Albertsons at 16061 Brookhurst Street, branch established on 2008/10/20; Fountain Valley Branch at 17150 Magnolia Street, branch established on 1957/10/16. Info updated 2012/01/30: Bank assets: $330,470.8 mil, Deposits: $236,091.5 mil, headquarters in Cincinnati, OH, positive income, 3121 total offices, Holding Company: U.S. Bancorp
- Independence Bank: Fountain Valley Branch at 18101 Magnolia Street, branch established on 2007/01/17. Info updated 2009/11/06: Bank assets: $294.2 mil, Deposits: $208.7 mil, headquarters in Newport Beach, CA, positive income, Commercial Lending Specialization, 4 total offices
- Cathay Bank: Fountain Valley Branch at 17860 Newhope Street, Suite 104, branch established on 2005/08/22. Info updated 2010/12/08: Bank assets: $10,628.9 mil, Deposits: $7,249.8 mil, headquarters in Los Angeles, CA, positive income, Commercial Lending Specialization, 52 total offices, Holding Company: Cathay General Bancorp
- Centennial Bank: at 18837 Brookhurst Street, Suite 100, branch established on 1979/10/25. Info updated 2007/05/14: Bank assets: $657.6 mil, Deposits: $457.9 mil, local headquarters, positive income, Commercial Lending Specialization, 1 total offices
- Union Bank, National Association: Fountain Valley Branch at 18175 Brookhurst Street, branch established on 1990/06/14. Info updated 2011/09/01: Bank assets: $88,967.5 mil, Deposits: $65,286.4 mil, headquarters in San Francisco, CA, positive income, Commercial Lending Specialization, 403 total offices, Holding Company: Mitsubishi Ufj Financial Group, Inc.
- Citibank, National Association: Fountain Valley Branch at 17400 Brookhurst Drive, branch established on 1934/12/17. Info updated 2012/01/10: Bank assets: $1,288,658.0 mil, Deposits: $882,541.0 mil, headquarters in Sioux Falls, SD, positive income, International Specialization, 1048 total offices, Holding Company: Citigroup Inc.
For population 15 years and over in Fountain Valley:
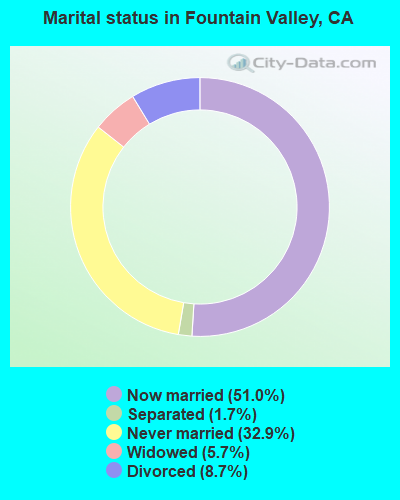
- Never married: 32.9%
- Now married: 51.0%
- Separated: 1.7%
- Widowed: 5.7%
- Divorced: 8.7%
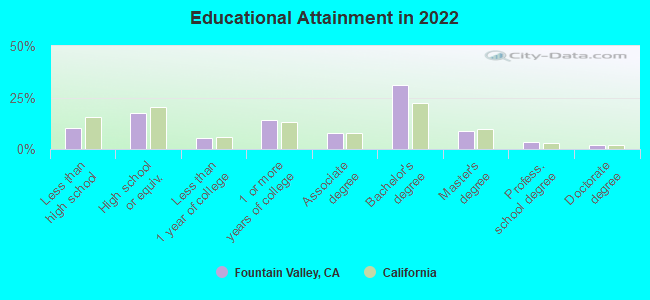
For population 25 years and over in Fountain Valley:
- High school or higher: 90.4%
- Bachelor's degree or higher: 43.8%
- Graduate or professional degree: 13.3%
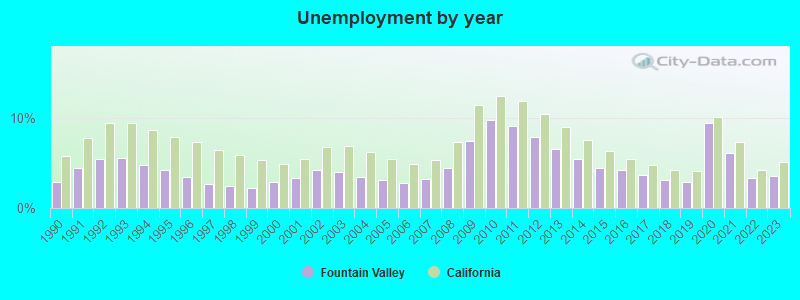
- Unemployed: 4.8%
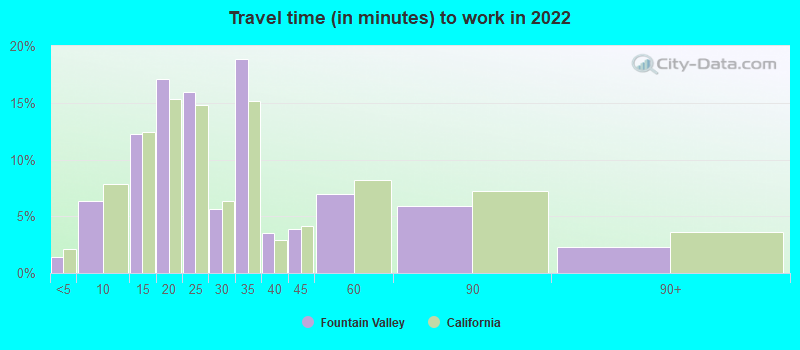
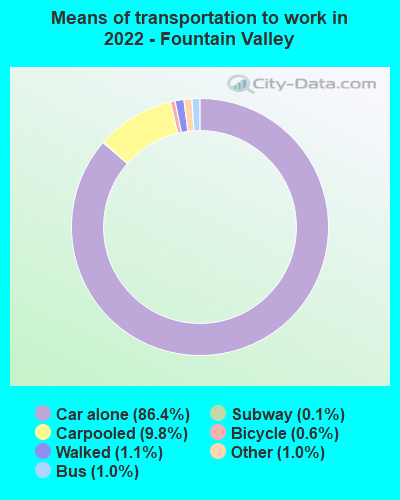
- Mean travel time to work (commute): 21.0 minutes
| Here: | 13.1 |
| California average: | 15.5 |


Graphs represent county-level data. Detailed 2008 Election Results
Political contributions by individuals in Fountain Valley, CA
Religion statistics for Fountain Valley, CA (based on Orange County data)


| Religion | Adherents | Congregations |
|---|---|---|
| Catholic | 797,473 | 67 |
| Evangelical Protestant | 345,893 | 894 |
| Other | 141,815 | 329 |
| Mainline Protestant | 76,574 | 202 |
| Orthodox | 13,406 | 19 |
| Black Protestant | 2,424 | 8 |
| None | 1,632,647 | - |
Food Environment Statistics:
| Orange County: | 1.78 / 10,000 pop. |
| State: | 2.14 / 10,000 pop. |
| Orange County: | 0.06 / 10,000 pop. |
| California: | 0.04 / 10,000 pop. |
| Orange County: | 0.49 / 10,000 pop. |
| California: | 0.62 / 10,000 pop. |
| This county: | 1.46 / 10,000 pop. |
| State: | 1.49 / 10,000 pop. |
| This county: | 8.19 / 10,000 pop. |
| California: | 7.42 / 10,000 pop. |
| Orange County: | 6.3% |
| State: | 7.3% |
| Here: | 18.5% |
| California: | 21.3% |
| Here: | 16.4% |
| State: | 17.9% |
Health and Nutrition:
| This city: | 53.6% |
| California: | 49.4% |
| Here: | 50.9% |
| California: | 48.0% |
| Fountain Valley: | 27.5 |
| State: | 28.1 |
| This city: | 18.8% |
| California: | 20.2% |
| Here: | 13.3% |
| State: | 11.2% |
| This city: | 6.8 |
| State: | 6.8 |
| Here: | 30.6% |
| State: | 31.5% |
| Fountain Valley: | 58.4% |
| California: | 56.4% |
| Here: | 80.7% |
| California: | 80.9% |
More about Health and Nutrition of Fountain Valley, CA Residents
| Local government employment and payroll (March 2022) | |||||
| Function | Full-time employees | Monthly full-time payroll | Average yearly full-time wage | Part-time employees | Monthly part-time payroll |
|---|---|---|---|---|---|
| Police Protection - Officers | 62 | $683,094 | $132,212 | 0 | $0 |
| Firefighters | 41 | $568,343 | $166,344 | 0 | $0 |
| Police - Other | 23 | $140,038 | $73,063 | 9 | $14,665 |
| Water Supply | 18 | $126,039 | $84,026 | 0 | $0 |
| Other Government Administration | 16 | $126,181 | $94,636 | 1 | $554 |
| Streets and Highways | 13 | $101,915 | $94,075 | 0 | $0 |
| Financial Administration | 12 | $97,612 | $97,612 | 0 | $0 |
| Parks and Recreation | 10 | $74,790 | $89,748 | 29 | $31,494 |
| Other and Unallocable | 9 | $59,420 | $79,227 | 0 | $0 |
| Sewerage | 4 | $28,888 | $86,664 | 0 | $0 |
| Fire - Other | 4 | $34,248 | $102,744 | 0 | $0 |
| Housing and Community Development (Local) | 2 | $17,371 | $104,226 | 0 | $0 |
| Solid Waste Management | 1 | $7,048 | $84,576 | 0 | $0 |
| Health | 1 | $10,365 | $124,380 | 0 | $0 |
| Welfare | 0 | $0 | 1 | $1,461 | |
| Totals for Government | 216 | $2,075,353 | $115,297 | 40 | $48,174 |
Fountain Valley government finances - Expenditure in 2021 (per resident):
- Construction - General - Other: $3,859,000 ($69.00)
Parks and Recreation: $1,435,000 ($25.66)
Housing and Community Development: $260,000 ($4.65)
Police Protection: $211,000 ($3.77)
Regular Highways: $76,000 ($1.36)
- Current Operations - Police Protection: $18,508,000 ($330.91)
Water Utilities: $13,243,000 ($236.78)
Regular Highways: $10,332,000 ($184.73)
Local Fire Protection: $8,687,000 ($155.32)
Central Staff Services: $8,631,000 ($154.32)
Health - Other: $5,401,000 ($96.57)
Parks and Recreation: $4,287,000 ($76.65)
Solid Waste Management: $3,730,000 ($66.69)
Protective Inspection and Regulation - Other: $1,686,000 ($30.14)
Housing and Community Development: $870,000 ($15.56)
Sewerage: $849,000 ($15.18)
General - Other: $159,000 ($2.84)
- General - Interest on Debt: $3,129,000 ($55.94)
- Water Utilities - Interest on Debt: $449,000 ($8.03)
Fountain Valley government finances - Revenue in 2021 (per resident):
- Charges - Other: $10,510,000 ($187.91)
Solid Waste Management: $3,753,000 ($67.10)
Sewerage: $2,385,000 ($42.64)
Parks and Recreation: $157,000 ($2.81)
- Federal Intergovernmental - Housing and Community Development: $514,000 ($9.19)
Other: $269,000 ($4.81)
- Local Intergovernmental - Other: $2,214,000 ($39.59)
Water Utilities: $98,000 ($1.75)
- Miscellaneous - General Revenue - Other: $7,011,000 ($125.35)
Interest Earnings: $2,430,000 ($43.45)
Rents: $733,000 ($13.11)
Fines and Forfeits: $643,000 ($11.50)
Donations From Private Sources: $108,000 ($1.93)
Sale of Property: $5,000 ($0.09)
- Revenue - Water Utilities: $19,434,000 ($347.47)
- State Intergovernmental - Other: $2,830,000 ($50.60)
Highways: $2,292,000 ($40.98)
General Local Government Support: $57,000 ($1.02)
- Tax - General Sales and Gross Receipts: $28,802,000 ($514.97)
Property: $20,931,000 ($374.24)
Other License: $1,976,000 ($35.33)
Public Utilities Sales: $1,972,000 ($35.26)
Other Selective Sales: $914,000 ($16.34)
Occupation and Business License - Other: $465,000 ($8.31)
Documentary and Stock Transfer: $312,000 ($5.58)
Fountain Valley government finances - Debt in 2021 (per resident):
- Long Term Debt - Beginning Outstanding - Unspecified Public Purpose: $67,361,000 ($1204.38)
Outstanding Unspecified Public Purpose: $63,142,000 ($1128.95)
Retired Unspecified Public Purpose: $4,218,000 ($75.42)
Fountain Valley government finances - Cash and Securities in 2021 (per resident):
- Bond Funds - Cash and Securities: $23,000 ($0.41)
- Other Funds - Cash and Securities: $98,541,000 ($1761.86)
- Sinking Funds - Cash and Securities: $625,000 ($11.17)
4.86% of this county's 2021 resident taxpayers lived in other counties in 2020 ($95,983 average adjusted gross income)
| Here: | 4.86% |
| California average: | 5.19% |
0.01% of residents moved from foreign countries ($132 average AGI)
Orange County: 0.01% California average: 0.03%
Top counties from which taxpayers relocated into this county between 2020 and 2021:
| from Los Angeles County, CA | |
| from Riverside County, CA | |
| from San Diego County, CA |
5.71% of this county's 2020 resident taxpayers moved to other counties in 2021 ($106,828 average adjusted gross income)
| Here: | 5.71% |
| California average: | 6.14% |
0.01% of residents moved to foreign countries ($180 average AGI)
Orange County: 0.01% California average: 0.02%
Top counties to which taxpayers relocated from this county between 2020 and 2021:
| to Los Angeles County, CA | |
| to Riverside County, CA | |
| to San Diego County, CA |
| Businesses in Fountain Valley, CA | ||||
| Name | Count | Name | Count | |
|---|---|---|---|---|
| 24 Hour Fitness | 1 | Jamba Juice | 1 | |
| 7-Eleven | 5 | Jones New York | 3 | |
| Albertsons | 2 | KFC | 1 | |
| Applebee's | 1 | Kroger | 2 | |
| Ashley Furniture | 1 | LA Fitness | 1 | |
| AutoZone | 1 | Little Caesars Pizza | 1 | |
| Baskin-Robbins | 1 | Marriott | 2 | |
| Blockbuster | 1 | MasterBrand Cabinets | 10 | |
| Burger King | 1 | McDonald's | 1 | |
| CVS | 2 | New Balance | 1 | |
| Carl\s Jr. | 2 | Nike | 11 | |
| Chipotle | 1 | Office Depot | 1 | |
| Circle K | 1 | Panda Express | 1 | |
| Costco | 1 | PetSmart | 1 | |
| Curves | 2 | Quiznos | 1 | |
| Days Inn | 1 | RadioShack | 1 | |
| Decora Cabinetry | 1 | Rite Aid | 2 | |
| Dennys | 1 | Sam's Club | 1 | |
| Discount Tire | 2 | Sprint Nextel | 1 | |
| DressBarn | 1 | Staples | 1 | |
| Dressbarn | 1 | Starbucks | 5 | |
| El Pollo Loco | 1 | T-Mobile | 4 | |
| FedEx | 7 | T.J.Maxx | 1 | |
| Firestone Complete Auto Care | 1 | Taco Bell | 3 | |
| GNC | 1 | UPS | 8 | |
| GameStop | 2 | Walgreens | 3 | |
| Goodwill | 1 | Wendy's | 1 | |
| H&R Block | 2 | |||
Strongest AM radio stations in Fountain Valley:
- KFI (640 AM; 50 kW; LOS ANGELES, CA; Owner: CAPSTAR TX LIMITED PARTNERSHIP)
- KVNR (1480 AM; 5 kW; SANTA ANA, CA; Owner: LBI RADIO LICENSE CORP.)
- KLAC (570 AM; 50 kW; LOS ANGELES, CA; Owner: AMFM RADIO LICENSES, L.L.C.)
- KTNQ (1020 AM; 50 kW; LOS ANGELES, CA; Owner: KTNQ-AM LICENSE CORP.)
- KPLS (830 AM; 50 kW; ORANGE, CA; Owner: CRN LICENSES, LLC)
- KXTA (1150 AM; 50 kW; LOS ANGELES, CA; Owner: CITICASTERS LICENSES, L.P.)
- KNX (1070 AM; 50 kW; LOS ANGELES, CA; Owner: INFINITY BROADCASTING OPERATIONS, INC.)
- KFWB (980 AM; 50 kW; LOS ANGELES, CA; Owner: INFINITY BROADCASTING OPERATIONS, INC.)
- KDIS (1110 AM; 50 kW; PASADENA, CA; Owner: ABC,INC.)
- KMPC (1540 AM; 50 kW; LOS ANGELES, CA; Owner: ROSE CITY RADIO CORPORATION)
- KSPN (710 AM; 50 kW; LOS ANGELES, CA; Owner: KABC-AM RADIO, INC.)
- KBLA (1580 AM; 50 kW; SANTA MONICA, CA)
- KXMX (1190 AM; 25 kW; ANAHEIM, CA; Owner: NEW INSPIRATION BROADCASTING COMPANY)
Strongest FM radio stations in Fountain Valley:
- KDLE (103.1 FM; NEWPORT BEACH, CA; Owner: ENTRAVISION HOLDINGS, LLC.)
- KWVE (107.9 FM; SAN CLEMENTE, CA; Owner: CALVARY CHAPEL OF COSTA MESA)
- KCBS-FM (93.1 FM; LOS ANGELES, CA; Owner: INFINITY BROADCASTING OPERATIONS, INC.)
- KZLA-FM (93.9 FM; LOS ANGELES, CA; Owner: EMMIS RADIO LICENSE CORPORATION)
- KPWR (105.9 FM; LOS ANGELES, CA; Owner: EMMIS RADIO LICENSE CORPORATION)
- KLSX (97.1 FM; LOS ANGELES, CA; Owner: INFINITY BROADCASTING OPERATIONS, INC.)
- KUSC (91.5 FM; LOS ANGELES, CA; Owner: UNIVERSITY OF SOUTHERN CALIFORNIA)
- KSCA (101.9 FM; GLENDALE, CA; Owner: HBC LICENSE CORPORATION)
- KALI-FM (106.3 FM; SANTA ANA, CA; Owner: KALI-FM, INC.)
- KLOS (95.5 FM; LOS ANGELES, CA; Owner: KLOS-FM RADIO, INC.)
- K212FA (90.3 FM; TEMPLE CITY, CA; Owner: EDUCATIONAL MEDIA FOUNDATION)
- KOST (103.5 FM; LOS ANGELES, CA; Owner: CAPSTAR TX LIMITED PARTNERSHIP)
- KKLA-FM (99.5 FM; LOS ANGELES, CA; Owner: NEW INSPIRATION BROADCASTING CO., INC.)
- KLVE (107.5 FM; LOS ANGELES, CA; Owner: KLVE-FM LICENSE CORP.)
- KIIS-FM (102.7 FM; LOS ANGELES, CA; Owner: CITICASTERS LICENSES, L.P.)
- KRTH-FM (101.1 FM; LOS ANGELES, CA; Owner: INFINITY BROADCASTING OPERATIONS, INC.)
- KPCC (89.3 FM; PASADENA, CA; Owner: PASADENA AREA COMMUNITY COLLEGE DISTRICT)
- KHHT (92.3 FM; LOS ANGELES, CA; Owner: AMFM RADIO LICENSES, L.L.C.)
- KBIG-FM (104.3 FM; LOS ANGELES, CA; Owner: AMFM RADIO LICENSES, L.L.C.)
- KMZT-FM (105.1 FM; LOS ANGELES, CA; Owner: MOUNT WILSON FM BROADCASTERS, INC.)
TV broadcast stations around Fountain Valley:
- KTRO-LP (Channel 50; LANCASTER, CA; Owner: ROBERT D. ADELMAN)
- KCBS-TV (Channel 2; LOS ANGELES, CA; Owner: CBS BROADCASTING INC.)
- National Bridge Inventory (NBI) Statistics
- 24Number of bridges
- 341ft / 104mTotal length
- 2,704,300Total average daily traffic
- 155,759Total average daily truck traffic
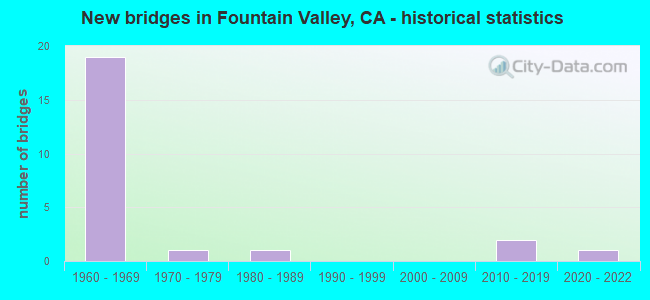
- New bridges - historical statistics
- 191960-1969
- 11970-1979
- 11980-1989
- 22010-2019
- 12020-2022
FCC Registered Private Land Mobile Towers: 1 (See the full list of FCC Registered Private Land Mobile Towers in Fountain Valley, CA)
FCC Registered Broadcast Land Mobile Towers: 31 (See the full list of FCC Registered Broadcast Land Mobile Towers)
FCC Registered Microwave Towers: 49 (See the full list of FCC Registered Microwave Towers in this town)
FCC Registered Amateur Radio Licenses: 607 (See the full list of FCC Registered Amateur Radio Licenses in Fountain Valley)
FAA Registered Aircraft Manufacturers and Dealers: 4 (See the full list of FAA Registered Manufacturers and Dealers in Fountain Valley)
FAA Registered Aircraft: 30 (See the full list of FAA Registered Aircraft)
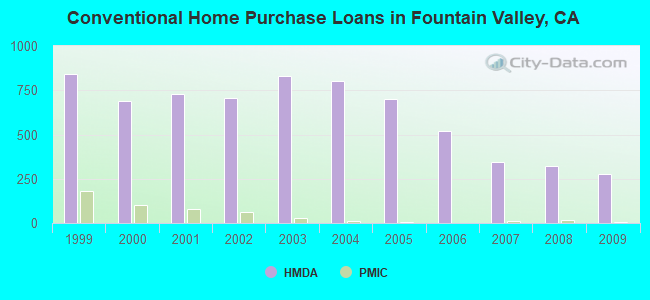
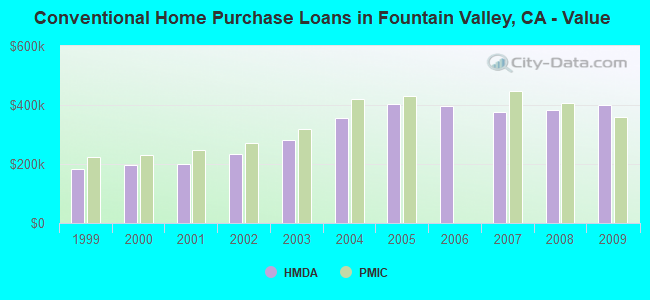
| Home Mortgage Disclosure Act Aggregated Statistics For Year 2009 (Based on 10 full and 5 partial tracts) | ||||||||||||||
| A) FHA, FSA/RHS & VA Home Purchase Loans | B) Conventional Home Purchase Loans | C) Refinancings | D) Home Improvement Loans | E) Loans on Dwellings For 5+ Families | F) Non-occupant Loans on < 5 Family Dwellings (A B C & D) | G) Loans On Manufactured Home Dwelling (A B C & D) | ||||||||
|---|---|---|---|---|---|---|---|---|---|---|---|---|---|---|
| Number | Average Value | Number | Average Value | Number | Average Value | Number | Average Value | Number | Average Value | Number | Average Value | Number | Average Value | |
| LOANS ORIGINATED | 48 | $397,792 | 277 | $401,663 | 1,481 | $325,421 | 85 | $282,813 | 0 | $0 | 69 | $317,497 | 8 | $107,625 |
| APPLICATIONS APPROVED, NOT ACCEPTED | 5 | $322,290 | 30 | $420,905 | 185 | $353,786 | 13 | $147,155 | 0 | $0 | 12 | $329,836 | 3 | $127,667 |
| APPLICATIONS DENIED | 16 | $342,638 | 87 | $418,495 | 345 | $371,418 | 21 | $215,397 | 0 | $0 | 30 | $338,377 | 11 | $92,320 |
| APPLICATIONS WITHDRAWN | 9 | $448,429 | 79 | $389,464 | 266 | $345,854 | 13 | $235,600 | 1 | $12,979,580 | 17 | $343,732 | 0 | $0 |
| FILES CLOSED FOR INCOMPLETENESS | 2 | $606,380 | 10 | $456,054 | 73 | $366,462 | 1 | $81,900 | 0 | $0 | 3 | $295,857 | 0 | $0 |
Detailed mortgage data for all 15 tracts in Fountain Valley, CA
| Private Mortgage Insurance Companies Aggregated Statistics For Year 2009 (Based on 6 full and 4 partial tracts) | ||||
| A) Conventional Home Purchase Loans | B) Refinancings | |||
|---|---|---|---|---|
| Number | Average Value | Number | Average Value | |
| LOANS ORIGINATED | 6 | $358,502 | 2 | $447,035 |
| APPLICATIONS APPROVED, NOT ACCEPTED | 3 | $499,673 | 4 | $420,068 |
| APPLICATIONS DENIED | 2 | $303,175 | 5 | $495,690 |
| APPLICATIONS WITHDRAWN | 0 | $0 | 2 | $482,500 |
| FILES CLOSED FOR INCOMPLETENESS | 0 | $0 | 0 | $0 |
2005 - 2018 National Fire Incident Reporting System (NFIRS) incidents
- Fire incident types reported to NFIRS in Fountain Valley, CA
- 22539.9%Structure Fires
- 14024.8%Outside Fires
- 13423.8%Mobile Property/Vehicle Fires
- 6511.5%Other
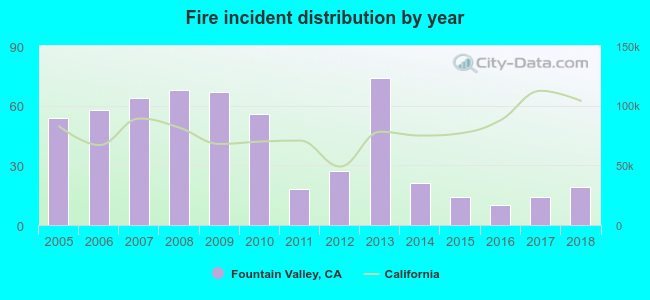 Based on the data from the years 2005 - 2018 the average number of fires per year is 40. The highest number of reported fires - 74 took place in 2013, and the least - 10 in 2016. The data has a dropping trend.
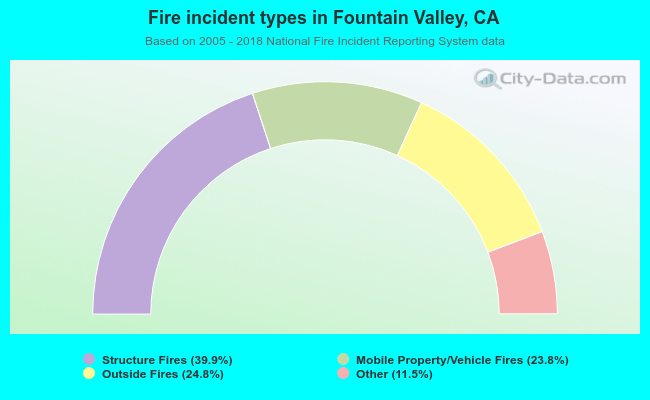 When looking into fire subcategories, the most incidents belonged to: Structure Fires (39.9%), and Outside Fires (24.8%).
Fire-safe hotels and motels in Fountain Valley, California:
- Residence Inn Fountain Valley, 9930 Slater Ave, Fountain Valley, California 92708 , Phone: (714) 965-8000, Fax: (714) 962-3439
- Days Inn And Suite Huntington Beachfountain Valley, 9125 Recreation Cir, Fountain Valley, California 92708 , Phone: (714) 847-3388, Fax: (714) 842-4192
- Ayres Hotel Fountain Valley, 17550 Brookhurst St, Fountain Valley, California 92708 , Phone: (714) 861-5170, Fax: (714) 861-5175
| Most common first names in Fountain Valley, CA among deceased individuals | ||
| Name | Count | Lived (average) |
|---|---|---|
| Mary | 225 | 79.3 years |
| John | 213 | 74.0 years |
| Robert | 170 | 71.8 years |
| William | 159 | 73.9 years |
| James | 123 | 72.0 years |
| Dorothy | 97 | 77.9 years |
| Margaret | 96 | 79.0 years |
| Helen | 93 | 79.7 years |
| Charles | 91 | 73.0 years |
| George | 88 | 75.1 years |
| Most common last names in Fountain Valley, CA among deceased individuals | ||
| Last name | Count | Lived (average) |
|---|---|---|
| Nguyen | 98 | 74.9 years |
| Smith | 65 | 73.1 years |
| Johnson | 47 | 75.2 years |
| Miller | 41 | 79.8 years |
| Tran | 37 | 80.4 years |
| Brown | 36 | 76.5 years |
| Anderson | 34 | 76.9 years |
| Williams | 29 | 76.7 years |
| Jones | 27 | 75.4 years |
| Le | 26 | 76.5 years |
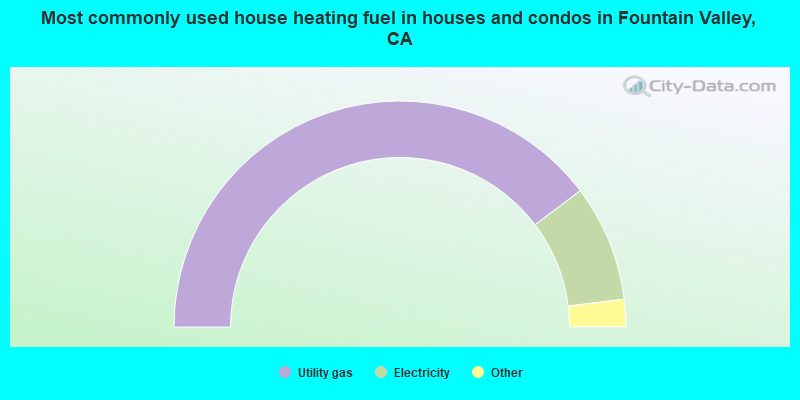
- 79.4%Utility gas
- 16.7%Electricity
- 2.0%Bottled, tank, or LP gas
- 1.3%No fuel used
- 0.4%Solar energy
- 0.2%Wood
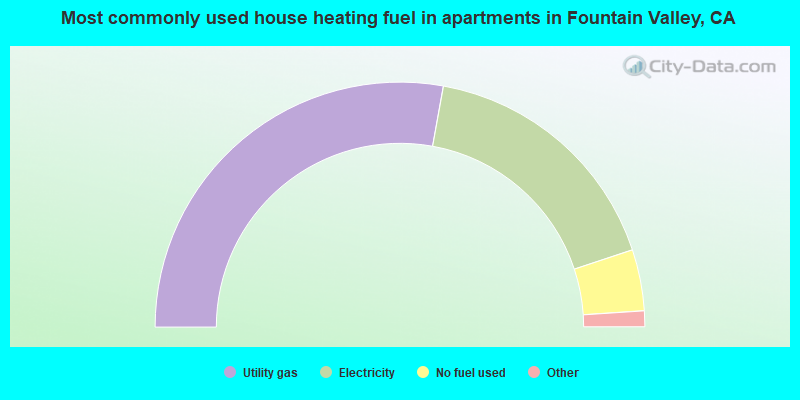
- 55.7%Utility gas
- 34.1%Electricity
- 8.1%No fuel used
- 1.8%Bottled, tank, or LP gas
- 0.3%Fuel oil, kerosene, etc.
Fountain Valley compared to California state average:
- Unemployed percentage significantly below state average.
- Black race population percentage significantly below state average.
- Hispanic race population percentage below state average.
- Median age significantly above state average.
- Renting percentage below state average.
- Length of stay since moving in significantly above state average.
- Number of rooms per house above state average.
- Percentage of population with a bachelor's degree or higher above state average.
Fountain Valley on our top lists:
- #10 on the list of "Top 101 cities with the most residents born in Vietnam (population 500+)"
- #11 on the list of "Top 101 cities with largest percentage of females in industries: other services, except public administration (population 50,000+)"
- #29 on the list of "Top 101 larger cities with the highest increase in house/condo value from 2000 (population 50,000+)"
- #35 on the list of "Top 101 cities with the largest city-data.com crime index increase from 2011 to 2012 (population 50,000+)"
- #39 on the list of "Top 101 cities with largest percentage of males in occupations: architecture and engineering occupations (population 50,000+)"
- #41 on the list of "Top 101 cities where residents moved in more then 10 years ago (10,000+ households)"
- #41 on the list of "Top 100 cities with highest median house value (pop. 50,000+)"
- #50 on the list of "Top 100 cities with highest ratio of median house value to median household income (pop. 50,000+)"
- #53 on the list of "Top 100 cities with oldest residents (pop. 50,000+)"
- #57 on the list of "Top 101 cities with largest percentage of females in occupations: office and administrative support occupations (population 50,000+)"
- #57 on the list of "Top 101 cities with the most residents born in South Eastern Asia (population 500+)"
- #57 on the list of "Top 100 high-educated but low-earning cities (pop. 50,000+)"
- #58 on the list of "Top 101 cities with the most cars per house, population 50,000+"
- #61 on the list of "Top 101 cities with the most residents born in Taiwan (population 500+)"
- #62 on the list of "Top 101 cities with the smallest percentage of unmarried partner households (population 50,000+)"
- #65 on the list of "Top 101 cities with largest percentage of females in occupations: installation, maintenance, and repair occupations (population 50,000+)"
- #67 on the list of "Top 101 cities with largest percentage of males in industries: retail trade (population 50,000+)"
- #77 on the list of "Top 101 cities with the lowest number of police officers per 1000 residents (population 50,000+)"
- #79 on the list of "Top 101 cities with largest percentage of males in occupations: sales and related occupations (population 50,000+)"
- #80 on the list of "Top 101 cities with the smallest house values disparities (population 50,000+)"
- #37 (92708) on the list of "Top 101 zip codes with the most offices of physicians in 2005"
- #72 (92704) on the list of "Top 101 zip codes with the largest percentage of taxpayers using paid preparers for 2012 taxes (pop 5,000+)"
- #4 on the list of "Top 101 counties with the highest total withdrawal of fresh water for public supply"
- #5 on the list of "Top 101 counties with the most Catholic adherents"
- #6 on the list of "Top 101 counties with the highest ground withdrawal of fresh water for public supply"
- #7 on the list of "Top 101 counties with the most Evangelical Protestant adherents"
- #8 on the list of "Top 101 counties with the highest Particulate Matter (PM2.5) Annual air pollution readings in 2012 (µg/m3)"

|
|
Total of 802 patent applications in 2008-2024.