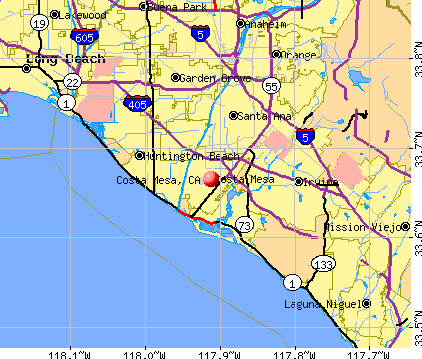
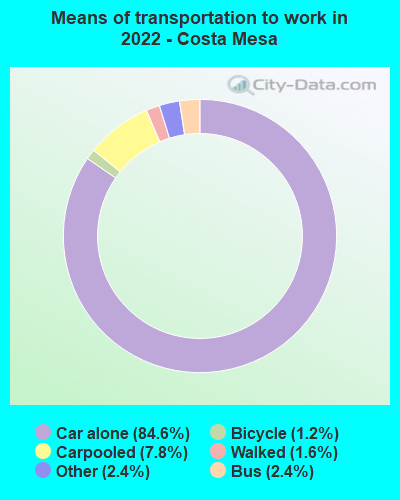
Costa Mesa, California
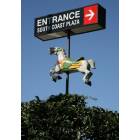
Costa Mesa: Landmark sign marking entrance to South Coast Plaza
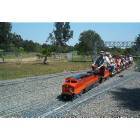
Costa Mesa: Goat Hill train park
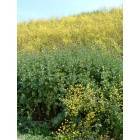
Costa Mesa: Fairview Park - Mustard Weed
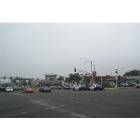
Costa Mesa: busy intersection Costa Mesa CA
- add
your
Submit your own pictures of this city and show them to the world
- OSM Map
- General Map
- Google Map
- MSN Map
Population change since 2000: +0.7%
 |
| Males: 58,053 | |
| Females: 51,468 |
| Median resident age: | 36.5 years |
| California median age: | 37.9 years |
Zip codes: 92614, 92626, 92627, 92646, 92660.
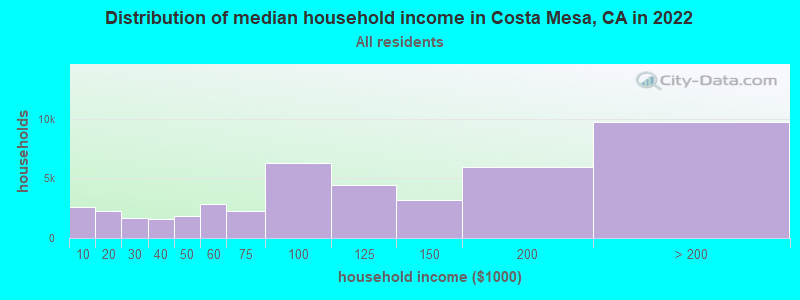
Costa Mesa Zip Code Map| Costa Mesa: | $103,891 |
| CA: | $91,551 |
Estimated per capita income in 2022: $59,939 (it was $23,342 in 2000)
Costa Mesa city income, earnings, and wages data
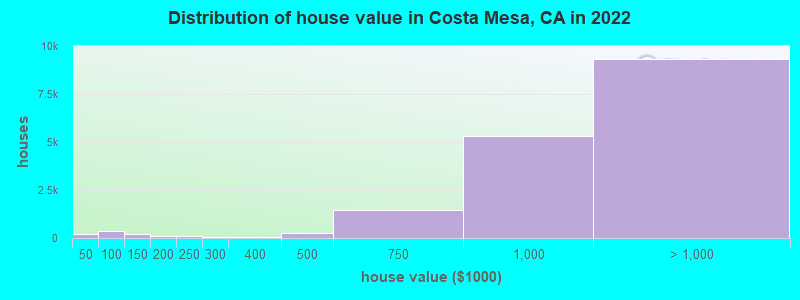
Estimated median house or condo value in 2022: over $1,000,000 (it was $263,700 in 2000)
| Costa Mesa: | over $1,000,000 |
| CA: | $715,900 |
Mean prices in 2022: all housing units: over $1,000,000; detached houses: over $1,000,000; townhouses or other attached units: $967,866; in 2-unit structures: $439,488; in 3-to-4-unit structures: over $1,000,000; in 5-or-more-unit structures: $732,978; mobile homes: $132,741
Median gross rent in 2022: $2,334.
(9.2% for White Non-Hispanic residents, 20.1% for Black residents, 15.1% for Hispanic or Latino residents, 11.3% for American Indian residents, 8.0% for Native Hawaiian and other Pacific Islander residents, 13.7% for other race residents, 9.6% for two or more races residents)
Detailed information about poverty and poor residents in Costa Mesa, CA


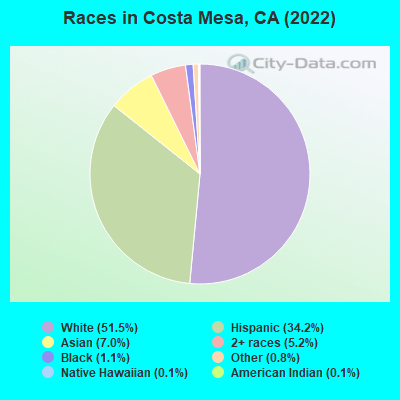
- 56,42251.5%White alone
- 37,44134.2%Hispanic
- 7,6277.0%Asian alone
- 5,7275.2%Two or more races
- 1,1731.1%Black alone
- 8580.8%Other race alone
- 1220.1%American Indian alone
- 1570.1%Native Hawaiian and Other
Pacific Islander alone
According to our research of California and other state lists, there were 101 registered sex offenders living in Costa Mesa, California as of April 27, 2024.
The ratio of all residents to sex offenders in Costa Mesa is 1,117 to 1.
The ratio of registered sex offenders to all residents in this city is lower than the state average.
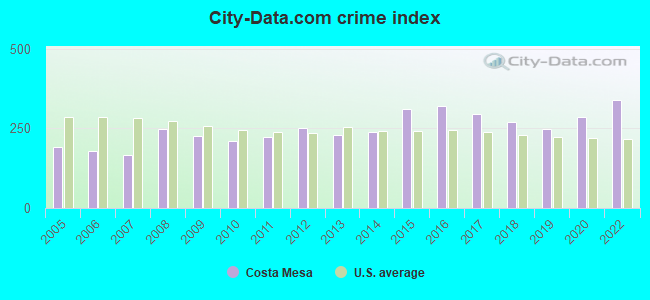
The City-Data.com crime index weighs serious crimes and violent crimes more heavily. Higher means more crime, U.S. average is 246.1. It adjusts for the number of visitors and daily workers commuting into cities.
- means the value is smaller than the state average.- means the value is about the same as the state average.
- means the value is bigger than the state average.
- means the value is much bigger than the state average.
Crime rate in Costa Mesa detailed stats: murders, rapes, robberies, assaults, burglaries, thefts, arson
Full-time law enforcement employees in 2021, including police officers: 210 (134 officers - 119 male; 15 female).
| Officers per 1,000 residents here: | 1.19 |
| California average: | 2.30 |
 Recent articles from our blog. Our writers, many of them Ph.D. graduates or candidates, create easy-to-read articles on a wide variety of topics.

 | East Costa Mesa Public School Feedback (1 reply) |
| Job opportunity in Costa Mesa (8 replies) |
| Costa Mesa South Coast Plaza possible racial incident (13 replies) |
| Help-choosing between Torrance, HB and Costa Mesa (18 replies) |
| Suggestion for housing location (29 replies) |
| Questions about residing in Costa Mesa (23 replies) |
Latest news from Costa Mesa, CA collected exclusively by city-data.com from local newspapers, TV, and radio stations
Ancestries: American (4.9%), Irish (4.8%), German (4.4%), European (4.2%), English (4.1%), Italian (2.8%).
Current Local Time: PST time zone
Elevation: 101 feet
Land area: 15.6 square miles.
Population density: 7,007 people per square mile (high).
26,300 residents are foreign born (13.9% Latin America, 6.2% Asia).
| This city: | 23.8% |
| California: | 26.5% |
Median real estate property taxes paid for housing units with mortgages in 2022: $7,597 (0.6%)
Median real estate property taxes paid for housing units with no mortgage in 2022: $4,528 (0.4%)
Nearest city with pop. 200,000+: Central Coast, CA (2.2 miles  , pop. 230,250).
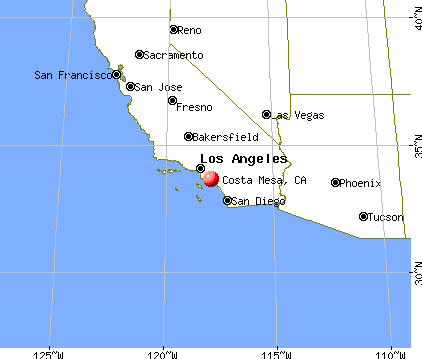
Nearest city with pop. 1,000,000+: Los Angeles, CA (39.5 miles , pop. 3,694,820).
Nearest cities:
), ), ), )Latitude: 33.66 N, Longitude: 117.91 W
Daytime population change due to commuting: +19,421 (+17.7%)
Workers who live and work in this city: 28,127 (42.2%)
Costa Mesa tourist attractions:
Costa Mesa, California accommodation & food services, waste management - Economy and Business Data
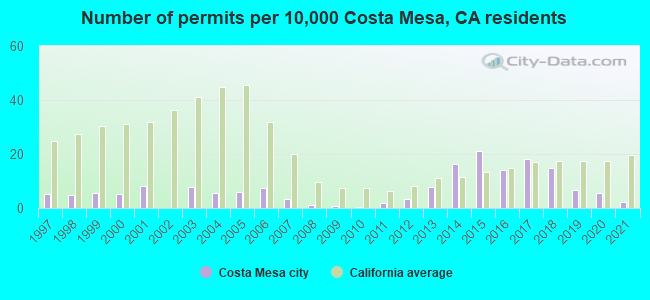
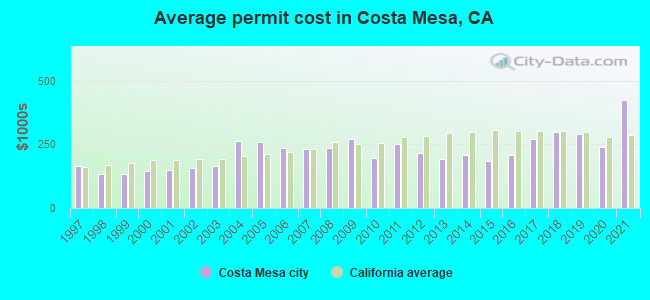
Single-family new house construction building permits:
- 2021: 23 buildings, average cost: $424,900
- 2020: 62 buildings, average cost: $240,900
- 2019: 74 buildings, average cost: $289,800
- 2018: 163 buildings, average cost: $298,900
- 2017: 196 buildings, average cost: $268,800
- 2016: 154 buildings, average cost: $206,700
- 2015: 229 buildings, average cost: $184,800
- 2014: 178 buildings, average cost: $210,100
- 2013: 84 buildings, average cost: $191,400
- 2012: 36 buildings, average cost: $216,900
- 2011: 21 buildings, average cost: $253,200
- 2010: 5 buildings, average cost: $195,700
- 2009: 10 buildings, average cost: $272,400
- 2008: 14 buildings, average cost: $236,400
- 2007: 38 buildings, average cost: $233,300
- 2006: 80 buildings, average cost: $235,200
- 2005: 65 buildings, average cost: $261,200
- 2004: 61 buildings, average cost: $262,800
- 2003: 85 buildings, average cost: $166,000
- 2002: 1 building, cost: $158,900
- 2001: 87 buildings, average cost: $151,400
- 2000: 58 buildings, average cost: $145,000
- 1999: 59 buildings, average cost: $135,400
- 1998: 51 buildings, average cost: $132,900
- 1997: 57 buildings, average cost: $165,900
| Here: | 3.7% |
| California: | 5.1% |

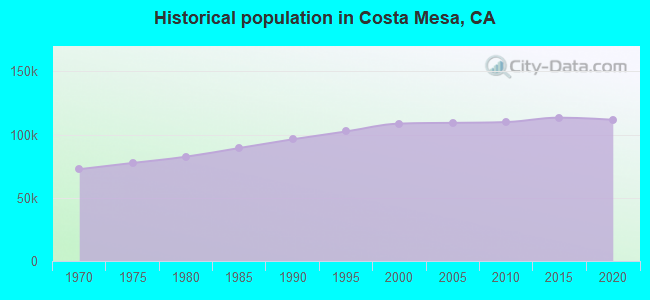
Population change in the 1990s: +11,600 (+11.9%).
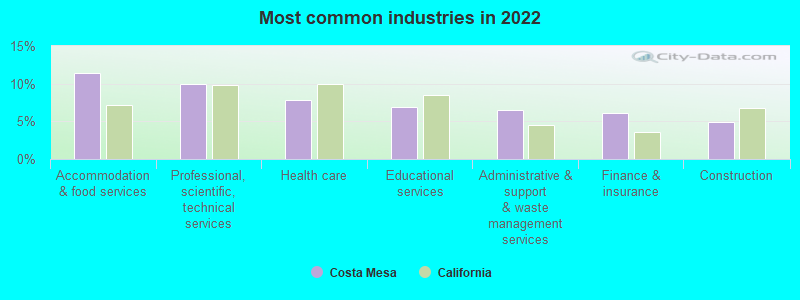
- Accommodation & food services (11.4%)
- Professional, scientific, technical services (9.9%)
- Health care (7.9%)
- Educational services (6.9%)
- Administrative & support & waste management services (6.5%)
- Finance & insurance (6.1%)
- Construction (4.9%)
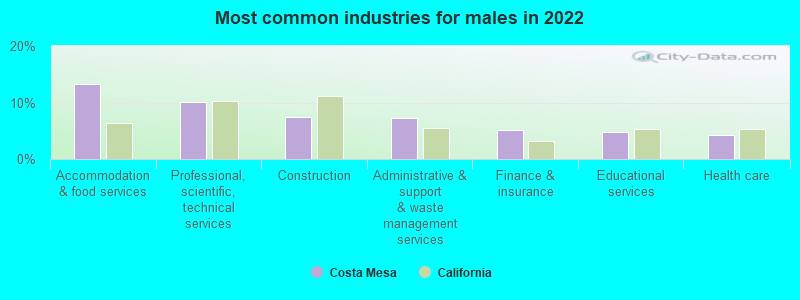
- Accommodation & food services (13.2%)
- Professional, scientific, technical services (10.1%)
- Construction (7.4%)
- Administrative & support & waste management services (7.3%)
- Finance & insurance (5.2%)
- Educational services (4.8%)
- Health care (4.2%)
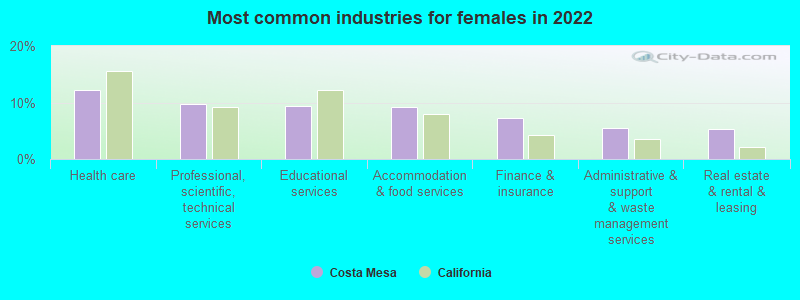
- Health care (12.3%)
- Professional, scientific, technical services (9.7%)
- Educational services (9.5%)
- Accommodation & food services (9.1%)
- Finance & insurance (7.3%)
- Administrative & support & waste management services (5.6%)
- Real estate & rental & leasing (5.4%)
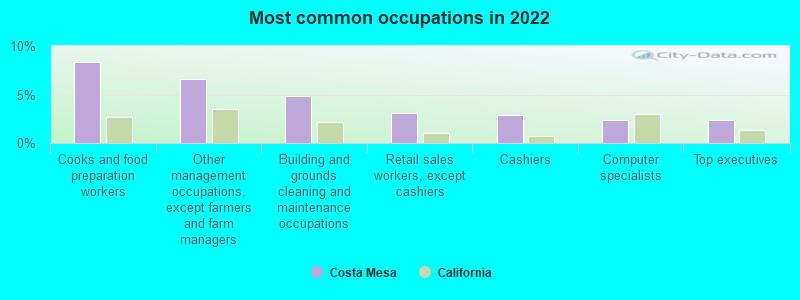
- Cooks and food preparation workers (8.3%)
- Other management occupations, except farmers and farm managers (6.6%)
- Building and grounds cleaning and maintenance occupations (4.8%)
- Retail sales workers, except cashiers (3.1%)
- Cashiers (2.9%)
- Computer specialists (2.4%)
- Top executives (2.4%)
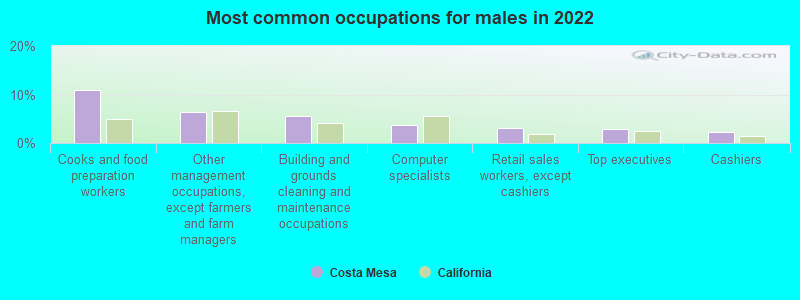
- Cooks and food preparation workers (10.9%)
- Other management occupations, except farmers and farm managers (6.5%)
- Building and grounds cleaning and maintenance occupations (5.5%)
- Computer specialists (3.6%)
- Retail sales workers, except cashiers (3.1%)
- Top executives (3.0%)
- Cashiers (2.2%)
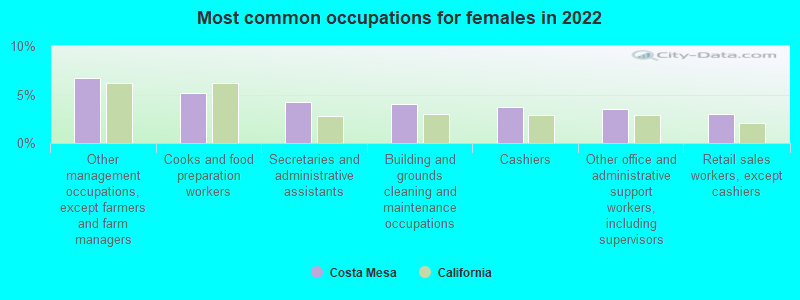
- Other management occupations, except farmers and farm managers (6.7%)
- Cooks and food preparation workers (5.2%)
- Secretaries and administrative assistants (4.3%)
- Building and grounds cleaning and maintenance occupations (4.1%)
- Cashiers (3.7%)
- Other office and administrative support workers, including supervisors (3.5%)
- Retail sales workers, except cashiers (3.0%)
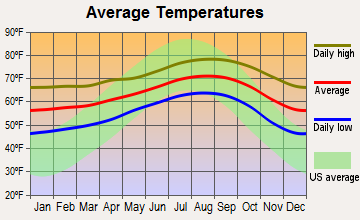
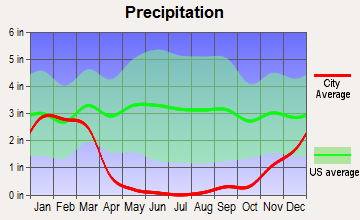
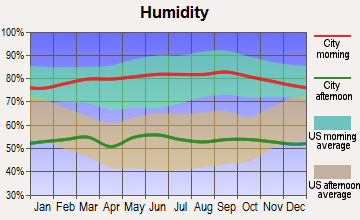
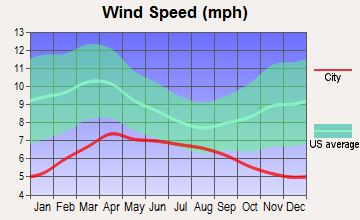
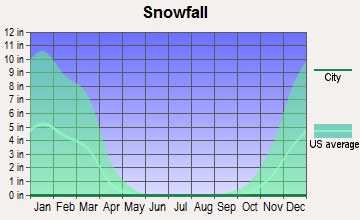
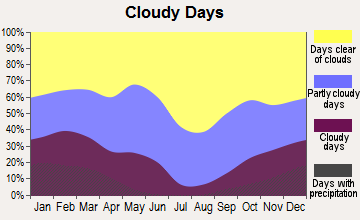
Average climate in Costa Mesa, California
Based on data reported by over 4,000 weather stations

|
|


(lower is better)
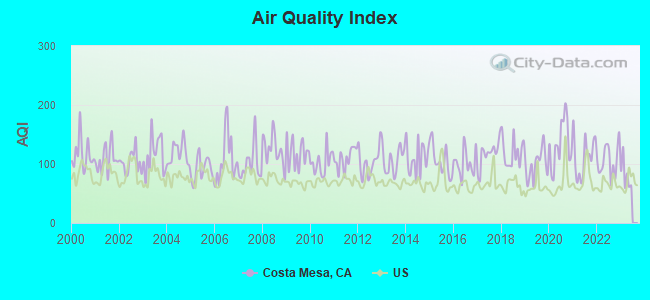
Air Quality Index (AQI) level in 2022 was 106. This is significantly worse than average.
| City: | 106 |
| U.S.: | 73 |
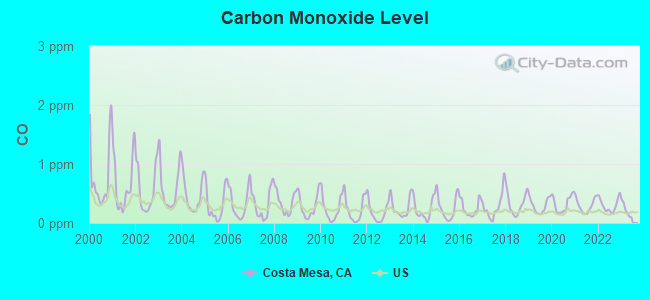
Carbon Monoxide (CO) [ppm] level in 2022 was 0.301. This is about average. Closest monitor was 1.0 miles away from the city center.
| City: | 0.301 |
| U.S.: | 0.251 |
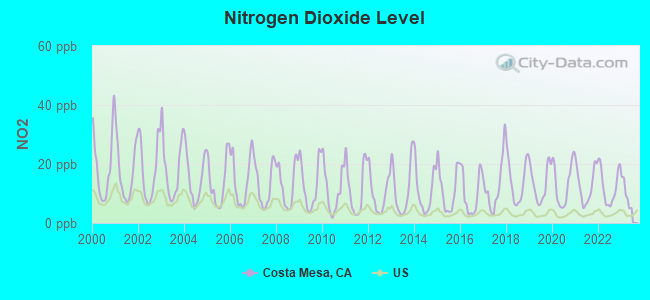
Nitrogen Dioxide (NO2) [ppb] level in 2022 was 12.4. This is significantly worse than average. Closest monitor was 1.0 miles away from the city center.
| City: | 12.4 |
| U.S.: | 5.1 |
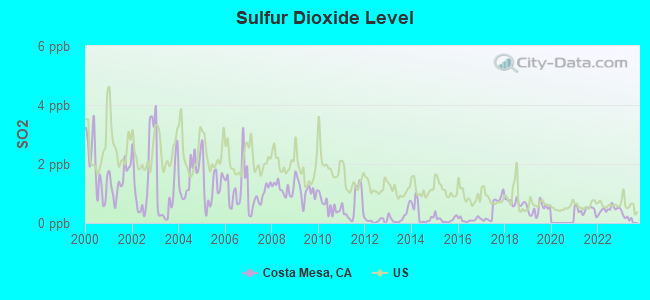
Sulfur Dioxide (SO2) [ppb] level in 2022 was 0.466. This is significantly better than average. Closest monitor was 1.0 miles away from the city center.
| City: | 0.466 |
| U.S.: | 1.515 |
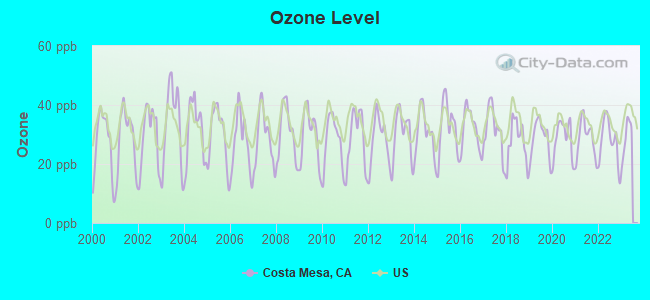
Ozone [ppb] level in 2022 was 27.7. This is better than average. Closest monitor was 1.0 miles away from the city center.
| City: | 27.7 |
| U.S.: | 33.3 |
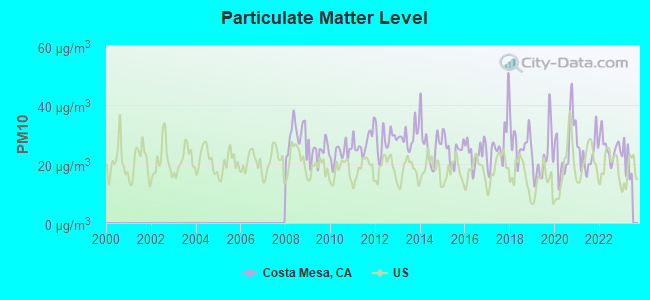
Particulate Matter (PM10) [µg/m3] level in 2022 was 25.7. This is worse than average. Closest monitor was 1.7 miles away from the city center.
| City: | 25.7 |
| U.S.: | 19.2 |
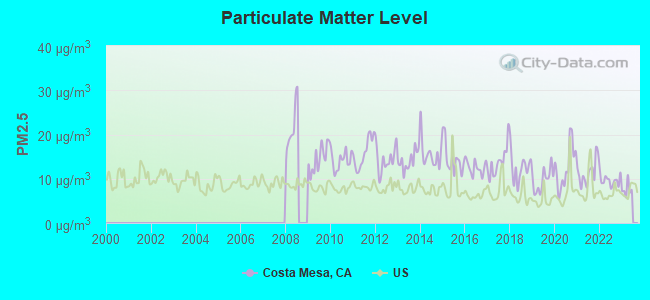
Particulate Matter (PM2.5) [µg/m3] level in 2022 was 9.66. This is about average. Closest monitor was 10.8 miles away from the city center.
| City: | 9.66 |
| U.S.: | 8.11 |
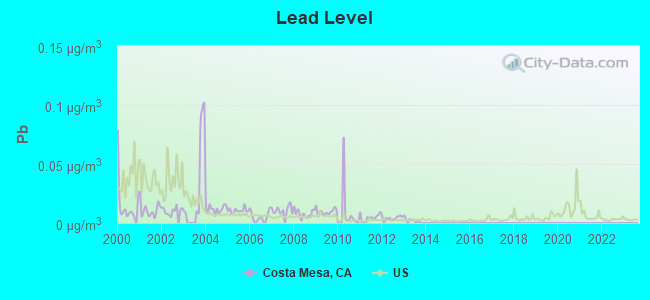
Lead (Pb) [µg/m3] level in 2013 was 0.00274. This is significantly better than average. Closest monitor was 1.2 miles away from the city center.
| City: | 0.00274 |
| U.S.: | 0.00931 |
Earthquake activity:
Costa Mesa-area historical earthquake activity is significantly above California state average. It is 6724% greater than the overall U.S. average.On 7/21/1952 at 11:52:14, a magnitude 7.7 (7.7 UK, Class: Major, Intensity: VIII - XII) earthquake occurred 111.3 miles away from the city center, causing $50,000,000 total damage
On 6/28/1992 at 11:57:34, a magnitude 7.6 (6.2 MB, 7.6 MS, 7.3 MW, Depth: 0.7 mi) earthquake occurred 87.0 miles away from Costa Mesa center, causing 3 deaths (1 shaking deaths, 2 other deaths) and 400 injuries, causing $100,000,000 total damage and $40,000,000 insured losses
On 10/16/1999 at 09:46:44, a magnitude 7.4 (6.3 MB, 7.4 MS, 7.2 MW, 7.3 ML) earthquake occurred 103.0 miles away from the city center
On 11/4/1927 at 13:51:53, a magnitude 7.5 (7.5 UK) earthquake occurred 198.1 miles away from the city center
On 4/21/1918 at 22:32:30, a magnitude 6.8 (6.8 UK, Class: Strong, Intensity: VII - IX) earthquake occurred 29.0 miles away from the city center
On 5/19/1940 at 04:36:40, a magnitude 7.2 (7.2 UK) earthquake occurred 131.5 miles away from the city center, causing $33,000,000 total damage
Magnitude types: body-wave magnitude (MB), local magnitude (ML), surface-wave magnitude (MS), moment magnitude (MW)
Natural disasters:
The number of natural disasters in Orange County (32) is a lot greater than the US average (15).Major Disasters (Presidential) Declared: 22
Emergencies Declared: 2
Causes of natural disasters: Floods: 15, Fires: 13, Storms: 9, Landslides: 6, Winter Storms: 6, Mudslides: 5, Earthquakes: 2, Heavy Rain: 1, Hurricane: 1, Snow: 1, Tornado: 1, Wind: 1, Other: 1 (Note: some incidents may be assigned to more than one category).
Main business address for: PACIFIC PREMIER BANCORP INC (SAVINGS INSTITUTION, FEDERALLY CHARTERED), WNC HOUSING TAX CREDIT FUND III L P (OPERATORS OF APARTMENT BUILDINGS), EMULEX CORP /DE/ (COMPUTER COMMUNICATIONS EQUIPMENT), SYNTHETIC BLOOD INTERNATIONAL INC (SERVICES-COMMERCIAL PHYSICAL & BIOLOGICAL RESEARCH), WNC HOUSING TAX CREDIT FUND IV L P SERIES 2 (OPERATORS OF APARTMENT BUILDINGS), RESOURCES CONNECTION INC (SERVICES-BUSINESS SERVICES, NEC), IRVINE SENSORS CORP/DE/ (SEMICONDUCTORS & RELATED DEVICES), COMMERCE ENERGY GROUP INC (ELECTRIC SERVICES) and 9 other public companies.
Hospitals in Costa Mesa:
- COLLEGE HOSPITAL COSTA MESA (Proprietary, provides emergency services, 301 VICTORIA STREET)
- ENRICHING, INC II (2501 CHRISTOPHER LANE)
- FAIRVIEW DEVELOPMENTAL CENTER (Government - State, 2501 HARBOR BOULEVARD)
- IND OPTS-HARBOR VILLAGE V (2541 SANTA CATALINA #108)
- IND OPTS-MARK LANE II (2516 MARK LANE)
- STARTING POINT OF ORANGE COUNTY (350 WEST BAY ST)
Nursing Homes in Costa Mesa:
- FAIRVIEW DEVELOPMENTAL CENTER (2501 HARBOR BOULEVARD)
- MESA VERDE CONVALESCENT HOSPITAL (661 CENTER STREET)
- NEWPORT SUBACUTE HEALTHCARE CENTER (2570 NEWPORT BLVD)
- PORT BAY CARE CENTER (2570 NEWPORT BLVD)
- VICTORIA HEALTHCARE AND REHABILITATION CENTER (340 VICTORIA STREET)
Dialysis Facilities in Costa Mesa:
Home Health Centers in Costa Mesa:
Heliports located in Costa Mesa:
- Centerport Heliport (10CL)
- Costa Mesa Police Department Heliport (42CL)
- L A Times Costa Mesa Heliport (1CA7)
- South Coast Metro Center Heliport (83CA)
Amtrak stations near Costa Mesa:
- 5 miles: NEWPORT BEACH (NEWPORT TRANS. CENTER, 1550 AVOCADO AVE.) - Bus Station . Services: fully wheelchair accessible, public payphones, public transit connection.
- 7 miles: SANTA ANA (1000 E. SANTA ANA BLVD.) . Services: ticket office, fully wheelchair accessible, enclosed waiting area, public restrooms, public payphones, snack bar, free short-term parking, free long-term parking, call for car rental service, taxi stand, intercity bus service, public transit connection.
- 9 miles: IRVINE (15215 BARRANCA PKWY.) . Services: ticket office, fully wheelchair accessible, enclosed waiting area, public restrooms, public payphones, snack bar, free short-term parking, free long-term parking, call for taxi service, intercity bus service, public transit connection.
Colleges/Universities in Costa Mesa:
- Orange Coast College (Full-time enrollment: 12,918; Location: 2701 Fairview Road; Public; Website: www.orangecoastcollege.edu/)
- University of Phoenix-Southern California Campus (Full-time enrollment: 8,110; Location: 3100 Bristol Street; Private, for-profit; Website: www.phoenix.edu; Offers Master's degree)
- Vanguard University of Southern California (Full-time enrollment: 2,104; Location: 55 Fair Dr; Private, not-for-profit; Website: www.vanguard.edu; Offers Master's degree)
- Paul Mitchell the School-Costa Mesa (Full-time enrollment: 394; Location: 3309 Hyland Ave., Suite J; Private, for-profit; Website: costamesa.paulmitchell.edu)
- Pacific College (Full-time enrollment: 363; Location: 3160 Red Hill Ave; Private, for-profit; Website: pacific-college.com)
- Coast Community College District Office (Location: 1370 Adams Ave.; Public; Website: www.cccd.edu)
Other colleges/universities with over 2000 students near Costa Mesa:
- University of California-Irvine (about 5 miles; Irvine, CA; Full-time enrollment: 28,587)
- Coastline Community College (about 5 miles; Fountain Valley, CA; FT enrollment: 4,591)
- Concordia University-Irvine (about 6 miles; Irvine, CA; FT enrollment: 3,284)
- Santa Ana College (about 7 miles; Santa Ana, CA; FT enrollment: 11,756)
- Golden West College (about 8 miles; Huntington Beach, CA; FT enrollment: 7,358)
- Irvine Valley College (about 8 miles; Irvine, CA; FT enrollment: 8,005)
- Brandman University (about 9 miles; Irvine, CA; FT enrollment: 6,027)
Biggest public high schools in Costa Mesa:
- ACCESS COUNTY COMMUNITY (Students: 1,388, Location: 200 KALMUS DR., Grades: KG-12)
- COSTA MESA HIGH (Students: 1,349, Location: 2650 FAIRVIEW RD., Grades: 7-12)
- OCCS:CHEP/PCHS (Students: 949, Location: 2910 REDHILL AVE., STE. 200, Grades: KG-12)
- ESTANCIA HIGH (Students: 822, Location: 2323 PLACENTIA AVE., Grades: 9-12)
- ORANGE COUNTY SPECIAL EDUCATION (Students: 318, Location: 200 KALMUS DR., Grades: KG-12)
- EARLY COLLEGE HIGH (Students: 185, Location: 2990 MESA VERDE DR., Grades: 9-12)
- BACK BAY HIGH (Students: 28, Location: 390 MONTE VISTA AVE., Grades: 9-12)
- MONTE VISTA HIGH (Students: 5, Location: 390 MONTE VISTA AVE., Grades: 9-12)
- COASTLINE ROP (Location: 1001 PRESIDIO SQ., Grades: 9-12)
- MAGNOLIA SCIENCE ACADEMY SANTA ANA (Location: 102 BAKER ST. E., Grades: 6-12, Charter school)
Private high school in Costa Mesa:
Biggest public elementary/middle schools in Costa Mesa:
- HEINZ KAISER ELEMENTARY (Students: 626, Location: 2130 SANTA ANA AVE., Grades: 3-6)
- CHARLES W. TEWINKLE MIDDLE (Students: 594, Location: 3224 CALIFORNIA AVE., Grades: 7-8)
- EVERETT A. REA ELEMENTARY (Students: 554, Location: 661 HAMILTON ST., Grades: KG-6)
- ADAMS ELEMENTARY (Students: 365, Location: 2850 CLUB HOUSE RD., Grades: KG-6)
- MAUDE B. DAVIS ELEMENTARY (Students: 351, Location: 1050 ARLINGTON DR., Grades: KG-6)
- VICTORIA ELEMENTARY (Students: 306, Location: 1025 VICTORIA ST., Grades: KG-6)
- CALIFORNIA ELEMENTARY (Students: 290, Location: 3232 CALIFORNIA AVE., Grades: KG-6)
- SONORA ELEMENTARY (Students: 283, Location: 966 SONORA RD., Grades: KG-6)
- COLLEGE PARK ELEMENTARY (Students: 282, Location: 2380 NOTRE DAME RD., Grades: KG-6)
- KILLYBROOKE ELEMENTARY (Students: 270, Location: 3155 KILLYBROOKE LN., Grades: KG-6)
Biggest private elementary/middle schools in Costa Mesa:
- MARINERS CHRISTIAN SCHOOL (Students: 690, Location: 300 FISCHER AVE, Grades: KG-8)
- ST JOHN THE BAPTIST CATHOLIC SCHOOL (Students: 593, Location: 1021 BAKER ST, Grades: KG-8)
- ST JOACHIM ELEMENTARY SCHOOL (Students: 307, Location: 1964 ORANGE AVE, Grades: PK-8)
- CHRIST LUTHERAN SCHOOL (Students: 222, Location: 760 VICTORIA ST, Grades: PK-8)
- PAGE PRIVATE SCHOOL - NEWPORT MESA (Students: 115, Location: 657 VICTORIA ST, Grades: PK-8)
- CHRISTIAN MONTESSORI SCHOOL-COSTA MESA (Students: 108, Location: 2950 MCCLINTOCK WAY, Grades: PK-6)
- MONTESSORI CHRISTIAN SCHOOL (Students: 90, Location: 2980 MCCLINTOCK WAY STE H, Grades: PK-6)
- KLINE SCHOOL (Students: 40, Location: 1620 ADAMS AVE, Grades: KG-8)
- MONTESSORI HARBOR MESA SCHOOL (Students: 36, Location: 3025 DEODAR AVE, Grades: KG-6)
- CHRISTIAN MONTESSORI ACADEMY-NEWPORT PRESCHOOL (Students: 25, Location: 2591 IRVINE AVE, Grades: KG-4)
Points of interest:
Notable locations in Costa Mesa: Costa Mesa Golf Course (A), Mesa Verde Country Club (B), Mesa Verde Branch Orange County Public Library (C), Pacific Amphitheater (D), Costa Mesa Branch Orange County Public Library (E), Fairview Developmental Center (F), Schaefer Ambulance Service (G), Costa Mesa Fire Department Station 6 (H), Costa Mesa Fire Department Station 5 (I), Costa Mesa Fire Department Station 4 (J), Costa Mesa Fire Department Station 3 (K), Costa Mesa Fire Department Station 2 (L), Costa Mesa Fire Department Station 1 (M). Display/hide their locations on the map
Shopping Centers: Westport Square Shopping Center (1), Stater Brothers Plaza Shopping Center (2), South Coast Plaza Shopping Center (3), Mesa Verde Shopping Center (4), Crystal Court Shopping Center (5), Traingle Square Shopping Center (6), Mesa Center Shopping Center (7), Hillgren Square Shopping Center (8), Costa Mesa Courtyards Shopping Center (9). Display/hide their locations on the map
Main business address in Costa Mesa include: PACIFIC PREMIER BANCORP INC (A), EMULEX CORP /DE/ (B), SYNTHETIC BLOOD INTERNATIONAL INC (C), WNC HOUSING TAX CREDIT FUND IV L P SERIES 2 (D), RESOURCES CONNECTION INC (E), IRVINE SENSORS CORP/DE/ (F), COMMERCE ENERGY GROUP INC (G). Display/hide their locations on the map
Churches in Costa Mesa include: Christ Lutheran Church (A), Fairview Community Church (B), Harbor Light Christian Church (C), Iglesia De Nazareno (D), Lighthouse Coastal Community Church (E), Saint Joachim Church (F), Saint John's Episcopal Church (G), Saint Mary Armenian Church (H), South Coast Christian Church (I). Display/hide their locations on the map
Parks in Costa Mesa include: LeBard Stadium (1), Harbor Rest Memorial Park (2), Te Winkle Park (3), Orange County Fairgrounds (4), Canyon Park (5), Marina View Park (6), Talbert Regional Park (7), Victoria Vista Park (8), Heller Park (9). Display/hide their locations on the map
Tourist attractions: Fish King The (Aquariums; 1599 Superior Ave Suite B2), Costa Mesa Historical Society (Cultural Attractions- Events- & Facilities; 1870 Anaheim Avenue), Ski Bus Tours & Promotions (Ski & Helicopter Tours; 1525 Mac Arthur Boulevard), Big Daddy's Family Arcade (Amusement & Theme Parks; 2263 Fairview Road Suite A).
Hotels: Ana Mesa Suites (3597 Harbor Boulevard), Ali Baba Motel (2250 Newport Boulevard), Best Western Newport Mesa Inn (2642 Newport Boulevard), Beverly Heritage - Wyndham Garden Hotel Orange County Airport (3350 Avenue Of The Arts).
Birthplace of: Lonnie Frisbee - Christian cleric, Spencer Kayden - Comedian, Alfunction - Heavy metal guitarist, Cara Heads - Weightlifter, Chris Senn (skateboarder) - Skateboarder, Ken Patterson - Baseball player, Matt Fuerbringer - Beach volleyball player, Zach Wells - Major League Soccer player (MetroStars, born: Feb 26, 1981).
Drinking water stations with addresses in Costa Mesa and their reported violations in the past:
STAFFORD HOLLOW WATER ASSOCIATION (Address: Suite 250 , Serves CT, Population served: 429, Groundwater):Past monitoring violations:AMBERWOOD MOBILE HOME PARK (Population served: 150, Groundwater):
- Follow-up Or Routine LCR Tap M/R - In JAN-10-2005, Contaminant: Lead and Copper Rule. Follow-up actions: St Public Notif received (MAR-11-2005), St AO (w/penalty) issued (SEP-16-2005), St Public Notif requested (SEP-16-2005), St Compliance achieved (OCT-07-2005)
Past monitoring violations:
- Monitoring and Reporting (DBP) - In JAN-01-2004, Contaminant: DBP Stage 1. Follow-up actions: St Violation/Reminder Notice (MAR-26-2006)
- Monitoring and Reporting (DBP) - Between JAN-2004 and DEC-2005, Contaminant: Total Haloacetic Acids (HAA5). Follow-up actions: St Violation/Reminder Notice (MAR-26-2006), St Compliance achieved (JUL-16-2008)
- Monitoring and Reporting (DBP) - Between JAN-2004 and DEC-2005, Contaminant: TTHM. Follow-up actions: St Violation/Reminder Notice (MAR-26-2006), St Compliance achieved (JUL-16-2008)
- Initial Tap Sampling for Pb and Cu - In JAN-01-1996, Contaminant: Lead and Copper Rule. Follow-up actions: St Violation/Reminder Notice (4 times from MAY-21-2003 to APR-01-2006), St AO (w/o penalty) issued (JAN-04-2007)
- 3 routine major monitoring violations
- 47 regular monitoring violations
| This city: | 2.7 people |
| California: | 2.9 people |
| This city: | 58.2% |
| Whole state: | 68.7% |
| This city: | 8.2% |
| Whole state: | 7.2% |
Likely homosexual households (counted as self-reported same-sex unmarried-partner households)
- Lesbian couples: 0.3% of all households
- Gay men: 0.4% of all households
People in group quarters in Costa Mesa in 2010:
- 791 people in college/university student housing
- 581 people in nursing facilities/skilled-nursing facilities
- 554 people in other noninstitutional facilities
- 413 people in group homes intended for adults
- 225 people in emergency and transitional shelters (with sleeping facilities) for people experiencing homelessness
- 216 people in residential treatment centers for adults
- 92 people in hospitals with patients who have no usual home elsewhere
- 47 people in group homes for juveniles (non-correctional)
- 33 people in workers' group living quarters and job corps centers
- 18 people in residential treatment centers for juveniles (non-correctional)
People in group quarters in Costa Mesa in 2000:
- 840 people in schools, hospitals, or wards for the intellectually disabled
- 703 people in college dormitories (includes college quarters off campus)
- 484 people in other noninstitutional group quarters
- 381 people in other nonhousehold living situations
- 260 people in nursing homes
- 218 people in homes or halfway houses for drug/alcohol abuse
- 107 people in homes for the mentally retarded
- 85 people in orthopedic wards and institutions for the physically handicapped
- 75 people in other group homes
- 42 people in halfway houses
- 22 people in local jails and other confinement facilities (including police lockups)
- 19 people in homes for abused, dependent, and neglected children
- 18 people in homes for the physically handicapped
- 16 people in religious group quarters
Banks with most branches in Costa Mesa (2011 data):
- Bank of America, National Association: Harbor-Adams Branch, Costa Mesa Branch, 600 Anton Blvd - Ust. Info updated 2009/11/18: Bank assets: $1,451,969.3 mil, Deposits: $1,077,176.8 mil, headquarters in Charlotte, NC, positive income, 5782 total offices, Holding Company: Bank Of America Corporation
- U.S. Bank National Association: Costa Mesa Albertsons Branch, South Coast Branch, Costa Mesa 17th Street Branch. Info updated 2012/01/30: Bank assets: $330,470.8 mil, Deposits: $236,091.5 mil, headquarters in Cincinnati, OH, positive income, 3121 total offices, Holding Company: U.S. Bancorp
- Citibank, National Association: 234 East 17th Street Branch, 695 Town Center Drive Branch, 2700 Harbor Boulevard Branch. Info updated 2012/01/10: Bank assets: $1,288,658.0 mil, Deposits: $882,541.0 mil, headquarters in Sioux Falls, SD, positive income, International Specialization, 1048 total offices, Holding Company: Citigroup Inc.
- Pacific Mercantile Bank: Costa Mesa Branch, at 949 South Coast Drive, 3rd. Floor, Internet Banking Branch. Info updated 2006/11/03: Bank assets: $1,017.8 mil, Deposits: $863.5 mil, local headquarters, positive income, Commercial Lending Specialization, 10 total offices, Holding Company: Pacific Mercantile Bancorp
- JPMorgan Chase Bank, National Association: Mesa Verde Branch, Costa Mesa - Harbor Center Branch, Costa Mesa Branch. Info updated 2011/11/10: Bank assets: $1,811,678.0 mil, Deposits: $1,190,738.0 mil, headquarters in Columbus, OH, positive income, International Specialization, 5577 total offices, Holding Company: Jpmorgan Chase & Co.
- Wells Fargo Bank, National Association: Harbor Boulevard Branch, Harbor And Wilson, Costa Mesa Branch. Info updated 2011/04/05: Bank assets: $1,161,490.0 mil, Deposits: $905,653.0 mil, headquarters in Sioux Falls, SD, positive income, 6395 total offices, Holding Company: Wells Fargo & Company
- Beach Business Bank: Orange County Office Branch at 650 Town Center Drive, Suite 150, branch established on 2010/02/22. Info updated 2006/11/03: Bank assets: $305.0 mil, Deposits: $251.1 mil, headquarters in Manhattan Beach, CA, positive income, Commercial Lending Specialization, 3 total offices
- E*TRADE Savings Bank: Costa Mesa Branch at 3200 Bristol Street, Suite 120, branch established on 2007/03/05. Info updated 2011/07/21: Bank assets: $1,677.9 mil, Deposits: $1,504.6 mil, headquarters in Arlington, VA, positive income, Mortgage Lending Specialization, 25 total offices
- California Bank & Trust: Costa Mesa Branch at 3420 Bristol Street, branch established on 1975/01/29. Info updated 2009/07/20: Bank assets: $10,894.1 mil, Deposits: $9,193.9 mil, headquarters in San Diego, CA, positive income, Commercial Lending Specialization, 109 total offices, Holding Company: Zions Bancorporation
- 8 other banks with 8 local branches
For population 15 years and over in Costa Mesa:
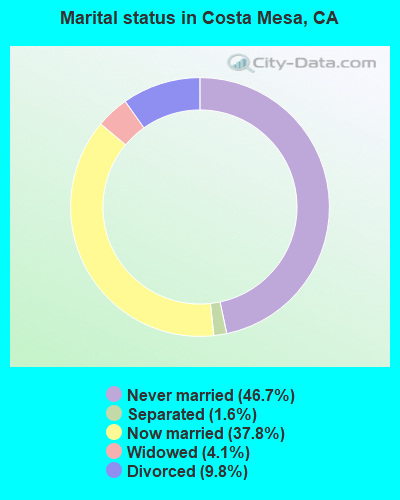
- Never married: 46.7%
- Now married: 37.8%
- Separated: 1.6%
- Widowed: 4.1%
- Divorced: 9.8%
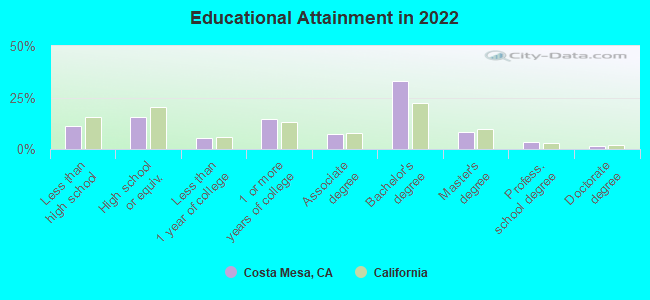
For population 25 years and over in Costa Mesa:
- High school or higher: 88.7%
- Bachelor's degree or higher: 45.9%
- Graduate or professional degree: 13.1%
- Unemployed: 4.7%
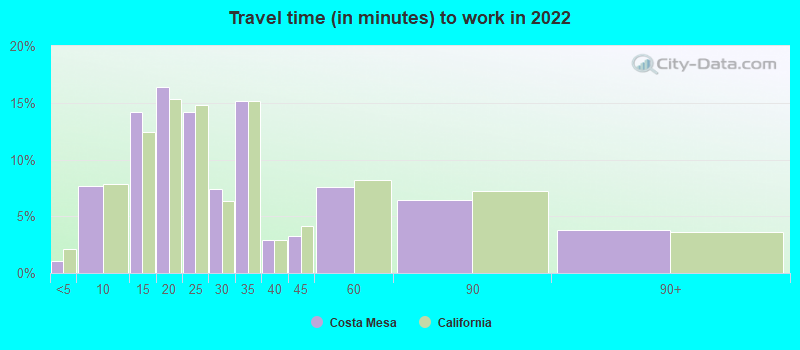
- Mean travel time to work (commute): 16.0 minutes
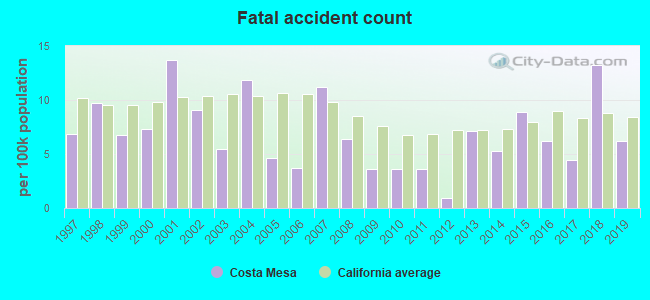
| Here: | 13.4 |
| California average: | 15.5 |


Graphs represent county-level data. Detailed 2008 Election Results
Religion statistics for Costa Mesa, CA (based on Orange County data)


| Religion | Adherents | Congregations |
|---|---|---|
| Catholic | 797,473 | 67 |
| Evangelical Protestant | 345,893 | 894 |
| Other | 141,815 | 329 |
| Mainline Protestant | 76,574 | 202 |
| Orthodox | 13,406 | 19 |
| Black Protestant | 2,424 | 8 |
| None | 1,632,647 | - |
Food Environment Statistics:
| Orange County: | 1.78 / 10,000 pop. |
| State: | 2.14 / 10,000 pop. |
| Orange County: | 0.06 / 10,000 pop. |
| California: | 0.04 / 10,000 pop. |
| Here: | 0.49 / 10,000 pop. |
| State: | 0.62 / 10,000 pop. |
| Orange County: | 1.46 / 10,000 pop. |
| State: | 1.49 / 10,000 pop. |
| Here: | 8.19 / 10,000 pop. |
| State: | 7.42 / 10,000 pop. |
| Orange County: | 6.3% |
| California: | 7.3% |
| Orange County: | 18.5% |
| California: | 21.3% |
| Orange County: | 16.4% |
| California: | 17.9% |
Health and Nutrition:
| Here: | 48.2% |
| State: | 49.4% |
| Costa Mesa: | 47.2% |
| California: | 48.0% |
| This city: | 28.0 |
| California: | 28.1 |
| This city: | 20.3% |
| California: | 20.2% |
| This city: | 10.0% |
| State: | 11.2% |
| Costa Mesa: | 6.8 |
| California: | 6.8 |
| This city: | 30.2% |
| California: | 31.5% |
| This city: | 57.2% |
| California: | 56.4% |
| Here: | 81.3% |
| State: | 80.9% |
More about Health and Nutrition of Costa Mesa, CA Residents
| Local government employment and payroll (March 2022) | |||||
| Function | Full-time employees | Monthly full-time payroll | Average yearly full-time wage | Part-time employees | Monthly part-time payroll |
|---|---|---|---|---|---|
| Police Protection - Officers | 136 | $1,616,629 | $142,644 | 3 | $11,191 |
| Firefighters | 77 | $978,363 | $152,472 | 0 | $0 |
| Other Government Administration | 73 | $569,801 | $93,666 | 20 | $55,434 |
| Police - Other | 71 | $512,732 | $86,659 | 32 | $96,407 |
| Streets and Highways | 37 | $327,603 | $106,250 | 7 | $15,891 |
| Financial Administration | 34 | $325,302 | $114,812 | 4 | $18,475 |
| Parks and Recreation | 28 | $200,455 | $85,909 | 88 | $149,239 |
| Other and Unallocable | 18 | $114,095 | $76,063 | 4 | $19,460 |
| Fire - Other | 13 | $137,675 | $127,085 | 1 | $2,180 |
| Housing and Community Development (Local) | 0 | $0 | 1 | $504 | |
| Totals for Government | 487 | $4,782,655 | $117,848 | 160 | $368,781 |
Costa Mesa government finances - Expenditure in 2017 (per resident):
- Construction - Central Staff Services: $4,430,000 ($40.45)
Regular Highways: $4,019,000 ($36.70)
Housing and Community Development: $597,000 ($5.45)
Protective Inspection and Regulation - Other: $373,000 ($3.41)
- Current Operations - Police Protection: $41,731,000 ($381.03)
Central Staff Services: $24,617,000 ($224.77)
Local Fire Protection: $21,845,000 ($199.46)
Parks and Recreation: $8,771,000 ($80.09)
Protective Inspection and Regulation - Other: $6,962,000 ($63.57)
Regular Highways: $5,219,000 ($47.65)
Financial Administration: $2,492,000 ($22.75)
Housing and Community Development: $1,291,000 ($11.79)
Health - Other: $299,000 ($2.73)
- General - Interest on Debt: $1,034,000 ($9.44)
- Other Capital Outlay - Police Protection: $2,817,000 ($25.72)
Regular Highways: $1,645,000 ($15.02)
General Public Building: $1,212,000 ($11.07)
Parks and Recreation: $720,000 ($6.57)
Local Fire Protection: $316,000 ($2.89)
General - Other: $286,000 ($2.61)
Health - Other: $23,000 ($0.21)
Costa Mesa government finances - Revenue in 2017 (per resident):
- Charges - Parks and Recreation: $3,054,000 ($27.89)
Other: $2,529,000 ($23.09)
Regular Highways: $550,000 ($5.02)
Housing and Community Development: $256,000 ($2.34)
Parking Facilities: $10,000 ($0.09)
- Federal Intergovernmental - Other: $243,000 ($2.22)
- Local Intergovernmental - Other: $204,000 ($1.86)
- Miscellaneous - Rents: $3,075,000 ($28.08)
General Revenue - Other: $2,626,000 ($23.98)
Fines and Forfeits: $1,356,000 ($12.38)
Interest Earnings: $338,000 ($3.09)
Donations From Private Sources: $174,000 ($1.59)
Special Assessments: $99,000 ($0.90)
- State Intergovernmental - Other: $4,714,000 ($43.04)
Highways: $2,195,000 ($20.04)
General Local Government Support: $152,000 ($1.39)
- Tax - General Sales and Gross Receipts: $62,177,000 ($567.72)
Property: $37,675,000 ($344.00)
Other Selective Sales: $8,925,000 ($81.49)
Public Utilities Sales: $4,594,000 ($41.95)
Other License: $2,711,000 ($24.75)
Occupation and Business License - Other: $919,000 ($8.39)
Documentary and Stock Transfer: $766,000 ($6.99)
Costa Mesa government finances - Debt in 2017 (per resident):
- Long Term Debt - Beginning Outstanding - Unspecified Public Purpose: $24,375,000 ($222.56)
Outstanding Unspecified Public Purpose: $21,620,000 ($197.41)
Beginning Outstanding - Public Debt for Private Purpose: $3,420,000 ($31.23)
Outstanding Nonguaranteed - Industrial Revenue: $3,420,000 ($31.23)
Retired Unspecified Public Purpose: $2,755,000 ($25.15)
Costa Mesa government finances - Cash and Securities in 2017 (per resident):
- Bond Funds - Cash and Securities: $40,817,000 ($372.69)
- Other Funds - Cash and Securities: $69,751,000 ($636.87)
- Sinking Funds - Cash and Securities: $5,888,000 ($53.76)
4.86% of this county's 2021 resident taxpayers lived in other counties in 2020 ($95,983 average adjusted gross income)
| Here: | 4.86% |
| California average: | 5.19% |
0.01% of residents moved from foreign countries ($132 average AGI)
Orange County: 0.01% California average: 0.03%
Top counties from which taxpayers relocated into this county between 2020 and 2021:
| from Los Angeles County, CA | |
| from Riverside County, CA | |
| from San Diego County, CA |
5.71% of this county's 2020 resident taxpayers moved to other counties in 2021 ($106,828 average adjusted gross income)
| Here: | 5.71% |
| California average: | 6.14% |
0.01% of residents moved to foreign countries ($180 average AGI)
Orange County: 0.01% California average: 0.02%
Top counties to which taxpayers relocated from this county between 2020 and 2021:
| to Los Angeles County, CA | |
| to Riverside County, CA | |
| to San Diego County, CA |
| Businesses in Costa Mesa, CA | ||||
| Name | Count | Name | Count | |
|---|---|---|---|---|
| 24 Hour Fitness | 4 | Kincaid | 1 | |
| 7-Eleven | 10 | Kmart | 1 | |
| 99 Cents Only Stores | 1 | Kroger | 1 | |
| ALDO | 1 | La Quinta | 1 | |
| AT&T | 1 | La-Z-Boy | 1 | |
| Abercrombie & Fitch | 1 | Lane Furniture | 3 | |
| Abercrombie Kids | 1 | Little Caesars Pizza | 2 | |
| Ace Hardware | 1 | Macy's | 2 | |
| Albertsons | 1 | Marriott | 2 | |
| American Eagle Outfitters | 1 | Marshalls | 1 | |
| Ann Taylor | 3 | McDonald's | 5 | |
| Apple Store | 1 | Motel 6 | 2 | |
| AutoZone | 1 | Motherhood Maternity | 2 | |
| Avenue | 1 | New Balance | 6 | |
| Banana Republic | 1 | Nike | 12 | |
| Barnes & Noble | 1 | Nissan | 1 | |
| Baskin-Robbins | 2 | Nordstrom | 2 | |
| Bath & Body Works | 1 | Office Depot | 1 | |
| Best Western | 1 | Old Navy | 1 | |
| Big O Tires | 1 | Outback | 1 | |
| Blockbuster | 2 | Outback Steakhouse | 1 | |
| Brooks Brothers | 1 | Pac Sun | 1 | |
| Brookstone | 1 | Panda Express | 2 | |
| Burger King | 1 | Panera Bread | 1 | |
| CVS | 4 | Payless | 3 | |
| Cache | 1 | Penske | 1 | |
| CarMax | 1 | PetSmart | 1 | |
| Carl\s Jr. | 2 | Pier 1 Imports | 1 | |
| Chevrolet | 1 | Pizza Hut | 1 | |
| Chico's | 1 | Pottery Barn | 1 | |
| Chipotle | 1 | Pottery Barn Kids | 1 | |
| Chuck E. Cheese's | 1 | Quiznos | 3 | |
| Circle K | 5 | RadioShack | 2 | |
| Cold Stone Creamery | 2 | Ramada | 1 | |
| Coldwater Creek | 1 | Rite Aid | 3 | |
| Comfort Inn | 1 | Ryder Rental & Truck Leasing | 1 | |
| Crate & Barrel | 1 | Safeway | 1 | |
| Curves | 1 | Saks Fifth Avenue | 1 | |
| Days Inn | 1 | Sears | 3 | |
| Dennys | 2 | Sephora | 1 | |
| Discount Tire | 1 | Soma Intimates | 1 | |
| Domino's Pizza | 2 | Sprint Nextel | 2 | |
| El Pollo Loco | 3 | Staples | 1 | |
| Express | 1 | Starbucks | 11 | |
| Famous Footwear | 1 | Subaru | 1 | |
| FedEx | 13 | Subway | 14 | |
| Firestone Complete Auto Care | 1 | Super 8 | 1 | |
| Foot Locker | 1 | T-Mobile | 6 | |
| Forever 21 | 1 | T.G.I. Driday's | 1 | |
| GNC | 2 | T.J.Maxx | 1 | |
| GameStop | 3 | Taco Bell | 3 | |
| Gap | 1 | Talbots | 2 | |
| Gymboree | 1 | Target | 1 | |
| H&M | 2 | The Limited | 1 | |
| H&R Block | 5 | The Room Place | 1 | |
| Haagen-Dazs | 1 | Toyota | 1 | |
| Hilton | 2 | Trader Joe's | 1 | |
| Holiday Inn | 1 | Travelodge | 2 | |
| Home Depot | 1 | U-Haul | 4 | |
| IHOP | 1 | UPS | 13 | |
| IKEA | 1 | Urban Outfitters | 1 | |
| J. Jill | 1 | Vans | 4 | |
| J.Crew | 1 | Verizon Wireless | 4 | |
| Jamba Juice | 2 | Victoria's Secret | 2 | |
| Jones New York | 4 | Vons | 2 | |
| Journeys | 1 | Wendy's | 1 | |
| Just Tires | 1 | Westin | 1 | |
| Justice | 1 | Wet Seal | 1 | |
| KFC | 2 | Z Gallerie | 1 | |
Strongest AM radio stations in Costa Mesa:
- KFI (640 AM; 50 kW; LOS ANGELES, CA; Owner: CAPSTAR TX LIMITED PARTNERSHIP)
- KVNR (1480 AM; 5 kW; SANTA ANA, CA; Owner: LBI RADIO LICENSE CORP.)
- KPLS (830 AM; 50 kW; ORANGE, CA; Owner: CRN LICENSES, LLC)
- KLAC (570 AM; 50 kW; LOS ANGELES, CA; Owner: AMFM RADIO LICENSES, L.L.C.)
- KTNQ (1020 AM; 50 kW; LOS ANGELES, CA; Owner: KTNQ-AM LICENSE CORP.)
- KXTA (1150 AM; 50 kW; LOS ANGELES, CA; Owner: CITICASTERS LICENSES, L.P.)
- KNX (1070 AM; 50 kW; LOS ANGELES, CA; Owner: INFINITY BROADCASTING OPERATIONS, INC.)
- KFWB (980 AM; 50 kW; LOS ANGELES, CA; Owner: INFINITY BROADCASTING OPERATIONS, INC.)
- KDIS (1110 AM; 50 kW; PASADENA, CA; Owner: ABC,INC.)
- KSPN (710 AM; 50 kW; LOS ANGELES, CA; Owner: KABC-AM RADIO, INC.)
- KMPC (1540 AM; 50 kW; LOS ANGELES, CA; Owner: ROSE CITY RADIO CORPORATION)
- KBLA (1580 AM; 50 kW; SANTA MONICA, CA)
- KXMX (1190 AM; 25 kW; ANAHEIM, CA; Owner: NEW INSPIRATION BROADCASTING COMPANY)
Strongest FM radio stations in Costa Mesa:
- KDLE (103.1 FM; NEWPORT BEACH, CA; Owner: ENTRAVISION HOLDINGS, LLC.)
- KWVE (107.9 FM; SAN CLEMENTE, CA; Owner: CALVARY CHAPEL OF COSTA MESA)
- KCBS-FM (93.1 FM; LOS ANGELES, CA; Owner: INFINITY BROADCASTING OPERATIONS, INC.)
- KZLA-FM (93.9 FM; LOS ANGELES, CA; Owner: EMMIS RADIO LICENSE CORPORATION)
- KALI-FM (106.3 FM; SANTA ANA, CA; Owner: KALI-FM, INC.)
- KPWR (105.9 FM; LOS ANGELES, CA; Owner: EMMIS RADIO LICENSE CORPORATION)
- KLSX (97.1 FM; LOS ANGELES, CA; Owner: INFINITY BROADCASTING OPERATIONS, INC.)
- KSCA (101.9 FM; GLENDALE, CA; Owner: HBC LICENSE CORPORATION)
- KLOS (95.5 FM; LOS ANGELES, CA; Owner: KLOS-FM RADIO, INC.)
- K212FA (90.3 FM; TEMPLE CITY, CA; Owner: EDUCATIONAL MEDIA FOUNDATION)
- KOST (103.5 FM; LOS ANGELES, CA; Owner: CAPSTAR TX LIMITED PARTNERSHIP)
- KUSC (91.5 FM; LOS ANGELES, CA; Owner: UNIVERSITY OF SOUTHERN CALIFORNIA)
- KKLA-FM (99.5 FM; LOS ANGELES, CA; Owner: NEW INSPIRATION BROADCASTING CO., INC.)
- KLVE (107.5 FM; LOS ANGELES, CA; Owner: KLVE-FM LICENSE CORP.)
- KIIS-FM (102.7 FM; LOS ANGELES, CA; Owner: CITICASTERS LICENSES, L.P.)
- KRTH-FM (101.1 FM; LOS ANGELES, CA; Owner: INFINITY BROADCASTING OPERATIONS, INC.)
- KPCC (89.3 FM; PASADENA, CA; Owner: PASADENA AREA COMMUNITY COLLEGE DISTRICT)
- KHHT (92.3 FM; LOS ANGELES, CA; Owner: AMFM RADIO LICENSES, L.L.C.)
- KBIG-FM (104.3 FM; LOS ANGELES, CA; Owner: AMFM RADIO LICENSES, L.L.C.)
- KMZT-FM (105.1 FM; LOS ANGELES, CA; Owner: MOUNT WILSON FM BROADCASTERS, INC.)
TV broadcast stations around Costa Mesa:
- KTRO-LP (Channel 50; LANCASTER, CA; Owner: ROBERT D. ADELMAN)
- KCBS-TV (Channel 2; LOS ANGELES, CA; Owner: CBS BROADCASTING INC.)
- National Bridge Inventory (NBI) Statistics
- 136Number of bridges
- 2,851ft / 869mTotal length
- 10,691,804Total average daily traffic
- 361,941Total average daily truck traffic
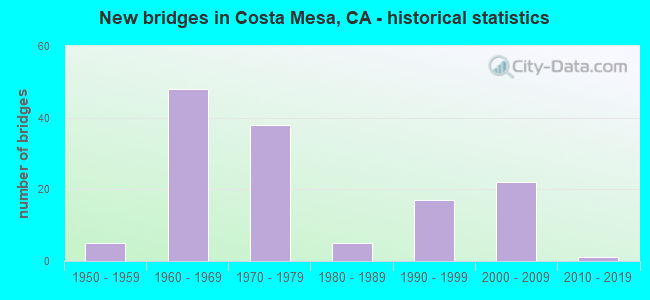
- New bridges - historical statistics
- 51950-1959
- 481960-1969
- 381970-1979
- 51980-1989
- 171990-1999
- 222000-2009
- 12010-2019
FCC Registered Private Land Mobile Towers: 9 (See the full list of FCC Registered Private Land Mobile Towers in Costa Mesa, CA)
FCC Registered Broadcast Land Mobile Towers: 57 (See the full list of FCC Registered Broadcast Land Mobile Towers)
FCC Registered Microwave Towers: 92 (See the full list of FCC Registered Microwave Towers in this town)
FCC Registered Paging Towers: 13 (See the full list of FCC Registered Paging Towers)
FCC Registered Maritime Coast & Aviation Ground Towers: 4 (See the full list of FCC Registered Maritime Coast & Aviation Ground Towers)
FCC Registered Amateur Radio Licenses: 1,007 (See the full list of FCC Registered Amateur Radio Licenses in Costa Mesa)
FAA Registered Aircraft Manufacturers and Dealers: 8 (See the full list of FAA Registered Manufacturers and Dealers in Costa Mesa)
FAA Registered Aircraft: 119 (See the full list of FAA Registered Aircraft)
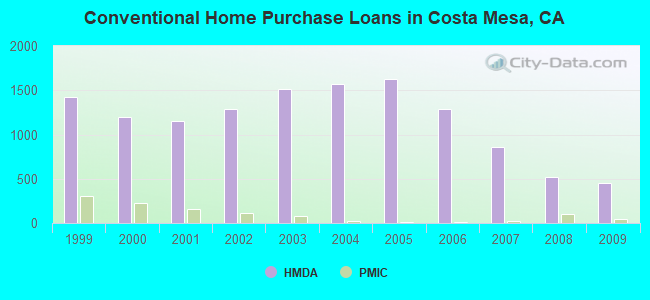
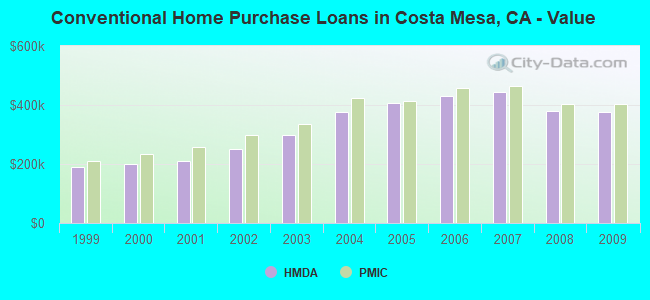
| Home Mortgage Disclosure Act Aggregated Statistics For Year 2009 (Based on 21 full and 5 partial tracts) | ||||||||||||||
| A) FHA, FSA/RHS & VA Home Purchase Loans | B) Conventional Home Purchase Loans | C) Refinancings | D) Home Improvement Loans | E) Loans on Dwellings For 5+ Families | F) Non-occupant Loans on < 5 Family Dwellings (A B C & D) | G) Loans On Manufactured Home Dwelling (A B C & D) | ||||||||
|---|---|---|---|---|---|---|---|---|---|---|---|---|---|---|
| Number | Average Value | Number | Average Value | Number | Average Value | Number | Average Value | Number | Average Value | Number | Average Value | Number | Average Value | |
| LOANS ORIGINATED | 181 | $451,650 | 452 | $377,717 | 1,724 | $331,621 | 88 | $246,284 | 6 | $802,587 | 179 | $338,575 | 4 | $137,500 |
| APPLICATIONS APPROVED, NOT ACCEPTED | 14 | $426,409 | 61 | $379,326 | 190 | $344,913 | 11 | $161,318 | 0 | $0 | 19 | $311,393 | 4 | $74,392 |
| APPLICATIONS DENIED | 48 | $461,566 | 107 | $387,628 | 509 | $386,669 | 23 | $220,490 | 4 | $1,853,250 | 96 | $350,198 | 8 | $37,576 |
| APPLICATIONS WITHDRAWN | 36 | $451,499 | 98 | $373,577 | 342 | $360,200 | 18 | $236,641 | 0 | $0 | 48 | $300,671 | 1 | $35,090 |
| FILES CLOSED FOR INCOMPLETENESS | 6 | $412,847 | 17 | $361,724 | 101 | $363,143 | 5 | $203,168 | 0 | $0 | 7 | $411,343 | 0 | $0 |
Detailed mortgage data for all 26 tracts in Costa Mesa, CA
| Private Mortgage Insurance Companies Aggregated Statistics For Year 2009 (Based on 18 full and 4 partial tracts) | ||||
| A) Conventional Home Purchase Loans | B) Refinancings | |||
|---|---|---|---|---|
| Number | Average Value | Number | Average Value | |
| LOANS ORIGINATED | 46 | $402,367 | 10 | $461,990 |
| APPLICATIONS APPROVED, NOT ACCEPTED | 15 | $431,581 | 5 | $463,004 |
| APPLICATIONS DENIED | 13 | $422,296 | 5 | $322,234 |
| APPLICATIONS WITHDRAWN | 5 | $349,544 | 1 | $486,000 |
| FILES CLOSED FOR INCOMPLETENESS | 3 | $432,000 | 0 | $0 |
2005 - 2018 National Fire Incident Reporting System (NFIRS) incidents
- Fire incident types reported to NFIRS in Costa Mesa, CA
- 1,01138.5%Structure Fires
- 91034.6%Outside Fires
- 53720.4%Mobile Property/Vehicle Fires
- 1696.4%Other
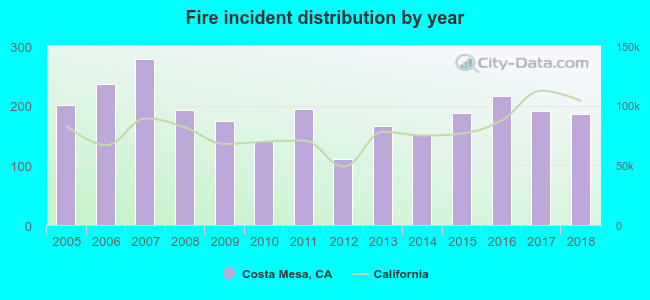 Based on the data from the years 2005 - 2018 the average number of fire incidents per year is 188. The highest number of reported fires - 279 took place in 2007, and the least - 110 in 2012. The data has a dropping trend.
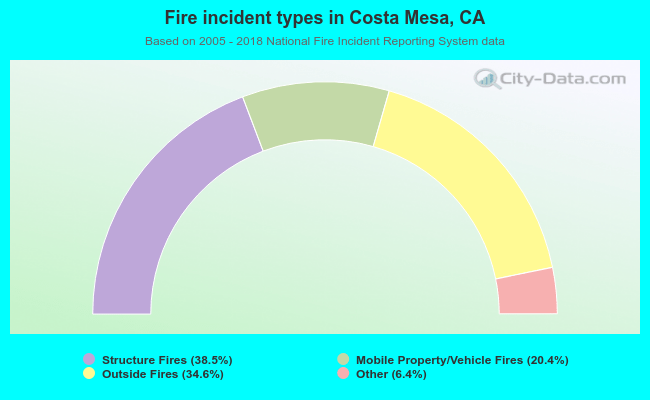 When looking into fire subcategories, the most reports belonged to: Structure Fires (38.5%), and Outside Fires (34.6%).
Fire-safe hotels and motels in Costa Mesa, California:
- La Quinta Inn 4541, 1515 S Coast Dr, Costa Mesa, California 92626 , Phone: (714) 957-5841, Fax: (714) 432-7159
- Avenue of the Arts Costa Mesa, 3350 Ave Of The Arts, Costa Mesa, California 92626 , Phone: (714) 751-5100, Fax: (714) 751-0129
- Westin South Coast Plaza, 686 Anton Blvd, Costa Mesa, California 92626 , Phone: (714) 540-2500, Fax: (714) 662-6608
- Comfort Inn, 2430 Newport Blvd, Costa Mesa, California 92626 , Phone: (949) 631-7840, Fax: (949) 548-3720
- Hilton Costa Mesa, 3050 Bristol St, Costa Mesa, California 92626 , Phone: (714) 540-7000, Fax: (714) 540-9176
- Crowne Plaza Costa Mesa Orange County, 3131 Bristol St, Costa Mesa, California 92626 , Phone: (714) 557-3000, Fax: (714) 957-8185
- Ayres Hotel & Suites Costa Mesa/Newport Beach, 325 Bristol St, Costa Mesa, California 92626 , Phone: (714) 549-0300, Fax: (714) 662-0828
- Residence Inn Costa Mesa Newport Beach, 881 Baker St, Costa Mesa, California 92626 , Phone: (714) 241-8800, Fax: (714) 546-4308
- 7 other hotels and motels
| Most common first names in Costa Mesa, CA among deceased individuals | ||
| Name | Count | Lived (average) |
|---|---|---|
| John | 472 | 72.1 years |
| Robert | 383 | 69.8 years |
| William | 363 | 74.0 years |
| Mary | 343 | 79.0 years |
| James | 283 | 69.7 years |
| George | 244 | 74.8 years |
| Helen | 233 | 79.9 years |
| Charles | 213 | 75.4 years |
| Margaret | 189 | 78.7 years |
| Joseph | 185 | 72.3 years |
| Most common last names in Costa Mesa, CA among deceased individuals | ||
| Last name | Count | Lived (average) |
|---|---|---|
| Smith | 166 | 74.6 years |
| Johnson | 115 | 74.2 years |
| Brown | 94 | 75.5 years |
| Miller | 74 | 72.0 years |
| Wilson | 66 | 75.8 years |
| Moore | 63 | 73.2 years |
| Anderson | 60 | 76.0 years |
| Jones | 58 | 71.5 years |
| Davis | 54 | 74.6 years |
| Nelson | 52 | 71.0 years |
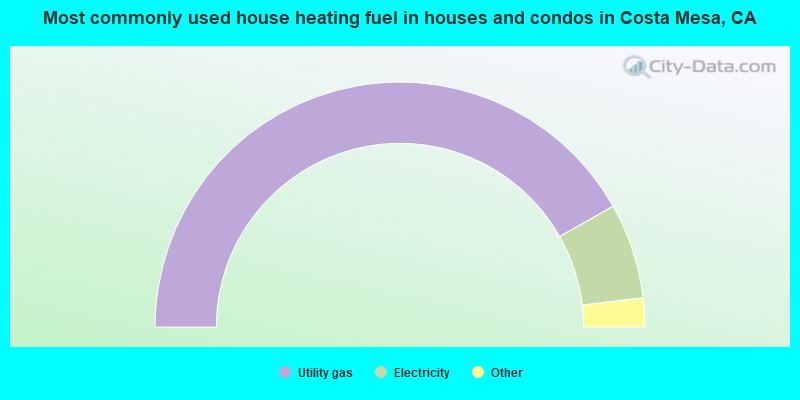
- 83.6%Utility gas
- 12.6%Electricity
- 1.4%No fuel used
- 1.1%Bottled, tank, or LP gas
- 1.1%Solar energy
- 0.2%Wood
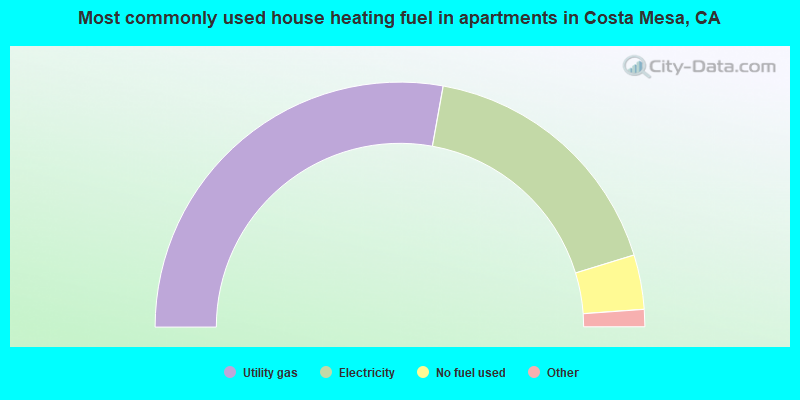
- 55.7%Utility gas
- 34.9%Electricity
- 7.2%No fuel used
- 2.1%Bottled, tank, or LP gas
- 0.1%Other fuel
Costa Mesa compared to California state average:
- Median house value above state average.
- Unemployed percentage significantly below state average.
- Black race population percentage significantly below state average.
- Percentage of population with a bachelor's degree or higher above state average.
Costa Mesa, CA compared to other similar cities:
Costa Mesa on our top lists:
- #15 on the list of "Top 101 larger cities with the highest increase in house/condo value from 2000 (population 50,000+)"
- #21 on the list of "Top 101 cities with largest percentage of females in occupations: business and financial operations occupations (population 50,000+)"
- #24 on the list of "Top 100 cities with highest ratio of median house value to median household income (pop. 50,000+)"
- #28 on the list of "Top 101 cities with largest percentage of males in occupations: food preparation and serving related occupations (population 50,000+)"
- #29 on the list of "Top 101 cities with largest percentage of males in occupations: health technologists and technicians (population 50,000+)"
- #31 on the list of "Top 101 cities with largest percentage of females in industries: real estate and rental and leasing (population 50,000+)"
- #32 on the list of "Top 101 cities with the smallest temperature differences during a year (population 50,000+)"
- #39 on the list of "Top 101 cities with largest percentage of females in occupations: arts, design, entertainment, sports, and media occupations (population 50,000+)"
- #39 on the list of "Top 101 cities with the largest city-data.com crime index increase from 2002 to 2012 (population 50,000+)"
- #39 on the list of "Top 100 cities with the largest percentage of males (pop. 50,000+)"
- #42 on the list of "Top 101 cities with largest percentage of males in industries: accommodation and food services (population 50,000+)"
- #46 on the list of "Top 101 cities with largest percentage of males in industries: real estate and rental and leasing (population 50,000+)"
- #47 on the list of "Top 101 cities with largest percentage of females in industries: arts, entertainment, and recreation (population 50,000+)"
- #50 on the list of "Top 100 cities with highest median house value (pop. 50,000+)"
- #51 on the list of "Top 101 cities with largest percentage of females in occupations: personal care and service occupations (population 50,000+)"
- #57 on the list of "Top 101 cities with the largest city-data.com crime index increase from 2011 to 2012 (population 50,000+)"
- #58 on the list of "Top 100 cities with highest percentage of renters (pop. 50,000+)"
- #72 on the list of "Top 101 cities with the largest percentage of people in schools, hospitals, or wards for the mentally retarded (population 1,000+)"
- #75 on the list of "Top 101 cities with largest percentage of males in industries: arts, entertainment, and recreation (population 50,000+)"
- #75 on the list of "Top 100 cities with highest median household income and median resident age less than 35 (pop. 50,000+)"
- #5 (92660) on the list of "Top 101 zip codes with the most finance and insurance companies in 2005"
- #9 (92660) on the list of "Top 101 zip codes with the most Internet business establishments in 2005"
- #26 (92660) on the list of "Top 101 zip codes with the most offices of physicians in 2005"
- #35 (92626) on the list of "Top 101 zip codes with the most medium-big companies in 2005 (at least 100 employees)"
- #35 (92660) on the list of "Top 101 zip codes with the most offices of lawyers in 2005"
- #36 (92626) on the list of "Top 101 zip codes with the most big companies in 2005 (at least 1000 employees)"
- #57 (92660) on the list of "Top 101 zip codes with the most beauty salons in 2005"
- #4 on the list of "Top 101 counties with the highest total withdrawal of fresh water for public supply"
- #5 on the list of "Top 101 counties with the most Catholic adherents"
- #6 on the list of "Top 101 counties with the highest ground withdrawal of fresh water for public supply"
- #7 on the list of "Top 101 counties with the most Evangelical Protestant adherents"
- #8 on the list of "Top 101 counties with the highest Particulate Matter (PM2.5) Annual air pollution readings in 2012 (µg/m3)"

|
|
Total of 1492 patent applications in 2008-2024.