Estimated zip code population in 2022: 35,627 Zip code population in 2010: 34,797 Zip code population in 2000: 28,672
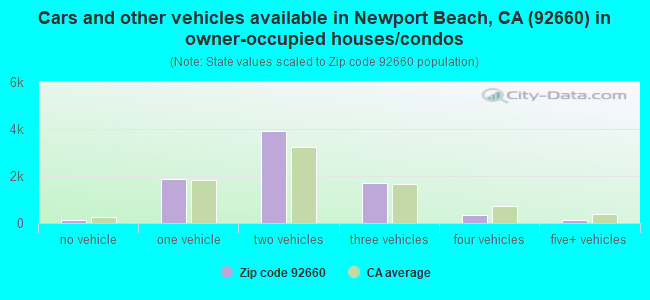
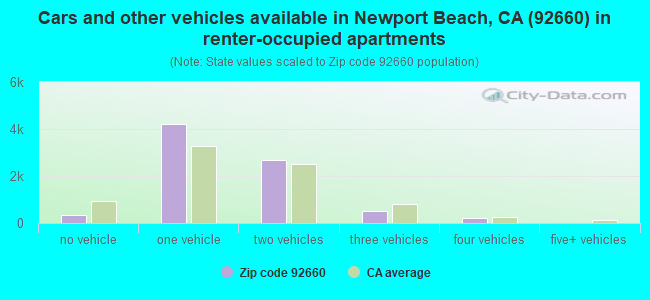
Houses and condos: 17,544 Renter-occupied apartments: 7,895
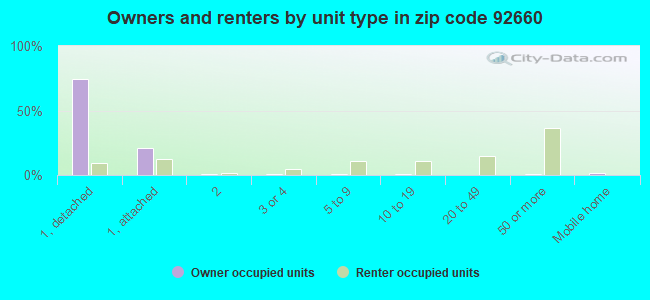
% of renters here:
50%
State:
44%
March 2022 cost of living index in zip code 92660: 91.9 (less than average, U.S. average is 100)
Land area: 9.8 sq. mi. Water area: 1.1 sq. mi.
Population density: 3,653 people per square mile
(average).
OSM Map
General Map
Google Map
MSN Map
OSM Map
General Map
Google Map
MSN Map
OSM Map
General Map
Google Map
MSN Map
OSM Map
General Map
Google Map
MSN Map
Please wait while loading the map...
Real estate property taxes paid for housing units in 2022:
This zip code:
0.5% ($10,292)
California:
0.7% ($4,831)
Median real estate property taxes paid for housing units with mortgages in 2022: $10,330 (0.5%) Median real estate property taxes paid for housing units with no mortgage in 2022: $10,572 (0.5%)
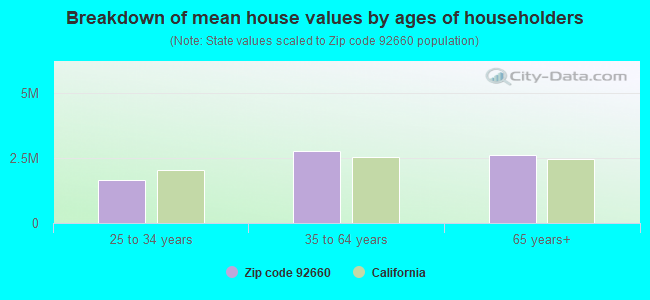
Estimated median house/condo value in 2022: $2,171,698
92660:
$2,171,698
California:
$715,900
According to our research of California and other state lists, there were 5 registered sex offenders living in 92660 zip code as of April 27, 2024. The ratio of all residents to sex offenders in zip code 92660 is 7,290 to 1. The ratio of registered sex offenders to all residents in this zip code is much lower than the state average.
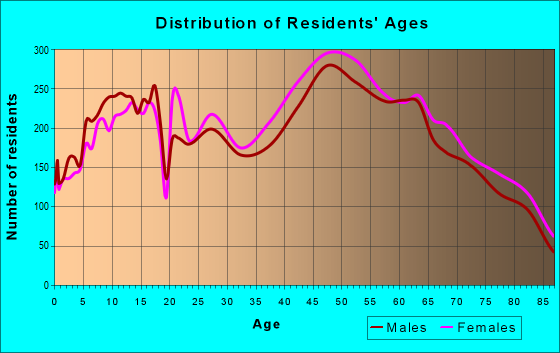
Median resident age:
This zip code:
45.7 years
California median age:
37.9 years
Average household size:
This zip code:
2.2 people
California:
2.8 people
Averages for the 2020 tax year for zip code 92660, filed in 2021:
Average Adjusted Gross Income (AGI) in 2020: $303,528 (Individual Income Tax Returns)
Here:
$303,528
State:
$95,910
Salary/wage: $183,760 (reported on 68.7% of returns)
Here:
$183,760
State:
$77,331
(% of AGI for various income ranges: 1241.1% for AGIs below $25k, 4071.4% for AGIs $25k-50k, 7694.1% for AGIs $50k-75k, 11641.4% for AGIs $75k-100k, 22428.2% for AGIs $100k-200k, 198626.3% for AGIs over 200k)
Taxable interest for individuals: $11,189 (reported on 55.6% of returns)
This zip code:
$11,189
California:
$2,294
(% of AGI for various income ranges: 71.3% for AGIs below $25k, 155.5% for AGIs $25k-50k, 248.7% for AGIs $50k-75k, 353.2% for AGIs $75k-100k, 813.0% for AGIs $100k-200k, 10531.4% for AGIs over 200k)
Ordinary dividends: $38,709 (reported on 48.7% of returns)
Here:
$38,709
State:
$10,949
(% of AGI for various income ranges: 175.3% for AGIs below $25k, 319.1% for AGIs $25k-50k, 562.1% for AGIs $50k-75k, 848.3% for AGIs $75k-100k, 2219.2% for AGIs $100k-200k, 32920.4% for AGIs over 200k)
Net capital gain/loss in AGI: +$107,974 (reported on 49.2% of returns)
Here:
+$107,974
State:
+$49,306
(% of AGI for various income ranges: 108.2% for AGIs below $25k, 241.9% for AGIs $25k-50k, 422.7% for AGIs $50k-75k, 673.3% for AGIs $75k-100k, 2115.6% for AGIs $100k-200k, 102628.6% for AGIs over 200k)
Profit/loss from business: +$33,084 (reported on 24.7% of returns)
Here:
+$33,084
State:
+$15,671
(% of AGI for various income ranges: 288.0% for AGIs below $25k, 600.8% for AGIs $25k-50k, 784.3% for AGIs $50k-75k, 892.8% for AGIs $75k-100k, 2114.3% for AGIs $100k-200k, 10648.7% for AGIs over 200k)
Taxable individual retirement arrangement distribution: $39,061 (reported on 12.0% of returns)
92660:
$39,061
California:
$23,505
(% of AGI for various income ranges: 94.8% for AGIs below $25k, 219.3% for AGIs $25k-50k, 327.3% for AGIs $50k-75k, 760.6% for AGIs $75k-100k, 1868.0% for AGIs $100k-200k, 5462.8% for AGIs over 200k)
Self-employed (Keogh) retirement plans: $44,069 (reported on 3.5% of returns)
92660:
$44,069
California:
$30,163
(% of AGI for various income ranges: 8.6% for AGIs below $25k, 54.6% for AGIs $50k-75k, 250.5% for AGIs $100k-200k, 2719.2% for AGIs over 200k)
Total itemized deductions: $81,015 (reported on 33.2% of returns)
Here:
$81,015
State:
$39,517
(% of AGI for various income ranges: 387.6% for AGIs below $25k, 722.6% for AGIs $25k-50k, 1324.2% for AGIs $50k-75k, 1924.2% for AGIs $75k-100k, 4509.1% for AGIs $100k-200k, 43391.8% for AGIs over 200k)
Charity contributions: $26,949 (reported on 29.6% of returns)
Here:
$26,949
State:
$12,598
(% of AGI for various income ranges: 16.1% for AGIs below $25k, 66.5% for AGIs $25k-50k, 152.6% for AGIs $50k-75k, 243.8% for AGIs $75k-100k, 801.7% for AGIs $100k-200k, 14491.1% for AGIs over 200k)
Taxes paid: $9,281 (reported on 33.2% of returns)
92660:
$9,281
State:
$8,807
(% of AGI for various income ranges: 78.0% for AGIs below $25k, 157.2% for AGIs $25k-50k, 265.3% for AGIs $50k-75k, 432.0% for AGIs $75k-100k, 1025.5% for AGIs $100k-200k, 3826.7% for AGIs over 200k)
Earned income credit: $1,299 (reported on 5.1% of returns)
Here:
$1,299
State:
$2,074
(% of AGI for various income ranges: 41.8% for AGIs below $25k, 33.8% for AGIs $25k-50k)
Percentage of individuals using paid preparers for their 2020 taxes: 93.0%
Here:
93%
State:
92%
(% for various income ranges: 90.6% for AGIs below $25k, 93.2% for AGIs $25k-50k, 92.7% for AGIs $50k-75k, 94.0% for AGIs $75k-100k, 93.5% for AGIs $100k-200k, 94.3% for AGIs over 200k)
Averages for the 2012 tax year for zip code 92660, filed in 2013:
Average Adjusted Gross Income (AGI) in 2012: $250,636 (Individual Income Tax Returns)
Here:
$250,636
State:
$72,726
Salary/wage: $141,595 (reported on 69.2% of returns)
Here:
$141,595
State:
$59,079
(% of AGI for various income ranges: 58.8% for AGIs below $25k, 64.0% for AGIs $25k-50k, 63.0% for AGIs $50k-75k, 60.0% for AGIs $75k-100k, 58.9% for AGIs $100k-200k, 34.0% for AGIs over 200k)
Taxable interest for individuals: $11,061 (reported on 57.6% of returns)
This zip code:
$11,061
California:
$2,146
(% of AGI for various income ranges: 4.7% for AGIs below $25k, 2.3% for AGIs $25k-50k, 2.3% for AGIs $50k-75k, 1.9% for AGIs $75k-100k, 2.3% for AGIs $100k-200k, 2.6% for AGIs over 200k)
Ordinary dividends: $33,126 (reported on 46.3% of returns)
Here:
$33,126
State:
$9,308
(% of AGI for various income ranges: 8.1% for AGIs below $25k, 4.4% for AGIs $25k-50k, 4.6% for AGIs $50k-75k, 4.0% for AGIs $75k-100k, 4.5% for AGIs $100k-200k, 6.5% for AGIs over 200k)
Net capital gain/loss in AGI: +$128,015 (reported on 46.2% of returns)
Here:
+$128,015
State:
+$30,460
(% of AGI for various income ranges: 1.6% for AGIs $25k-50k, 1.9% for AGIs $50k-75k, 2.1% for AGIs $75k-100k, 3.0% for AGIs $100k-200k, 28.7% for AGIs over 200k)
Profit/loss from business: +$34,457 (reported on 24.7% of returns)
Here:
+$34,457
State:
+$17,064
(% of AGI for various income ranges: 14.5% for AGIs below $25k, 11.3% for AGIs $25k-50k, 7.6% for AGIs $50k-75k, 7.3% for AGIs $75k-100k, 6.9% for AGIs $100k-200k, 2.3% for AGIs over 200k)
Taxable individual retirement arrangement distribution: $37,672 (reported on 16.3% of returns)
92660:
$37,672
California:
$19,557
(% of AGI for various income ranges: 5.6% for AGIs below $25k, 4.6% for AGIs $25k-50k, 4.7% for AGIs $50k-75k, 5.3% for AGIs $75k-100k, 5.7% for AGIs $100k-200k, 1.8% for AGIs over 200k)
Self-employment retirement plans: $31,660 (reported on 3.7% of returns)
92660:
$31,660
California:
$24,530
(% of AGI for various income ranges: 0.4% for AGIs $25k-50k, 0.4% for AGIs $50k-75k, 0.3% for AGIs $75k-100k, 0.7% for AGIs $100k-200k, 0.5% for AGIs over 200k)
Total itemized deductions: $78,117 (20% of AGI, reported on 59.0% of returns)
Here:
$78,117
State:
$34,004
Here:
19.7% of AGI
State:
22.7% of AGI
(% of AGI for various income ranges: 34.6% for AGIs below $25k, 21.6% for AGIs $25k-50k, 21.6% for AGIs $50k-75k, 23.5% for AGIs $75k-100k, 24.8% for AGIs $100k-200k, 17.0% for AGIs over 200k)
Charity contributions: $12,961 (reported on 51.5% of returns)
Here:
$12,961
State:
$4,659
(% of AGI for various income ranges: 1.6% for AGIs below $25k, 1.6% for AGIs $25k-50k, 2.1% for AGIs $50k-75k, 2.3% for AGIs $75k-100k, 2.7% for AGIs $100k-200k, 2.7% for AGIs over 200k)
Taxes paid: $41,255 (reported on 58.9% of returns)
92660:
$41,255
State:
$14,448
(% of AGI for various income ranges: 6.8% for AGIs below $25k, 5.1% for AGIs $25k-50k, 6.6% for AGIs $50k-75k, 8.0% for AGIs $75k-100k, 9.6% for AGIs $100k-200k, 10.0% for AGIs over 200k)
Earned income credit: $1,386 (reported on 5.4% of returns)
Here:
$1,386
State:
$2,286
(% of AGI for various income ranges: 2.2% for AGIs below $25k, 0.3% for AGIs $25k-50k)
Percentage of individuals using paid preparers for their 2012 taxes: 72.0%
Here:
72%
State:
64%
(% for various income ranges: 61.3% for AGIs below $25k, 62.9% for AGIs $25k-50k, 67.2% for AGIs $50k-75k, 72.5% for AGIs $75k-100k, 77.7% for AGIs $100k-200k, 86.8% for AGIs over 200k)
Averages for the 2004 tax year for zip code 92660, filed in 2005:
Average Adjusted Gross Income (AGI) in 2004: $191,983 (Individual Income Tax Returns)
Here:
$191,983
State:
$58,600
Salary/wage: $129,252 (reported on 67.5% of returns)
Here:
$129,252
State:
$49,455
(% of AGI for various income ranges: 57.7% for AGIs $10k-25k, 65.6% for AGIs $25k-50k, 62.1% for AGIs $50k-75k, 62.4% for AGIs $75k-100k, 39.3% for AGIs over 100k)
Taxable interest for individuals: $13,116 (reported on 67.5% of returns)
This zip code:
$13,116
California:
$2,365
(% of AGI for various income ranges: 6.0% for AGIs $10k-25k, 3.7% for AGIs $25k-50k, 3.4% for AGIs $50k-75k, 2.9% for AGIs $75k-100k, 4.2% for AGIs over 100k)
Taxable dividends: $17,608 (reported on 53.2% of returns)
Here:
$17,608
State:
$4,746
(% of AGI for various income ranges: 7.0% for AGIs $10k-25k, 4.2% for AGIs $25k-50k, 4.1% for AGIs $50k-75k, 3.3% for AGIs $75k-100k, 4.4% for AGIs over 100k)
Net capital gain/loss: +$91,228 (reported on 52.3% of returns)
Here:
+$91,228
State:
+$23,418
(% of AGI for various income ranges: 1.5% for AGIs $10k-25k, 1.1% for AGIs $25k-50k, 2.3% for AGIs $50k-75k, 2.8% for AGIs $75k-100k, 24.7% for AGIs over 100k)
Profit/loss from business: +$40,932 (reported on 24.4% of returns)
Here:
+$40,932
State:
+$16,826
(% of AGI for various income ranges: 15.3% for AGIs $10k-25k, 8.9% for AGIs $25k-50k, 8.4% for AGIs $50k-75k, 8.7% for AGIs $75k-100k, 4.3% for AGIs over 100k)
IRA payment deduction: $3,890 (reported on 3.9% of returns)
92660:
$3,890
California:
$3,192
(% of AGI for various income ranges: 0.4% for AGIs $10k-25k, 0.3% for AGIs $25k-50k, 0.3% for AGIs $50k-75k, 0.2% for AGIs $75k-100k, 0.0% for AGIs over 100k)
Self-employed pension: $28,808 (reported on 5.0% of returns)
Here:
$28,808
California:
$17,688
(% of AGI for various income ranges: 0.5% for AGIs $10k-25k, 0.3% for AGIs $25k-50k, 0.5% for AGIs $50k-75k, 0.7% for AGIs $75k-100k, 0.7% for AGIs over 100k)
Total itemized deductions: $65,465 (20% of AGI, reported on 60.4% of returns)
Here:
$65,465
State:
$28,113
Here:
20.2% of AGI
State:
25.3% of AGI
(% of AGI for various income ranges: 33.4% for AGIs $10k-25k, 24.6% for AGIs $25k-50k, 25.6% for AGIs $50k-75k, 27.1% for AGIs $75k-100k, 18.1% for AGIs over 100k)
Charity contributions deductions: $12,275 (4% of AGI, reported on 54.5% of returns)
Here:
$12,275
State:
$3,923
Here:
3.6% of AGI
State:
3.3% of AGI
(% of AGI for various income ranges: 2.3% for AGIs $10k-25k, 2.5% for AGIs $25k-50k, 2.7% for AGIs $50k-75k, 3.3% for AGIs $75k-100k, 3.3% for AGIs over 100k)
Total tax: $52,193 (reported on 84.3% of returns)
92660:
$52,193
State:
$10,761
(% of AGI for various income ranges: 6.5% for AGIs $10k-25k, 9.0% for AGIs $25k-50k, 11.3% for AGIs $50k-75k, 12.7% for AGIs $75k-100k, 22.5% for AGIs over 100k)
Earned income credit: $980 (reported on 3.4% of returns)
Here:
$980
State:
$1,763
Percentage of individuals using paid preparers for their 2004 taxes: 75.2%
Here:
75%
State:
66%
(% for various income ranges: 70.2% for AGIs below $10k, 66.4% for AGIs $10k-25k, 66.3% for AGIs $25k-50k, 71.6% for AGIs $50k-75k, 76.8% for AGIs $75k-100k, 84.8% for AGIs over 100k)
Likely homosexual households (counted as self-reported same-sex unmarried-partner households)
Lesbian couples: 0.2% of all households
Gay men: 0.3% of all households
Household received Food Stamps/SNAP in the past 12 months: 256 Household did not receive Food Stamps/SNAP in the past 12 months: 15,317
Women who had a birth in the past 12 months: 239 (206 now married, 32 unmarried) Women who did not have a birth in the past 12 months: 7,053 (3,099 now married, 3,941 unmarried)
Housing units in zip code 92660 with a mortgage: 5,311 (607 second mortgage, 606 both second mortgage and home equity loan) Houses without a mortgage: 68
Median monthly owner costs for units with a mortgage: $3,876 Median monthly owner costs for units without a mortgage: $1,556
Residents with income below the poverty level in 2022:
This zip code:
8.0%
Whole state:
12.2%
Residents with income below 50% of the poverty level in 2022:
This zip code:
2.9%
Whole state:
6.2%
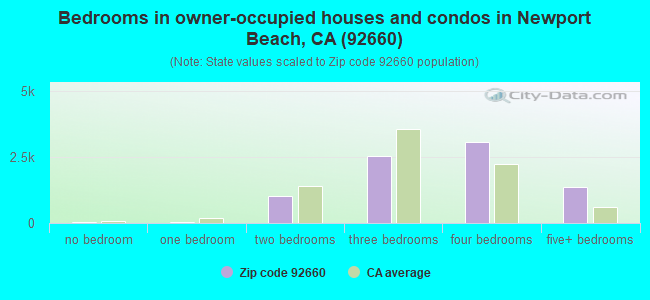
Median number of rooms in houses and condos:
Here:
7.0
State:
6.0
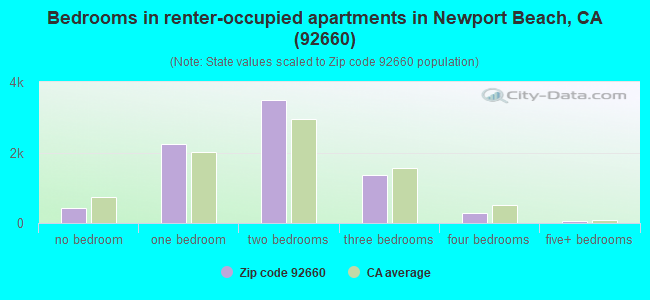
Median number of rooms in apartments:
Here:
3.9
State:
3.9
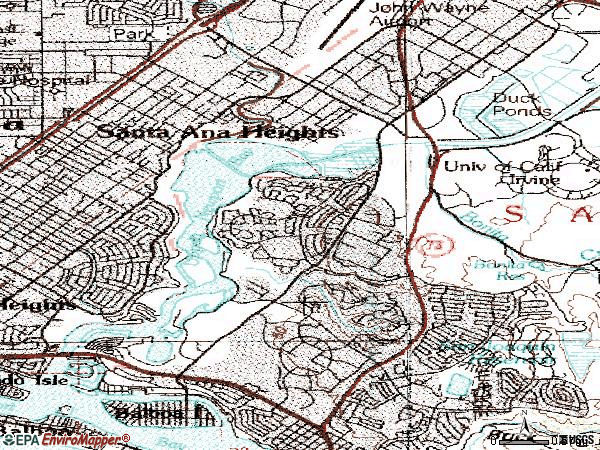
Notable locations in this zip code not listed on our city pages
Notable locations in zip code 92660: Shark Island Yacht Club (A), Newport Beach Golf Course (B), Newport Beach Public Library (C), Mariners Branch Newport Beach Public Library (D), Newport Beach Fire Department Station 7 (E), Newport Beach Fire Department Station 6 (F), Newport Beach Fire Department Station 3 (G). Display/hide their locations on the map
Shopping Centers: Newport Hills Shopping Center (1), Westcliff Plaza Shopping Center (2), Fashion Island Shopping Center (3), Bayside Center Shopping Center (4). Display/hide their locations on the map
Parks in zip code 92660 include: Galaxie View Park (1), Upper Newport Bay Ecological Reserve (2), East Bluff Park (3), Mariners Park (4), Westcliff Park (5), Bonita Creek Park (6), Buffalo Hills Park (7), Harbor View Nature Park (8), San Miguel Park (9). Display/hide their locations on the map
5,466 married couples with children.
1,340 single-parent households (385 men, 955 women).
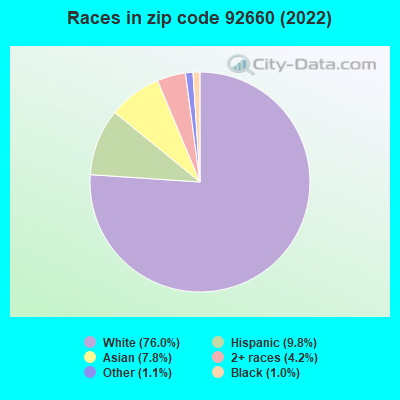
81.3% of residents of 92660 zip code speak English at home.
5.6% of residents speak Spanish at home (78% very well, 15% well, 7% not well).
8.2% of residents speak other Indo-European language at home (85% very well, 12% well, 2% not well, 1% not at all).
4.2% of residents speak Asian or Pacific Island language at home (65% very well, 27% well, 7% not well, 1% not at all).
0.7% of residents speak other language at home (87% very well, 5% well, 8% not well).
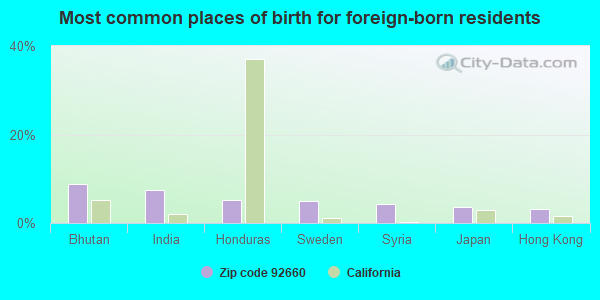
Foreign born population: 5,514 (15.5%) (61.5% of them are naturalized citizens)
Major facilities with environmental interests located in this zip code:
NEWPORT FAB L.L.C. (DBA JAZZ SEMICONDUCTOR (4321 JAMBOREE RD. in NEWPORT BEACH, CA)
STATE MASTER (California - Hazardous Waste Tracking) - HAZARDOU WASTE PROGRAM CRITERIA AND HAZARDOUS AIR POLLUTANT INVENTORY (Inventory of air pollution sources) Large Quantity Generators, more that 1000 kg of hazardous waste/month (Resource Conservation and Recovery Act (tracking hazardous waste)) - notification - ICIS-, ENFORCEMENT/COMPLIANCE ACTIVITY TRI REPORTER (Tracking of toxic chemicals releasing facilities) Business SIC classification: SEMICONDUCTORS AND RELATED DEVICES Organizations: NEWPORT FAB,LLC (DBA) JAZZ SEMICONDUCTOR (CONTACT/OPERATOR)
, NEWPORT FAB, LLC (CONTACT/OWNER)
Alternative names: NEWPORT FAB L L C, NEWPORT FAB LLC DBA JAZZ SEMICONDUCTOR
NEWPORT BEACH CARS L L C (445 E PACIFIC COAST HWY in NEWPORT BEACH, CA)
STATE MASTER (California - Hazardous Waste Tracking) - HAZARDOU WASTE PROGRAM Small Quantity Generators, between 100 kg and 1000 kg of hazardous waste/month (Resource Conservation and Recovery Act (tracking hazardous waste)) - notification Alternative names: NEWPORT AUTO CENTER
LAND ROVER NEWPORT BEACH (1540 JAMBOREE RD in NEWPORT BEACH, CA)
STATE MASTER (California - Hazardous Waste Tracking) - HAZARDOU WASTE PROGRAM Small Quantity Generators, between 100 kg and 1000 kg of hazardous waste/month (Resource Conservation and Recovery Act (tracking hazardous waste)) Organizations: MARTY ALBANESE (CONTACT/OPERATOR)
, PENDRAGON NORTH AMERICA (CONTACT/OWNER)
Alternative names: NEWPORT ENTERPRISES DBA LAND ROVER
NEWPORT CLEANERS (106 TUSTIN in NEWPORT BEACH, CA)
STATE MASTER (California - Hazardous Waste Tracking) - HAZARDOU WASTE PROGRAM Small Quantity Generators, between 100 kg and 1000 kg of hazardous waste/month (Resource Conservation and Recovery Act (tracking hazardous waste)) - notification Organizations: MILO OZBAG (CONTACT/OWNER)
NEWPORT MESA UNIF SCHOOL DIST (2101 EASTBLUFF DR in NEWPORT BEACH, CA)
STATE MASTER (California - Hazardous Waste Tracking) - HAZARDOU WASTE PROGRAM Small Quantity Generators, between 100 kg and 1000 kg of hazardous waste/month (Resource Conservation and Recovery Act (tracking hazardous waste)) - notification
NEWPORTH NORTH CLEANERS (1280 BISON AVE in NEWPORT BEACH, CA)
STATE MASTER (California - Hazardous Waste Tracking) - HAZARDOU WASTE PROGRAM Small Quantity Generators, between 100 kg and 1000 kg of hazardous waste/month (Resource Conservation and Recovery Act (tracking hazardous waste)) - notification Organizations: YERVANT HACADURYAN (CONTACT/OWNER)
NEWPORT CENTER ANIMAL HOSPITAL (1333 AVOCADO in NEWPORT BEACH, CA)
STATE MASTER (California - Hazardous Waste Tracking) - HAZARDOU WASTE PROGRAM Small Quantity Generators, between 100 kg and 1000 kg of hazardous waste/month (Resource Conservation and Recovery Act (tracking hazardous waste)) - notification Organizations: JAMES E RICH DVM (CONTACT/OWNER)
CELEBRITY CLEANERS (3601 JAMBORREE RD STE 12 in NEWPORT BEACH, CA)
STATE MASTER (California - Hazardous Waste Tracking) - HAZARDOU WASTE PROGRAM Small Quantity Generators, between 100 kg and 1000 kg of hazardous waste/month (Resource Conservation and Recovery Act (tracking hazardous waste)) - notification Organizations: MIJANOW PHAM (CONTACT/OWNER)
EMERALD CLEANERS (4341 MCARTHUR BLVD in NEWPORT BEACH, CA)
STATE MASTER (California - Hazardous Waste Tracking) - HAZARDOU WASTE PROGRAM Small Quantity Generators, between 100 kg and 1000 kg of hazardous waste/month (Resource Conservation and Recovery Act (tracking hazardous waste)) - notification Organizations: HOUSHANG HAKIMDAUR (CONTACT/OWNER)
FLETCHER JONES MOTORCARS (3300 JAMBOREE RD in NEWPORT BEACH, CA)
STATE MASTER (California - Hazardous Waste Tracking) - HAZARDOU WASTE PROGRAM Small Quantity Generators, between 100 kg and 1000 kg of hazardous waste/month (Resource Conservation and Recovery Act (tracking hazardous waste)) - notification Organizations: FLETCHER JONES MOTORCARS INC (CONTACT/OWNER)
CHEVRON STATION NO 93042 (1550 JAMBOREE RD in NEWPORT BEACH, CA)
STATE MASTER (California - Hazardous Waste Tracking) - HAZARDOU WASTE PROGRAM Small Quantity Generators, between 100 kg and 1000 kg of hazardous waste/month (Resource Conservation and Recovery Act (tracking hazardous waste)) - notification Organizations: CHEVRON PRODUCTS CO (CONTACT/OWNER)
HERTZ CORP (4000 CAMPUS DR in NEWPORT BEACH, CA)
STATE MASTER (California - Hazardous Waste Tracking) - HAZARDOU WASTE PROGRAM Small Quantity Generators, between 100 kg and 1000 kg of hazardous waste/month (Resource Conservation and Recovery Act (tracking hazardous waste)) Business NAICS classification: PASSENGER CAR RENTAL.
HOAG SURGICARE (1441 AVOCADO STE 100 in NEWPORT BEACH, CA)
STATE MASTER (California - Hazardous Waste Tracking) - HAZARDOU WASTE PROGRAM Small Quantity Generators, between 100 kg and 1000 kg of hazardous waste/month (Resource Conservation and Recovery Act (tracking hazardous waste)) - notification Organizations: CAUSEY AND RHODES (CONTACT/OWNER)
Housing units lacking complete plumbing facilities: 0.2% Housing units lacking complete kitchen facilities: 0.4%
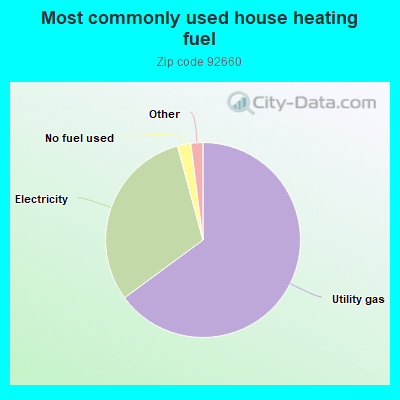
64.9%Utility gas
30.9%Electricity
2.2%No fuel used
1.0%Bottled, tank, or LP gas
0.8%Solar energy
Population in 1990: 25,390. Population change in the 1990s: +3,282 (+12.9%).
Place of birth for U.S.-born residents:
This state: 19,697
Northeast: 3,474
Midwest: 3,249
South: 1,629
West: 1,458
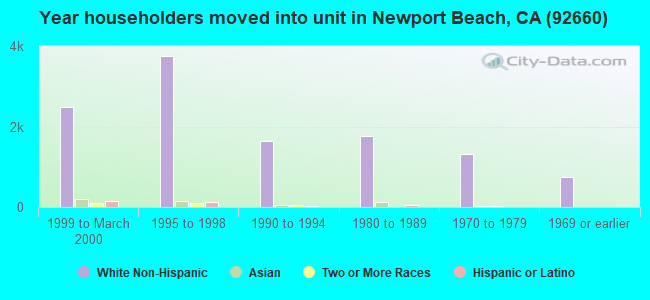
48% of the 92660 zip code residents lived in the same house 5 years ago. Out of people who lived in different houses, 64% lived in this county. Out of people who lived in different counties, 50% lived in California.
85% of the 92660 zip code residents lived in the same house 1 year ago. Out of people who lived in different houses, 52% moved from this county. Out of people who lived in different houses, 16% moved from different county within same state. Out of people who lived in different houses, 18% moved from different state. Out of people who lived in different houses, 14% moved from abroad.
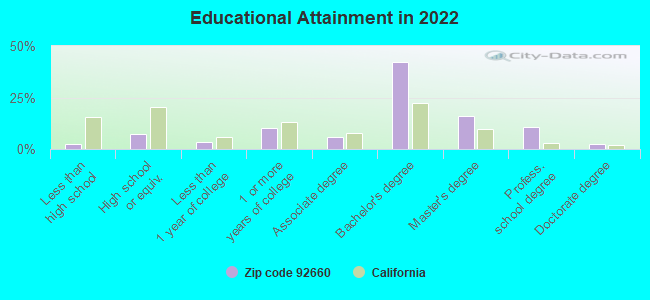
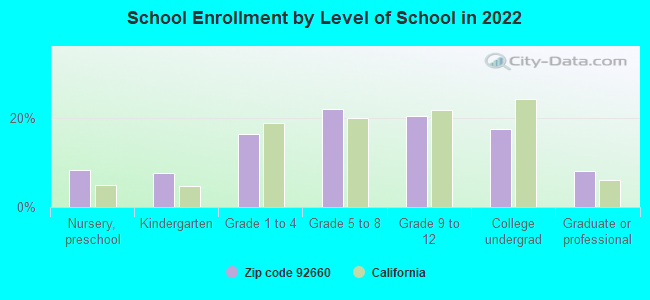
Private vs. public school enrollment:
Students in private schools in grades 1 to 8 (elementary and middle school): 1,035
Here:
33.1%
California:
10.5%
Students in private schools in grades 9 to 12 (high school): 520
Here:
32.0%
California:
8.5%
Students in private undergraduate colleges: 400
Here:
28.2%
California:
15.9%
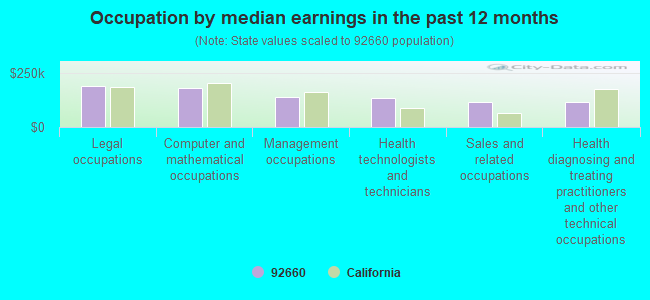
Occupation by median earnings in the past 12 months ($)
189,568Legal occupations
180,497Computer and mathematical occupations
141,053Management occupations
135,085Health technologists and technicians
117,884Sales and related occupations
115,397Health diagnosing and treating practitioners and other technical occupations
Companies with biggest federal contracts located in this zip code:
SRS TECHNOLOGIES (1800 QUAIL ST #101 in NEWPORT BEACH, CA; small business) : $304,795,559 in 1157 contractsfrom 1999 to 2006
Contracts for Engineering and Technical Services, Other Management Support Services, Other Professional Services, Other Defense -- Advanced Development (R&D), and moreby Office of the Secretary, Department of Homeland Security, Army, Air Force, Missile Defense Agency, and others Signed by year:2000: $26,307,737; 2001: $22,172,700; 2002: $36,330,112; 2003: $50,131,391; 2004: $56,219,030; 2005: $50,034,317; 2006: $57,098,821.
Biggest contracts:
$11,930,000 with Office of the Secretary, Department of Homeland Security for Engineering and Technical Services. Taking place in VA. Signed on 2006-01-05. Completion date: 2006-10-31.
$6,731,219 with Office of the Secretary, Department of Homeland Security for Other Management Support Services. Taking place in DC. Signed on 2006-09-28. Completion date: 2008-08-17.
$6,241,150 with Army for Other Professional Services. Taking place in DC. Signed on 2005-01-20. Completion date: 2004-10-02.
$5,625,000 with Air Force for Engineering and Technical Services. Signed on 2006-01-19. Completion date: 2006-09-30.
ASI SYSTEMS INTERNATIONAL (1811 QUAIL ST. in NEWPORT BEACH, CA) : $32,349,418 in 147 contractsfrom 1999 to 2003
Contracts for Programming Services, Other ADP and Telecommunications Services (includes data storage on tapes, compact disks, etc.), Engineering and Technical Services, Ammunition -- Basic Research (R&D), and moreby Federal Technology Service, Department of Defense, Minerals Management Service, Air Force, and others Signed by year:2000: $7,544,586; 2001: $6,411,388; 2002: $11,046,242; 2003: $3,721,761; 2004: $0; 2005: $0; 2006: $0.
Biggest contracts:
$3,301,000 with Federal Technology Service for Programming Services. Signed on 2002-05-15. Completion date: 2002-09-15.
$1,690,000, same as above.Signed on 2002-06-15. Completion date: 2003-06-15.
$1,515,000, same as above.Signed on 1999-11-15. Completion date: 2000-09-15.
$1,472,000, same as above.Signed on 2001-02-15. Completion date: 2001-09-15.
AMOCO ENERGY TRADING CORP (4590 MACARTHUR BLVD in NEWPORT BEACH, CA) : $26,831,753 in 4 contractsin 2000
$25,954,155 with Defense Logistics Agency for Gases: Compressed and Liquefied. Taking place in NC. Signed on 2000-06-21. Completion date: 2000-09-30.
$877,598, same as above.Signed on 2000-03-31. Completion date: 2000-09-30.
$0, same as above.Signed on 2000-03-31. Completion date: 2000-09-30.
$0, same as above.Signed on 2000-06-21. Completion date: 2000-09-30.
SRS - PARSONS, A JOINT VENTURE (1800 QUAIL ST STE 101 in NEWPORT BEACH, CA) : $22,534,348 in 46 contractsfrom 2003 to 2006
Contracts for Architect - Engineer Services (including landscaping, interior layout, and designing), Other Architect and Engineering Services, Defense Studies, Natural Resource Studies, and moreby Navy Signed by year:2000: $0; 2001: $0; 2002: $0; 2003: $1,326,209; 2004: $5,622,222; 2005: $11,067,637; 2006: $4,518,280.
Biggest contracts:
$2,249,051 with Navy for Architect - Engineer Services (including landscaping, interior layout, and designing). Taking place in WA. Signed on 2006-06-30. Completion date: 2006-09-28.
$1,954,784 with Navy for Architect - Engineer Services (including landscaping, interior layout, and designing). Signed on 2004-09-15. Completion date: 2007-06-30.
$1,656,112 with Navy for Other Architect and Engineering Services. Taking place in HI. Signed on 2005-06-28. Completion date: 2009-01-30.
$1,435,000, same as above.Signed on 2005-06-28. Completion date: 2009-06-30.
OMNIPHASE RESEARCH LABORATORIE (359 SAN MIGUEL DR STE 208 in NEWPORT BEACH, CA; small business) : $6,094,957 in 5 contractsfrom 2004 to 2006
Contracts for Antennas, Waveguides, and Related Equipment by Navy Signed by year:2000: $0; 2001: $0; 2002: $0; 2003: $0; 2004: $126,831; 2005: $5,059,154; 2006: $908,972.
Biggest contracts:
$5,059,154 with Navy for Antennas, Waveguides, and Related Equipment. Signed on 2005-11-30. Completion date: 2007-09-29.
$880,728, same as above.Signed on 2006-06-28. Completion date: 2007-01-30.
$126,831, same as above.Signed on 2004-10-29. Completion date: 2005-06-29.
$20,444, same as above.Signed on 2006-05-30. Completion date: 2007-09-29.
HEALTH TECHNOLOGIES & WELLNESS (500-C, SUITE 100 in NEWPORT BEACH, CA; small business) : $4,331,712 in 4 contractsfrom 1999 to 2001
$1,981,067 with Army for Radiology Services. Taking place in DC. Signed on 2001-12-18. Completion date: 2001-09-30.
$1,244,411, same as above.Signed on 2000-11-01. Completion date: 2001-09-30.
$1,028,540, same as above.Signed on 2001-12-18. Completion date: 2001-09-30.
$77,694, same as above.Signed on 1999-12-08. Completion date: 2000-09-30.
UNIVERSAL SPACE NETWORK, INC (1501 QUAIL ST STE 102 in NEWPORT BEACH, CA; small business) : $2,079,953 in 13 contractsfrom 2000 to 2006
Contracts for Other Defense -- Applied Research and Exploratory Development (R&D), R&D-Other Space-A Res/Expl Dev, Services -- Applied Research and Exploratory Development (R&D), Engineering -- Advanced Development (R&D), and moreby Air Force, Navy Signed by year:2000: $102,000; 2001: $177,000; 2002: $0; 2003: $371,000; 2004: $12,108; 2005: $932,118; 2006: $485,727.
Biggest contracts:
$882,351 with Air Force for Other Defense -- Applied Research and Exploratory Development (R&D). Signed on 2005-04-21. Completion date: 2005-11-30.
$485,727 with Air Force for R&D-Other Space-A Res/Expl Dev. Signed on 2006-04-14. Completion date: 2006-12-31.
$265,000 with Navy for Services -- Applied Research and Exploratory Development (R&D). Signed on 2003-05-02. Completion date: 2004-01-06.
$177,000, same as above.Signed on 2001-02-01. Completion date: 2001-12-15.
ALTERMUNE LLC (919 BAYSIDE DRIVE in NEWPORT BEACH, CA; small business) : $1,943,749 in 4 contractsfrom 2004 to 2005
$999,638 with Army for Other Research and Development -- Basic Research (R&D). Signed on 2005-06-22. Completion date: 2006-08-31.
$499,963, same as above.Signed on 2004-08-30. Completion date: 2005-08-31.
$400,000, same as above.Signed on 2004-02-11. Completion date: 2004-04-08.
$44,148, same as above.Signed on 2004-09-22. Completion date: 2005-08-31.
SP CENTURY CENTRE, LLC. ( in Newport Beach, CA) : $784,024 in 50 contractsfrom 1999 to 2006
Contracts for Lease or Rental of Facilities -- Office Buildings by Public Buildings Service Signed by year:2000: $100,000; 2001: $100,000; 2002: $125,310; 2003: $235,088; 2004: $32,208; 2005: $95,096; 2006: $71,322.
Biggest contracts:
$25,207 with Public Buildings Service for Lease or Rental of Facilities -- Office Buildings. Signed on 2003-06-15. Completion date: 2003-06-15.
$25,207, same as above.Signed on 2003-09-15. Completion date: 2003-09-15.
$25,155, same as above.Signed on 2002-12-15. Completion date: 2002-12-15.
$25,155, same as above.Signed on 2003-03-15. Completion date: 2003-03-15.
STEVEN MYERS & ASSOCIATES, INC (4695 MACARTHUR COURT, 8TH in NEWPORT BEACH, CA) : $749,815 in 2 contractsin 2002
$388,000 with Department of Defense for Engineering and Technical Services. Signed on 2002-08-08. Completion date: 2002-12-31.
$361,815 with Department of Defense for Contract, Procurement, and Acquisition Support Services. Taking place in VA. Signed on 2002-10-29. Completion date: 2003-09-30.
Top industries in this zip code by the number of employees in 2005:
2005 - 2018 National Fire Incident Reporting System (NFIRS) incidents
Based on the data from the years 2005 - 2018 the average number of fires per year is 43. The highest number of fires - 84 took place in 2018, and the least - 8 in 2012. The data has a growing trend.
When looking into fire subcategories, the most incidents belonged to: Structure Fires (47.4%), and Outside Fires (23.8%).
Fire incident types reported to NFIRS in Zip Code 92660


 Nearest zip codes: 92617, 92662, 92625, 92627, 92661, 92612.
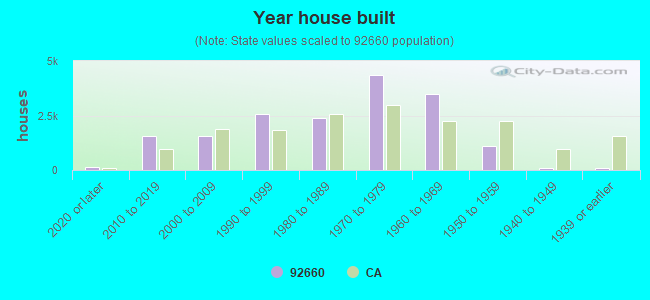


 Based on the data from the years 2005 - 2018 the average number of fires per year is 43. The highest number of fires - 84 took place in 2018, and the least - 8 in 2012. The data has a growing trend.
 When looking into fire subcategories, the most incidents belonged to: Structure Fires (47.4%), and Outside Fires (23.8%).