Estimated zip code population in 2022: 59,614 Zip code population in 2010: 57,245 Zip code population in 2000: 58,761
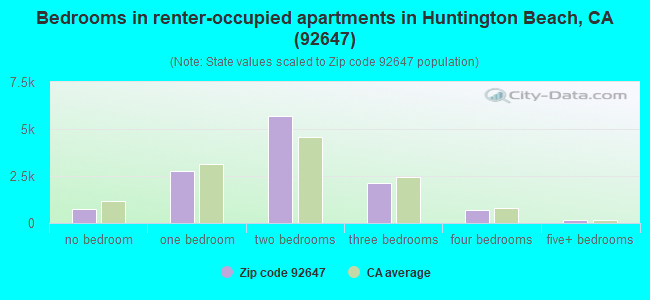
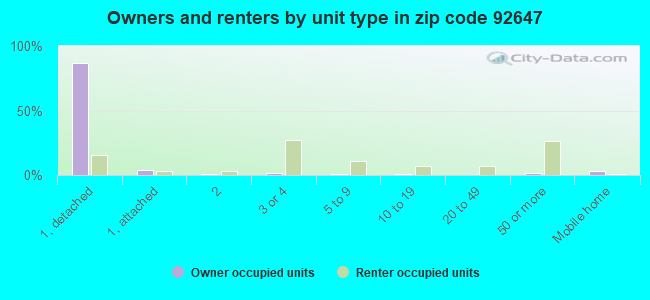
Houses and condos: 22,726 Renter-occupied apartments: 12,260
% of renters here:
57%
State:
44%
March 2022 cost of living index in zip code 92647: 88.1 (less than average, U.S. average is 100)
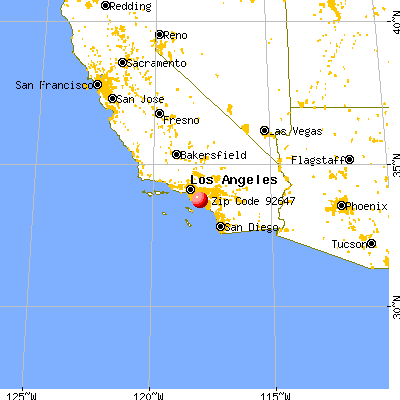
Land area: 7.7 sq. mi. Water area: 0.0 sq. mi.
Population density: 7,694 people per square mile
(high).
OSM Map
General Map
Google Map
MSN Map
OSM Map
General Map
Google Map
MSN Map
OSM Map
General Map
Google Map
MSN Map
OSM Map
General Map
Google Map
MSN Map
Please wait while loading the map...
Real estate property taxes paid for housing units in 2022:
This zip code:
0.5% ($4,981)
California:
0.7% ($4,831)
Median real estate property taxes paid for housing units with mortgages in 2022: $5,978 (0.6%) Median real estate property taxes paid for housing units with no mortgage in 2022: $3,310 (0.3%)
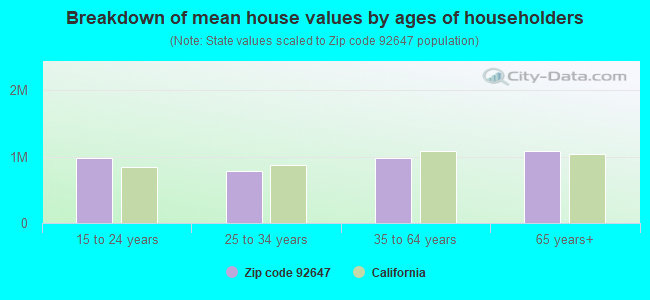
Estimated median house/condo value in 2022: $980,847
92647:
$980,847
California:
$715,900
According to our research of California and other state lists, there were 33 registered sex offenders living in 92647 zip code as of April 27, 2024. The ratio of all residents to sex offenders in zip code 92647 is 1,884 to 1. The ratio of registered sex offenders to all residents in this zip code is much lower than the state average.
Median resident age:
This zip code:
37.7 years
California median age:
37.9 years
Average household size:
This zip code:
2.7 people
California:
2.8 people
Averages for the 2020 tax year for zip code 92647, filed in 2021:
Average Adjusted Gross Income (AGI) in 2020: $77,884 (Individual Income Tax Returns)
Here:
$77,884
State:
$95,910
Salary/wage: $66,348 (reported on 79.8% of returns)
Here:
$66,348
State:
$77,331
(% of AGI for various income ranges: 1184.4% for AGIs below $25k, 4067.2% for AGIs $25k-50k, 7296.8% for AGIs $50k-75k, 10580.3% for AGIs $75k-100k, 20442.4% for AGIs $100k-200k, 72081.1% for AGIs over 200k)
Taxable interest for individuals: $1,398 (reported on 34.1% of returns)
This zip code:
$1,398
California:
$2,294
(% of AGI for various income ranges: 17.7% for AGIs below $25k, 19.0% for AGIs $25k-50k, 49.1% for AGIs $50k-75k, 74.4% for AGIs $75k-100k, 199.0% for AGIs $100k-200k, 776.0% for AGIs over 200k)
Ordinary dividends: $4,539 (reported on 20.3% of returns)
Here:
$4,539
State:
$10,949
(% of AGI for various income ranges: 23.5% for AGIs below $25k, 33.2% for AGIs $25k-50k, 90.6% for AGIs $50k-75k, 133.7% for AGIs $75k-100k, 356.3% for AGIs $100k-200k, 1791.4% for AGIs over 200k)
Net capital gain/loss in AGI: +$16,228 (reported on 20.3% of returns)
Here:
+$16,228
State:
+$49,306
(% of AGI for various income ranges: 11.4% for AGIs below $25k, 42.0% for AGIs $25k-50k, 93.8% for AGIs $50k-75k, 166.4% for AGIs $75k-100k, 604.9% for AGIs $100k-200k, 12041.9% for AGIs over 200k)
Profit/loss from business: +$10,710 (reported on 18.2% of returns)
Here:
+$10,710
State:
+$15,671
(% of AGI for various income ranges: 186.9% for AGIs below $25k, 241.2% for AGIs $25k-50k, 198.8% for AGIs $50k-75k, 394.9% for AGIs $75k-100k, 517.1% for AGIs $100k-200k, 1829.8% for AGIs over 200k)
Taxable individual retirement arrangement distribution: $22,144 (reported on 7.9% of returns)
92647:
$22,144
California:
$23,505
(% of AGI for various income ranges: 47.6% for AGIs below $25k, 87.4% for AGIs $25k-50k, 206.8% for AGIs $50k-75k, 410.5% for AGIs $75k-100k, 854.2% for AGIs $100k-200k, 1936.8% for AGIs over 200k)
Self-employed (Keogh) retirement plans: $22,353 (reported on 0.5% of returns)
92647:
$22,353
California:
$30,163
(% of AGI for various income ranges: 13.3% for AGIs $50k-75k, 32.7% for AGIs $100k-200k, 347.6% for AGIs over 200k)
Total itemized deductions: $33,136 (reported on 15.1% of returns)
Here:
$33,136
State:
$39,517
(% of AGI for various income ranges: 80.1% for AGIs below $25k, 184.7% for AGIs $25k-50k, 460.5% for AGIs $50k-75k, 902.3% for AGIs $75k-100k, 2431.6% for AGIs $100k-200k, 7765.4% for AGIs over 200k)
Charity contributions: $6,814 (reported on 13.1% of returns)
Here:
$6,814
State:
$12,598
(% of AGI for various income ranges: 3.7% for AGIs below $25k, 16.6% for AGIs $25k-50k, 51.5% for AGIs $50k-75k, 123.8% for AGIs $75k-100k, 380.2% for AGIs $100k-200k, 2044.6% for AGIs over 200k)
Taxes paid: $8,809 (reported on 15.0% of returns)
92647:
$8,809
State:
$8,807
(% of AGI for various income ranges: 14.6% for AGIs below $25k, 40.0% for AGIs $25k-50k, 118.2% for AGIs $50k-75k, 268.7% for AGIs $75k-100k, 711.6% for AGIs $100k-200k, 1836.5% for AGIs over 200k)
Earned income credit: $1,812 (reported on 12.3% of returns)
Here:
$1,812
State:
$2,074
(% of AGI for various income ranges: 69.7% for AGIs below $25k, 54.4% for AGIs $25k-50k, 1.0% for AGIs $50k-75k)
Percentage of individuals using paid preparers for their 2020 taxes: 92.9%
Here:
93%
State:
92%
(% for various income ranges: 92.2% for AGIs below $25k, 92.9% for AGIs $25k-50k, 93.6% for AGIs $50k-75k, 92.8% for AGIs $75k-100k, 93.6% for AGIs $100k-200k, 94.1% for AGIs over 200k)
Averages for the 2012 tax year for zip code 92647, filed in 2013:
Average Adjusted Gross Income (AGI) in 2012: $60,809 (Individual Income Tax Returns)
Here:
$60,809
State:
$72,726
Salary/wage: $55,510 (reported on 82.8% of returns)
Here:
$55,510
State:
$59,079
(% of AGI for various income ranges: 74.9% for AGIs below $25k, 80.7% for AGIs $25k-50k, 79.0% for AGIs $50k-75k, 74.2% for AGIs $75k-100k, 78.3% for AGIs $100k-200k, 65.4% for AGIs over 200k)
Taxable interest for individuals: $1,103 (reported on 36.4% of returns)
This zip code:
$1,103
California:
$2,146
(% of AGI for various income ranges: 1.0% for AGIs below $25k, 0.6% for AGIs $25k-50k, 0.6% for AGIs $50k-75k, 0.6% for AGIs $75k-100k, 0.6% for AGIs $100k-200k, 0.8% for AGIs over 200k)
Ordinary dividends: $3,588 (reported on 19.1% of returns)
Here:
$3,588
State:
$9,308
(% of AGI for various income ranges: 1.2% for AGIs below $25k, 0.8% for AGIs $25k-50k, 0.9% for AGIs $50k-75k, 1.1% for AGIs $75k-100k, 0.9% for AGIs $100k-200k, 1.9% for AGIs over 200k)
Net capital gain/loss in AGI: +$4,949 (reported on 16.3% of returns)
Here:
+$4,949
State:
+$30,460
(% of AGI for various income ranges: 0.5% for AGIs $75k-100k, 0.8% for AGIs $100k-200k, 5.9% for AGIs over 200k)
Profit/loss from business: +$12,374 (reported on 17.6% of returns)
Here:
+$12,374
State:
+$17,064
(% of AGI for various income ranges: 10.9% for AGIs below $25k, 5.0% for AGIs $25k-50k, 2.9% for AGIs $50k-75k, 3.2% for AGIs $75k-100k, 2.5% for AGIs $100k-200k, 2.4% for AGIs over 200k)
Taxable individual retirement arrangement distribution: $17,514 (reported on 9.1% of returns)
92647:
$17,514
California:
$19,557
(% of AGI for various income ranges: 2.6% for AGIs below $25k, 2.1% for AGIs $25k-50k, 2.7% for AGIs $50k-75k, 3.0% for AGIs $75k-100k, 2.9% for AGIs $100k-200k, 2.2% for AGIs over 200k)
Self-employment retirement plans: $16,088 (reported on 0.6% of returns)
92647:
$16,088
California:
$24,530
(% of AGI for various income ranges: 0.1% for AGIs below $25k, 0.1% for AGIs $50k-75k, 0.2% for AGIs $100k-200k, 0.5% for AGIs over 200k)
Total itemized deductions: $27,922 (25% of AGI, reported on 35.5% of returns)
Here:
$27,922
State:
$34,004
Here:
24.6% of AGI
State:
22.7% of AGI
(% of AGI for various income ranges: 10.0% for AGIs below $25k, 10.0% for AGIs $25k-50k, 13.7% for AGIs $50k-75k, 17.9% for AGIs $75k-100k, 20.1% for AGIs $100k-200k, 17.0% for AGIs over 200k)
Charity contributions: $3,271 (reported on 30.9% of returns)
Here:
$3,271
State:
$4,659
(% of AGI for various income ranges: 0.6% for AGIs below $25k, 0.9% for AGIs $25k-50k, 1.5% for AGIs $50k-75k, 2.0% for AGIs $75k-100k, 2.1% for AGIs $100k-200k, 1.8% for AGIs over 200k)
Taxes paid: $10,185 (reported on 35.4% of returns)
92647:
$10,185
State:
$14,448
(% of AGI for various income ranges: 1.7% for AGIs below $25k, 2.1% for AGIs $25k-50k, 3.6% for AGIs $50k-75k, 5.7% for AGIs $75k-100k, 7.7% for AGIs $100k-200k, 9.2% for AGIs over 200k)
Earned income credit: $2,042 (reported on 14.4% of returns)
Here:
$2,042
State:
$2,286
(% of AGI for various income ranges: 4.9% for AGIs below $25k, 0.8% for AGIs $25k-50k)
Percentage of individuals using paid preparers for their 2012 taxes: 63.3%
Here:
63%
State:
64%
(% for various income ranges: 60.1% for AGIs below $25k, 62.0% for AGIs $25k-50k, 62.6% for AGIs $50k-75k, 66.4% for AGIs $75k-100k, 68.9% for AGIs $100k-200k, 74.2% for AGIs over 200k)
Averages for the 2004 tax year for zip code 92647, filed in 2005:
Average Adjusted Gross Income (AGI) in 2004: $51,216 (Individual Income Tax Returns)
Here:
$51,216
State:
$58,600
Salary/wage: $48,570 (reported on 85.0% of returns)
Here:
$48,570
State:
$49,455
(% of AGI for various income ranges: 166.8% for AGIs below $10k, 77.3% for AGIs $10k-25k, 84.1% for AGIs $25k-50k, 82.2% for AGIs $50k-75k, 82.6% for AGIs $75k-100k, 76.6% for AGIs over 100k)
Taxable interest for individuals: $1,366 (reported on 47.1% of returns)
This zip code:
$1,366
California:
$2,365
(% of AGI for various income ranges: 6.4% for AGIs below $10k, 1.6% for AGIs $10k-25k, 1.0% for AGIs $25k-50k, 1.1% for AGIs $50k-75k, 1.2% for AGIs $75k-100k, 1.3% for AGIs over 100k)
Taxable dividends: $2,066 (reported on 23.5% of returns)
Here:
$2,066
State:
$4,746
(% of AGI for various income ranges: 5.1% for AGIs below $10k, 1.0% for AGIs $10k-25k, 0.6% for AGIs $25k-50k, 0.8% for AGIs $50k-75k, 0.8% for AGIs $75k-100k, 1.1% for AGIs over 100k)
Net capital gain/loss: +$6,522 (reported on 19.1% of returns)
Here:
+$6,522
State:
+$23,418
(% of AGI for various income ranges: -3.8% for AGIs below $10k, 0.7% for AGIs $10k-25k, 0.3% for AGIs $25k-50k, 0.5% for AGIs $50k-75k, 0.6% for AGIs $75k-100k, 5.4% for AGIs over 100k)
Profit/loss from business: +$12,377 (reported on 17.1% of returns)
Here:
+$12,377
State:
+$16,826
(% of AGI for various income ranges: 14.8% for AGIs below $10k, 9.1% for AGIs $10k-25k, 4.4% for AGIs $25k-50k, 4.0% for AGIs $50k-75k, 2.6% for AGIs $75k-100k, 3.6% for AGIs over 100k)
IRA payment deduction: $3,121 (reported on 3.1% of returns)
92647:
$3,121
California:
$3,192
(% of AGI for various income ranges: 0.4% for AGIs below $10k, 0.2% for AGIs $10k-25k, 0.2% for AGIs $25k-50k, 0.2% for AGIs $50k-75k, 0.2% for AGIs $75k-100k, 0.1% for AGIs over 100k)
Self-employed pension: $12,811 (reported on 1.1% of returns)
Here:
$12,811
California:
$17,688
(% of AGI for various income ranges: 0.1% for AGIs $10k-25k, 0.1% for AGIs $25k-50k, 0.1% for AGIs $50k-75k, 0.2% for AGIs $75k-100k, 0.5% for AGIs over 100k)
Total itemized deductions: $23,750 (27% of AGI, reported on 39.0% of returns)
Here:
$23,750
State:
$28,113
Here:
26.6% of AGI
State:
25.3% of AGI
(% of AGI for various income ranges: 29.1% for AGIs below $10k, 10.5% for AGIs $10k-25k, 13.2% for AGIs $25k-50k, 18.3% for AGIs $50k-75k, 21.5% for AGIs $75k-100k, 19.9% for AGIs over 100k)
Charity contributions deductions: $2,975 (3% of AGI, reported on 35.4% of returns)
Here:
$2,975
State:
$3,923
Here:
3.2% of AGI
State:
3.3% of AGI
(% of AGI for various income ranges: 1.1% for AGIs below $10k, 0.9% for AGIs $10k-25k, 1.4% for AGIs $25k-50k, 2.0% for AGIs $50k-75k, 2.4% for AGIs $75k-100k, 2.4% for AGIs over 100k)
Total tax: $7,289 (reported on 79.7% of returns)
92647:
$7,289
State:
$10,761
(% of AGI for various income ranges: 7.0% for AGIs below $10k, 4.7% for AGIs $10k-25k, 7.6% for AGIs $25k-50k, 9.8% for AGIs $50k-75k, 10.1% for AGIs $75k-100k, 15.4% for AGIs over 100k)
Earned income credit: $1,553 (reported on 11.1% of returns)
Here:
$1,553
State:
$1,763
Percentage of individuals using paid preparers for their 2004 taxes: 63.2%
Here:
63%
State:
66%
(% for various income ranges: 53.9% for AGIs below $10k, 64.2% for AGIs $10k-25k, 61.8% for AGIs $25k-50k, 65.1% for AGIs $50k-75k, 67.4% for AGIs $75k-100k, 70.6% for AGIs over 100k)
Likely homosexual households (counted as self-reported same-sex unmarried-partner households)
Lesbian couples: 0.5% of all households
Gay men: 0.3% of all households
Household received Food Stamps/SNAP in the past 12 months: 1,938 Household did not receive Food Stamps/SNAP in the past 12 months: 19,548
Women who had a birth in the past 12 months: 567 (473 now married, 92 unmarried) Women who did not have a birth in the past 12 months: 13,976 (4,582 now married, 9,434 unmarried)
Housing units in zip code 92647 with a mortgage: 5,967 (686 second mortgage, 12 home equity loan, 477 both second mortgage and home equity loan) Houses without a mortgage: 137
Median monthly owner costs for units with a mortgage: $3,016 Median monthly owner costs for units without a mortgage: $619
Residents with income below the poverty level in 2022:
This zip code:
9.7%
Whole state:
12.2%
Residents with income below 50% of the poverty level in 2022:
This zip code:
4.7%
Whole state:
6.2%
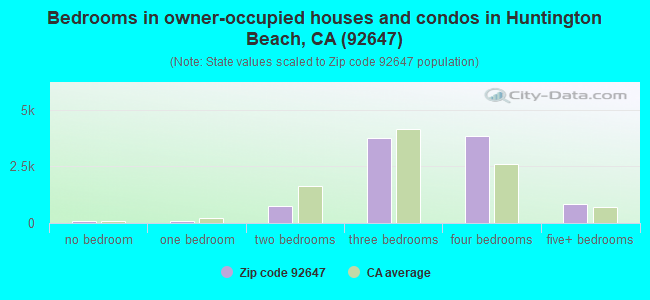
Median number of rooms in houses and condos:
Here:
6.2
State:
6.0
Median number of rooms in apartments:
Here:
3.9
State:
3.9
Notable locations in this zip code not listed on our city pages
Shopping Centers: Edinger Plaza Shopping Center (1), Old World Shopping Center (2), Huntington Beach Shopping Center (3), College Country Shopping Center (4). Display/hide their locations on the map
Churches in zip code 92647 include: Central Baptist Church (A), Newland First Samoan Congregational Church (B), Pacific Coast Community Church (C). Display/hide their locations on the map
Parks in zip code 92647 include: Brunswick Park (1), Huntington Central Park (2), Franklin Park (3), Carr Park (4), Circle View Park (5), Clegg-Stacy Park (6), College View Park (7), Glen View Park (8), Golden View Park (9). Display/hide their locations on the map
6,218 married couples with children.
3,247 single-parent households (1,192 men, 2,055 women).
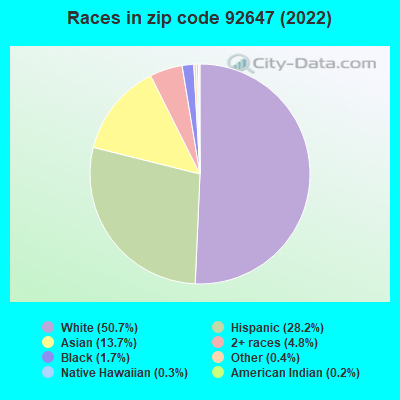
68.4% of residents of 92647 zip code speak English at home.
15.4% of residents speak Spanish at home (73% very well, 15% well, 9% not well, 2% not at all).
4.3% of residents speak other Indo-European language at home (66% very well, 17% well, 17% not well).
9.9% of residents speak Asian or Pacific Island language at home (50% very well, 25% well, 19% not well, 7% not at all).
1.8% of residents speak other language at home (77% very well, 18% well, 4% not well, 1% not at all).
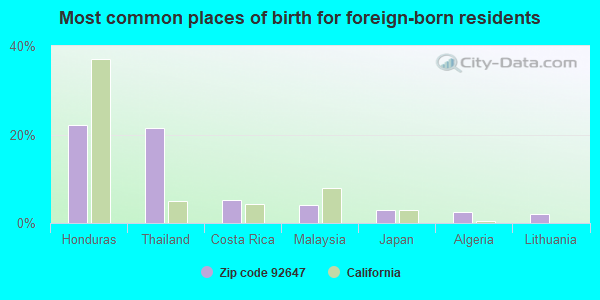
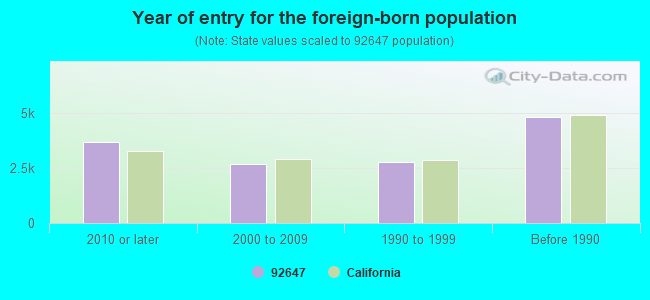
Foreign born population: 12,658 (21.2%) (57.1% of them are naturalized citizens)
Major facilities with environmental interests located in this zip code:
CABMRO MANUFACTURING COMPANY (7601 CLAY AVENUE in HUNTINGTON BEACH, CA)
AIR MAJOR (AIRS/AFS) STATE MASTER (California - Hazardous Waste Tracking) - HAZARDOU WASTE PROGRAM (Integrated Compliance Information System) - ICIS-09-2000-0371, FORMAL ENFORCEMENT ACTION CRITERIA AND HAZARDOUS AIR POLLUTANT INVENTORY (Inventory of air pollution sources) Large Quantity Generators, more that 1000 kg of hazardous waste/month (Resource Conservation and Recovery Act (tracking hazardous waste)) TRI REPORTER (Tracking of toxic chemicals releasing facilities) Business SIC classification: PLASTICS FOAM PRODUCTS; PLASTICS PRODUCTS Business NAICS classification: ALL OTHER PLASTICS PRODUCT MANUFACTURING. Organizations: CAMBRO MANUFACTURING COMPANY (CONTACT/OPERATOR)
Alternative names: CAMBRO MANUFACTURING COMPANY
GOLDEN WEST COLLEGE (15744 GOLDEN WEST ST in HUNTINGTON BEACH, CA)
STATE MASTER (California - Hazardous Waste Tracking) - HAZARDOU WASTE PROGRAM (Integrated Compliance Information System) - ICIS-09-1992-0072, FORMAL ENFORCEMENT ACTION COMPLIANCE ACTIVITY (Tracking inspections of insecticide, fungicide, and rodenticide, and toxic substances) Small Quantity Generators, between 100 kg and 1000 kg of hazardous waste/month (Resource Conservation and Recovery Act (tracking hazardous waste)) - notification Business SIC classification: JUNIOR COLLEGES AND TECHNICAL INSTITUTES Organizations: COAST COMMUNITY COLLEGE DISTRICT (CONTACT/OWNER)
Alternative names: COAST COMM COLLEGE DIST-GOLDEN WEST
CHEVRON SS 94887 (6972 WARNER AVE in HUNTINGTON BEACH, CA)
STATE MASTER (California - Hazardous Waste Tracking) - HAZARDOU WASTE PROGRAM Large Quantity Generators, more that 1000 kg of hazardous waste/month (Resource Conservation and Recovery Act (tracking hazardous waste)) Organizations: CHEVRON PRODUCTS CO. (CONTACT/OPERATOR)
MCDONNELL DOUGLAS CORP C 13 (15400 GRAHAM ST STE 101 in HUNTINGTON BEACH, CA)
STATE MASTER (California - Hazardous Waste Tracking) - HAZARDOU WASTE PROGRAM Large Quantity Generators, more that 1000 kg of hazardous waste/month (Resource Conservation and Recovery Act (tracking hazardous waste)) - notification Organizations: BOEING CO (CONTACT/OWNER)
CALIFORNIA STREET RODS (17091 PALMDALE in HUNTINGTON BEACH, CA)
STATE MASTER (California - Hazardous Waste Tracking) - HAZARDOU WASTE PROGRAM Small Quantity Generators, between 100 kg and 1000 kg of hazardous waste/month (Resource Conservation and Recovery Act (tracking hazardous waste)) - notification Business NAICS classification: MOTOR VEHICLE BODY MANUFACTURING. Organizations: CHUCK LOMBARDO (CONTACT/OWNER)
JIFFY LUBE #1857 (8971 WARNER AVE in HUNTINGTON BEACH, CA)
Small Quantity Generators, between 100 kg and 1000 kg of hazardous waste/month (Resource Conservation and Recovery Act (tracking hazardous waste)) - notification STATE MASTER (California - Used Oil Recycling System ) - USED OIL RECYCLING Business NAICS classification: GENERAL AUTOMOTIVE REPAIR. Organizations: GASPER FARACE (CONTACT/OWNER)
Alternative names: GASPERS UNION 76
C & G AUTOMOTIVE GUY MOORE (17841 SAMPSON LN in HUNTINGTON BEACH, CA)
STATE MASTER (California - Hazardous Waste Tracking) - HAZARDOU WASTE PROGRAM Small Quantity Generators, between 100 kg and 1000 kg of hazardous waste/month (Resource Conservation and Recovery Act (tracking hazardous waste)) - notification Business NAICS classification: GENERAL AUTOMOTIVE REPAIR.
HUNTINGTON BEACH DODGE INC (16555 BEACH BLVD in HUNTINGTON BEACH, CA)
STATE MASTER (California - Hazardous Waste Tracking) - HAZARDOU WASTE PROGRAM Small Quantity Generators, between 100 kg and 1000 kg of hazardous waste/month (Resource Conservation and Recovery Act (tracking hazardous waste)) - notification Organizations: HOWARD ABEL (CONTACT/OWNER)
GOLDEN WEST LAUNDRY INCORPORATED (17862 JAMESTOWN in HUNTINGTON BEACH, CA)
STATE MASTER (California - Hazardous Waste Tracking) - HAZARDOU WASTE PROGRAM CRITERIA AND HAZARDOUS AIR POLLUTANT INVENTORY (Inventory of air pollution sources) Small Quantity Generators, between 100 kg and 1000 kg of hazardous waste/month (Resource Conservation and Recovery Act (tracking hazardous waste)) - notification Business SIC classification: DRYCLEANING PLANTS, EXCEPT RUG CLEANING
HUNTINGTON BEACH CITY OF (AT LARGE W/IN CITY LIMITS in HUNTINGTON BEACH, CA)
STATE MASTER (California - Hazardous Waste Tracking) - HAZARDOU WASTE PROGRAM Small Quantity Generators, between 100 kg and 1000 kg of hazardous waste/month (Resource Conservation and Recovery Act (tracking hazardous waste)) Alternative names: CITY OF HUNTINGTON BEACH
J R SWISS ENGINEERING (17932 MELZLER in HUNTINGTON BEACH, CA)
STATE MASTER (California - Hazardous Waste Tracking) - HAZARDOU WASTE PROGRAM Small Quantity Generators, between 100 kg and 1000 kg of hazardous waste/month (Resource Conservation and Recovery Act (tracking hazardous waste)) - notification
HUNTINGTON BEACH CHRYSLER JEEP (16701 BEACH BLVD in HUNTINGTON BEACH, CA)
STATE MASTER (California - Hazardous Waste Tracking) - HAZARDOU WASTE PROGRAM Small Quantity Generators, between 100 kg and 1000 kg of hazardous waste/month (Resource Conservation and Recovery Act (tracking hazardous waste)) - notification Organizations: RICHARD A EVANS (CONTACT/OWNER)
CARVI AUTO BODY (17412 GOTHARD ST in HUNTINGTON BEACH, CA)
STATE MASTER (California - Hazardous Waste Tracking) - HAZARDOU WASTE PROGRAM Small Quantity Generators, between 100 kg and 1000 kg of hazardous waste/month (Resource Conservation and Recovery Act (tracking hazardous waste)) Business NAICS classification: AUTOMOTIVE BODY, PAINT, AND INTERIOR REPAIR AND MAINTENANCE.
Housing units lacking complete plumbing facilities: 0.2% Housing units lacking complete kitchen facilities: 1.2%
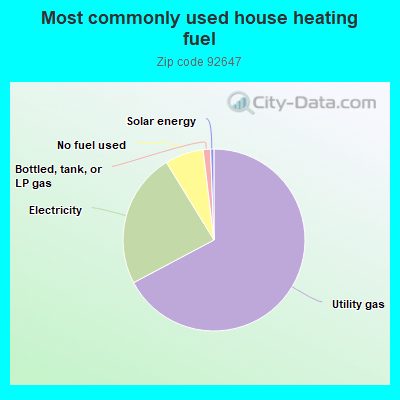
66.9%Utility gas
23.9%Electricity
6.8%No fuel used
1.3%Bottled, tank, or LP gas
0.6%Solar energy
Population in 1990: 56,565. Population change in the 1990s: +2,196 (+3.9%).
Place of birth for U.S.-born residents:
This state: 34,680
Northeast: 2,714
Midwest: 3,285
South: 2,838
West: 2,111
51% of the 92647 zip code residents lived in the same house 5 years ago. Out of people who lived in different houses, 68% lived in this county. Out of people who lived in different counties, 50% lived in California.
84% of the 92647 zip code residents lived in the same house 1 year ago. Out of people who lived in different houses, 54% moved from this county. Out of people who lived in different houses, 27% moved from different county within same state. Out of people who lived in different houses, 9% moved from different state. Out of people who lived in different houses, 8% moved from abroad.
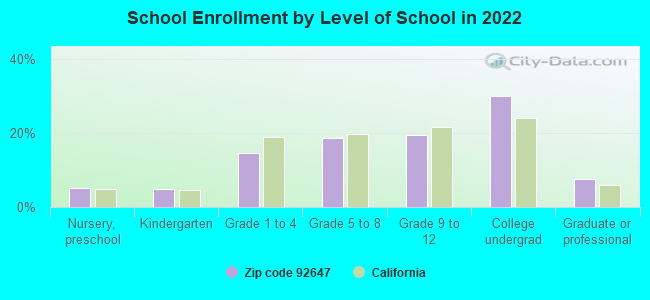
Private vs. public school enrollment:
Students in private schools in grades 1 to 8 (elementary and middle school): 576
Here:
12.9%
California:
10.5%
Students in private schools in grades 9 to 12 (high school): 243
Here:
9.2%
California:
8.5%
Students in private undergraduate colleges: 476
Here:
11.8%
California:
15.9%
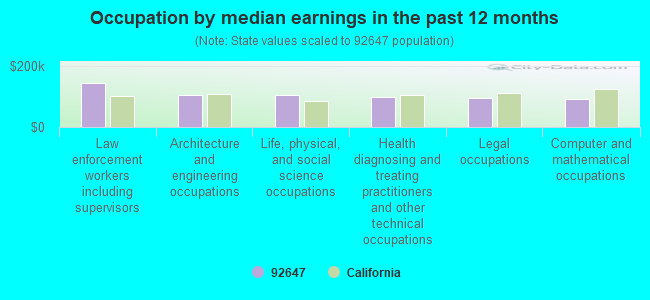
Occupation by median earnings in the past 12 months ($)
144,422Law enforcement workers including supervisors
106,117Architecture and engineering occupations
105,925Life, physical, and social science occupations
98,159Health diagnosing and treating practitioners and other technical occupations
94,312Legal occupations
91,064Computer and mathematical occupations
Companies with biggest federal contracts located in this zip code (HUNTINGTON BEA, CA):
BOEING COMPANY, THE (INC) (5301 BOLSA AVE) : $1,502,729,128 in 362 contractsfrom 1999 to 2006
Contracts for Space Flight -- Advanced Development (R&D), Space Vehicles, Aeronautics and Space Technology -- Basic Research (R&D), Space Flight -- Engineering Development (R&D), and moreby Air Force, NASA, Army, Navy, and others Signed by year:2000: $27,609,127; 2001: $470,227,828; 2002: $100,620,196; 2003: $276,488,595; 2004: $296,034,564; 2005: $139,535,089; 2006: $64,570,681.
Biggest contracts:
$394,871,361 with Air Force for Space Flight -- Advanced Development (R&D). Signed on 2001-09-30. Completion date: 2002-09-30.
$167,119,655 with Air Force for Space Vehicles. Signed on 2004-09-30. Completion date: 2010-12-31.
$148,105,958 with Air Force for Space Flight -- Advanced Development (R&D). Signed on 2003-09-30. Completion date: 2007-09-30.
$80,879,704 with Air Force for Space Vehicles. Signed on 2005-09-30. Completion date: 2010-12-31.
MICRO COOLING CONCEPTS (7522 SLATER AVE STE 122; small business) : $1,031,649 in 5 contractsfrom 2003 to 2006
Contracts for Defense Missile and Space Systems -- Advanced Development (R&D), Defense Missile and Space Systems -- Operational Systems Development (R&D), Other Research and Development -- Advanced Development (R&D), Aeronautics and Space Technology -- Basic Research (R&D) by Army, Air Force, Navy, NASA, and others Signed by year:2000: $0; 2001: $0; 2002: $0; 2003: $69,777; 2004: $195,976; 2005: $69,756; 2006: $696,140.
Biggest contracts:
$696,140 with Army for Defense Missile and Space Systems -- Advanced Development (R&D). Signed on 2006-04-27. Completion date: 2008-04-28.
$98,250 with Air Force for Defense Missile and Space Systems -- Operational Systems Development (R&D). Signed on 2004-05-17. Completion date: 2005-02-15.
$97,726, same as above.Signed on 2004-05-17. Completion date: 2005-02-15.
$69,777 with Navy for Other Research and Development -- Advanced Development (R&D). Signed on 2003-08-13. Completion date: 2004-02-13.
SHILOH ENGINEERING INC (14902 SABRE LN; small business) : $506,691 in 34 contractsfrom 2002 to 2006
Contracts for Tool and Hardware Boxes, Generators and Generators Sets, Electrical, Aircraft Hydraulic, Vacuum, and De-icing System Components, Airframe Structural Components, and moreby Navy Signed by year:2000: $0; 2001: $0; 2002: $61,850; 2003: $95,190; 2004: $112,264; 2005: $178,450; 2006: $58,937.
Biggest contracts:
$94,805 with Navy for Tool and Hardware Boxes. Signed on 2005-01-24. Completion date: 2005-05-30.
$61,850 with Navy for Generators and Generators Sets, Electrical. Signed on 2002-07-03. Completion date: 2002-11-21.
$35,100 with Navy for Aircraft Hydraulic, Vacuum, and De-icing System Components. Signed on 2005-04-28. Completion date: 2005-12-22.
$31,720 with Navy for Generators and Generators Sets, Electrical. Signed on 2004-04-20. Completion date: 2004-09-21.
LIGHTNING DIVERSION SYSTEMS (16572 BURKE LANE; small business) : $289,148 in 32 contractsfrom 2001 to 2006
Contracts for Airframe Structural Components, Miscellaneous Electrical and Electronic Components, Fuses, Arresters, Absorbers, and Protectors by Defense Logistics Agency, Air Force, Navy Signed by year:2000: $0; 2001: $25,756; 2002: $0; 2003: $0; 2004: $78,575; 2005: $91,881; 2006: $92,936.
Biggest contracts:
$25,756 with Defense Logistics Agency for Airframe Structural Components. Signed on 2001-01-26. Completion date: 2001-06-25.
$25,742 with Defense Logistics Agency for Miscellaneous Electrical and Electronic Components. Signed on 2006-04-26. Completion date: 2006-08-24.
$23,632, same as above.Signed on 2006-05-30. Completion date: 2006-09-27.
$19,834, same as above.Signed on 2004-12-03. Completion date: 2005-02-23.
WESTNET SYSTEMS (16581 BURKE LN; small business) : $139,386 in 3 contractsfrom 2004 to 2005
$81,826 with Army for Fire Protection Services. Taking place in VA. Signed on 2004-12-09. Completion date: 2005-04-05.
$33,000 with Air Force for Maintenance, Repair and Rebuilding of Equipment -- Alarm, Signal, and Security Detection Systems. Taking place in AR. Signed on 2005-09-15. Completion date: 2005-09-21.
$24,560 with Army for Fire Control Transmitting and Receiving Equipment, except Airborne. Taking place in CO. Signed on 2005-09-13. Completion date: 2006-01-06.
KAYNAR TECHNOLOGIES INC (DE) (17800 GOTHARD ST; small business) : $97,853 in 2 contractsfrom 1999 to 2000
$51,502 with Army for Nuts and Washers. Signed on 2000-05-18. Completion date: 2000-09-22.
$46,351, same as above.Signed on 1999-11-21. Completion date: 2000-07-30.
GLOBAL PRESENTER (16371 GOTHARD ST STE C; small business) : $86,028 in 7 contractsfrom 2004 to 2006
Contracts for Office Devices and Accessories, Operation Training Devices, Communication Training Devices, ADP Support Equipment, and moreby Army Signed by year:2000: $0; 2001: $0; 2002: $0; 2003: $0; 2004: $32,434; 2005: $47,811; 2006: $5,783.
Biggest contracts:
$33,647 with Army for Office Devices and Accessories. Signed on 2005-03-16. Completion date: 2005-05-16.
$18,108 with Army for Operation Training Devices. Signed on 2004-03-15. Completion date: 2004-05-28.
$11,038 with Army for Communication Training Devices. Signed on 2004-07-20. Completion date: 2004-08-31.
$8,899 with Army for Office Devices and Accessories. Signed on 2005-03-03. Completion date: 2005-04-04.
RAJAH INC (17341 ROB ROY CIR; small business) : $59,263 in 9 contractsfrom 2004 to 2005
Contracts for Packaging and Packing Bulk Materials, Miscellaneous Items, Boxes, Cartons, and Crates by Department of Defense, Navy Signed by year:2000: $0; 2001: $0; 2002: $0; 2003: $0; 2004: $46,763; 2005: $12,500; 2006: $0.
Biggest contracts:
$21,300 with Department of Defense for Packaging and Packing Bulk Materials. Signed on 2004-11-02. Completion date: 2004-11-19.
$9,400, same as above.Signed on 2004-11-17. Completion date: 2004-11-29.
$7,025, same as above.Signed on 2004-11-17. Completion date: 2004-11-29.
$5,288 with Department of Defense for Miscellaneous Items. Signed on 2004-08-06. Completion date: 2004-08-20.
ELYSIUM, INC (17011 BEACH BLVD; small business)
$35,000 with Army for ADP Software. Signed on 2001-12-03. Completion date: 2002-01-15.
INTERNATIONAL PROGRAM GROUP, I (17210 BEACH BOULEVARD; small business)
$33,750 with Army for Training Aids. Taking place in MT. Signed on 2005-07-01. Completion date: 2005-07-24.
Top industries in this zip code by the number of employees in 2005:
2005 - 2018 National Fire Incident Reporting System (NFIRS) incidents
Based on the data from the years 2005 - 2018 the average number of fires per year is 42. The highest number of fire incidents - 103 took place in 2007, and the least - 0 in 2014. The data has a decreasing trend.
When looking into fire subcategories, the most incidents belonged to: Outside Fires (40.2%), and Structure Fires (29.1%).
Fire incident types reported to NFIRS in Zip Code 92647


 Nearest zip codes: 92655, 92683, 92649, 92648, 92844, 92708.
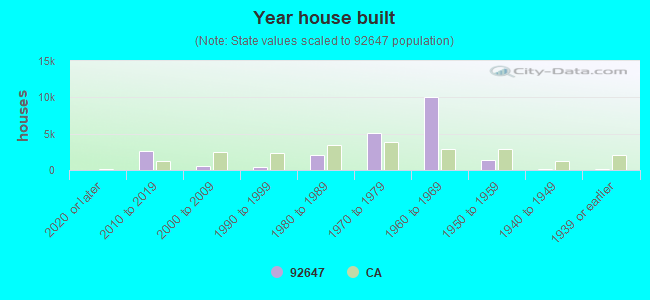


 Based on the data from the years 2005 - 2018 the average number of fires per year is 42. The highest number of fire incidents - 103 took place in 2007, and the least - 0 in 2014. The data has a decreasing trend.
 When looking into fire subcategories, the most incidents belonged to: Outside Fires (40.2%), and Structure Fires (29.1%).