Estimated zip code population in 2022: 22,434
Zip code population in 2010: 24,307
Zip code population in 2000: 23,465
Houses and condos: 7,119
Renter-occupied apartments: 3,986
% of renters here:
58%State:
44%
March 2022 cost of living index in zip code 92844: 88.3
(less than average, U.S. average is 100)
Land area: 2.1
sq. mi.
Water area: 0.0
sq. mi.
Population density: 10,552 people per square mile (high).
OSM Map
General Map
Google Map
MSN Map
OSM Map
General Map
Google Map
MSN Map
OSM Map
General Map
Google Map
MSN Map
OSM Map
General Map
Google Map
MSN Map
Please wait while loading the map...
Real estate property taxes paid for housing units in 2022:
This zip code:
0.6% ($4,396)California:
0.7% ($4,831)
Median real estate property taxes paid for housing units with mortgages in 2022: $4,936 (0.7%)
Median real estate property taxes paid for housing units with no mortgage in 2022: $3,573 (0.5%)
Profiles of local businesses
Business Search - 14 Million verified businesses
Males: 11,296 Females: 11,137
For population 25 years and over in 92844:
High school or higher: 73.0%Bachelor's degree or higher: 22.7%Graduate or professional degree: 5.8%Unemployed: 4.7%Mean travel time to work (commute): 29.3 minutes
For population 15 years and over in 92844:
Never married: 38.9%Now married: 46.0%Separated: 1.3%Widowed: 4.9%Divorced: 8.9%
Zip code 92844 compared to state average:
Black race population percentage below state average. Median age above state average. Foreign-born population percentage above state average. Length of stay since moving in significantly above state average. Percentage of population with a bachelor's degree or higher below state average. 13,131 58.5% Asian 5,309 23.7% Hispanic or Latino 2,628 11.7% White 689 3.1% Two or more races 481 2.1% Black 94 0.4% Some other race 65 0.3% Native Hawaiian and Other 33 0.1% American Indian
Data:
Median household income ($)
Median household income (% change since 2000)
Household income diversity
Ratio of average income to average house value (%)
Ratio of average income to average rent
Median household income ($) - White
Median household income ($) - Black or African American
Median household income ($) - Asian
Median household income ($) - Hispanic or Latino
Median household income ($) - American Indian and Alaska Native
Median household income ($) - Multirace
Median household income ($) - Other Race
Median household income for houses/condos with a mortgage ($)
Median household income for apartments without a mortgage ($)
Races - White alone (%)
Races - White alone (% change since 2000)
Races - Black alone (%)
Races - Black alone (% change since 2000)
Races - American Indian alone (%)
Races - American Indian alone (% change since 2000)
Races - Asian alone (%)
Races - Asian alone (% change since 2000)
Races - Hispanic (%)
Races - Hispanic (% change since 2000)
Races - Native Hawaiian and Other Pacific Islander alone (%)
Races - Native Hawaiian and Other Pacific Islander alone (% change since 2000)
Races - Two or more races (%)
Races - Two or more races (% change since 2000)
Races - Other race alone (%)
Races - Other race alone (% change since 2000)
Racial diversity
Unemployment (%)
Unemployment (% change since 2000)
Unemployment (%) - White
Unemployment (%) - Black or African American
Unemployment (%) - Asian
Unemployment (%) - Hispanic or Latino
Unemployment (%) - American Indian and Alaska Native
Unemployment (%) - Multirace
Unemployment (%) - Other Race
Population density (people per square mile)
Population - Males (%)
Population - Females (%)
Population - Males (%) - White
Population - Males (%) - Black or African American
Population - Males (%) - Asian
Population - Males (%) - Hispanic or Latino
Population - Males (%) - American Indian and Alaska Native
Population - Males (%) - Multirace
Population - Males (%) - Other Race
Population - Females (%) - White
Population - Females (%) - Black or African American
Population - Females (%) - Asian
Population - Females (%) - Hispanic or Latino
Population - Females (%) - American Indian and Alaska Native
Population - Females (%) - Multirace
Population - Females (%) - Other Race
Coronavirus confirmed cases (Apr 27, 2024)
Deaths caused by coronavirus (Apr 27, 2024)
Coronavirus confirmed cases (per 100k population) (Apr 27, 2024)
Deaths caused by coronavirus (per 100k population) (Apr 27, 2024)
Daily increase in number of cases (Apr 27, 2024)
Weekly increase in number of cases (Apr 27, 2024)
Cases doubled (in days) (Apr 27, 2024)
Hospitalized patients (Apr 18, 2022)
Negative test results (Apr 18, 2022)
Total test results (Apr 18, 2022)
COVID Vaccine doses distributed (per 100k population) (Sep 19, 2023)
COVID Vaccine doses administered (per 100k population) (Sep 19, 2023)
COVID Vaccine doses distributed (Sep 19, 2023)
COVID Vaccine doses administered (Sep 19, 2023)
Likely homosexual households (%)
Likely homosexual households (% change since 2000)
Likely homosexual households - Lesbian couples (%)
Likely homosexual households - Lesbian couples (% change since 2000)
Likely homosexual households - Gay men (%)
Likely homosexual households - Gay men (% change since 2000)
Cost of living index
Median gross rent ($)
Median contract rent ($)
Median monthly housing costs ($)
Median house or condo value ($)
Median house or condo value ($ change since 2000)
Mean house or condo value by units in structure - 1, detached ($)
Mean house or condo value by units in structure - 1, attached ($)
Mean house or condo value by units in structure - 2 ($)
Mean house or condo value by units in structure by units in structure - 3 or 4 ($)
Mean house or condo value by units in structure - 5 or more ($)
Mean house or condo value by units in structure - Boat, RV, van, etc. ($)
Mean house or condo value by units in structure - Mobile home ($)
Median house or condo value ($) - White
Median house or condo value ($) - Black or African American
Median house or condo value ($) - Asian
Median house or condo value ($) - Hispanic or Latino
Median house or condo value ($) - American Indian and Alaska Native
Median house or condo value ($) - Multirace
Median house or condo value ($) - Other Race
Median resident age
Resident age diversity
Median resident age - Males
Median resident age - Females
Median resident age - White
Median resident age - Black or African American
Median resident age - Asian
Median resident age - Hispanic or Latino
Median resident age - American Indian and Alaska Native
Median resident age - Multirace
Median resident age - Other Race
Median resident age - Males - White
Median resident age - Males - Black or African American
Median resident age - Males - Asian
Median resident age - Males - Hispanic or Latino
Median resident age - Males - American Indian and Alaska Native
Median resident age - Males - Multirace
Median resident age - Males - Other Race
Median resident age - Females - White
Median resident age - Females - Black or African American
Median resident age - Females - Asian
Median resident age - Females - Hispanic or Latino
Median resident age - Females - American Indian and Alaska Native
Median resident age - Females - Multirace
Median resident age - Females - Other Race
Commute - mean travel time to work (minutes)
Travel time to work - Less than 5 minutes (%)
Travel time to work - Less than 5 minutes (% change since 2000)
Travel time to work - 5 to 9 minutes (%)
Travel time to work - 5 to 9 minutes (% change since 2000)
Travel time to work - 10 to 19 minutes (%)
Travel time to work - 10 to 19 minutes (% change since 2000)
Travel time to work - 20 to 29 minutes (%)
Travel time to work - 20 to 29 minutes (% change since 2000)
Travel time to work - 30 to 39 minutes (%)
Travel time to work - 30 to 39 minutes (% change since 2000)
Travel time to work - 40 to 59 minutes (%)
Travel time to work - 40 to 59 minutes (% change since 2000)
Travel time to work - 60 to 89 minutes (%)
Travel time to work - 60 to 89 minutes (% change since 2000)
Travel time to work - 90 or more minutes (%)
Travel time to work - 90 or more minutes (% change since 2000)
Marital status - Never married (%)
Marital status - Now married (%)
Marital status - Separated (%)
Marital status - Widowed (%)
Marital status - Divorced (%)
Median family income ($)
Median family income (% change since 2000)
Median non-family income ($)
Median non-family income (% change since 2000)
Median per capita income ($)
Median per capita income (% change since 2000)
Median family income ($) - White
Median family income ($) - Black or African American
Median family income ($) - Asian
Median family income ($) - Hispanic or Latino
Median family income ($) - American Indian and Alaska Native
Median family income ($) - Multirace
Median family income ($) - Other Race
Median year house/condo built
Median year apartment built
Year house built - Built 2005 or later (%)
Year house built - Built 2000 to 2004 (%)
Year house built - Built 1990 to 1999 (%)
Year house built - Built 1980 to 1989 (%)
Year house built - Built 1970 to 1979 (%)
Year house built - Built 1960 to 1969 (%)
Year house built - Built 1950 to 1959 (%)
Year house built - Built 1940 to 1949 (%)
Year house built - Built 1939 or earlier (%)
Average household size
Household density (households per square mile)
Average household size - White
Average household size - Black or African American
Average household size - Asian
Average household size - Hispanic or Latino
Average household size - American Indian and Alaska Native
Average household size - Multirace
Average household size - Other Race
Occupied housing units (%)
Vacant housing units (%)
Owner occupied housing units (%)
Renter occupied housing units (%)
Vacancy status - For rent (%)
Vacancy status - For sale only (%)
Vacancy status - Rented or sold, not occupied (%)
Vacancy status - For seasonal, recreational, or occasional use (%)
Vacancy status - For migrant workers (%)
Vacancy status - Other vacant (%)
Residents with income below the poverty level (%)
Residents with income below 50% of the poverty level (%)
Children below poverty level (%)
Poor families by family type - Married-couple family (%)
Poor families by family type - Male, no wife present (%)
Poor families by family type - Female, no husband present (%)
Poverty status for native-born residents (%)
Poverty status for foreign-born residents (%)
Poverty among high school graduates not in families (%)
Poverty among people who did not graduate high school not in families (%)
Residents with income below the poverty level (%) - White
Residents with income below the poverty level (%) - Black or African American
Residents with income below the poverty level (%) - Asian
Residents with income below the poverty level (%) - Hispanic or Latino
Residents with income below the poverty level (%) - American Indian and Alaska Native
Residents with income below the poverty level (%) - Multirace
Residents with income below the poverty level (%) - Other Race
Air pollution - Air Quality Index (AQI)
Air pollution - CO
Air pollution - NO2
Air pollution - SO2
Air pollution - Ozone
Air pollution - PM10
Air pollution - PM25
Air pollution - Pb
Crime - Murders per 100,000 population
Crime - Rapes per 100,000 population
Crime - Robberies per 100,000 population
Crime - Assaults per 100,000 population
Crime - Burglaries per 100,000 population
Crime - Thefts per 100,000 population
Crime - Auto thefts per 100,000 population
Crime - Arson per 100,000 population
Crime - City-data.com crime index
Crime - Violent crime index
Crime - Property crime index
Crime - Murders per 100,000 population (5 year average)
Crime - Rapes per 100,000 population (5 year average)
Crime - Robberies per 100,000 population (5 year average)
Crime - Assaults per 100,000 population (5 year average)
Crime - Burglaries per 100,000 population (5 year average)
Crime - Thefts per 100,000 population (5 year average)
Crime - Auto thefts per 100,000 population (5 year average)
Crime - Arson per 100,000 population (5 year average)
Crime - City-data.com crime index (5 year average)
Crime - Violent crime index (5 year average)
Crime - Property crime index (5 year average)
1996 Presidential Elections Results (%) - Democratic Party (Clinton)
1996 Presidential Elections Results (%) - Republican Party (Dole)
1996 Presidential Elections Results (%) - Other
2000 Presidential Elections Results (%) - Democratic Party (Gore)
2000 Presidential Elections Results (%) - Republican Party (Bush)
2000 Presidential Elections Results (%) - Other
2004 Presidential Elections Results (%) - Democratic Party (Kerry)
2004 Presidential Elections Results (%) - Republican Party (Bush)
2004 Presidential Elections Results (%) - Other
2008 Presidential Elections Results (%) - Democratic Party (Obama)
2008 Presidential Elections Results (%) - Republican Party (McCain)
2008 Presidential Elections Results (%) - Other
2012 Presidential Elections Results (%) - Democratic Party (Obama)
2012 Presidential Elections Results (%) - Republican Party (Romney)
2012 Presidential Elections Results (%) - Other
2016 Presidential Elections Results (%) - Democratic Party (Clinton)
2016 Presidential Elections Results (%) - Republican Party (Trump)
2016 Presidential Elections Results (%) - Other
2020 Presidential Elections Results (%) - Democratic Party (Biden)
2020 Presidential Elections Results (%) - Republican Party (Trump)
2020 Presidential Elections Results (%) - Other
Ancestries Reported - Arab (%)
Ancestries Reported - Czech (%)
Ancestries Reported - Danish (%)
Ancestries Reported - Dutch (%)
Ancestries Reported - English (%)
Ancestries Reported - French (%)
Ancestries Reported - French Canadian (%)
Ancestries Reported - German (%)
Ancestries Reported - Greek (%)
Ancestries Reported - Hungarian (%)
Ancestries Reported - Irish (%)
Ancestries Reported - Italian (%)
Ancestries Reported - Lithuanian (%)
Ancestries Reported - Norwegian (%)
Ancestries Reported - Polish (%)
Ancestries Reported - Portuguese (%)
Ancestries Reported - Russian (%)
Ancestries Reported - Scotch-Irish (%)
Ancestries Reported - Scottish (%)
Ancestries Reported - Slovak (%)
Ancestries Reported - Subsaharan African (%)
Ancestries Reported - Swedish (%)
Ancestries Reported - Swiss (%)
Ancestries Reported - Ukrainian (%)
Ancestries Reported - United States (%)
Ancestries Reported - Welsh (%)
Ancestries Reported - West Indian (%)
Ancestries Reported - Other (%)
Educational Attainment - No schooling completed (%)
Educational Attainment - Less than high school (%)
Educational Attainment - High school or equivalent (%)
Educational Attainment - Less than 1 year of college (%)
Educational Attainment - 1 or more years of college (%)
Educational Attainment - Associate degree (%)
Educational Attainment - Bachelor's degree (%)
Educational Attainment - Master's degree (%)
Educational Attainment - Professional school degree (%)
Educational Attainment - Doctorate degree (%)
School Enrollment - Nursery, preschool (%)
School Enrollment - Kindergarten (%)
School Enrollment - Grade 1 to 4 (%)
School Enrollment - Grade 5 to 8 (%)
School Enrollment - Grade 9 to 12 (%)
School Enrollment - College undergrad (%)
School Enrollment - Graduate or professional (%)
School Enrollment - Not enrolled in school (%)
School enrollment - Public schools (%)
School enrollment - Private schools (%)
School enrollment - Not enrolled (%)
Median number of rooms in houses and condos
Median number of rooms in apartments
Housing units lacking complete plumbing facilities (%)
Housing units lacking complete kitchen facilities (%)
Density of houses
Urban houses (%)
Rural houses (%)
Households with people 60 years and over (%)
Households with people 65 years and over (%)
Households with people 75 years and over (%)
Households with one or more nonrelatives (%)
Households with no nonrelatives (%)
Population in households (%)
Family households (%)
Nonfamily households (%)
Population in families (%)
Family households with own children (%)
Median number of bedrooms in owner occupied houses
Mean number of bedrooms in owner occupied houses
Median number of bedrooms in renter occupied houses
Mean number of bedrooms in renter occupied houses
Median number of vehichles in owner occupied houses
Mean number of vehichles in owner occupied houses
Median number of vehichles in renter occupied houses
Mean number of vehichles in renter occupied houses
Mortgage status - with mortgage (%)
Mortgage status - with second mortgage (%)
Mortgage status - with home equity loan (%)
Mortgage status - with both second mortgage and home equity loan (%)
Mortgage status - without a mortgage (%)
Average family size
Average family size - White
Average family size - Black or African American
Average family size - Asian
Average family size - Hispanic or Latino
Average family size - American Indian and Alaska Native
Average family size - Multirace
Average family size - Other Race
Geographical mobility - Same house 1 year ago (%)
Geographical mobility - Moved within same county (%)
Geographical mobility - Moved from different county within same state (%)
Geographical mobility - Moved from different state (%)
Geographical mobility - Moved from abroad (%)
Place of birth - Born in state of residence (%)
Place of birth - Born in other state (%)
Place of birth - Native, outside of US (%)
Place of birth - Foreign born (%)
Housing units in structures - 1, detached (%)
Housing units in structures - 1, attached (%)
Housing units in structures - 2 (%)
Housing units in structures - 3 or 4 (%)
Housing units in structures - 5 to 9 (%)
Housing units in structures - 10 to 19 (%)
Housing units in structures - 20 to 49 (%)
Housing units in structures - 50 or more (%)
Housing units in structures - Mobile home (%)
Housing units in structures - Boat, RV, van, etc. (%)
House/condo owner moved in on average (years ago)
Renter moved in on average (years ago)
Year householder moved into unit - Moved in 1999 to March 2000 (%)
Year householder moved into unit - Moved in 1995 to 1998 (%)
Year householder moved into unit - Moved in 1990 to 1994 (%)
Year householder moved into unit - Moved in 1980 to 1989 (%)
Year householder moved into unit - Moved in 1970 to 1979 (%)
Year householder moved into unit - Moved in 1969 or earlier (%)
Means of transportation to work - Drove car alone (%)
Means of transportation to work - Carpooled (%)
Means of transportation to work - Public transportation (%)
Means of transportation to work - Bus or trolley bus (%)
Means of transportation to work - Streetcar or trolley car (%)
Means of transportation to work - Subway or elevated (%)
Means of transportation to work - Railroad (%)
Means of transportation to work - Ferryboat (%)
Means of transportation to work - Taxicab (%)
Means of transportation to work - Motorcycle (%)
Means of transportation to work - Bicycle (%)
Means of transportation to work - Walked (%)
Means of transportation to work - Other means (%)
Working at home (%)
Industry diversity
Most Common Industries - Agriculture, forestry, fishing and hunting, and mining (%)
Most Common Industries - Agriculture, forestry, fishing and hunting (%)
Most Common Industries - Mining, quarrying, and oil and gas extraction (%)
Most Common Industries - Construction (%)
Most Common Industries - Manufacturing (%)
Most Common Industries - Wholesale trade (%)
Most Common Industries - Retail trade (%)
Most Common Industries - Transportation and warehousing, and utilities (%)
Most Common Industries - Transportation and warehousing (%)
Most Common Industries - Utilities (%)
Most Common Industries - Information (%)
Most Common Industries - Finance and insurance, and real estate and rental and leasing (%)
Most Common Industries - Finance and insurance (%)
Most Common Industries - Real estate and rental and leasing (%)
Most Common Industries - Professional, scientific, and management, and administrative and waste management services (%)
Most Common Industries - Professional, scientific, and technical services (%)
Most Common Industries - Management of companies and enterprises (%)
Most Common Industries - Administrative and support and waste management services (%)
Most Common Industries - Educational services, and health care and social assistance (%)
Most Common Industries - Educational services (%)
Most Common Industries - Health care and social assistance (%)
Most Common Industries - Arts, entertainment, and recreation, and accommodation and food services (%)
Most Common Industries - Arts, entertainment, and recreation (%)
Most Common Industries - Accommodation and food services (%)
Most Common Industries - Other services, except public administration (%)
Most Common Industries - Public administration (%)
Occupation diversity
Most Common Occupations - Management, business, science, and arts occupations (%)
Most Common Occupations - Management, business, and financial occupations (%)
Most Common Occupations - Management occupations (%)
Most Common Occupations - Business and financial operations occupations (%)
Most Common Occupations - Computer, engineering, and science occupations (%)
Most Common Occupations - Computer and mathematical occupations (%)
Most Common Occupations - Architecture and engineering occupations (%)
Most Common Occupations - Life, physical, and social science occupations (%)
Most Common Occupations - Education, legal, community service, arts, and media occupations (%)
Most Common Occupations - Community and social service occupations (%)
Most Common Occupations - Legal occupations (%)
Most Common Occupations - Education, training, and library occupations (%)
Most Common Occupations - Arts, design, entertainment, sports, and media occupations (%)
Most Common Occupations - Healthcare practitioners and technical occupations (%)
Most Common Occupations - Health diagnosing and treating practitioners and other technical occupations (%)
Most Common Occupations - Health technologists and technicians (%)
Most Common Occupations - Service occupations (%)
Most Common Occupations - Healthcare support occupations (%)
Most Common Occupations - Protective service occupations (%)
Most Common Occupations - Fire fighting and prevention, and other protective service workers including supervisors (%)
Most Common Occupations - Law enforcement workers including supervisors (%)
Most Common Occupations - Food preparation and serving related occupations (%)
Most Common Occupations - Building and grounds cleaning and maintenance occupations (%)
Most Common Occupations - Personal care and service occupations (%)
Most Common Occupations - Sales and office occupations (%)
Most Common Occupations - Sales and related occupations (%)
Most Common Occupations - Office and administrative support occupations (%)
Most Common Occupations - Natural resources, construction, and maintenance occupations (%)
Most Common Occupations - Farming, fishing, and forestry occupations (%)
Most Common Occupations - Construction and extraction occupations (%)
Most Common Occupations - Installation, maintenance, and repair occupations (%)
Most Common Occupations - Production, transportation, and material moving occupations (%)
Most Common Occupations - Production occupations (%)
Most Common Occupations - Transportation occupations (%)
Most Common Occupations - Material moving occupations (%)
People in Group quarters - Institutionalized population (%)
People in Group quarters - Correctional institutions (%)
People in Group quarters - Federal prisons and detention centers (%)
People in Group quarters - Halfway houses (%)
People in Group quarters - Local jails and other confinement facilities (including police lockups) (%)
People in Group quarters - Military disciplinary barracks (%)
People in Group quarters - State prisons (%)
People in Group quarters - Other types of correctional institutions (%)
People in Group quarters - Nursing homes (%)
People in Group quarters - Hospitals/wards, hospices, and schools for the handicapped (%)
People in Group quarters - Hospitals/wards and hospices for chronically ill (%)
People in Group quarters - Hospices or homes for chronically ill (%)
People in Group quarters - Military hospitals or wards for chronically ill (%)
People in Group quarters - Other hospitals or wards for chronically ill (%)
People in Group quarters - Hospitals or wards for drug/alcohol abuse (%)
People in Group quarters - Mental (Psychiatric) hospitals or wards (%)
People in Group quarters - Schools, hospitals, or wards for the mentally retarded (%)
People in Group quarters - Schools, hospitals, or wards for the physically handicapped (%)
People in Group quarters - Institutions for the deaf (%)
People in Group quarters - Institutions for the blind (%)
People in Group quarters - Orthopedic wards and institutions for the physically handicapped (%)
People in Group quarters - Wards in general hospitals for patients who have no usual home elsewhere (%)
People in Group quarters - Wards in military hospitals for patients who have no usual home elsewhere (%)
People in Group quarters - Juvenile institutions (%)
People in Group quarters - Long-term care (%)
People in Group quarters - Homes for abused, dependent, and neglected children (%)
People in Group quarters - Residential treatment centers for emotionally disturbed children (%)
People in Group quarters - Training schools for juvenile delinquents (%)
People in Group quarters - Short-term care, detention or diagnostic centers for delinquent children (%)
People in Group quarters - Type of juvenile institution unknown (%)
People in Group quarters - Noninstitutionalized population (%)
People in Group quarters - College dormitories (includes college quarters off campus) (%)
People in Group quarters - Military quarters (%)
People in Group quarters - On base (%)
People in Group quarters - Barracks, unaccompanied personnel housing (UPH), (Enlisted/Officer), ;and similar group living quarters for military personnel (%)
People in Group quarters - Transient quarters for temporary residents (%)
People in Group quarters - Military ships (%)
People in Group quarters - Group homes (%)
People in Group quarters - Homes or halfway houses for drug/alcohol abuse (%)
People in Group quarters - Homes for the mentally ill (%)
People in Group quarters - Homes for the mentally retarded (%)
People in Group quarters - Homes for the physically handicapped (%)
People in Group quarters - Other group homes (%)
People in Group quarters - Religious group quarters (%)
People in Group quarters - Dormitories (%)
People in Group quarters - Agriculture workers' dormitories on farms (%)
People in Group quarters - Job Corps and vocational training facilities (%)
People in Group quarters - Other workers' dormitories (%)
People in Group quarters - Crews of maritime vessels (%)
People in Group quarters - Other nonhousehold living situations (%)
People in Group quarters - Other noninstitutional group quarters (%)
Residents speaking English at home (%)
Residents speaking English at home - Born in the United States (%)
Residents speaking English at home - Native, born elsewhere (%)
Residents speaking English at home - Foreign born (%)
Residents speaking Spanish at home (%)
Residents speaking Spanish at home - Born in the United States (%)
Residents speaking Spanish at home - Native, born elsewhere (%)
Residents speaking Spanish at home - Foreign born (%)
Residents speaking other language at home (%)
Residents speaking other language at home - Born in the United States (%)
Residents speaking other language at home - Native, born elsewhere (%)
Residents speaking other language at home - Foreign born (%)
Class of Workers - Employee of private company (%)
Class of Workers - Self-employed in own incorporated business (%)
Class of Workers - Private not-for-profit wage and salary workers (%)
Class of Workers - Local government workers (%)
Class of Workers - State government workers (%)
Class of Workers - Federal government workers (%)
Class of Workers - Self-employed workers in own not incorporated business and Unpaid family workers (%)
House heating fuel used in houses and condos - Utility gas (%)
House heating fuel used in houses and condos - Bottled, tank, or LP gas (%)
House heating fuel used in houses and condos - Electricity (%)
House heating fuel used in houses and condos - Fuel oil, kerosene, etc. (%)
House heating fuel used in houses and condos - Coal or coke (%)
House heating fuel used in houses and condos - Wood (%)
House heating fuel used in houses and condos - Solar energy (%)
House heating fuel used in houses and condos - Other fuel (%)
House heating fuel used in houses and condos - No fuel used (%)
House heating fuel used in apartments - Utility gas (%)
House heating fuel used in apartments - Bottled, tank, or LP gas (%)
House heating fuel used in apartments - Electricity (%)
House heating fuel used in apartments - Fuel oil, kerosene, etc. (%)
House heating fuel used in apartments - Coal or coke (%)
House heating fuel used in apartments - Wood (%)
House heating fuel used in apartments - Solar energy (%)
House heating fuel used in apartments - Other fuel (%)
House heating fuel used in apartments - No fuel used (%)
Armed forces status - In Armed Forces (%)
Armed forces status - Civilian (%)
Armed forces status - Civilian - Veteran (%)
Armed forces status - Civilian - Nonveteran (%)
Fatal accidents locations in years 2005-2021
Fatal accidents locations in 2005
Fatal accidents locations in 2006
Fatal accidents locations in 2007
Fatal accidents locations in 2008
Fatal accidents locations in 2009
Fatal accidents locations in 2010
Fatal accidents locations in 2011
Fatal accidents locations in 2012
Fatal accidents locations in 2013
Fatal accidents locations in 2014
Fatal accidents locations in 2015
Fatal accidents locations in 2016
Fatal accidents locations in 2017
Fatal accidents locations in 2018
Fatal accidents locations in 2019
Fatal accidents locations in 2020
Fatal accidents locations in 2021
Alcohol use - People drinking some alcohol every month (%)
Alcohol use - People not drinking at all (%)
Alcohol use - Average days/month drinking alcohol
Alcohol use - Average drinks/week
Alcohol use - Average days/year people drink much
Audiometry - Average condition of hearing (%)
Audiometry - People that can hear a whisper from across a quiet room (%)
Audiometry - People that can hear normal voice from across a quiet room (%)
Audiometry - Ears ringing, roaring, buzzing (%)
Audiometry - Had a job exposure to loud noise (%)
Audiometry - Had off-work exposure to loud noise (%)
Blood Pressure & Cholesterol - Has high blood pressure (%)
Blood Pressure & Cholesterol - Checking blood pressure at home (%)
Blood Pressure & Cholesterol - Frequently checking blood cholesterol (%)
Blood Pressure & Cholesterol - Has high cholesterol level (%)
Consumer Behavior - Money monthly spent on food at supermarket/grocery store
Consumer Behavior - Money monthly spent on food at other stores
Consumer Behavior - Money monthly spent on eating out
Consumer Behavior - Money monthly spent on carryout/delivered foods
Consumer Behavior - Income spent on food at supermarket/grocery store (%)
Consumer Behavior - Income spent on food at other stores (%)
Consumer Behavior - Income spent on eating out (%)
Consumer Behavior - Income spent on carryout/delivered foods (%)
Current Health Status - General health condition (%)
Current Health Status - Blood donors (%)
Current Health Status - Has blood ever tested for HIV virus (%)
Current Health Status - Left-handed people (%)
Dermatology - People using sunscreen (%)
Diabetes - Diabetics (%)
Diabetes - Had a blood test for high blood sugar (%)
Diabetes - People taking insulin (%)
Diet Behavior & Nutrition - Diet health (%)
Diet Behavior & Nutrition - Milk product consumption (# of products/month)
Diet Behavior & Nutrition - Meals not home prepared (#/week)
Diet Behavior & Nutrition - Meals from fast food or pizza place (#/week)
Diet Behavior & Nutrition - Ready-to-eat foods (#/month)
Diet Behavior & Nutrition - Frozen meals/pizza (#/month)
Drug Use - People that ever used marijuana or hashish (%)
Drug Use - Ever used hard drugs (%)
Drug Use - Ever used any form of cocaine (%)
Drug Use - Ever used heroin (%)
Drug Use - Ever used methamphetamine (%)
Health Insurance - People covered by health insurance (%)
Kidney Conditions-Urology - Avg. # of times urinating at night
Medical Conditions - People with asthma (%)
Medical Conditions - People with anemia (%)
Medical Conditions - People with psoriasis (%)
Medical Conditions - People with overweight (%)
Medical Conditions - Elderly people having difficulties in thinking or remembering (%)
Medical Conditions - People who ever received blood transfusion (%)
Medical Conditions - People having trouble seeing even with glass/contacts (%)
Medical Conditions - People with arthritis (%)
Medical Conditions - People with gout (%)
Medical Conditions - People with congestive heart failure (%)
Medical Conditions - People with coronary heart disease (%)
Medical Conditions - People with angina pectoris (%)
Medical Conditions - People who ever had heart attack (%)
Medical Conditions - People who ever had stroke (%)
Medical Conditions - People with emphysema (%)
Medical Conditions - People with thyroid problem (%)
Medical Conditions - People with chronic bronchitis (%)
Medical Conditions - People with any liver condition (%)
Medical Conditions - People who ever had cancer or malignancy (%)
Mental Health - People who have little interest in doing things (%)
Mental Health - People feeling down, depressed, or hopeless (%)
Mental Health - People who have trouble sleeping or sleeping too much (%)
Mental Health - People feeling tired or having little energy (%)
Mental Health - People with poor appetite or overeating (%)
Mental Health - People feeling bad about themself (%)
Mental Health - People who have trouble concentrating on things (%)
Mental Health - People moving or speaking slowly or too fast (%)
Mental Health - People having thoughts they would be better off dead (%)
Oral Health - Average years since last visit a dentist
Oral Health - People embarrassed because of mouth (%)
Oral Health - People with gum disease (%)
Oral Health - General health of teeth and gums (%)
Oral Health - Average days a week using dental floss/device
Oral Health - Average days a week using mouthwash for dental problem
Oral Health - Average number of teeth
Pesticide Use - Households using pesticides to control insects (%)
Pesticide Use - Households using pesticides to kill weeds (%)
Physical Activity - People doing vigorous-intensity work activities (%)
Physical Activity - People doing moderate-intensity work activities (%)
Physical Activity - People walking or bicycling (%)
Physical Activity - People doing vigorous-intensity recreational activities (%)
Physical Activity - People doing moderate-intensity recreational activities (%)
Physical Activity - Average hours a day doing sedentary activities
Physical Activity - Average hours a day watching TV or videos
Physical Activity - Average hours a day using computer
Physical Functioning - People having limitations keeping them from working (%)
Physical Functioning - People limited in amount of work they can do (%)
Physical Functioning - People that need special equipment to walk (%)
Physical Functioning - People experiencing confusion/memory problems (%)
Physical Functioning - People requiring special healthcare equipment (%)
Prescription Medications - Average number of prescription medicines taking
Preventive Aspirin Use - Adults 40+ taking low-dose aspirin (%)
Reproductive Health - Vaginal deliveries (%)
Reproductive Health - Cesarean deliveries (%)
Reproductive Health - Deliveries resulted in a live birth (%)
Reproductive Health - Pregnancies resulted in a delivery (%)
Reproductive Health - Women breastfeeding newborns (%)
Reproductive Health - Women that had a hysterectomy (%)
Reproductive Health - Women that had both ovaries removed (%)
Reproductive Health - Women that have ever taken birth control pills (%)
Reproductive Health - Women taking birth control pills (%)
Reproductive Health - Women that have ever used Depo-Provera or injectables (%)
Reproductive Health - Women that have ever used female hormones (%)
Sexual Behavior - People 18+ that ever had sex (vaginal, anal, or oral) (%)
Sexual Behavior - Males 18+ that ever had vaginal sex with a woman (%)
Sexual Behavior - Males 18+ that ever performed oral sex on a woman (%)
Sexual Behavior - Males 18+ that ever had anal sex with a woman (%)
Sexual Behavior - Males 18+ that ever had any sex with a man (%)
Sexual Behavior - Females 18+ that ever had vaginal sex with a man (%)
Sexual Behavior - Females 18+ that ever performed oral sex on a man (%)
Sexual Behavior - Females 18+ that ever had anal sex with a man (%)
Sexual Behavior - Females 18+ that ever had any kind of sex with a woman (%)
Sexual Behavior - Average age people first had sex
Sexual Behavior - Average number of female sex partners in lifetime (males 18+)
Sexual Behavior - Average number of female vaginal sex partners in lifetime (males 18+)
Sexual Behavior - Average age people first performed oral sex on a woman (18+)
Sexual Behavior - Average number of woman performed oral sex on in lifetime (18+)
Sexual Behavior - Average number of male sex partners in lifetime (males 18+)
Sexual Behavior - Average number of male anal sex partners in lifetime (males 18+)
Sexual Behavior - Average age people first performed oral sex on a man (18+)
Sexual Behavior - Average number of male oral sex partners in lifetime (18+)
Sexual Behavior - People using protection when performing oral sex (%)
Sexual Behavior - Average number of times people have vaginal or anal sex a year
Sexual Behavior - People having sex without condom (%)
Sexual Behavior - Average number of male sex partners in lifetime (females 18+)
Sexual Behavior - Average number of male vaginal sex partners in lifetime (females 18+)
Sexual Behavior - Average number of female sex partners in lifetime (females 18+)
Sexual Behavior - Circumcised males 18+ (%)
Sleep Disorders - Average hours sleeping at night
Sleep Disorders - People that has trouble sleeping (%)
Smoking-Cigarette Use - People smoking cigarettes (%)
Taste & Smell - People 40+ having problems with smell (%)
Taste & Smell - People 40+ having problems with taste (%)
Taste & Smell - People 40+ that ever had wisdom teeth removed (%)
Taste & Smell - People 40+ that ever had tonsils teeth removed (%)
Taste & Smell - People 40+ that ever had a loss of consciousness because of a head injury (%)
Taste & Smell - People 40+ that ever had a broken nose or other serious injury to face or skull (%)
Taste & Smell - People 40+ that ever had two or more sinus infections (%)
Weight - Average height (inches)
Weight - Average weight (pounds)
Weight - Average BMI
Weight - People that are obese (%)
Weight - People that ever were obese (%)
Weight - People trying to lose weight (%)
100%
urban population.
Estimated median house/condo value in 2022: $725,238
92844:
$725,238California:
$715,900
According to our research of California and other state lists, there were 16 registered sex offenders living in 92844 zip code as of April 27, 2024 . The ratio of all residents to sex offenders in zip code 92844 is 1,495 to 1.The ratio of registered sex offenders to all residents in this zip code is lower than the state average.
Median resident age: This zip code:
42.2 yearsCalifornia median age:
37.9 years
Average household size: This zip code:
3.2 peopleCalifornia:
2.8 people
Averages for the 2020 tax year for zip code 92844, filed in 2021:
Average Adjusted Gross Income (AGI) in 2020: $43,878 (Individual Income Tax Returns) Here:
$43,878State:
$95,910
Salary/wage: $40,963 (reported on 80.9% of returns )Here:
$40,963State:
$77,331
(% of AGI for various income ranges: 1043.6% for AGIs below $25k , 3946.7% for AGIs $25k-50k , 7689.5% for AGIs $50k-75k , 11036.7% for AGIs $75k-100k , 21758.8% for AGIs $100k-200k , 73550.0% for AGIs over 200k ) Taxable interest for individuals: $651 (reported on 22.2% of returns )This zip code:
$651California:
$2,294
(% of AGI for various income ranges: 6.9% for AGIs below $25k , 13.5% for AGIs $25k-50k , 28.6% for AGIs $50k-75k , 40.8% for AGIs $75k-100k , 122.1% for AGIs $100k-200k , 290.0% for AGIs over 200k ) Ordinary dividends: $1,228 (reported on 9.5% of returns )(% of AGI for various income ranges: 4.3% for AGIs below $25k , 9.5% for AGIs $25k-50k , 13.8% for AGIs $50k-75k , 25.0% for AGIs $75k-100k , 100.0% for AGIs $100k-200k , 760.0% for AGIs over 200k ) Net capital gain/loss in AGI: +$7,505 (reported on 13.0% of returns )Here:
+$7,505State:
+$49,306
(% of AGI for various income ranges: 5.5% for AGIs below $25k , 27.8% for AGIs $25k-50k , 52.8% for AGIs $50k-75k , 167.3% for AGIs $75k-100k , 611.6% for AGIs $100k-200k , 16442.5% for AGIs over 200k ) Profit/loss from business: +$7,550 (reported on 21.6% of returns )Here:
+$7,550State:
+$15,671
(% of AGI for various income ranges: 213.8% for AGIs below $25k , 217.0% for AGIs $25k-50k , 185.1% for AGIs $50k-75k , 262.3% for AGIs $75k-100k , 297.9% for AGIs $100k-200k , 6565.0% for AGIs over 200k ) Taxable individual retirement arrangement distribution: $13,381 (reported on 2.7% of returns )92844:
$13,381California:
$23,505
(% of AGI for various income ranges: 18.9% for AGIs below $25k , 31.0% for AGIs $25k-50k , 63.7% for AGIs $50k-75k , 124.8% for AGIs $75k-100k , 373.0% for AGIs $100k-200k ) Total itemized deductions: $27,114 (reported on 7.5% of returns )Here:
$27,114State:
$39,517
(% of AGI for various income ranges: 42.8% for AGIs below $25k , 129.7% for AGIs $25k-50k , 358.3% for AGIs $50k-75k , 754.8% for AGIs $75k-100k , 1988.8% for AGIs $100k-200k , 7567.5% for AGIs over 200k ) Charity contributions: $4,839 (reported on 5.9% of returns )(% of AGI for various income ranges: 2.1% for AGIs below $25k , 10.8% for AGIs $25k-50k , 34.5% for AGIs $50k-75k , 96.3% for AGIs $75k-100k , 310.0% for AGIs $100k-200k , 2012.5% for AGIs over 200k ) Taxes paid: $8,325 (reported on 7.4% of returns )(% of AGI for various income ranges: 13.1% for AGIs below $25k , 35.6% for AGIs $25k-50k , 114.6% for AGIs $50k-75k , 249.4% for AGIs $75k-100k , 641.4% for AGIs $100k-200k , 1675.0% for AGIs over 200k ) Earned income credit: $1,896 (reported on 22.3% of returns )(% of AGI for various income ranges: 95.9% for AGIs below $25k , 82.7% for AGIs $25k-50k , 1.4% for AGIs $50k-75k ) Percentage of individuals using paid preparers for their 2020 taxes: 93.0%(% for various income ranges: 91.5% for AGIs below $25k , 93.8% for AGIs $25k-50k , 94.6% for AGIs $50k-75k , 93.8% for AGIs $75k-100k , 94.2% for AGIs $100k-200k , 93.3% for AGIs over 200k )
Averages for the 2012 tax year for zip code 92844, filed in 2013:
Average Adjusted Gross Income (AGI) in 2012: $34,837 (Individual Income Tax Returns) Here:
$34,837State:
$72,726
Salary/wage: $34,504 (reported on 82.2% of returns )Here:
$34,504State:
$59,079
(% of AGI for various income ranges: 72.1% for AGIs below $25k , 86.5% for AGIs $25k-50k , 85.1% for AGIs $50k-75k , 85.3% for AGIs $75k-100k , 83.2% for AGIs $100k-200k , 50.7% for AGIs over 200k ) Taxable interest for individuals: $512 (reported on 22.3% of returns )This zip code:
$512California:
$2,146
(% of AGI for various income ranges: 0.5% for AGIs below $25k , 0.3% for AGIs $25k-50k , 0.3% for AGIs $50k-75k , 0.3% for AGIs $75k-100k , 0.3% for AGIs $100k-200k , 0.3% for AGIs over 200k ) Ordinary dividends: $1,671 (reported on 6.5% of returns )(% of AGI for various income ranges: 0.2% for AGIs below $25k , 0.2% for AGIs $25k-50k , 0.2% for AGIs $50k-75k , 0.3% for AGIs $75k-100k , 0.9% for AGIs $100k-200k ) Net capital gain/loss in AGI: +$309 (reported on 8.0% of returns )(% of AGI for various income ranges: 1.1% for AGIs $100k-200k ) Profit/loss from business: +$9,991 (reported on 23.2% of returns )Here:
+$9,991State:
+$17,064
(% of AGI for various income ranges: 19.2% for AGIs below $25k , 5.4% for AGIs $25k-50k , 3.3% for AGIs $50k-75k , 2.3% for AGIs $75k-100k , 3.9% for AGIs $100k-200k ) Taxable individual retirement arrangement distribution: $12,383 (reported on 3.5% of returns )92844:
$12,383California:
$19,557
(% of AGI for various income ranges: 1.0% for AGIs below $25k , 1.0% for AGIs $25k-50k , 1.5% for AGIs $50k-75k , 1.3% for AGIs $75k-100k , 1.8% for AGIs $100k-200k ) Total itemized deductions: $20,981 (30% of AGI, reported on 22.7% of returns )Here:
$20,981State:
$34,004
Here:
29.8% of AGIState:
22.7% of AGI
(% of AGI for various income ranges: 5.5% for AGIs below $25k , 11.0% for AGIs $25k-50k , 15.1% for AGIs $50k-75k , 18.2% for AGIs $75k-100k , 19.7% for AGIs $100k-200k , 21.1% for AGIs over 200k ) Charity contributions: $2,499 (reported on 18.0% of returns )(% of AGI for various income ranges: 0.3% for AGIs below $25k , 0.8% for AGIs $25k-50k , 1.3% for AGIs $50k-75k , 1.7% for AGIs $75k-100k , 2.3% for AGIs $100k-200k , 3.1% for AGIs over 200k ) Taxes paid: $6,518 (reported on 22.7% of returns )92844:
$6,518State:
$14,448
(% of AGI for various income ranges: 1.3% for AGIs below $25k , 2.7% for AGIs $25k-50k , 4.4% for AGIs $50k-75k , 5.9% for AGIs $75k-100k , 7.4% for AGIs $100k-200k , 8.8% for AGIs over 200k ) Earned income credit: $2,287 (reported on 30.9% of returns )(% of AGI for various income ranges: 9.0% for AGIs below $25k , 1.4% for AGIs $25k-50k ) Percentage of individuals using paid preparers for their 2012 taxes: 76.0%(% for various income ranges: 76.7% for AGIs below $25k , 77.4% for AGIs $25k-50k , 73.7% for AGIs $50k-75k , 71.7% for AGIs $75k-100k , 71.7% for AGIs $100k-200k , 80.0% for AGIs over 200k )
Averages for the 2004 tax year for zip code 92844, filed in 2005:
Average Adjusted Gross Income (AGI) in 2004: $31,257 (Individual Income Tax Returns) Here:
$31,257State:
$58,600
Salary/wage: $30,924 (reported on 84.7% of returns )Here:
$30,924State:
$49,455
(% of AGI for various income ranges: 80.6% for AGIs below $10k , 79.5% for AGIs $10k-25k , 88.0% for AGIs $25k-50k , 88.6% for AGIs $50k-75k , 88.8% for AGIs $75k-100k , 70.1% for AGIs over 100k ) Taxable interest for individuals: $587 (reported on 32.3% of returns )This zip code:
$587California:
$2,365
(% of AGI for various income ranges: 1.4% for AGIs below $10k , 0.7% for AGIs $10k-25k , 0.6% for AGIs $25k-50k , 0.5% for AGIs $50k-75k , 0.3% for AGIs $75k-100k , 0.8% for AGIs over 100k ) Taxable dividends: $1,117 (reported on 8.1% of returns )(% of AGI for various income ranges: 0.7% for AGIs below $10k , 0.3% for AGIs $10k-25k , 0.2% for AGIs $25k-50k , 0.3% for AGIs $50k-75k , 0.2% for AGIs $75k-100k , 0.4% for AGIs over 100k ) Net capital gain/loss: +$6,020 (reported on 9.6% of returns )Here:
+$6,020State:
+$23,418
(% of AGI for various income ranges: -0.7% for AGIs below $10k , -0.2% for AGIs $10k-25k , -0.1% for AGIs $25k-50k , 0.7% for AGIs $50k-75k , 0.9% for AGIs $75k-100k , 11.3% for AGIs over 100k ) Profit/loss from business: +$8,702 (reported on 21.8% of returns )Here:
+$8,702State:
+$16,826
(% of AGI for various income ranges: 27.3% for AGIs below $10k , 12.6% for AGIs $10k-25k , 5.1% for AGIs $25k-50k , 3.3% for AGIs $50k-75k , 3.1% for AGIs $75k-100k , 2.3% for AGIs over 100k ) IRA payment deduction: $2,917 (reported on 1.8% of returns )92844:
$2,917California:
$3,192
(% of AGI for various income ranges: 0.1% for AGIs $10k-25k , 0.2% for AGIs $25k-50k , 0.2% for AGIs $50k-75k , 0.2% for AGIs $75k-100k , 0.1% for AGIs over 100k ) Self-employed pension: $6,762 (reported on 0.2% of returns )Here:
$6,762California:
$17,688
Total itemized deductions: $19,165 (33% of AGI, reported on 28.8% of returns )Here:
$19,165State:
$28,113
Here:
33.4% of AGIState:
25.3% of AGI
(% of AGI for various income ranges: 7.6% for AGIs below $10k , 9.9% for AGIs $10k-25k , 16.2% for AGIs $25k-50k , 24.1% for AGIs $50k-75k , 23.0% for AGIs $75k-100k , 17.9% for AGIs over 100k ) Charity contributions deductions: $2,333 (4% of AGI, reported on 23.1% of returns )Here:
3.8% of AGIState:
3.3% of AGI
(% of AGI for various income ranges: 0.3% for AGIs below $10k , 0.6% for AGIs $10k-25k , 1.5% for AGIs $25k-50k , 2.2% for AGIs $50k-75k , 2.4% for AGIs $75k-100k , 2.5% for AGIs over 100k ) Total tax: $3,510 (reported on 69.0% of returns )92844:
$3,510State:
$10,761
(% of AGI for various income ranges: 5.4% for AGIs below $10k , 4.3% for AGIs $10k-25k , 5.7% for AGIs $25k-50k , 7.8% for AGIs $50k-75k , 9.1% for AGIs $75k-100k , 15.0% for AGIs over 100k ) Earned income credit: $1,800 (reported on 27.7% of returns )Percentage of individuals using paid preparers for their 2004 taxes: 69.4%(% for various income ranges: 64.8% for AGIs below $10k , 71.1% for AGIs $10k-25k , 70.3% for AGIs $25k-50k , 71.3% for AGIs $50k-75k , 68.6% for AGIs $75k-100k , 72.3% for AGIs over 100k )
Estimated median household income in 2022: This zip code:
$71,079California:
$91,551
Nearest zip codes: 92841 ,
92655 ,
92683 ,
92843 ,
92840 ,
90680 .
Westminster Zip Code Map
Percentage of family households: This zip code:
47.7%California:
46.8%
Percentage of households with unmarried partners: This zip code:
5.6%California:
48.1%
No gay or lesbian households reported
Household received Food Stamps/SNAP in the past 12 months: 1,071Household did not receive Food Stamps/SNAP in the past 12 months: 5,824
Women who had a birth in the past 12 months: 159 (158 now married , 0 unmarried) Women who did not have a birth in the past 12 months: 5,256 (1,877 now married , 3,387 unmarried)
Housing units in zip code 92844 with a mortgage: 1,876 (63
second mortgage , 65
both second mortgage and home equity loan )
Houses without a mortgage: 53
Median monthly owner costs for units with a mortgage: $2,424
Median monthly owner costs for units without a mortgage: $657
Residents with income below the poverty level in 2022:
This zip code:
15.5%Whole state:
12.2%
Residents with income below 50% of the poverty level in 2022:
This zip code:
8.3%Whole state:
6.2%
Median number of rooms in houses and condos: Median number of rooms in apartments:
Year house built (houses)
64 2020 or later159 2010 to 2019217 2000 to 2009440 1990 to 1999887 1980 to 19891,740 1970 to 19791,303 1960 to 19691,843 1950 to 1959151 1940 to 1949112 1939 or earlier
Zip code 92844 household income distribution in 2022 501 Less than $10,000178 $10,000 to $14,999139 $15,000 to $19,999366 $20,000 to $24,999284 $25,000 to $29,999290 $30,000 to $34,999200 $35,000 to $39,999132 $40,000 to $44,999227 $45,000 to $49,999439 $50,000 to $59,999799 $60,000 to $74,9991,070 $75,000 to $99,999632 $100,000 to $124,999275 $125,000 to $149,999627 $150,000 to $199,999689 $200,000 or moreEstimate of home value of owner-occupied houses/condos in 2022 in zip code 92844 26 Less than $10,0009 $15,000 to $19,9999 $50,000 to $59,9996 $80,000 to $89,9998 $100,000 to $124,99911 $150,000 to $174,9997 $250,000 to $299,99956 $300,000 to $399,999358 $400,000 to $499,9991,294 $500,000 to $749,9991,027 $750,000 to $999,99963 $1,000,000 to $1,499,99916 $1,500,000 to $1,999,99910 $2,000,000 or moreRent paid by renters in 2022 in zip code 92844 10 $150 to $19960 $200 to $24942 $250 to $29911 $300 to $34997 $400 to $44910 $450 to $49921 $550 to $59933 $600 to $64944 $750 to $79943 $800 to $899190 $1,000 to $1,249315 $1,250 to $1,4991,412 $1,500 to $1,9991,038 $2,000 to $2,499412 $2,500 to $2,999162 $3,000 to $3,49924 $3,500 or more94 No cash rent
Median gross rent in 2022: $2,009.
Median price asked for vacant for-sale houses and condos in 2022: $671,182.
Estimated median house (or condo) value in 2022 for: White Non-Hispanic householders: $731,063Black or African American householders: $590,426Asian householders: $789,315Native Hawaiian and other Pacific Islander householders: $936,194Some other race householders: $718,997Two or more races householders: $839,245Hispanic or Latino householders: $701,521Estimated median house or condo value in 2022: $725,238
92844:
$725,238California:
$715,900
Lower value quartile - upper value quartile: $587,547 - $903,219
Mean price in 2022: Detached houses: $824,574Here:
$824,574State:
$988,808
Townhouses or other attached units: $544,134Here:
$544,134State:
$838,546
In 3-to-4-unit structures: $704,360Here:
$704,360State:
$824,253
In 5-or-more-unit structures: $448,127Here:
$448,127State:
$730,996
Mobile homes: $88,510Here:
$88,510State:
$184,506
Housing units in structures:
One, detached: 2,818One, attached: 1,157Two: 2073 or 4: 6715 to 9: 58910 to 19: 40120 to 49: 59250 or more: 541Mobile homes: 110Boats, RVs, vans, etc.: 34Unemployment : 4.7%
Means of transportation to work in zip code 92844 72.3% 7,826 Drove a car alone14.1% 1,524 Carpooled1.1% 115 Bus or trolley bus0.0% 4 Streetcar or trolley car0.1% 16 Motorcycle0.3% 36 Bicycle0.5% 50 Walked1.7% 181 Other means8.6% 933 Worked at homeTravel time to work (commute) in zip code 92844 38 Less than 5 minutes501 5 to 9 minutes851 10 to 14 minutes1,168 15 to 19 minutes1,680 20 to 24 minutes805 25 to 29 minutes2,116 30 to 34 minutes168 35 to 39 minutes512 40 to 44 minutes888 45 to 59 minutes571 60 to 89 minutes366 90 or more minutes
Neighborhoods in zip code 92844: Percentage of zip code residents living and working in this county: 84.8%
Household type by relationship:
Households: 22,434
Male householders: 3,856 (649 living alone ), Female householders: 2,990 (528 living alone )3,087 spouses (3,031 opposite-sex spouses ), 439 unmarried partners , (435 opposite-sex unmarried partners ), 6,235 children (6,040 natural , 24 adopted , 170 stepchildren ), 649 grandchildren , 1,021 brothers or sisters , 1,454 parents , 0 foster children , 931 other relatives , 1,307 non-relatives In group quarters: 394 (-1 institutionalized population )
Size of family households: 1,516 2-persons , 1,488 3-persons , 1,027 4-persons , 583 5-persons , 320 6-persons , 341 7-or-more-persons
Size of nonfamily households: 1,174 1-person , 242 2-persons , 64 3-persons , 16 5-persons , 11 6-persons , 40 7-or-more-persons
1,810 married couples with children. single-parent households (463 men , 589 women ).
23.5% of residents of 92844 zip code speak English at home. of residents speak Spanish at home (55% very well, 24% well, 18% not well, 4% not at all ).of residents speak other Indo-European language at home (58% very well, 36% well, 4% not well, 2% not at all ).of residents speak Asian or Pacific Island language at home (35% very well, 25% well, 29% not well, 10% not at all ).of residents speak other language at home (55% very well, 21% well, 24% not well ).
Foreign born population: 12,068 (53.8%)
(73.6%
of them are naturalized citizens )
This zip code:
53.8%Whole state:
26.7%
60% Thailand 15% Honduras 10% Japan 2% Nepal 2% Costa Rica 2% Indonesia 2% Malaysia 3% American 2% Italian 1% Iraqi 1% Ethiopian 1% European 1% Turkish 1% English
Year of entry for the foreign-born population
2,956 2010 or later 2,188 2000 to 2009 3,212 1990 to 1999 4,044 Before 1990
There are
126 Medical Specialists in Zip Code 92844 .
Major facilities with environmental interests located in this zip code:
GARDEN CITY DODGE (10151 GARDEN GROVE BOULEVARD in GARDEN GROVE, CA)
(Integrated Compliance Information System) - ICIS-HQ-1977-0029, FORMAL ENFORCEMENT ACTION (Resource Conservation and Recovery Act (tracking hazardous waste)) Business SIC classification: MOTOR VEHICLE DEALERS (NEW AND USED)Organizations: WILLIAM ROOF (CONTACT/OWNER)
, NEWELL OWENBY (CONTACT/OWNER)
Alternative names: GARDEN GROVE AUTO CTR
GOLDEN BODY (9202 GARDEN GROVE BOULEVARD in GARDEN GROVE, CA)
STATE MASTER (California - Hazardous Waste Tracking) - HAZARDOU WASTE PROGRAM Small Quantity Generators, between 100 kg and 1000 kg of hazardous waste/month (Resource Conservation and Recovery Act (tracking hazardous waste)) - notification Small Quantity Generators, between 100 kg and 1000 kg of hazardous waste/month (Resource Conservation and Recovery Act (tracking hazardous waste)) - notification Business NAICS classification: GENERAL AUTOMOTIVE REPAIR.Organizations: KI P CHONG (CONTACT/OWNER)
Alternative names: GOLDEN TIRE & BODY SHOP
MASTERCRAFT CARBURETOR (13042 KERRY ST in GARDEN GROVE, CA)
STATE MASTER (California - Hazardous Waste Tracking) - HAZARDOU WASTE PROGRAM Small Quantity Generators, between 100 kg and 1000 kg of hazardous waste/month (Resource Conservation and Recovery Act (tracking hazardous waste)) - notification Business NAICS classification: OTHER AUTOMOTIVE MECHANICAL AND ELECTRICAL REPAIR AND MAINTENANCE.Organizations: MCMASTERS JAMES F (CONTACT/OWNER)
NISSAN OF GARDEN GROVE (9670 TRASK AVE. in GARDEN GROVE, CA)
Small Quantity Generators, between 100 kg and 1000 kg of hazardous waste/month (Resource Conservation and Recovery Act (tracking hazardous waste)) - notification STATE MASTER (California - Used Oil Recycling System ) - USED OIL RECYCLING Organizations: QUALITY NISSAN (CONTACT/OWNER)
Alternative names: NISSAN OF GRARDEN GROVE, QUALITY NISSAN
A J COOK ELEMENTARY SCHOOL (9802 WOODBURY RD in GARDEN GROVE, CA)
(Geographic Names Information System) (National Center for Education Statistics) - STATE ID-6028211 Organizations: GARDEN GROVE UNIFIED (SCHOOL DISTRICT)
Alternative names: COOK (A. J.) ELEMENTARY
HAIHO MUFFLER AND AUTO REPAIR (13124 MAGNOLIA AVENUE UNIT B in GARDEN GROVE, CA)
STATE MASTER (California - Hazardous Waste Tracking) - HAZARDOU WASTE PROGRAM Small Quantity Generators, between 100 kg and 1000 kg of hazardous waste/month (Resource Conservation and Recovery Act (tracking hazardous waste)) - notification Organizations: TRAN LAM (CONTACT/OWNER)
Alternative names: HAIHO GENERAL AUTO REPAIR
LEW WEBB FORD INC (9222 TRASK AVE in GARDEN GROVE, CA)
STATE MASTER (California - Hazardous Waste Tracking) - HAZARDOU WASTE PROGRAM Small Quantity Generators, between 100 kg and 1000 kg of hazardous waste/month (Resource Conservation and Recovery Act (tracking hazardous waste)) - notification Organizations: WEB AUTOMOTIVE GROUP (CONTACT/OWNER)
Alternative names: FORD OF GARDEN GROVE
HILL (MERTON E.) ELEMENTARY (9681 11TH ST. in GARDEN GROVE, CA)
(National Center for Education Statistics) - STATE ID-6028641 Organizations: GARDEN GROVE UNIFIED (SCHOOL DISTRICT)
JORDAN (DONALD S.) INTERMEDIATE (9821 WOODBURY ROAD in GARDEN GROVE, CA)
(National Center for Education Statistics) - STATE ID-6028302 Organizations: GARDEN GROVE UNIFIED (SCHOOL DISTRICT)
JORDAN SECONDARY LEARNING CENT (9915 WOODBURY AVE. in GARDEN GROVE, CA)
(National Center for Education Statistics) - STATE ID-6104129 Organizations: GARDEN GROVE UNIFIED (SCHOOL DISTRICT)
MURDY (JOHN) ELEMENTARY (14851 DONEGAL DR. in GARDEN GROVE, CA)
(National Center for Education Statistics) - STATE ID-6028526 Organizations: GARDEN GROVE UNIFIED (SCHOOL DISTRICT)
23 MINUTE PHOTO TO GO (8851 GARDEN GROVE BOULEVARD SUITE 103 in GARDEN GROVE, CA)
Small Quantity Generators, between 100 kg and 1000 kg of hazardous waste/month (Resource Conservation and Recovery Act (tracking hazardous waste)) - notification Organizations: SAM KIM (CONTACT/OWNER)
AMERACLEAN CLEANERS (8663 GARDEN GROVE in GARDEN GROVE, CA)
Small Quantity Generators, between 100 kg and 1000 kg of hazardous waste/month (Resource Conservation and Recovery Act (tracking hazardous waste)) - notification Organizations: DOUGLAS MCKEDDIE (CONTACT/OWNER)
Housing units lacking complete plumbing facilities: 1.3%
Housing units lacking complete kitchen facilities: 3.0%
64.2% Utility gas 26.6% Electricity 5.6% No fuel used 2.8% Bottled, tank, or LP gas 0.7% Wood
Place of birth for U.S.-born residents:
This state: 8,860Northeast: 451Midwest: 261South: 320West: 252
50% of the 92844 zip code residents lived in the same house 5 years ago.
Out of people who lived in different houses, 87% lived in this county.
Out of people who lived in different counties, 50% lived in California.
92% of the 92844 zip code residents lived in the same house 1 year ago.
Out of people who lived in different houses, 74% moved from this county.
Out of people who lived in different houses, 10% moved from different county within same state.
Out of people who lived in different houses, 7% moved from different state.
Out of people who lived in different houses, 10% moved from abroad.
Private vs. public school enrollment:
Students in private schools in grades 1 to 8 (elementary and middle school): 97
Here:
6.2%California:
10.5%
Students in private schools in grades 9 to 12 (high school): 74
Students in private undergraduate colleges: 109
Here:
7.3%California:
15.9%
Occupation by median earnings in the past 12 months ($)
152,552 Health diagnosing and treating practitioners and other technical occupations 88,848 Architecture and engineering occupations 70,792 Computer and mathematical occupations 65,896 Installation, maintenance, and repair occupations 65,882 Business and financial operations occupations 65,488 Arts, design, entertainment, sports, and media occupations
Top industries in this zip code by the number of employees in 2005:
Accommodation and Food Services: Full-Service Restaurants (20-49 employees: 7 establishments, 10-19 employees: 6 establishments, 5-9 employees: 6 establishments, 1-4 employees: 31 establishments)Accommodation and Food Services: Limited-Service Restaurants (50-99: 1, 20-49: 5, 10-19: 1, 5-9: 1, 1-4: 11)Health Care and Social Assistance: Offices of Physicians (except Mental Health Specialists) (50-99: 1, 10-19: 2, 5-9: 4, 1-4: 19)Health Care and Social Assistance: Home Health Care Services (100-249: 1)Construction: Plumbing, Heating, and Air-Conditioning Contractors (20-49: 2, 5-9: 2, 1-4: 3)Health Care and Social Assistance: Offices of Dentists (5-9: 7, 1-4: 14)Other Services (except Public Administration): Religious Organizations (10-19: 2, 5-9: 3, 1-4: 10)Finance and Insurance: Commercial Banking (20-49: 1, 10-19: 2, 5-9: 1)
People in group quarters in 2010:
174 people in residential treatment centers for adults
172 people in other noninstitutional facilities
61 people in group homes intended for adults
5 people in in-patient hospice facilities
People in group quarters in 2000:
148 people in other nonhousehold living situations
119 people in homes or halfway houses for drug/alcohol abuse
47 people in other noninstitutional group quarters
28 people in homes for the mentally retarded
Fatal accident statistics in 2014:
Fatal accident count: 1Vehicles involved in fatal accidents: 1Fatal accidents caused by drunken drivers: 0Fatalities: 1Persons involved in fatal accidents: 2Pedestrians involved in fatal accidents: 0
Fatal accident statistics in 2013:
Fatal accident count: 1Vehicles involved in fatal accidents: 2Fatal accidents caused by drunken drivers: 0Fatalities: 1Persons involved in fatal accidents: 2Pedestrians involved in fatal accidents: 0
Home Mortgage Disclosure Act Aggregated Statistics For Year 2009(Based on 4 full and 4 partial tracts) A) FHA, FSA/RHS & VA B) Conventional C) Refinancings D) Home Improvement Loans E) Loans on Dwellings For 5+ Families F) Non-occupant Loans on G) Loans On Manufactured Number Average Value Number Average Value Number Average Value Number Average Value Number Average Value Number Average Value Number Average Value
LOANS ORIGINATED 33 $265,073 190 $225,115 411 $245,183 16 $153,487 0 $0 101 $227,882 2 $47,185 APPLICATIONS APPROVED, NOT ACCEPTED 8 $314,846 30 $234,832 84 $254,568 5 $189,000 0 $0 26 $255,184 0 $0 APPLICATIONS DENIED 22 $222,960 52 $246,194 238 $273,863 19 $136,803 2 $4,786,080 55 $261,452 2 $51,720 APPLICATIONS WITHDRAWN 9 $239,592 43 $263,805 103 $242,228 8 $179,779 2 $4,985,500 26 $270,471 0 $0 FILES CLOSED FOR INCOMPLETENESS 6 $161,128 16 $237,169 17 $321,059 2 $146,575 1 $811,570 8 $166,841 0 $0
Aggregated Statistics For Year 2008(Based on 4 full and 4 partial tracts) A) FHA, FSA/RHS & VA B) Conventional C) Refinancings D) Home Improvement Loans E) Loans on Dwellings For 5+ Families F) Non-occupant Loans on G) Loans On Manufactured Number Average Value Number Average Value Number Average Value Number Average Value Number Average Value Number Average Value Number Average Value
LOANS ORIGINATED 33 $278,916 343 $249,003 259 $272,820 24 $65,218 6 $3,243,490 179 $242,810 8 $60,920 APPLICATIONS APPROVED, NOT ACCEPTED 4 $375,388 61 $254,870 100 $303,187 5 $295,230 2 $499,070 11 $239,995 9 $147,181 APPLICATIONS DENIED 10 $302,899 85 $269,349 220 $340,091 24 $127,007 0 $0 42 $358,259 12 $76,792 APPLICATIONS WITHDRAWN 6 $236,313 61 $267,362 96 $282,146 7 $111,389 2 $1,608,320 11 $241,560 0 $0 FILES CLOSED FOR INCOMPLETENESS 1 $266,660 7 $256,196 40 $324,173 3 $258,397 0 $0 6 $304,142 0 $0
Aggregated Statistics For Year 2007(Based on 4 full and 4 partial tracts) A) FHA, FSA/RHS & VA B) Conventional C) Refinancings D) Home Improvement Loans E) Loans on Dwellings For 5+ Families F) Non-occupant Loans on G) Loans On Manufactured Number Average Value Number Average Value Number Average Value Number Average Value Number Average Value Number Average Value Number Average Value
LOANS ORIGINATED 4 $311,578 275 $278,135 561 $302,779 69 $215,555 8 $519,227 77 $333,275 8 $66,388 APPLICATIONS APPROVED, NOT ACCEPTED 0 $0 66 $275,225 168 $334,020 15 $178,228 0 $0 11 $346,225 8 $69,345 APPLICATIONS DENIED 4 $365,900 140 $291,336 428 $346,340 84 $210,069 0 $0 20 $280,739 7 $133,776 APPLICATIONS WITHDRAWN 0 $0 34 $337,712 177 $338,348 13 $159,431 2 $648,115 9 $301,942 0 $0 FILES CLOSED FOR INCOMPLETENESS 0 $0 18 $302,633 55 $418,948 14 $224,464 0 $0 2 $595,270 0 $0
Aggregated Statistics For Year 2006(Based on 4 full and 4 partial tracts) B) Conventional C) Refinancings D) Home Improvement Loans E) Loans on Dwellings For 5+ Families F) Non-occupant Loans on G) Loans On Manufactured Number Average Value Number Average Value Number Average Value Number Average Value Number Average Value Number Average Value
LOANS ORIGINATED 643 $279,281 821 $317,614 113 $161,560 13 $7,408,065 133 $340,322 9 $54,658 APPLICATIONS APPROVED, NOT ACCEPTED 133 $269,617 209 $318,771 20 $292,322 0 $0 38 $345,564 4 $95,715 APPLICATIONS DENIED 333 $296,798 426 $325,690 62 $177,507 0 $0 40 $415,601 2 $115,650 APPLICATIONS WITHDRAWN 142 $287,642 245 $325,459 16 $275,809 0 $0 25 $304,502 0 $0 FILES CLOSED FOR INCOMPLETENESS 44 $326,726 69 $344,210 6 $381,208 0 $0 1 $499,820 0 $0
Aggregated Statistics For Year 2005(Based on 4 full and 4 partial tracts) B) Conventional C) Refinancings D) Home Improvement Loans E) Loans on Dwellings For 5+ Families F) Non-occupant Loans on G) Loans On Manufactured Number Average Value Number Average Value Number Average Value Number Average Value Number Average Value Number Average Value
LOANS ORIGINATED 766 $279,764 926 $283,678 136 $191,729 8 $1,790,482 169 $280,965 7 $116,363 APPLICATIONS APPROVED, NOT ACCEPTED 226 $269,819 220 $293,014 34 $210,872 0 $0 49 $364,974 16 $86,458 APPLICATIONS DENIED 309 $279,375 341 $331,903 64 $184,004 2 $1,246,375 44 $326,717 15 $87,671 APPLICATIONS WITHDRAWN 184 $253,222 334 $304,225 42 $186,283 0 $0 43 $281,839 4 $71,370 FILES CLOSED FOR INCOMPLETENESS 54 $269,861 69 $353,423 15 $215,957 0 $0 11 $286,204 0 $0
Aggregated Statistics For Year 2004(Based on 4 full and 4 partial tracts) A) FHA, FSA/RHS & VA B) Conventional C) Refinancings D) Home Improvement Loans E) Loans on Dwellings For 5+ Families F) Non-occupant Loans on G) Loans On Manufactured Number Average Value Number Average Value Number Average Value Number Average Value Number Average Value Number Average Value Number Average Value
LOANS ORIGINATED 8 $258,249 766 $248,323 1,251 $236,601 149 $175,611 16 $4,770,114 209 $285,773 3 $62,000 APPLICATIONS APPROVED, NOT ACCEPTED 2 $172,480 193 $248,641 254 $243,158 16 $141,256 0 $0 42 $250,543 8 $60,152 APPLICATIONS DENIED 0 $0 187 $256,076 382 $261,428 68 $146,036 0 $0 47 $298,790 15 $46,260 APPLICATIONS WITHDRAWN 0 $0 123 $267,522 333 $233,563 47 $121,609 0 $0 30 $231,401 2 $54,445 FILES CLOSED FOR INCOMPLETENESS 1 $260,220 41 $202,021 123 $248,341 0 $0 0 $0 8 $343,909 0 $0
Aggregated Statistics For Year 2003(Based on 4 full and 4 partial tracts) A) FHA, FSA/RHS & VA B) Conventional C) Refinancings D) Home Improvement Loans E) Loans on Dwellings For 5+ Families F) Non-occupant Loans on Number Average Value Number Average Value Number Average Value Number Average Value Number Average Value Number Average Value
LOANS ORIGINATED 24 $225,238 737 $208,663 2,350 $181,114 36 $46,671 22 $1,656,947 264 $206,476 APPLICATIONS APPROVED, NOT ACCEPTED 2 $281,180 153 $208,893 442 $191,329 17 $64,864 0 $0 72 $214,431 APPLICATIONS DENIED 4 $268,208 194 $202,616 524 $196,352 42 $58,406 0 $0 50 $195,504 APPLICATIONS WITHDRAWN 1 $172,620 117 $205,661 492 $172,729 26 $86,315 2 $3,489,850 41 $214,245 FILES CLOSED FOR INCOMPLETENESS 2 $221,335 25 $271,591 99 $203,993 5 $29,294 2 $3,813,905 5 $244,462
Aggregated Statistics For Year 2002(Based on 4 full and 4 partial tracts) A) FHA, FSA/RHS & VA B) Conventional C) Refinancings D) Home Improvement Loans E) Loans on Dwellings For 5+ Families F) Non-occupant Loans on Number Average Value Number Average Value Number Average Value Number Average Value Number Average Value Number Average Value
LOANS ORIGINATED 63 $203,351 586 $175,179 1,521 $161,084 23 $37,818 18 $1,969,116 154 $179,472 APPLICATIONS APPROVED, NOT ACCEPTED 6 $168,472 143 $180,854 305 $163,398 5 $56,686 0 $0 38 $154,410 APPLICATIONS DENIED 8 $175,000 147 $169,805 378 $159,342 38 $40,059 4 $705,378 29 $172,199 APPLICATIONS WITHDRAWN 11 $205,534 75 $195,109 352 $166,933 13 $64,350 2 $3,085,160 32 $226,821 FILES CLOSED FOR INCOMPLETENESS 2 $135,205 41 $179,630 115 $172,505 1 $128,820 6 $2,293,310 20 $185,376
Aggregated Statistics For Year 2001(Based on 4 full and 4 partial tracts) A) FHA, FSA/RHS & VA B) Conventional C) Refinancings D) Home Improvement Loans E) Loans on Dwellings For 5+ Families F) Non-occupant Loans on Number Average Value Number Average Value Number Average Value Number Average Value Number Average Value Number Average Value
LOANS ORIGINATED 93 $169,523 557 $158,095 1,241 $152,749 52 $29,733 13 $2,498,418 139 $178,913 APPLICATIONS APPROVED, NOT ACCEPTED 6 $193,265 125 $168,222 203 $143,288 13 $32,405 0 $0 28 $169,537 APPLICATIONS DENIED 3 $236,913 124 $143,071 414 $142,516 61 $26,613 0 $0 16 $235,557 APPLICATIONS WITHDRAWN 8 $151,740 67 $132,007 332 $142,025 23 $33,356 0 $0 25 $166,124 FILES CLOSED FOR INCOMPLETENESS 0 $0 36 $153,186 61 $131,829 0 $0 4 $1,645,215 2 $90,740
Aggregated Statistics For Year 2000(Based on 4 full and 4 partial tracts) A) FHA, FSA/RHS & VA B) Conventional C) Refinancings D) Home Improvement Loans E) Loans on Dwellings For 5+ Families F) Non-occupant Loans on Number Average Value Number Average Value Number Average Value Number Average Value Number Average Value Number Average Value
LOANS ORIGINATED 101 $148,517 501 $141,545 264 $115,195 57 $27,954 8 $484,159 35 $142,899 APPLICATIONS APPROVED, NOT ACCEPTED 2 $107,980 82 $130,279 70 $94,896 31 $39,694 0 $0 4 $137,095 APPLICATIONS DENIED 24 $166,283 126 $146,274 203 $107,740 40 $40,186 0 $0 18 $90,794 APPLICATIONS WITHDRAWN 7 $175,640 55 $140,753 86 $85,584 4 $31,408 2 $1,326,145 2 $199,400 FILES CLOSED FOR INCOMPLETENESS 2 $169,505 18 $116,487 36 $135,285 7 $56,753 5 $1,570,460 2 $199,400
Aggregated Statistics For Year 1999(Based on 2 full and 2 partial tracts) A) FHA, FSA/RHS & VA B) Conventional C) Refinancings D) Home Improvement Loans E) Loans on Dwellings For 5+ Families F) Non-occupant Loans on Number Average Value Number Average Value Number Average Value Number Average Value Number Average Value Number Average Value
LOANS ORIGINATED 53 $153,421 215 $123,281 274 $119,791 31 $29,641 3 $539,370 45 $113,154 APPLICATIONS APPROVED, NOT ACCEPTED 4 $144,380 34 $110,181 57 $117,120 13 $23,396 0 $0 7 $156,180 APPLICATIONS DENIED 8 $147,235 44 $104,297 122 $103,581 23 $25,937 0 $0 13 $105,936 APPLICATIONS WITHDRAWN 8 $141,279 53 $134,727 99 $102,957 2 $36,545 3 $715,747 10 $148,308 FILES CLOSED FOR INCOMPLETENESS 0 $0 13 $125,014 33 $128,569 2 $75,250 0 $0 1 $75,510
Detailed HMDA statistics for the following Tracts:
0887.02
,
0888.01 ,
0888.02 ,
0889.01
Private Mortgage Insurance Companies Aggregated Statistics For Year 2009(Based on 4 full and 4 partial tracts) A) Conventional B) Refinancings Number Average Value Number Average Value
LOANS ORIGINATED 7 $278,934 4 $180,965 APPLICATIONS APPROVED, NOT ACCEPTED 3 $341,490 1 $521,720 APPLICATIONS DENIED 0 $0 4 $264,960 APPLICATIONS WITHDRAWN 2 $179,480 4 $180,965 FILES CLOSED FOR INCOMPLETENESS 2 $354,970 0 $0
Aggregated Statistics For Year 2008(Based on 4 full and 4 partial tracts) A) Conventional B) Refinancings C) Non-occupant Loans on Number Average Value Number Average Value Number Average Value
LOANS ORIGINATED 43 $288,300 16 $321,099 3 $278,413 APPLICATIONS APPROVED, NOT ACCEPTED 16 $352,434 21 $379,273 4 $353,452 APPLICATIONS DENIED 2 $229,335 3 $485,893 0 $0 APPLICATIONS WITHDRAWN 3 $282,410 0 $0 2 $159,535 FILES CLOSED FOR INCOMPLETENESS 2 $332,000 0 $0 2 $332,000
Aggregated Statistics For Year 2007(Based on 4 full and 4 partial tracts) A) Conventional B) Refinancings C) Non-occupant Loans on Number Average Value Number Average Value Number Average Value
LOANS ORIGINATED 11 $357,210 22 $418,816 0 $0 APPLICATIONS APPROVED, NOT ACCEPTED 6 $364,193 7 $456,861 0 $0 APPLICATIONS DENIED 2 $359,330 5 $616,226 2 $684,940 APPLICATIONS WITHDRAWN 0 $0 7 $390,947 0 $0 FILES CLOSED FOR INCOMPLETENESS 0 $0 2 $325,055 0 $0
Aggregated Statistics For Year 2006(Based on 4 full and 4 partial tracts) A) Conventional B) Refinancings Number Average Value Number Average Value
LOANS ORIGINATED 8 $376,330 15 $381,846 APPLICATIONS APPROVED, NOT ACCEPTED 2 $362,960 5 $380,604 APPLICATIONS DENIED 0 $0 0 $0 APPLICATIONS WITHDRAWN 0 $0 2 $376,905 FILES CLOSED FOR INCOMPLETENESS 0 $0 0 $0
Aggregated Statistics For Year 2005(Based on 4 full and 4 partial tracts) A) Conventional B) Refinancings C) Non-occupant Loans on Number Average Value Number Average Value Number Average Value
LOANS ORIGINATED 12 $373,025 12 $350,467 1 $447,010 APPLICATIONS APPROVED, NOT ACCEPTED 11 $334,847 2 $166,500 0 $0 APPLICATIONS DENIED 2 $363,940 2 $322,030 0 $0 APPLICATIONS WITHDRAWN 2 $561,365 0 $0 0 $0 FILES CLOSED FOR INCOMPLETENESS 0 $0 0 $0 0 $0
Aggregated Statistics For Year 2004(Based on 4 full and 4 partial tracts) A) Conventional B) Refinancings C) Non-occupant Loans on Number Average Value Number Average Value Number Average Value
LOANS ORIGINATED 53 $314,842 13 $250,813 7 $335,133 APPLICATIONS APPROVED, NOT ACCEPTED 19 $271,214 12 $216,397 6 $224,523 APPLICATIONS DENIED 0 $0 0 $0 0 $0 APPLICATIONS WITHDRAWN 2 $426,715 0 $0 2 $426,715 FILES CLOSED FOR INCOMPLETENESS 0 $0 2 $407,425 0 $0
Aggregated Statistics For Year 2003(Based on 4 full and 4 partial tracts) A) Conventional B) Refinancings Number Average Value Number Average Value
LOANS ORIGINATED 78 $254,504 39 $240,331 APPLICATIONS APPROVED, NOT ACCEPTED 24 $247,826 23 $238,300 APPLICATIONS DENIED 0 $0 4 $230,828 APPLICATIONS WITHDRAWN 9 $243,017 0 $0 FILES CLOSED FOR INCOMPLETENESS 0 $0 0 $0
Aggregated Statistics For Year 2002(Based on 4 full and 4 partial tracts) A) Conventional B) Refinancings C) Non-occupant Loans on Number Average Value Number Average Value Number Average Value
LOANS ORIGINATED 113 $216,309 63 $192,351 9 $171,719 APPLICATIONS APPROVED, NOT ACCEPTED 47 $203,272 31 $194,168 13 $198,715 APPLICATIONS DENIED 4 $213,708 1 $347,810 0 $0 APPLICATIONS WITHDRAWN 4 $187,475 6 $151,553 0 $0 FILES CLOSED FOR INCOMPLETENESS 2 $152,555 0 $0 0 $0
Aggregated Statistics For Year 2001(Based on 4 full and 4 partial tracts) A) Conventional B) Refinancings C) Non-occupant Loans on Number Average Value Number Average Value Number Average Value
LOANS ORIGINATED 151 $189,898 78 $180,034 7 $171,519 APPLICATIONS APPROVED, NOT ACCEPTED 46 $197,126 14 $165,184 4 $163,660 APPLICATIONS DENIED 12 $210,199 2 $146,090 0 $0 APPLICATIONS WITHDRAWN 4 $184,130 11 $166,631 0 $0 FILES CLOSED FOR INCOMPLETENESS 0 $0 0 $0 0 $0
Aggregated Statistics For Year 2000(Based on 4 full and 4 partial tracts) A) Conventional B) Refinancings C) Non-occupant Loans on Number Average Value Number Average Value Number Average Value
LOANS ORIGINATED 165 $163,639 28 $166,502 6 $129,020 APPLICATIONS APPROVED, NOT ACCEPTED 44 $155,908 5 $133,202 0 $0 APPLICATIONS DENIED 6 $189,370 7 $150,359 1 $144,280 APPLICATIONS WITHDRAWN 9 $166,870 0 $0 0 $0 FILES CLOSED FOR INCOMPLETENESS 2 $92,720 0 $0 0 $0
Aggregated Statistics For Year 1999(Based on 2 full and 2 partial tracts) A) Conventional B) Refinancings C) Non-occupant Loans on Number Average Value Number Average Value Number Average Value
LOANS ORIGINATED 77 $138,116 40 $145,137 1 $46,200 APPLICATIONS APPROVED, NOT ACCEPTED 12 $124,349 11 $155,521 0 $0 APPLICATIONS DENIED 10 $126,078 1 $173,580 1 $86,500 APPLICATIONS WITHDRAWN 7 $153,114 1 $153,690 1 $48,860 FILES CLOSED FOR INCOMPLETENESS 0 $0 1 $99,500 0 $0
Detailed PMIC statistics for the following Tracts:
0887.02
,
0888.01 ,
0888.02 ,
0889.01
2005 - 2018 National Fire Incident Reporting System (NFIRS) incidents See full 2006 National Fire Incident Reporting System statistics for zip code 92844, California
Most common first names in zip code 92844 among deceased individuals Name Count Lived (average)
John 21 72.1 years James 16 72.1 years Mary 15 79.1 years Kenneth 9 74.9 years William 8 81.9 years Elizabeth 8 73.2 years Margaret 7 79.9 years Thanh 7 73.9 years Barbara 7 73.3 years George 7 72.4 years
Most common last names in zip code 92844 among deceased individuals Last name Count Lived (average)
Nguyen 69 73.0 years Tran 20 72.9 years Le 14 68.6 years Pham 14 79.4 years Kim 11 77.0 years Lee 8 76.4 years Vu 8 69.6 years Hoang 7 76.9 years Truong 7 72.7 years Ho 6 78.5 years
Businesses in zip code 92844
Name Count Name Count
99 Cents Only Stores 1 SAS Shoes 1 KFC 1 Starbucks 1 McDonald's 1 Taco Bell 2 Nissan 1 Toyota 1 Ramada 1 UPS 1
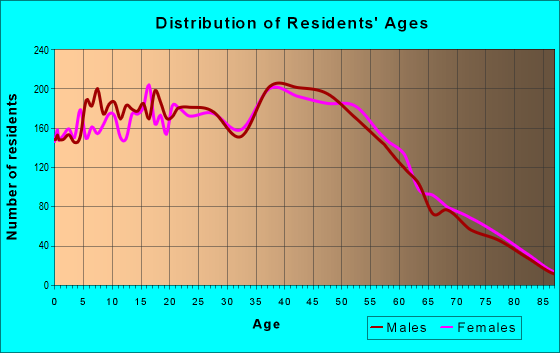
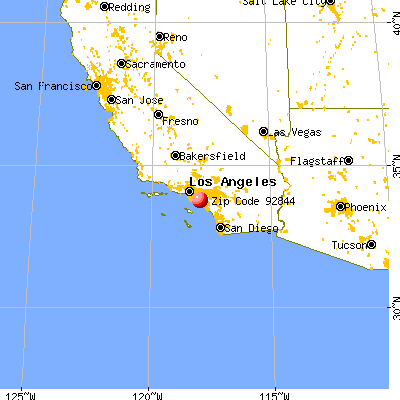


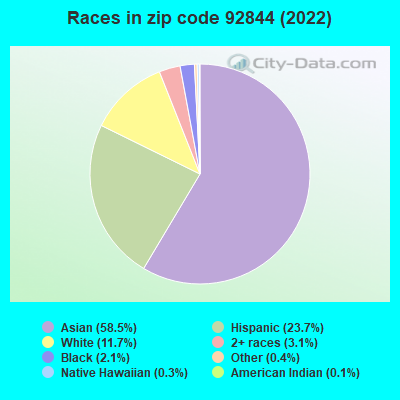


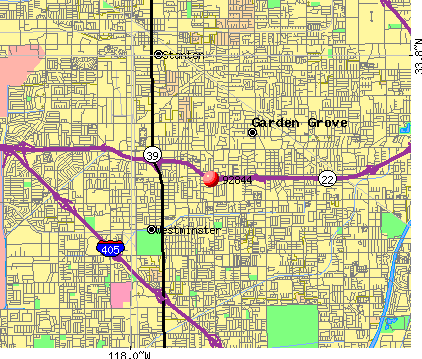 Nearest zip codes: 92841, 92655, 92683, 92843, 92840, 90680.
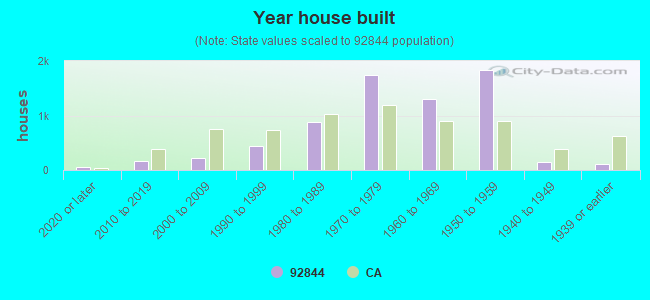

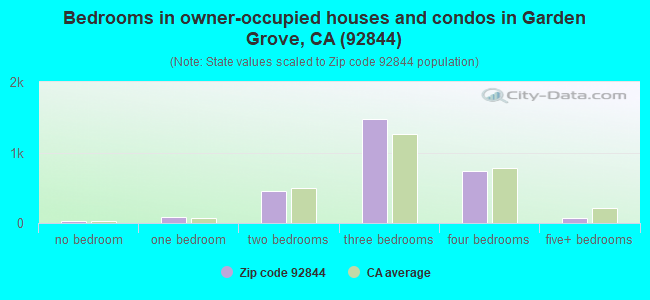
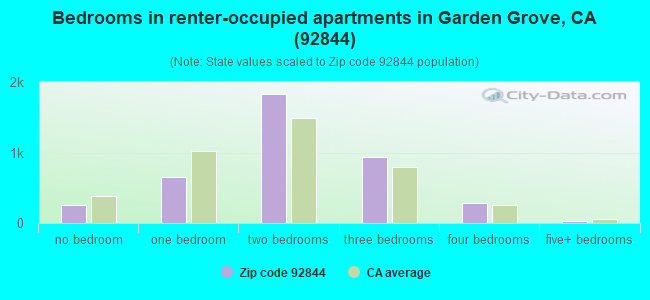
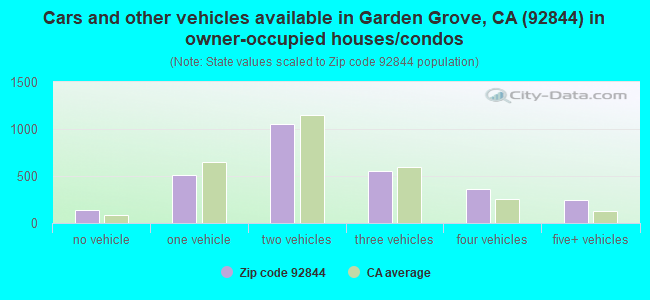
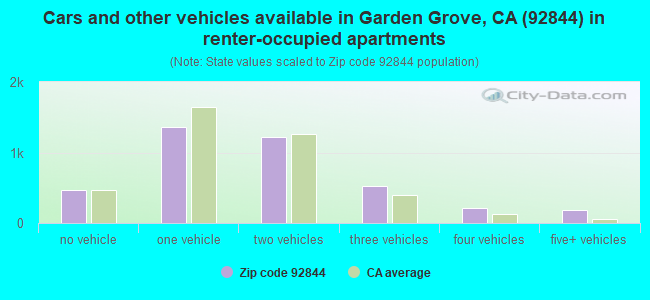


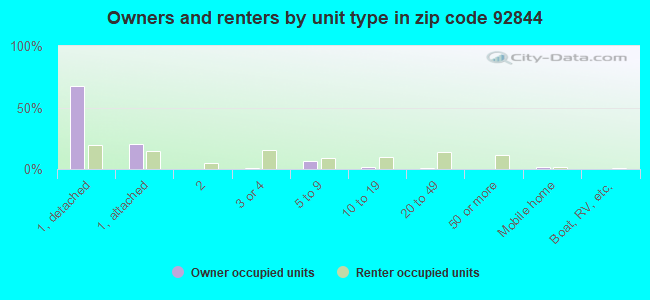
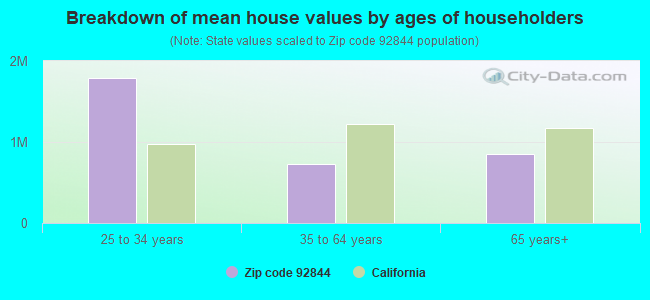


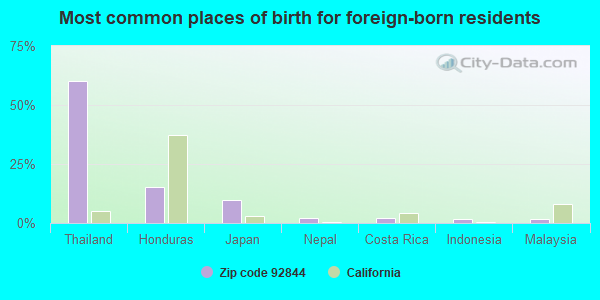
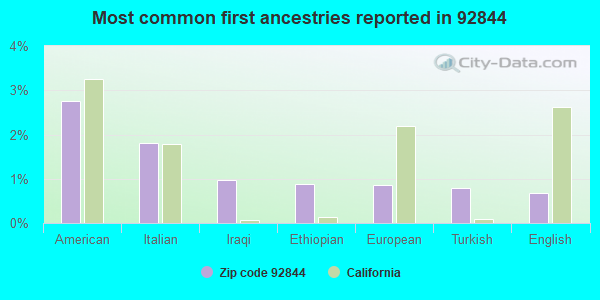
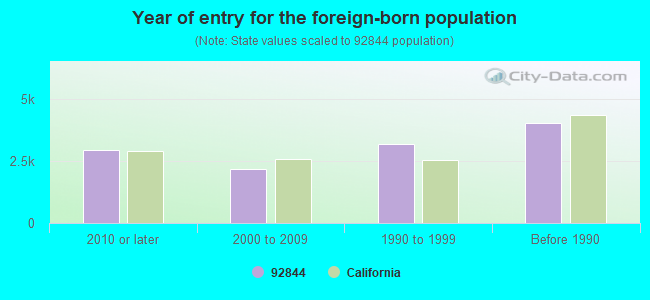
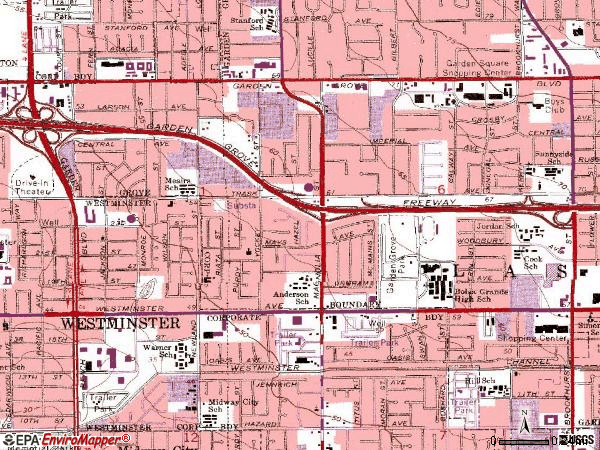

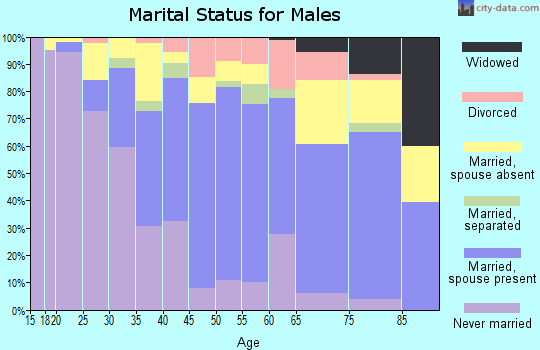
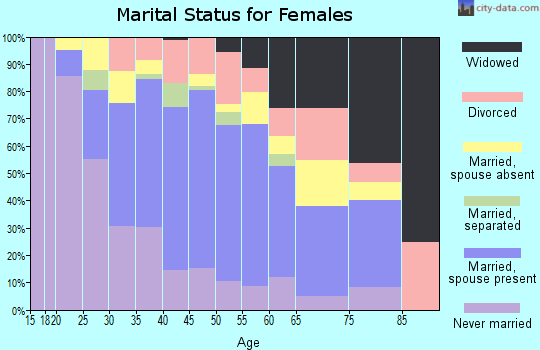
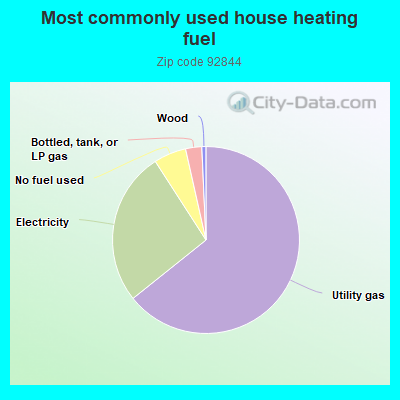
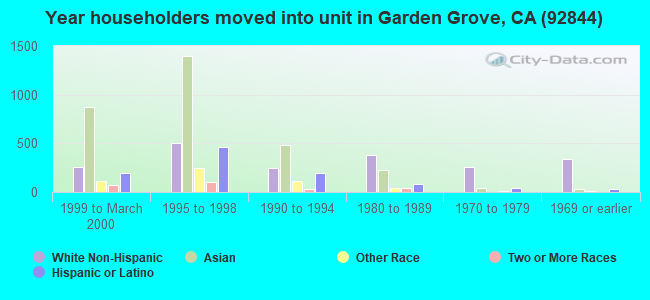
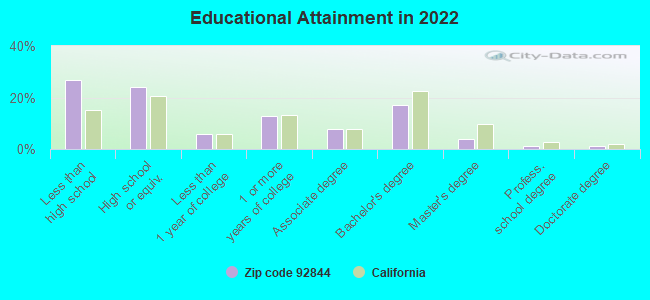
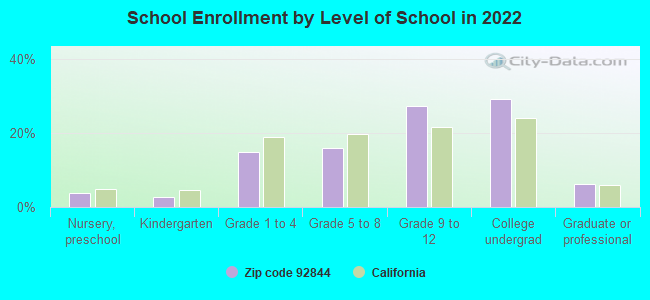
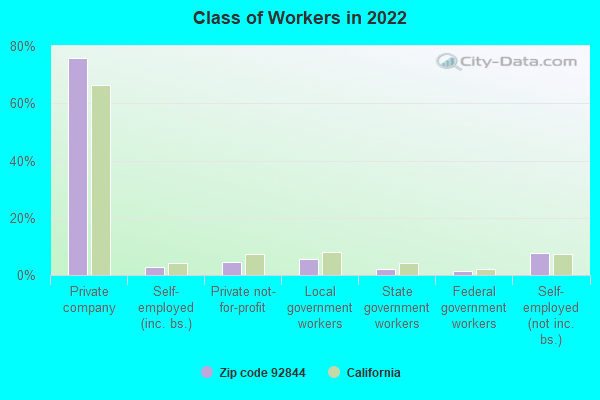
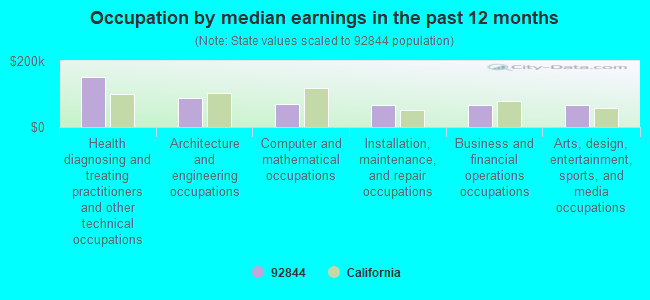
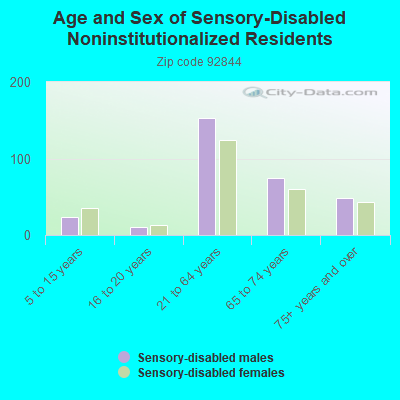
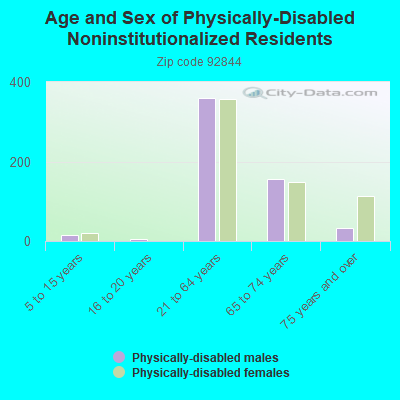
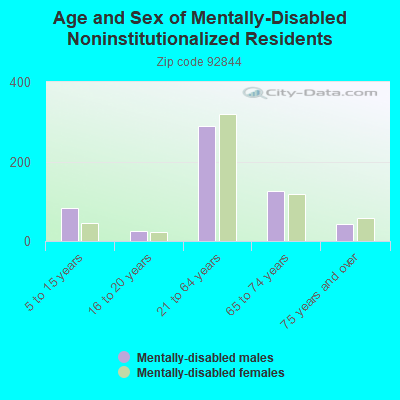
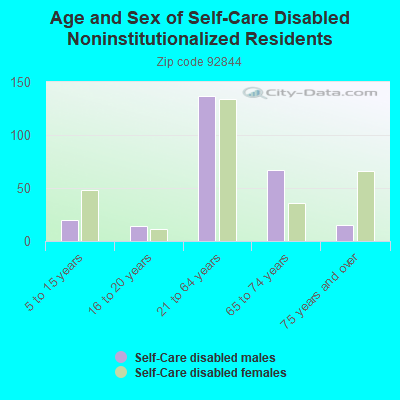
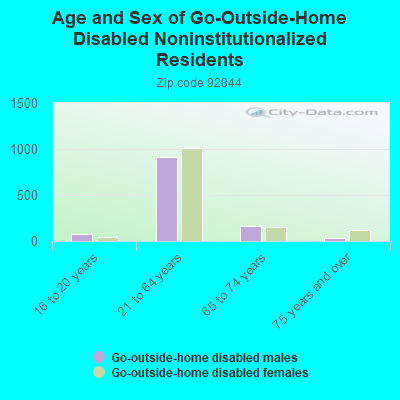
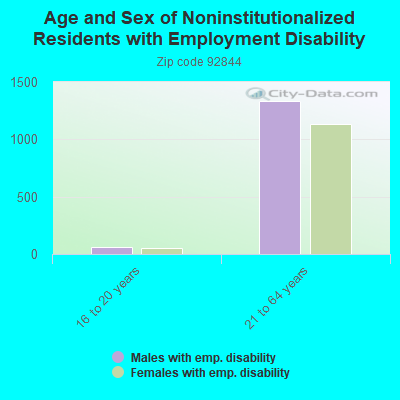
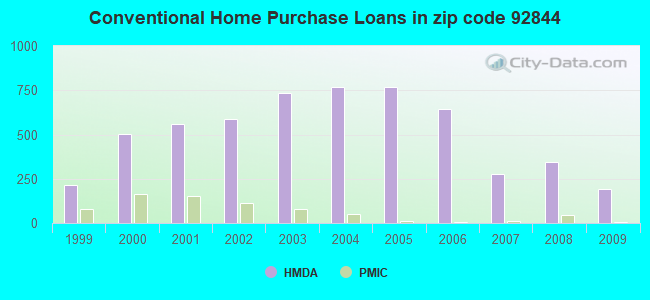
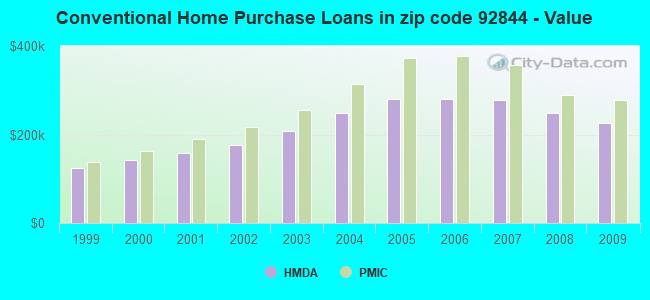
 According to the data from the years 2005 - 2018 the average number of fire incidents per year is 19. The highest number of fire incidents - 36 took place in 2005, and the least - 0 in 2014. The data has a declining trend.
 When looking into fire subcategories, the most incidents belonged to: Outside Fires (36.3%), and Mobile Property/Vehicle Fires (25.5%).