Downtown neighborhood in Huntington Beach, California (CA), 92648 detailed profile
Settings
X

Business Search - 14 Million verified businesses
Area: 0.356 square miles
Population: 1,130
Population density:
| Downtown: | 3,178 people per square mile |
| Huntington Beach: | 7,362 people per square mile |

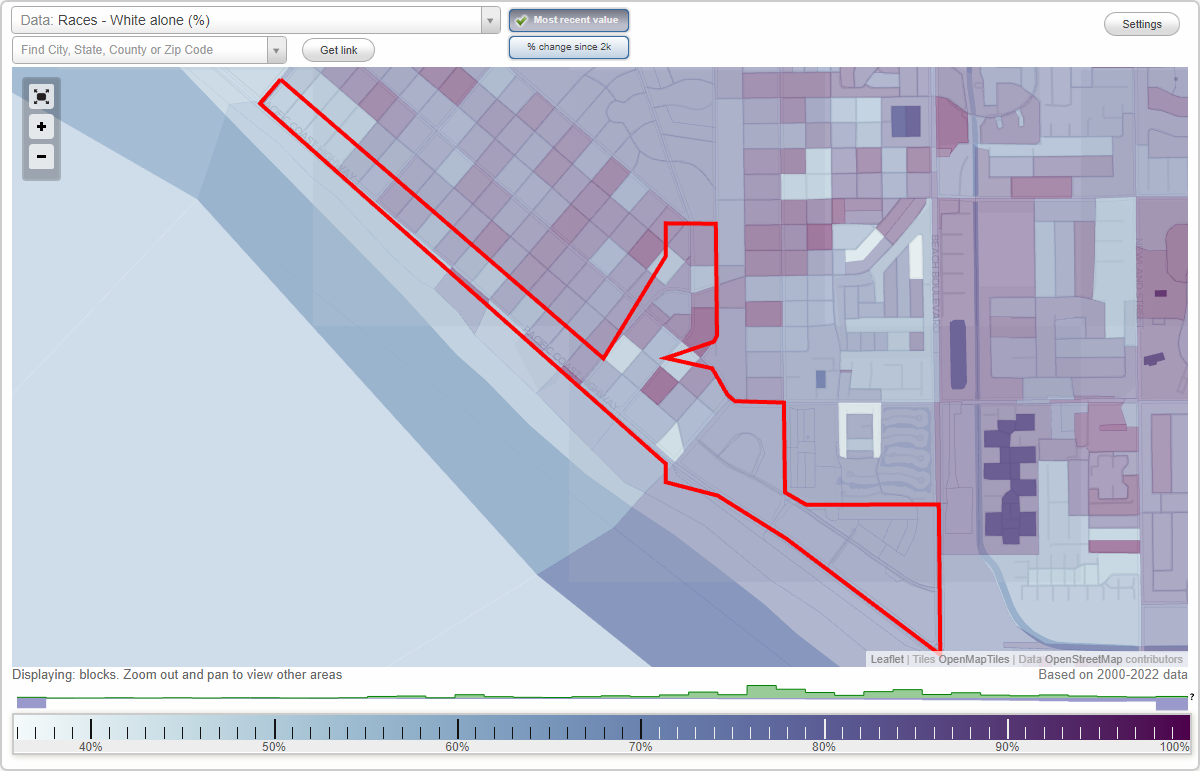
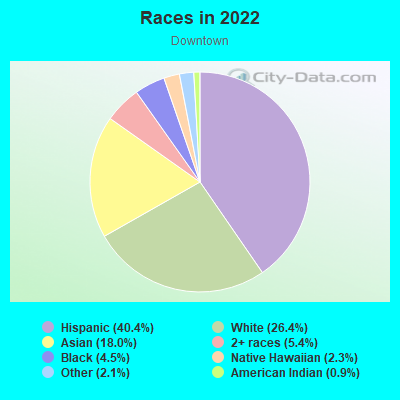
- 81059.8%White
- 22316.5%Native Hawaiian and Other
Pacific Islander - 17112.6%Hispanic or Latino
- 765.6%Asian
- 634.6%Two or more races
- 80.6%Black
- 40.3%Some other race
Median household income in 2022:
| Downtown: | $152,066 |
| Huntington Beach: | $111,122 |
Distribution of median household income
![Distribution of median household income]()
- 12Less than $10,000
- 19$10,000 to $19,999
- 13$20,000 to $29,999
- 69$30,000 to $39,999
- 36$40,000 to $49,999
- 18$50,000 to $59,999
- 32$60,000 to $74,999
- 67$75,000 to $99,999
- 129$100,000 to $124,999
- 35$125,000 to $149,999
- 93$150,000 to $199,999
- 124$200,000 or more

Distribution of owner-occupied house/condo value
![Distribution of owner-occupied house/condo value]()
- 40Less than $50,000
- 32$50,000 to $99,999
- 2$100,000 to $149,999
- 1$150,000 to $199,999
- 2$200,000 to $249,999
- 2$250,000 to $299,999
- 19$400,000 to $499,999
- 23$500,000 to $749,999
- 29$750,000 to $999,999
- 264$1,000,000 or more

Distribution of rent paid by renters
![Distribution of rent paid by renters]()
- 179$500 to $599
- 5$600 to $699
- 2$700 to $799
- 25$800 to $899
- 19$1,000 to $1,249
- 1$1,250 to $1,499
- 68$1,500 to $1,999
- 275$2,000 or more

Median rent in 2022:
| Downtown: | $2,628 |
| Huntington Beach: | $2,001 |
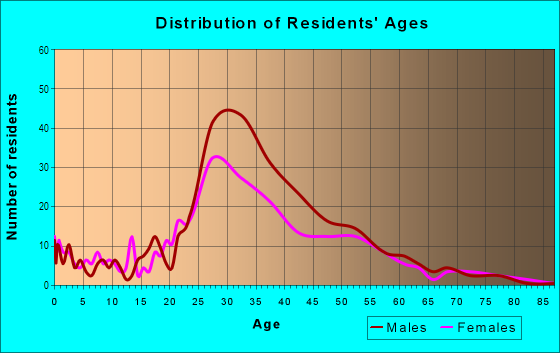
| Males: | 654 |
| Females: | 475 |
Males:
| This neighborhood: | 50.1 years |
| Whole city: | 43.6 years |
| This neighborhood: | 45.7 years |
| Whole city: | 44.2 years |
Average household size:
| Downtown: | 6.8 people |
| Huntington Beach: | 2.5 people |
Percentage of family households:
| Downtown: | 24.8% |
| Huntington Beach: | 42.1% |
| Here: | 28.8% |
| Huntington Beach: | 47.5% |
Percentage of married-couple families with children (among all households):
| Downtown: | 20.2% |
| Huntington Beach: | 31.5% |
Percentage of single-mother households (among all households):
| Downtown: | 27.3% |
| Huntington Beach: | 5.7% |
Percentage of never married males 15 years old and over:
Percentage of never married females 15 years old and over:
| Downtown: | 26.5% |
| Huntington Beach: | 18.9% |
Percentage of never married females 15 years old and over:
| Downtown: | 13.7% |
| city: | 16.3% |
Percentage of people that speak English not well or not at all:
| Downtown: | 0.2% |
| Huntington Beach: | 4.1% |
Percentage of people born in this state:
Percentage of people born in another U.S. state:
Percentage of native residents but born outside the U.S.:
Percentage of foreign born residents:
| Here: | 54.5% |
| Huntington Beach: | 57.7% |
Percentage of people born in another U.S. state:
| Downtown: | 31.8% |
| Huntington Beach: | 22.8% |
Percentage of native residents but born outside the U.S.:
| Here: | 0.7% |
| city: | 1.5% |
Percentage of foreign born residents:
| Here: | 13.0% |
| Huntington Beach: | 18.0% |
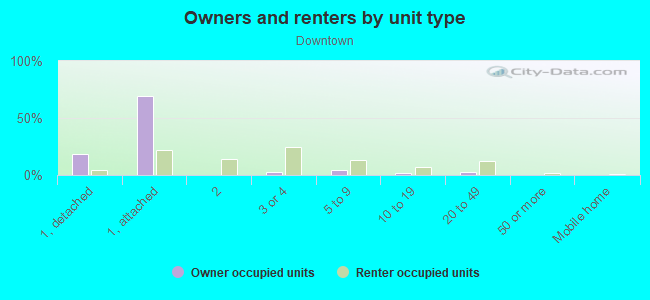
Owner-occupied
Renter-occupied

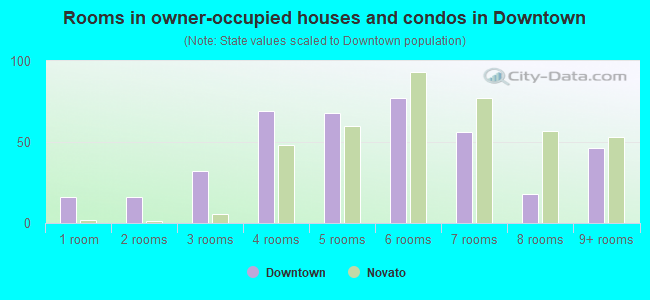
- Rooms in owner-occupied houses and condos in Downtown
- 01 room
- 522 rooms
- 53 rooms
- 294 rooms
- 615 rooms
- 386 rooms
- 507 rooms
- 138 rooms
- 169+ rooms
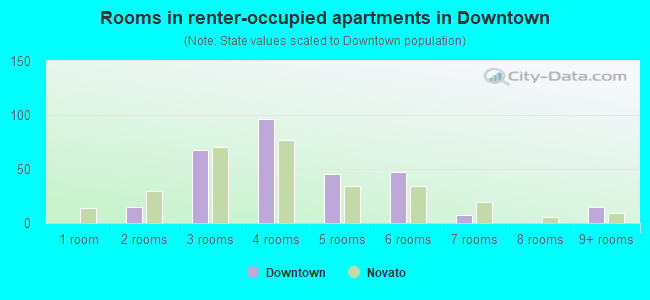
- Rooms in renter-occupied apartments in Downtown
- 471 room
- 332 rooms
- 813 rooms
- 1584 rooms
- 295 rooms
- 306 rooms
- 07 rooms
- 08 rooms
- 29+ rooms
Owner-occupied
Renter-occupied
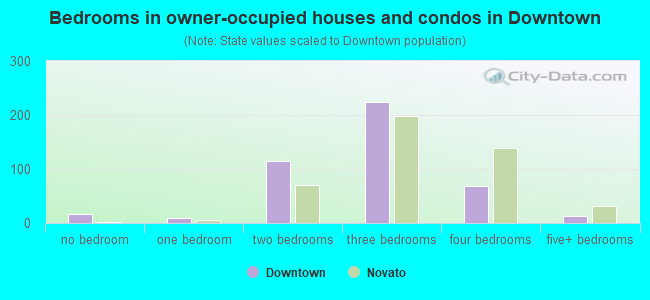
- Bedrooms in owner-occupied houses and condos in Downtown
- 0no bedroom
- 521 bedroom
- 452 bedrooms
- 1263 bedrooms
- 684 bedrooms
- 985+ bedrooms
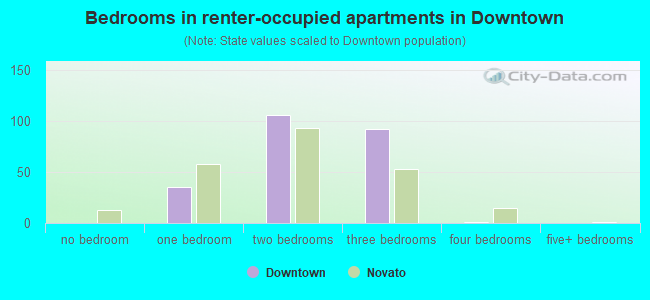
- Bedrooms in renter-occupied apartments in Downtown
- 47no bedroom
- 1491 bedroom
- 1562 bedrooms
- 113 bedrooms
- 714 bedrooms
- 05+ bedrooms
Average number of cars or other vehicles available in houses/condos:
Average number of cars or other vehicles available in apartments:
| This neighborhood: | 2.0 |
| Huntington Beach: | 2.1 |
Average number of cars or other vehicles available in apartments:
| Here: | 1.4 |
| city: | 1.8 |
Percentage of units with a mortgage:
| Downtown: | 69.4% |
| Huntington Beach: | 63.1% |
Housing prices:
- Average estimated value of detached houses in 2022 (32.0% of all units):
Downtown: $1,793,658 Huntington Beach: $1,395,007
- Average estimated value of townhouses or other attached units in 2022 (13.8% of all units):
This neighborhood: $911,929 city: $1,007,080
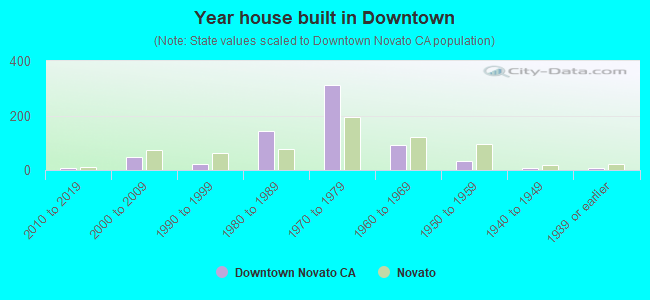
- Year house built in Downtown
- 162020 or later
- 132010 to 2019
- 352000 to 2009
- 1581990 to 1999
- 2031980 to 1989
- 931970 to 1979
- 921960 to 1969
- 321950 to 1959
- 501940 to 1949
- 1361939 or earlier
City-data.com crime index for city in 2020 (higher means more crime):
| City: | 172.8 |
| U.S. average: | 219.5 |
Travel time to work (commute)
![Travel time to work (commute)]()
- 19Less than 5 minutes
- 65 to 9 minutes
- 6010 to 14 minutes
- 4215 to 19 minutes
- 5020 to 24 minutes
- 3225 to 29 minutes
- 10830 to 34 minutes
- 3235 to 39 minutes
- 2640 to 44 minutes
- 4345 to 59 minutes
- 5160 to 89 minutes
- 1590 or more minutes

Means of transportation to work
![Means of transportation to work]()
- 67.7%426Drove a car alone
- 0.5%3Carpooled
- 1.9%12Walked
- 1.4%9Other means
- 29.2%184Worked at home

Time leaving home to go to work
![Time leaving home to go to work]()
- 1212:00 a.m. to 4:59 a.m.
- 285:00 a.m. to 5:29 a.m.
- 275:30 a.m. to 5:59 a.m.
- 466:00 a.m. to 6:29 a.m.
- 746:30 a.m. to 6:59 a.m.
- 1017:00 a.m. to 7:29 a.m.
- 457:30 a.m. to 7:59 a.m.
- 488:00 a.m. to 8:29 a.m.
- 518:30 a.m. to 8:59 a.m.
- 169:00 a.m. to 9:59 a.m.
- 2810:00 a.m. to 10:59 a.m.
- 511:00 a.m. to 11:59 a.m.
- 2312:00 p.m. to 3:59 p.m.
- 44:00 p.m. to 11:59 p.m.

Occupations of males:
- Percentage of males in management occupations (except farmers):
Here: 14.7% city: 17.0%
- Percentage of males in business and financial operations occupations:
Here: 8.3% city: 8.0%
- Percentage of males in computer and mathematical occupations:
Here: 4.4% city: 4.1%
- Percentage of males in architecture and engineering occupations:
Here: 2.9% city: 5.2%
- Percentage of males in education, training, and library occupations:
Here: 5.3% city: 4.0%
- Percentage of males in arts, design, entertainment, sports, and media occupations:
Here: 3.6% city: 3.2%
- Percentage of males in healthcare practitioners and technical occupations:
Here: 2.6% city: 4.2%
- Percentage of males in service occupations:
Here: 3.1% city: 13.4%
- Percentage of males in sales and office occupations:
Here: 32.9% city: 17.7%
- Percentage of males in production occupations:
Here: 8.9% city: 5.1%
- Percentage of males in transportation occupations:
Here: 7.6% city: 2.8%
- Percentage of males in material moving occupations:
Here: 1.7% city: 2.5%
Occupations of females:
- Percentage of females in management occupations (except farmers):
Here: 5.0% city: 12.6%
- Percentage of females in business and financial operations occupations:
Here: 6.6% city: 8.8%
- Percentage of females in computer and mathematical occupations:
Here: 1.4% city: 1.5%
- Percentage of females in architecture and engineering occupations:
Here: 3.5% city: 1.4%
- Percentage of females in life, physical, and social science occupations:
Here: 7.8% city: 1.1%
- Percentage of females in education, training, and library occupations:
Here: 8.1% city: 8.8%
- Percentage of females in arts, design, entertainment, sports, and media occupations:
Here: 1.8% city: 2.6%
- Percentage of females in healthcare practitioners and technical occupations:
Here: 3.0% city: 10.1%
- Percentage of females in service occupations:
Here: 6.0% city: 16.4%
- Percentage of females in sales and office occupations:
Here: 54.2% city: 25.5%
- Percentage of females in transportation occupations:
Here: 1.4% city: 0.5%
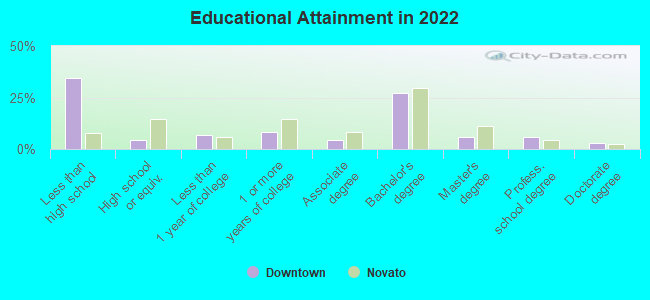
Education in this neighborhood (subdivision or community):
- Percentage of people 3 years and older in K-12 schools:
Downtown: 20.3% Huntington Beach: 13.1%
- Percentage of people 3 years and older in undergraduate colleges:
Downtown: 2.1% Huntington Beach: 5.8%
- Percentage of people 3 years and older in grad. or professional schools:
Downtown: 11.3% Huntington Beach: 1.2%
- Percentage of students K-12 enrolled in private schools:
Downtown: 184.1% Huntington Beach: 18.8%
Percentage of population below poverty level:
| Downtown: | 1.4% |
| Huntington Beach: | 7.0% |
Median year owner moved in (as recorded in 2022):
Median year renter moved in (as recorded in 2022):
| Downtown: | 2249 |
| Huntington Beach: | 2006 |
Median year renter moved in (as recorded in 2022):
| Downtown: | 2259 |
| Huntington Beach: | 2019 |
Percentage of married-couple families with both working:
| Downtown: | 124.3% |
| Huntington Beach: | 65.3% |

- 71.0%Utility gas
- 16.7%Electricity
- 4.8%No fuel used
- 2.9%Other fuel
- 2.5%Bottled, tank, or LP gas
- 1.2%Solar energy
- 0.9%Wood
Highways in this neighborhood:
State Hwy 1 (Pacific Coast Hwy)
Length: 2.41 miles
Direction: SE-NW
Address range: 508 to 21671
Direction: SE-NW
Address range: 508 to 21671
Roads and streets:
Walnut Ave
Length: 1.51 miles
Directions: N-S, SE-NW
Address range: 100 to 2283
Directions: N-S, SE-NW
Address range: 100 to 2283
Main St
Length: 0.49 miles
Directions: N-S, SW-NE
Address range: 100 to 623
Directions: N-S, SW-NE
Address range: 100 to 623
6th St
Length: 0.40 miles
Directions: E-W, SW-NE
Address range: 100 to 699
Directions: E-W, SW-NE
Address range: 100 to 699
Olive Ave
Length: 0.34 miles
Direction: SE-NW
Address range: 100 to 599
Direction: SE-NW
Address range: 100 to 599
5th St
Length: 0.29 miles
Direction: SW-NE
Address range: 100 to 499
Direction: SW-NE
Address range: 100 to 499
2nd St
Length: 0.25 miles
Direction: SW-NE
Address range: 100 to 399
Direction: SW-NE
Address range: 100 to 399
1st St
Length: 0.23 miles
Direction: SW-NE
Address range: 100 to 350
Direction: SW-NE
Address range: 100 to 350
Huntington St
Length: 0.21 miles
Directions: N-S, SW-NE
Address range: 1 to 78
Directions: N-S, SW-NE
Address range: 1 to 78
Tamarisk Rd
Length: 0.17 miles
Directions: N-S, SE-NW, SW-NE
Directions: N-S, SE-NW, SW-NE
Orange Ave
Length: 0.13 miles
Direction: SE-NW
Address range: 400 to 599
Direction: SE-NW
Address range: 400 to 599
Acacia Ave
Length: 0.10 miles
Directions: E-W, SE-NW
Address range: 500 to 648
Directions: E-W, SE-NW
Address range: 500 to 648
Pacific Ave
Length: 0.09 miles
Direction: SE-NW
Direction: SE-NW
8th St
Length: 0.09 miles
Direction: SW-NE
Address range: 100 to 199
Direction: SW-NE
Address range: 100 to 199
9th St
Length: 0.08 miles
Direction: SW-NE
Address range: 100 to 199
Direction: SW-NE
Address range: 100 to 199
7th St
Length: 0.08 miles
Direction: SW-NE
Address range: 100 to 199
Direction: SW-NE
Address range: 100 to 199
3rd St
Length: 0.08 miles
Direction: SW-NE
Address range: 200 to 299
Direction: SW-NE
Address range: 200 to 299
10th St
Length: 0.08 miles
Direction: SW-NE
Address range: 100 to 199
Direction: SW-NE
Address range: 100 to 199
16th St
Length: 0.08 miles
Direction: SW-NE
Address range: 100 to 199
Direction: SW-NE
Address range: 100 to 199
21st St
Length: 0.08 miles
Direction: SW-NE
Address range: 100 to 199
Direction: SW-NE
Address range: 100 to 199
11th St
Length: 0.08 miles
Direction: SW-NE
Address range: 100 to 199
Direction: SW-NE
Address range: 100 to 199
18th St
Length: 0.08 miles
Direction: SW-NE
Address range: 100 to 199
Direction: SW-NE
Address range: 100 to 199
17th St
Length: 0.08 miles
Direction: SW-NE
Address range: 100 to 199
Direction: SW-NE
Address range: 100 to 199
12th St
Length: 0.08 miles
Direction: SW-NE
Address range: 100 to 199
Direction: SW-NE
Address range: 100 to 199
19th St
Length: 0.08 miles
Direction: SW-NE
Address range: 100 to 199
Direction: SW-NE
Address range: 100 to 199
20th St
Length: 0.08 miles
Direction: SW-NE
Address range: 100 to 199
Direction: SW-NE
Address range: 100 to 199
22nd St
Length: 0.08 miles
Direction: SW-NE
Address range: 100 to 199
Direction: SW-NE
Address range: 100 to 199
13th St
Length: 0.08 miles
Direction: SW-NE
Address range: 100 to 199
Direction: SW-NE
Address range: 100 to 199
14th St
Length: 0.08 miles
Direction: SW-NE
Address range: 100 to 199
Direction: SW-NE
Address range: 100 to 199
15th St
Length: 0.08 miles
Direction: SW-NE
Address range: 100 to 199
Direction: SW-NE
Address range: 100 to 199
Pecan Ave
Length: 0.08 miles
Direction: E-W
Address range: 342 to 399
Direction: E-W
Address range: 342 to 399
Pierside Cir
Length: 0.06 miles
Direction: SE-NW
Address range: 500 to 599
Direction: SE-NW
Address range: 500 to 599
Townsquare Ln
Length: 0.06 miles
Direction: E-W
Address range: 410 to 499
Direction: E-W
Address range: 410 to 499
Atlanta Ave
Length: 0.05 miles
Direction: E-W
Address range: 100 to 199
Direction: E-W
Address range: 100 to 199
Lake St
Length: 0.05 miles
Direction: N-S
Address range: 521 to 599
Direction: N-S
Address range: 521 to 599
Railroad features:
Union Pacific RR
Length: 0.26 miles
Directions: E-W, N-S, SW-NE
Directions: E-W, N-S, SW-NE