Estimated zip code population in 2022: 49,753 Zip code population in 2010: 47,993 Zip code population in 2000: 47,334
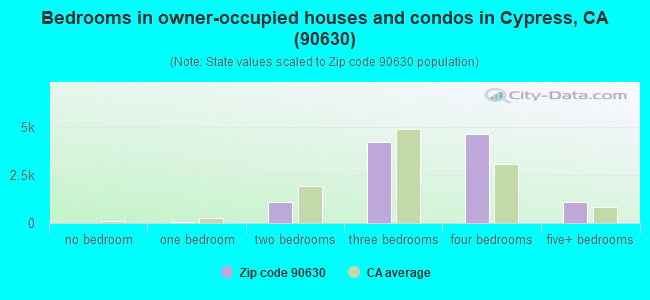
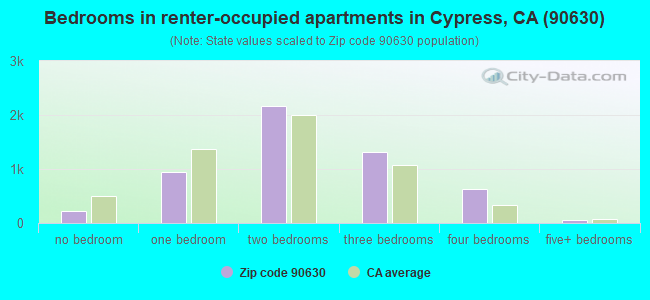
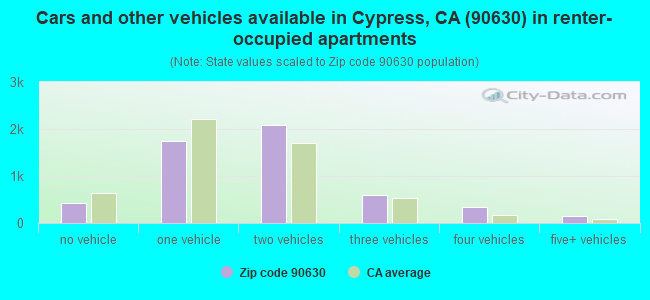
Houses and condos: 16,934 Renter-occupied apartments: 5,363
% of renters here:
33%
State:
44%
March 2022 cost of living index in zip code 90630: 87.2 (less than average, U.S. average is 100)
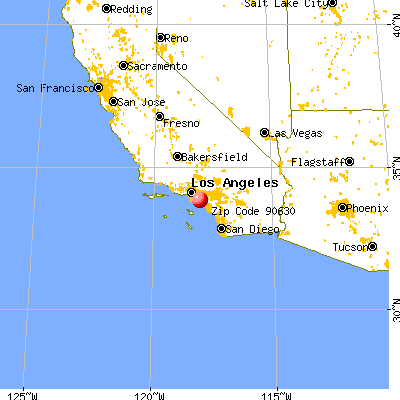
Land area: 6.1 sq. mi. Water area: 0.0 sq. mi.
Population density: 8,122 people per square mile
(high).
OSM Map
General Map
Google Map
MSN Map
OSM Map
General Map
Google Map
MSN Map
OSM Map
General Map
Google Map
MSN Map
OSM Map
General Map
Google Map
MSN Map
Please wait while loading the map...
Real estate property taxes paid for housing units in 2022:
This zip code:
0.6% ($5,575)
California:
0.7% ($4,831)
Median real estate property taxes paid for housing units with mortgages in 2022: $6,217 (0.7%) Median real estate property taxes paid for housing units with no mortgage in 2022: $3,654 (0.4%)
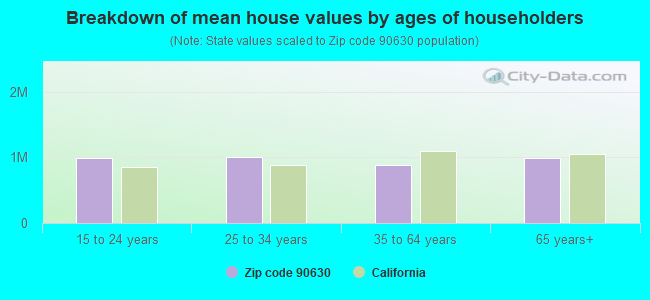
Estimated median house/condo value in 2022: $893,110
90630:
$893,110
California:
$715,900
According to our research of California and other state lists, there were 24 registered sex offenders living in 90630 zip code as of April 27, 2024. The ratio of all residents to sex offenders in zip code 90630 is 2,075 to 1. The ratio of registered sex offenders to all residents in this zip code is much lower than the state average.
Median resident age:
This zip code:
42.1 years
California median age:
37.9 years
Average household size:
This zip code:
3.0 people
California:
2.8 people
Averages for the 2020 tax year for zip code 90630, filed in 2021:
Average Adjusted Gross Income (AGI) in 2020: $85,222 (Individual Income Tax Returns)
Here:
$85,222
State:
$95,910
Salary/wage: $76,373 (reported on 79.9% of returns)
Here:
$76,373
State:
$77,331
(% of AGI for various income ranges: 1132.2% for AGIs below $25k, 3692.6% for AGIs $25k-50k, 7090.0% for AGIs $50k-75k, 10442.9% for AGIs $75k-100k, 20762.0% for AGIs $100k-200k, 76418.7% for AGIs over 200k)
Taxable interest for individuals: $1,456 (reported on 43.6% of returns)
This zip code:
$1,456
California:
$2,294
(% of AGI for various income ranges: 23.7% for AGIs below $25k, 41.3% for AGIs $25k-50k, 71.4% for AGIs $50k-75k, 104.3% for AGIs $75k-100k, 176.8% for AGIs $100k-200k, 889.3% for AGIs over 200k)
Ordinary dividends: $4,228 (reported on 24.2% of returns)
Here:
$4,228
State:
$10,949
(% of AGI for various income ranges: 24.1% for AGIs below $25k, 57.7% for AGIs $25k-50k, 75.7% for AGIs $50k-75k, 145.4% for AGIs $75k-100k, 259.4% for AGIs $100k-200k, 1891.1% for AGIs over 200k)
Net capital gain/loss in AGI: +$12,477 (reported on 23.7% of returns)
Here:
+$12,477
State:
+$49,306
(% of AGI for various income ranges: 15.5% for AGIs below $25k, 36.2% for AGIs $25k-50k, 96.9% for AGIs $50k-75k, 215.7% for AGIs $75k-100k, 526.2% for AGIs $100k-200k, 8540.3% for AGIs over 200k)
Profit/loss from business: +$10,821 (reported on 17.3% of returns)
Here:
+$10,821
State:
+$15,671
(% of AGI for various income ranges: 160.8% for AGIs below $25k, 185.5% for AGIs $25k-50k, 212.3% for AGIs $50k-75k, 233.2% for AGIs $75k-100k, 462.8% for AGIs $100k-200k, 2059.2% for AGIs over 200k)
Taxable individual retirement arrangement distribution: $21,897 (reported on 8.7% of returns)
90630:
$21,897
California:
$23,505
(% of AGI for various income ranges: 57.6% for AGIs below $25k, 120.2% for AGIs $25k-50k, 223.5% for AGIs $50k-75k, 375.0% for AGIs $75k-100k, 704.1% for AGIs $100k-200k, 1847.4% for AGIs over 200k)
Self-employed (Keogh) retirement plans: $25,350 (reported on 0.6% of returns)
90630:
$25,350
California:
$30,163
(% of AGI for various income ranges: 16.3% for AGIs $50k-75k, 36.2% for AGIs $100k-200k, 366.2% for AGIs over 200k)
Total itemized deductions: $32,734 (reported on 19.7% of returns)
Here:
$32,734
State:
$39,517
(% of AGI for various income ranges: 105.7% for AGIs below $25k, 256.0% for AGIs $25k-50k, 599.2% for AGIs $50k-75k, 1130.8% for AGIs $75k-100k, 2541.0% for AGIs $100k-200k, 7943.3% for AGIs over 200k)
Charity contributions: $6,971 (reported on 17.4% of returns)
Here:
$6,971
State:
$12,598
(% of AGI for various income ranges: 7.0% for AGIs below $25k, 33.9% for AGIs $25k-50k, 75.0% for AGIs $50k-75k, 167.8% for AGIs $75k-100k, 431.2% for AGIs $100k-200k, 2100.8% for AGIs over 200k)
Taxes paid: $8,876 (reported on 19.7% of returns)
90630:
$8,876
State:
$8,807
(% of AGI for various income ranges: 20.8% for AGIs below $25k, 58.8% for AGIs $25k-50k, 155.0% for AGIs $50k-75k, 337.2% for AGIs $75k-100k, 755.8% for AGIs $100k-200k, 1923.0% for AGIs over 200k)
Earned income credit: $1,768 (reported on 10.1% of returns)
Here:
$1,768
State:
$2,074
(% of AGI for various income ranges: 57.7% for AGIs below $25k, 55.2% for AGIs $25k-50k, 1.0% for AGIs $50k-75k)
Percentage of individuals using paid preparers for their 2020 taxes: 92.6%
Here:
93%
State:
92%
(% for various income ranges: 91.2% for AGIs below $25k, 92.9% for AGIs $25k-50k, 92.4% for AGIs $50k-75k, 93.4% for AGIs $75k-100k, 93.1% for AGIs $100k-200k, 94.3% for AGIs over 200k)
Averages for the 2012 tax year for zip code 90630, filed in 2013:
Average Adjusted Gross Income (AGI) in 2012: $70,641 (Individual Income Tax Returns)
Here:
$70,641
State:
$72,726
Salary/wage: $63,603 (reported on 82.0% of returns)
Here:
$63,603
State:
$59,079
(% of AGI for various income ranges: 71.4% for AGIs below $25k, 75.3% for AGIs $25k-50k, 77.1% for AGIs $50k-75k, 76.8% for AGIs $75k-100k, 80.1% for AGIs $100k-200k, 61.2% for AGIs over 200k)
Taxable interest for individuals: $1,151 (reported on 44.5% of returns)
This zip code:
$1,151
California:
$2,146
(% of AGI for various income ranges: 1.3% for AGIs below $25k, 0.8% for AGIs $25k-50k, 0.7% for AGIs $50k-75k, 0.6% for AGIs $75k-100k, 0.6% for AGIs $100k-200k, 0.8% for AGIs over 200k)
Ordinary dividends: $4,088 (reported on 22.1% of returns)
Here:
$4,088
State:
$9,308
(% of AGI for various income ranges: 1.3% for AGIs below $25k, 0.8% for AGIs $25k-50k, 0.8% for AGIs $50k-75k, 0.9% for AGIs $75k-100k, 1.0% for AGIs $100k-200k, 2.4% for AGIs over 200k)
Net capital gain/loss in AGI: +$6,009 (reported on 18.3% of returns)
Here:
+$6,009
State:
+$30,460
(% of AGI for various income ranges: 0.2% for AGIs $50k-75k, 0.2% for AGIs $75k-100k, 0.6% for AGIs $100k-200k, 5.6% for AGIs over 200k)
Profit/loss from business: +$13,233 (reported on 17.6% of returns)
Here:
+$13,233
State:
+$17,064
(% of AGI for various income ranges: 12.0% for AGIs below $25k, 6.2% for AGIs $25k-50k, 3.0% for AGIs $50k-75k, 2.5% for AGIs $75k-100k, 2.1% for AGIs $100k-200k, 2.3% for AGIs over 200k)
Taxable individual retirement arrangement distribution: $16,445 (reported on 10.1% of returns)
90630:
$16,445
California:
$19,557
(% of AGI for various income ranges: 3.3% for AGIs below $25k, 2.8% for AGIs $25k-50k, 2.7% for AGIs $50k-75k, 2.6% for AGIs $75k-100k, 2.5% for AGIs $100k-200k, 1.3% for AGIs over 200k)
Self-employment retirement plans: $18,927 (reported on 0.7% of returns)
90630:
$18,927
California:
$24,530
(% of AGI for various income ranges: 0.2% for AGIs $50k-75k, 0.2% for AGIs $100k-200k, 0.4% for AGIs over 200k)
Total itemized deductions: $28,895 (24% of AGI, reported on 43.4% of returns)
Here:
$28,895
State:
$34,004
Here:
24.0% of AGI
State:
22.7% of AGI
(% of AGI for various income ranges: 12.7% for AGIs below $25k, 13.5% for AGIs $25k-50k, 16.6% for AGIs $50k-75k, 20.0% for AGIs $75k-100k, 20.3% for AGIs $100k-200k, 16.4% for AGIs over 200k)
Charity contributions: $3,980 (reported on 38.0% of returns)
Here:
$3,980
State:
$4,659
(% of AGI for various income ranges: 0.7% for AGIs below $25k, 1.4% for AGIs $25k-50k, 2.0% for AGIs $50k-75k, 2.4% for AGIs $75k-100k, 2.5% for AGIs $100k-200k, 2.2% for AGIs over 200k)
Taxes paid: $10,830 (reported on 43.3% of returns)
90630:
$10,830
State:
$14,448
(% of AGI for various income ranges: 2.3% for AGIs below $25k, 2.9% for AGIs $25k-50k, 4.4% for AGIs $50k-75k, 6.2% for AGIs $75k-100k, 7.8% for AGIs $100k-200k, 8.9% for AGIs over 200k)
Earned income credit: $1,970 (reported on 13.3% of returns)
Here:
$1,970
State:
$2,286
(% of AGI for various income ranges: 4.7% for AGIs below $25k, 1.1% for AGIs $25k-50k)
Percentage of individuals using paid preparers for their 2012 taxes: 64.8%
Here:
65%
State:
64%
(% for various income ranges: 58.7% for AGIs below $25k, 65.1% for AGIs $25k-50k, 67.6% for AGIs $50k-75k, 67.9% for AGIs $75k-100k, 68.3% for AGIs $100k-200k, 76.9% for AGIs over 200k)
Averages for the 2004 tax year for zip code 90630, filed in 2005:
Average Adjusted Gross Income (AGI) in 2004: $56,958 (Individual Income Tax Returns)
Here:
$56,958
State:
$58,600
Salary/wage: $54,368 (reported on 83.2% of returns)
Here:
$54,368
State:
$49,455
(% of AGI for various income ranges: 171.9% for AGIs below $10k, 71.3% for AGIs $10k-25k, 77.8% for AGIs $25k-50k, 80.7% for AGIs $50k-75k, 82.9% for AGIs $75k-100k, 77.8% for AGIs over 100k)
Taxable interest for individuals: $1,280 (reported on 55.3% of returns)
This zip code:
$1,280
California:
$2,365
(% of AGI for various income ranges: 10.3% for AGIs below $10k, 2.7% for AGIs $10k-25k, 1.4% for AGIs $25k-50k, 1.1% for AGIs $50k-75k, 1.3% for AGIs $75k-100k, 0.9% for AGIs over 100k)
Taxable dividends: $1,917 (reported on 26.1% of returns)
Here:
$1,917
State:
$4,746
(% of AGI for various income ranges: 6.1% for AGIs below $10k, 1.3% for AGIs $10k-25k, 0.9% for AGIs $25k-50k, 0.7% for AGIs $50k-75k, 0.8% for AGIs $75k-100k, 0.8% for AGIs over 100k)
Net capital gain/loss: +$6,087 (reported on 22.0% of returns)
Here:
+$6,087
State:
+$23,418
(% of AGI for various income ranges: -3.3% for AGIs below $10k, -0.3% for AGIs $10k-25k, 0.2% for AGIs $25k-50k, 0.6% for AGIs $50k-75k, 0.7% for AGIs $75k-100k, 4.7% for AGIs over 100k)
Profit/loss from business: +$13,978 (reported on 17.3% of returns)
Here:
+$13,978
State:
+$16,826
(% of AGI for various income ranges: -1.3% for AGIs below $10k, 10.2% for AGIs $10k-25k, 6.3% for AGIs $25k-50k, 3.4% for AGIs $50k-75k, 3.0% for AGIs $75k-100k, 3.7% for AGIs over 100k)
IRA payment deduction: $3,354 (reported on 3.6% of returns)
90630:
$3,354
California:
$3,192
(% of AGI for various income ranges: 0.5% for AGIs below $10k, 0.3% for AGIs $10k-25k, 0.4% for AGIs $25k-50k, 0.2% for AGIs $50k-75k, 0.2% for AGIs $75k-100k, 0.1% for AGIs over 100k)
Self-employed pension: $15,133 (reported on 1.1% of returns)
Here:
$15,133
California:
$17,688
(% of AGI for various income ranges: 0.1% for AGIs $10k-25k, 0.1% for AGIs $25k-50k, 0.2% for AGIs $50k-75k, 0.2% for AGIs $75k-100k, 0.5% for AGIs over 100k)
Total itemized deductions: $24,709 (27% of AGI, reported on 46.7% of returns)
Here:
$24,709
State:
$28,113
Here:
26.7% of AGI
State:
25.3% of AGI
(% of AGI for various income ranges: 30.0% for AGIs below $10k, 14.5% for AGIs $10k-25k, 17.0% for AGIs $25k-50k, 21.8% for AGIs $50k-75k, 23.7% for AGIs $75k-100k, 20.1% for AGIs over 100k)
Charity contributions deductions: $3,476 (4% of AGI, reported on 42.6% of returns)
Here:
$3,476
State:
$3,923
Here:
3.7% of AGI
State:
3.3% of AGI
(% of AGI for various income ranges: 1.5% for AGIs below $10k, 1.2% for AGIs $10k-25k, 2.0% for AGIs $25k-50k, 2.7% for AGIs $50k-75k, 3.1% for AGIs $75k-100k, 2.7% for AGIs over 100k)
Total tax: $8,198 (reported on 81.1% of returns)
90630:
$8,198
State:
$10,761
(% of AGI for various income ranges: 6.6% for AGIs below $10k, 5.0% for AGIs $10k-25k, 7.1% for AGIs $25k-50k, 8.4% for AGIs $50k-75k, 9.5% for AGIs $75k-100k, 16.0% for AGIs over 100k)
Earned income credit: $1,477 (reported on 9.8% of returns)
Here:
$1,477
State:
$1,763
Percentage of individuals using paid preparers for their 2004 taxes: 66.0%
Here:
66%
State:
66%
(% for various income ranges: 54.5% for AGIs below $10k, 64.3% for AGIs $10k-25k, 66.0% for AGIs $25k-50k, 71.0% for AGIs $50k-75k, 70.5% for AGIs $75k-100k, 71.9% for AGIs over 100k)
Household received Food Stamps/SNAP in the past 12 months: 1,338 Household did not receive Food Stamps/SNAP in the past 12 months: 14,922
Women who had a birth in the past 12 months: 324 (234 now married, 89 unmarried) Women who did not have a birth in the past 12 months: 10,837 (4,988 now married, 5,819 unmarried)
Housing units in zip code 90630 with a mortgage: 7,419 (852 second mortgage, 29 home equity loan, 692 both second mortgage and home equity loan) Houses without a mortgage: 193
Median monthly owner costs for units with a mortgage: $2,962 Median monthly owner costs for units without a mortgage: $737
Residents with income below the poverty level in 2022:
This zip code:
7.2%
Whole state:
12.2%
Residents with income below 50% of the poverty level in 2022:
This zip code:
3.5%
Whole state:
6.2%
Median number of rooms in houses and condos:
Here:
6.3
State:
6.0
Median number of rooms in apartments:
Here:
4.2
State:
3.9
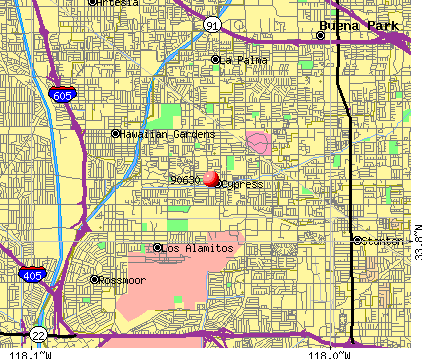
Notable locations in this zip code not listed on our city pages
Notable locations in zip code 90630: Cypress City Hall (A), Cypress Branch Orange County Public Library (B), Orange County Fire Authority Station 17 (C). Display/hide their locations on the map
Shopping Centers: Cypress Plaza Shopping Center (1), Cypress Square Shopping Center (2), Cypress Plaza East Shopping Center (3). Display/hide their locations on the map
Churches in zip code 90630 include: First Southern Baptist Church of Cypress (A), Holy Cross Lutheran Church (B), Korean Rejoice Baptist Church of Cypress (C), Saint Irenaeus Catholic Church (D). Display/hide their locations on the map
Parks in zip code 90630 include: Cypress Park (1), Cedar Glen Park (2), Darrell Essex Park (3), Eucalyptus Park (4), Leylandi Park (5), Oak Knoll Park (6), Peppertree Park (7), Pinewood Park (8), Veterans Park (9). Display/hide their locations on the map
8,367 married couples with children.
1,626 single-parent households (219 men, 1,407 women).
57.0% of residents of 90630 zip code speak English at home.
11.3% of residents speak Spanish at home (73% very well, 16% well, 9% not well, 3% not at all).
4.7% of residents speak other Indo-European language at home (82% very well, 14% well, 5% not well).
25.7% of residents speak Asian or Pacific Island language at home (54% very well, 26% well, 17% not well, 3% not at all).
1.3% of residents speak other language at home (90% very well, 6% well, 4% not well).
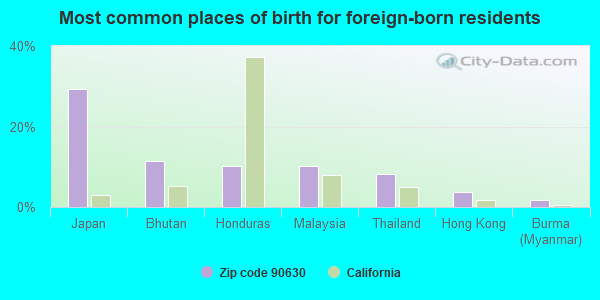
Foreign born population: 15,151 (30.5%) (65.8% of them are naturalized citizens)
This zip code:
30.5%
Whole state:
26.7%
29%Japan
11%Bhutan
10%Honduras
10%Malaysia
8%Thailand
4%Hong Kong
2%Burma (Myanmar)
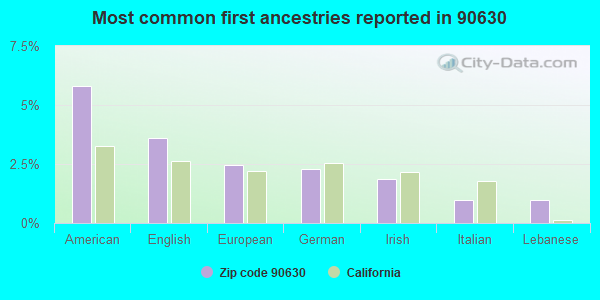
6%American
4%English
2%European
2%German
2%Irish
1%Italian
1%Lebanese
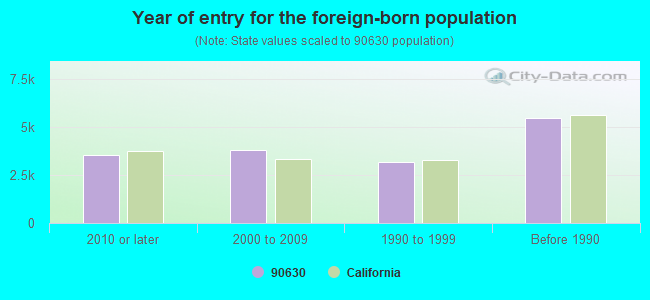
Year of entry for the foreign-born population
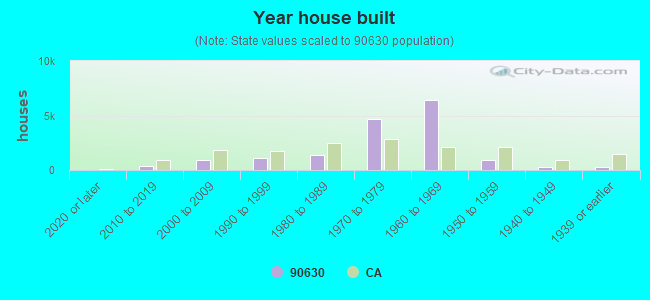
3,5322010 or later
3,7922000 to 2009
3,1921990 to 1999
5,493Before 1990
Major facilities with environmental interests located in this zip code:
HYATT DIE CAST AND ENGINEERING (4656 LINCOLN AVENUE in CYPRESS, CA)
STATE MASTER (California - Hazardous Waste Tracking) - HAZARDOU WASTE PROGRAM COMPLIANCE ACTIVITY (Tracking inspections of insecticide, fungicide, and rodenticide, and toxic substances) CRITERIA AND HAZARDOUS AIR POLLUTANT INVENTORY (Inventory of air pollution sources) HAZARDOUS WASTE BIENNIAL REPORTER (Resource Conservation and Recovery Act (tracking hazardous waste)) Large Quantity Generators, more that 1000 kg of hazardous waste/month (Resource Conservation and Recovery Act (tracking hazardous waste)) TRI REPORTER (Tracking of toxic chemicals releasing facilities) - ICIS-, ENFORCEMENT/COMPLIANCE ACTIVITY Business SIC classification: ALUMINUM DIE-CASTINGS; NONFERROUS DIE-CASTINGS, EXCEPT ALUMINUM; COPPER FOUNDRIES; MACHINE TOOLS, METAL CUTTING TYPES Business NAICS classification: ALUMINUM DIE-CASTING FOUNDRIES. Alternative names: HYATT DIE CAST & ENG., HYATT DIE CAST & ENGINEERING C, HYATT DIECAST
FUJI PHOTO FILM USA INCORPORATED (6200 PHYLLIS DR. in CYPRESS, CA)
STATE MASTER (California - Hazardous Waste Tracking) - HAZARDOU WASTE PROGRAM HAZARDOUS WASTE BIENNIAL REPORTER (Resource Conservation and Recovery Act (tracking hazardous waste)) Large Quantity Generators, more that 1000 kg of hazardous waste/month (Resource Conservation and Recovery Act (tracking hazardous waste)) Alternative names: FUJI PHOTO FILM U S A INC
MACRO Z TECH CO (4761 LINCOLN AVE in CYPRESS, CA)
STATE MASTER (California - Hazardous Waste Tracking) - HAZARDOU WASTE PROGRAM Large Quantity Generators, more that 1000 kg of hazardous waste/month (Resource Conservation and Recovery Act (tracking hazardous waste)) - notification Organizations: BRYAN J ZATICA (CONTACT/OWNER)
EQUILON ENTERPRISES (4001 BALL RD/ BLOOMFIELD in CYPRESS, CA) . Federal Facility
STATE MASTER (California - Hazardous Waste Tracking) - HAZARDOU WASTE PROGRAM HAZARDOUS WASTE BIENNIAL REPORTER (Resource Conservation and Recovery Act (tracking hazardous waste)) Small Quantity Generators, between 100 kg and 1000 kg of hazardous waste/month (Resource Conservation and Recovery Act (tracking hazardous waste)) - notification Organizations: EQUILON ENTERPRISES, LLC (CONTACT/OWNER)
Alternative names: SHELL OIL CO
M AND N COASTLINE AUTO AND TIRE (4005 BALL RD in CYPRESS, CA)
Small Quantity Generators, between 100 kg and 1000 kg of hazardous waste/month (Resource Conservation and Recovery Act (tracking hazardous waste)) - notification STATE MASTER (California - Used Oil Recycling System ) - USED OIL RECYCLING Organizations: M AND N COASTLINE AUTO AND TIRE SVC (CONTACT/OWNER)
Alternative names: M & N COASTLINE AUTO & TIRE SERVICE
FCI ELECTRONICS I O CABLE (5700 WARLAND DR. in CYPRESS, CA)
STATE MASTER (California - Hazardous Waste Tracking) - HAZARDOU WASTE PROGRAM Small Quantity Generators, between 100 kg and 1000 kg of hazardous waste/month (Resource Conservation and Recovery Act (tracking hazardous waste)) - notification TRI REPORTER (Tracking of toxic chemicals releasing facilities) Business SIC classification: ELECTRONIC COMPONENTS Organizations: F C I USA INC (CONTACT/OWNER)
Alternative names: F C I USA INC, FCI USA INC.
CARLSON GARAGE (5131 LINCOLN in CYPRESS, CA)
STATE MASTER (California - Hazardous Waste Tracking) - HAZARDOU WASTE PROGRAM Small Quantity Generators, between 100 kg and 1000 kg of hazardous waste/month (Resource Conservation and Recovery Act (tracking hazardous waste)) - notification Business NAICS classification: GENERAL AUTOMOTIVE REPAIR. Organizations: LEW VERN CARLSON (CONTACT/OWNER)
MATSUSHITA ELECTRIC CORP OF AMERICA (6550 KATELLA AVE in CYPRESS, CA)
STATE MASTER (California - Hazardous Waste Tracking) - HAZARDOU WASTE PROGRAM Small Quantity Generators, between 100 kg and 1000 kg of hazardous waste/month (Resource Conservation and Recovery Act (tracking hazardous waste))
A E ARNOLD ELEMENTARY SCHOOL (9281 DENNI ST in CYPRESS, CA)
(Geographic Names Information System) (National Center for Education Statistics) - STATE ID-6027767 Organizations: CYPRESS ELEMENTARY (SCHOOL DISTRICT)
Alternative names: ARNOLD (A. E.) ELEMENTARY
FIVE CITY AUTO REPAIR CENTER, INC (4620 LINCOLN AVE in CYPRESS, CA)
STATE MASTER (California - Hazardous Waste Tracking) - HAZARDOU WASTE PROGRAM Small Quantity Generators, between 100 kg and 1000 kg of hazardous waste/month (Resource Conservation and Recovery Act (tracking hazardous waste)) Business NAICS classification: GENERAL AUTOMOTIVE REPAIR.
GREEN WORLD CLEANERS (4941 AND 4961 ORANGE AVE in CYPRESS, CA)
STATE MASTER (California - Hazardous Waste Tracking) - HAZARDOU WASTE PROGRAM Small Quantity Generators, between 100 kg and 1000 kg of hazardous waste/month (Resource Conservation and Recovery Act (tracking hazardous waste)) - notification Organizations: HARRY GIBSON (CONTACT/OWNER)
KEN THOMPSON INC (8851 WATSON ST in CYPRESS, CA)
STATE MASTER (California - Hazardous Waste Tracking) - HAZARDOU WASTE PROGRAM Small Quantity Generators, between 100 kg and 1000 kg of hazardous waste/month (Resource Conservation and Recovery Act (tracking hazardous waste))
LEXINGTON JR. HIGH (4351 ORANGE AVE. in CYPRESS, CA)
(National Center for Education Statistics) - STATE ID-6085260 Organizations: ANAHEIM UNION HIGH (SCHOOL DISTRICT)
Housing units lacking complete plumbing facilities: 0.2% Housing units lacking complete kitchen facilities: 2.4%
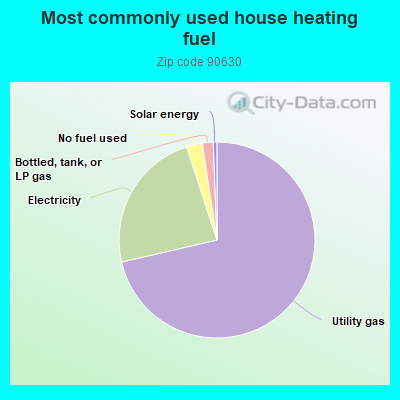
71.4%Utility gas
23.6%Electricity
2.6%No fuel used
1.8%Bottled, tank, or LP gas
0.6%Solar energy
Population in 1990: 43,055. Population change in the 1990s: +4,279 (+9.9%).
Place of birth for U.S.-born residents:
This state: 27,888
Northeast: 1,202
Midwest: 1,969
South: 1,347
West: 1,358
57% of the 90630 zip code residents lived in the same house 5 years ago. Out of people who lived in different houses, 57% lived in this county. Out of people who lived in different counties, 50% lived in California.
94% of the 90630 zip code residents lived in the same house 1 year ago. Out of people who lived in different houses, 40% moved from this county. Out of people who lived in different houses, 45% moved from different county within same state. Out of people who lived in different houses, 13% moved from different state. Out of people who lived in different houses, 7% moved from abroad.
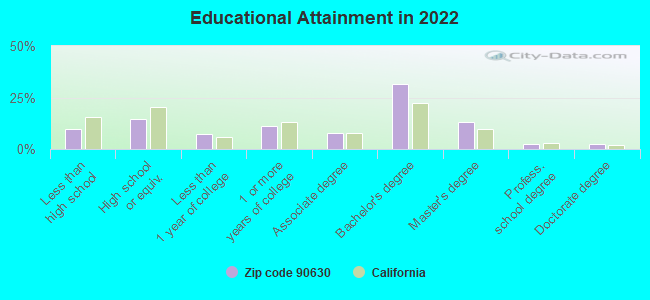
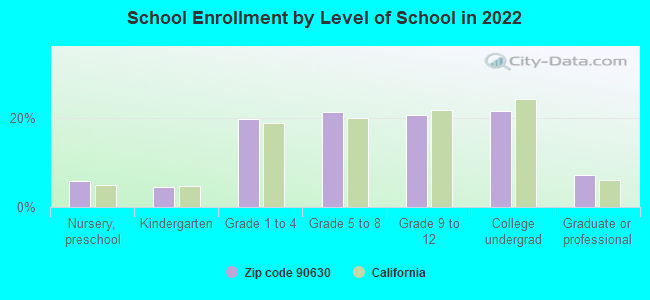
Private vs. public school enrollment:
Students in private schools in grades 1 to 8 (elementary and middle school): 633
Here:
12.1%
California:
10.5%
Students in private schools in grades 9 to 12 (high school): 78
Here:
3.0%
California:
8.5%
Students in private undergraduate colleges: 404
Here:
14.8%
California:
15.9%
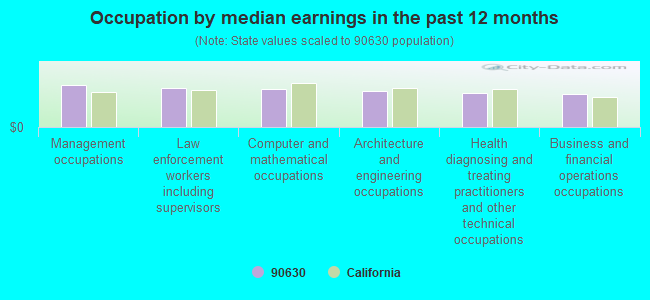
Occupation by median earnings in the past 12 months ($)
114,334Management occupations
105,681Law enforcement workers including supervisors
103,375Computer and mathematical occupations
97,108Architecture and engineering occupations
92,053Health diagnosing and treating practitioners and other technical occupations
90,061Business and financial operations occupations
Companies with biggest federal contracts located in this zip code (CYPRESS, CA):
SCIENTIFIC APPLICATIONS AND RE (6300 GATEWAY DRIVE; small business) : $35,967,951 in 176 contractsfrom 1999 to 2006
Contracts for Other Research and Development -- Basic Research (R&D), Services -- Advanced Development (R&D), Other Defense -- Applied Research and Exploratory Development (R&D), Defense Tank - Automotive -- Applied Research and Exploratory Development (R&D), and moreby Navy, Army, Department of Defense, Air Force, and others Signed by year:2000: $3,281,721; 2001: $2,979,089; 2002: $4,586,862; 2003: $5,082,115; 2004: $9,016,053; 2005: $7,777,325; 2006: $2,409,074.
Biggest contracts:
$1,177,627 with Navy for Other Research and Development -- Basic Research (R&D). Signed on 2004-04-22. Completion date: 2004-04-21.
$999,613 with Army for Services -- Advanced Development (R&D). Signed on 2005-06-06. Completion date: 2005-03-17.
$950,485 with Department of Defense for Other Defense -- Applied Research and Exploratory Development (R&D). Signed on 2002-04-10. Completion date: 2003-03-11.
$692,989, same as above.Signed on 2000-04-12. Completion date: 2001-03-12.
HYATT DIE CAST & ENGINEERING C (4656 LINCOLN AVENUE; small business) : $2,773,911 in 26 contractsfrom 2000 to 2006
Contracts for Airframe Structural Components by Defense Logistics Agency, Air Force Signed by year:2000: $219,792; 2001: $699,755; 2002: $582,088; 2003: $0; 2004: $472,469; 2005: $597,950; 2006: $201,857.
Biggest contracts:
$556,950 with Defense Logistics Agency for Airframe Structural Components. Signed on 2002-07-08. Completion date: 2003-02-03.
$445,875, same as above.Signed on 2001-07-31. Completion date: 2002-02-08.
$253,880, same as above.Signed on 2001-12-12. Completion date: 2002-02-10.
$219,792, same as above.Signed on 2000-01-31. Completion date: 2000-05-10.
TAYCO ENGINEERING, INC (10874 HOPE STREET; small business) : $2,738,830 in 70 contractsfrom 2000 to 2006
Contracts for Cable, Cord, and Wire Assemblies: Communications Equipment, Miscellaneous Electric Power and Distribution Equipment, Aircraft Bombing Fire Control Components, Space Vehicle Components, and moreby Defense Logistics Agency, NASA, Navy Signed by year:2000: $207,339; 2001: $403,862; 2002: $575,373; 2003: $164,702; 2004: $497,013; 2005: $758,943; 2006: $131,598.
Biggest contracts:
$356,300 with Defense Logistics Agency for Cable, Cord, and Wire Assemblies: Communications Equipment. Signed on 2002-09-30. Completion date: 2003-08-02.
$214,185, same as above.Signed on 2005-06-02. Completion date: 2005-09-30.
$207,339 with Defense Logistics Agency for Miscellaneous Electric Power and Distribution Equipment. Signed on 2000-11-30. Completion date: 2001-10-26.
$207,339, same as above.Signed on 2001-01-23. Completion date: 2002-08-22.
DEKKER/PERICH/SABITINI - JACOB (5757 PLAZA DR STE100) : $1,175,615 in 5 contractsin 2006
Contracts for Architect - Engineer Services (including landscaping, interior layout, and designing) by Army Signed by year:2000: $0; 2001: $0; 2002: $0; 2003: $0; 2004: $0; 2005: $0; 2006: $1,175,615.
Biggest contracts:
$1,000,411 with Army for Architect - Engineer Services (including landscaping, interior layout, and designing). Taking place in AZ. Signed on 2006-06-19. Completion date: 2006-07-13.
$90,559 with Army for Architect - Engineer Services (including landscaping, interior layout, and designing). Signed on 2006-05-31. Completion date: 2006-09-30.
$56,513 with Army for Architect - Engineer Services (including landscaping, interior layout, and designing). Taking place in AZ. Signed on 2006-01-13. Completion date: 2006-07-13.
$26,632 with Army for Architect - Engineer Services (including landscaping, interior layout, and designing). Taking place in NM. Signed on 2006-01-26. Completion date: 2006-07-26.
TOURO UNIVERSITY INTERNATIONAL (5665 PLAZA DRIVE, THIRD FL) : $885,611 in 9 contractsfrom 2003 to 2006
Contracts for Educational Services, Education Services by Army Signed by year:2000: $0; 2001: $0; 2002: $0; 2003: $775,411; 2004: $59,300; 2005: $45,900; 2006: $5,000.
Biggest contracts:
$693,101 with Army for Educational Services. Signed on 2003-06-04. Completion date: 2003-06-04.
$69,310, same as above.Signed on 2003-09-15. Completion date: 2003-09-15.
$38,600, same as above.Signed on 2004-03-12. Completion date: 2004-03-12.
$36,900, same as above.Signed on 2005-08-16. Completion date: 2005-08-16.
SIEMENS BUILDING TECHNOLOGIES (10775 BUSINESS CENTER DR) : $794,246 in 14 contractsfrom 2000 to 2005
Contracts for Maintenance, Repair or Alteration of Real Property -- Other Non-Building Facilities, Maintenance, Repair or Alteration of Real Property -- Miscellaneous Buildings, Maintenance, Repair and Rebuilding of Equipment -- Refrigeration, Air Conditioning, and Air Circulating Equipment, ADP System Acquisition Support Services. Includes preparation of statement of work, benchmarks, specifications, etc., and moreby Navy, Air Force, NASA Signed by year:2000: $256,350; 2001: $131,378; 2002: $89,796; 2003: $129,310; 2004: $154,584; 2005: $32,828; 2006: $0.
Biggest contracts:
$256,350 with Navy for Maintenance, Repair or Alteration of Real Property -- Other Non-Building Facilities. Signed on 2000-09-15. Completion date: 2001-01-31.
$99,936 with Navy for Maintenance, Repair or Alteration of Real Property -- Miscellaneous Buildings. Signed on 2001-10-01. Completion date: 2001-10-05.
$99,024 with Navy for Maintenance, Repair and Rebuilding of Equipment -- Refrigeration, Air Conditioning, and Air Circulating Equipment. Signed on 2004-09-16. Completion date: 2005-06-25.
$94,296, same as above.Signed on 2003-06-26. Completion date: 2005-06-25.
CORPORATION FOR EDUCATION NETW (5757 PLAZA DRIVE) : $474,999 in 3 contractsfrom 2004 to 2005
$300,000 with Navy for Education Services. Signed on 2005-09-28. Completion date: 2006-09-29.
$99,999 with NASA for Communications Services. Signed on 2004-08-19. Completion date: 2006-01-01.
$75,000, same as above.Signed on 2004-08-19. Completion date: 2005-08-18.
SIEMENS ENERGY & AUTOMATION (10855 BUSINESS CENTER DRIV) : $437,557 in 3 contractsfrom 2002 to 2003
$218,429 with Air Force for Construction of Structures and Facilities -- Other Utilities. Signed on 2002-09-27. Completion date: 2002-11-27.
$171,628 with Air Force for Maintenance, Repair and Rebuilding of Equipment -- Mechanical Power Transmission Equipment. Signed on 2003-09-27. Completion date: 2004-01-11.
$47,500 with Air Force for Electrical Control Equipment. Signed on 2003-03-29. Completion date: 2003-03-29.
JACOBS-LENNAR JOINT VENTURE (5757 PLAZA DR, STE 100) : $339,354 in 2 contractsin 2004
$196,680 with Air Force for Residential Buildings. Signed on 2004-09-02. Completion date: 2011-12-11.
$142,674, same as above.Signed on 2004-02-27. Completion date: 2004-08-30.
CHRISTIE DIGITAL SYSTEMS USA I (10550 CAMDEN DRIVE; small business) : $254,485 in 4 contractsfrom 1999 to 2001
$95,485 with Navy for Miscellaneous Electrical and Electronic Components. Signed on 2001-08-08. Completion date: 2001-11-08.
$72,000 with Federal Technology Service for Radio and Television Communication Equipment, Except Airborne. Signed on 2000-08-15. Completion date: 2000-09-15.
$62,000 with Federal Technology Service for Radio and Television Communication Equipment, Except Airborne. Taking place in WA. Signed on 2000-09-15. Completion date: 2000-09-15.
$25,000 with Bureau of Reclamation for Video Recording and Reproducing Equipment. Taking place in NV. Signed on 1999-10-15. Completion date: 2000-11-15.
Top industries in this zip code by the number of employees in 2005:
Finance and Insurance: Direct Health and Medical Insurance Carriers (over 1000 employees: 1 establishment, 500-999 employees: 1 establishment, 250-499 employees: 3 establishments, 100-249 employees: 2 establishments, 50-99 employees: 1 establishment, 20-49 employees: 1 establishment, 10-19 employees: 1 establishment, 1-4 employees: 2 establishments)
Management of Companies and Enterprises: Corporate, Subsidiary, and Regional Managing Offices (250-499: 2, 100-249: 1, 50-99: 4, 20-49: 1, 1-4: 2)


 Nearest zip codes: 90623, 90720, 90620, 90716, 92845, 90715.