Estimated zip code population in 2022: 83,996 Zip code population in 2010: 85,914 Zip code population in 2000: 81,317
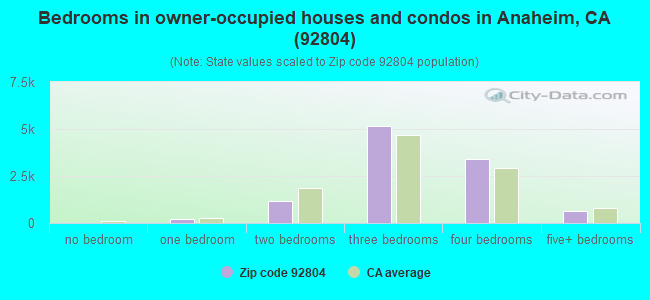
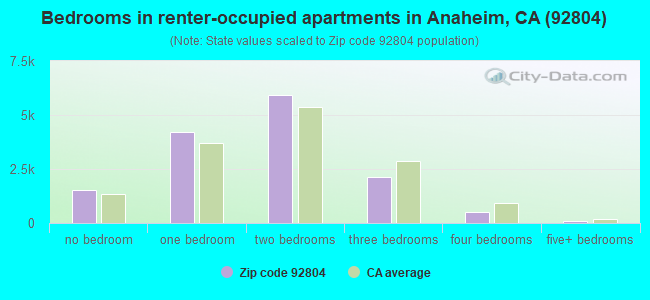
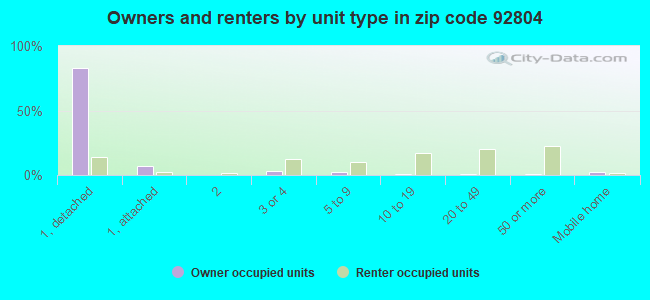
Houses and condos: 25,733 Renter-occupied apartments: 14,390
% of renters here:
58%
State:
44%
March 2022 cost of living index in zip code 92804: 87.8 (less than average, U.S. average is 100)
Land area: 7.0 sq. mi. Water area: 0.0 sq. mi.
Population density: 11,991 people per square mile
(high).
OSM Map
General Map
Google Map
MSN Map
OSM Map
General Map
Google Map
MSN Map
OSM Map
General Map
Google Map
MSN Map
OSM Map
General Map
Google Map
MSN Map
Please wait while loading the map...
Real estate property taxes paid for housing units in 2022:
This zip code:
0.7% ($4,677)
California:
0.7% ($4,831)
Median real estate property taxes paid for housing units with mortgages in 2022: $4,951 (0.7%) Median real estate property taxes paid for housing units with no mortgage in 2022: $4,075 (0.6%)
Estimated median house/condo value in 2022: $718,180
92804:
$718,180
California:
$715,900
According to our research of California and other state lists, there were 79 registered sex offenders living in 92804 zip code as of April 27, 2024. The ratio of all residents to sex offenders in zip code 92804 is 1,107 to 1. The ratio of registered sex offenders to all residents in this zip code is lower than the state average.
Median resident age:
This zip code:
36.8 years
California median age:
37.9 years
Average household size:
This zip code:
3.3 people
California:
2.8 people
Averages for the 2020 tax year for zip code 92804, filed in 2021:
Average Adjusted Gross Income (AGI) in 2020: $47,776 (Individual Income Tax Returns)
Here:
$47,776
State:
$95,910
Salary/wage: $44,451 (reported on 83.9% of returns)
Here:
$44,451
State:
$77,331
(% of AGI for various income ranges: 1207.9% for AGIs below $25k, 4060.6% for AGIs $25k-50k, 7783.7% for AGIs $50k-75k, 11660.2% for AGIs $75k-100k, 20021.1% for AGIs $100k-200k, 62478.9% for AGIs over 200k)
Taxable interest for individuals: $650 (reported on 23.0% of returns)
This zip code:
$650
California:
$2,294
(% of AGI for various income ranges: 7.3% for AGIs below $25k, 11.3% for AGIs $25k-50k, 27.9% for AGIs $50k-75k, 38.8% for AGIs $75k-100k, 86.2% for AGIs $100k-200k, 438.4% for AGIs over 200k)
Ordinary dividends: $2,007 (reported on 8.9% of returns)
Here:
$2,007
State:
$10,949
(% of AGI for various income ranges: 6.2% for AGIs below $25k, 10.0% for AGIs $25k-50k, 28.9% for AGIs $50k-75k, 50.8% for AGIs $75k-100k, 110.2% for AGIs $100k-200k, 801.1% for AGIs over 200k)
Net capital gain/loss in AGI: +$7,948 (reported on 10.5% of returns)
Here:
+$7,948
State:
+$49,306
(% of AGI for various income ranges: 2.4% for AGIs below $25k, 10.8% for AGIs $25k-50k, 32.4% for AGIs $50k-75k, 101.7% for AGIs $75k-100k, 425.1% for AGIs $100k-200k, 11274.7% for AGIs over 200k)
Profit/loss from business: +$7,217 (reported on 18.7% of returns)
Here:
+$7,217
State:
+$15,671
(% of AGI for various income ranges: 202.4% for AGIs below $25k, 143.5% for AGIs $25k-50k, 166.5% for AGIs $50k-75k, 252.4% for AGIs $75k-100k, 293.6% for AGIs $100k-200k, 2539.5% for AGIs over 200k)
Taxable individual retirement arrangement distribution: $17,966 (reported on 3.4% of returns)
92804:
$17,966
California:
$23,505
(% of AGI for various income ranges: 22.7% for AGIs below $25k, 31.8% for AGIs $25k-50k, 83.5% for AGIs $50k-75k, 164.4% for AGIs $75k-100k, 428.9% for AGIs $100k-200k, 2743.2% for AGIs over 200k)
Self-employed (Keogh) retirement plans: $21,300 (reported on 0.1% of returns)
92804:
$21,300
California:
$30,163
(% of AGI for various income ranges: 42.6% for AGIs $100k-200k)
Total itemized deductions: $29,849 (reported on 9.4% of returns)
Here:
$29,849
State:
$39,517
(% of AGI for various income ranges: 44.4% for AGIs below $25k, 142.5% for AGIs $25k-50k, 482.8% for AGIs $50k-75k, 969.8% for AGIs $75k-100k, 2178.3% for AGIs $100k-200k, 8672.6% for AGIs over 200k)
Charity contributions: $5,214 (reported on 7.7% of returns)
Here:
$5,214
State:
$12,598
(% of AGI for various income ranges: 2.6% for AGIs below $25k, 15.6% for AGIs $25k-50k, 62.7% for AGIs $50k-75k, 118.1% for AGIs $75k-100k, 360.9% for AGIs $100k-200k, 1525.8% for AGIs over 200k)
Taxes paid: $8,361 (reported on 9.4% of returns)
92804:
$8,361
State:
$8,807
(% of AGI for various income ranges: 11.0% for AGIs below $25k, 36.5% for AGIs $25k-50k, 138.3% for AGIs $50k-75k, 304.8% for AGIs $75k-100k, 654.6% for AGIs $100k-200k, 1807.4% for AGIs over 200k)
Earned income credit: $2,030 (reported on 19.2% of returns)
Here:
$2,030
State:
$2,074
(% of AGI for various income ranges: 93.0% for AGIs below $25k, 72.7% for AGIs $25k-50k, 1.4% for AGIs $50k-75k)
Percentage of individuals using paid preparers for their 2020 taxes: 92.7%
Here:
93%
State:
92%
(% for various income ranges: 91.5% for AGIs below $25k, 93.5% for AGIs $25k-50k, 92.9% for AGIs $50k-75k, 93.3% for AGIs $75k-100k, 93.7% for AGIs $100k-200k, 92.1% for AGIs over 200k)
Averages for the 2012 tax year for zip code 92804, filed in 2013:
Average Adjusted Gross Income (AGI) in 2012: $39,056 (Individual Income Tax Returns)
Here:
$39,056
State:
$72,726
Salary/wage: $37,613 (reported on 85.8% of returns)
Here:
$37,613
State:
$59,079
(% of AGI for various income ranges: 77.6% for AGIs below $25k, 87.4% for AGIs $25k-50k, 84.9% for AGIs $50k-75k, 83.7% for AGIs $75k-100k, 83.9% for AGIs $100k-200k, 57.0% for AGIs over 200k)
Taxable interest for individuals: $661 (reported on 24.0% of returns)
This zip code:
$661
California:
$2,146
(% of AGI for various income ranges: 0.4% for AGIs below $25k, 0.3% for AGIs $25k-50k, 0.4% for AGIs $50k-75k, 0.4% for AGIs $75k-100k, 0.4% for AGIs $100k-200k, 1.1% for AGIs over 200k)
Ordinary dividends: $2,423 (reported on 8.2% of returns)
Here:
$2,423
State:
$9,308
(% of AGI for various income ranges: 0.4% for AGIs below $25k, 0.3% for AGIs $25k-50k, 0.4% for AGIs $50k-75k, 0.5% for AGIs $75k-100k, 0.5% for AGIs $100k-200k, 2.4% for AGIs over 200k)
Net capital gain/loss in AGI: +$3,768 (reported on 5.8% of returns)
Here:
+$3,768
State:
+$30,460
(% of AGI for various income ranges: 0.3% for AGIs $75k-100k, 0.4% for AGIs $100k-200k, 9.4% for AGIs over 200k)
Profit/loss from business: +$9,618 (reported on 17.3% of returns)
Here:
+$9,618
State:
+$17,064
(% of AGI for various income ranges: 13.4% for AGIs below $25k, 3.8% for AGIs $25k-50k, 2.1% for AGIs $50k-75k, 1.6% for AGIs $75k-100k, 2.0% for AGIs $100k-200k, 3.2% for AGIs over 200k)
Taxable individual retirement arrangement distribution: $12,488 (reported on 4.6% of returns)
92804:
$12,488
California:
$19,557
(% of AGI for various income ranges: 1.1% for AGIs below $25k, 1.1% for AGIs $25k-50k, 1.3% for AGIs $50k-75k, 1.7% for AGIs $75k-100k, 1.8% for AGIs $100k-200k, 2.9% for AGIs over 200k)
Self-employment retirement plans: $12,825 (reported on 0.1% of returns)
92804:
$12,825
California:
$24,530
Total itemized deductions: $22,408 (29% of AGI, reported on 25.1% of returns)
Here:
$22,408
State:
$34,004
Here:
29.0% of AGI
State:
22.7% of AGI
(% of AGI for various income ranges: 6.3% for AGIs below $25k, 10.5% for AGIs $25k-50k, 15.8% for AGIs $50k-75k, 18.5% for AGIs $75k-100k, 20.4% for AGIs $100k-200k, 17.1% for AGIs over 200k)
Charity contributions: $2,750 (reported on 20.8% of returns)
Here:
$2,750
State:
$4,659
(% of AGI for various income ranges: 0.4% for AGIs below $25k, 0.9% for AGIs $25k-50k, 1.6% for AGIs $50k-75k, 2.0% for AGIs $75k-100k, 2.3% for AGIs $100k-200k, 2.4% for AGIs over 200k)
Taxes paid: $6,588 (reported on 25.0% of returns)
92804:
$6,588
State:
$14,448
(% of AGI for various income ranges: 1.1% for AGIs below $25k, 2.3% for AGIs $25k-50k, 4.1% for AGIs $50k-75k, 5.6% for AGIs $75k-100k, 7.1% for AGIs $100k-200k, 8.4% for AGIs over 200k)
Earned income credit: $2,330 (reported on 25.0% of returns)
Here:
$2,330
State:
$2,286
(% of AGI for various income ranges: 7.2% for AGIs below $25k, 1.4% for AGIs $25k-50k)
Percentage of individuals using paid preparers for their 2012 taxes: 71.9%
Here:
72%
State:
64%
(% for various income ranges: 71.2% for AGIs below $25k, 72.7% for AGIs $25k-50k, 73.3% for AGIs $50k-75k, 72.4% for AGIs $75k-100k, 70.7% for AGIs $100k-200k, 73.9% for AGIs over 200k)
Averages for the 2004 tax year for zip code 92804, filed in 2005:
Average Adjusted Gross Income (AGI) in 2004: $35,581 (Individual Income Tax Returns)
Here:
$35,581
State:
$58,600
Salary/wage: $34,453 (reported on 87.4% of returns)
Here:
$34,453
State:
$49,455
(% of AGI for various income ranges: 96.9% for AGIs below $10k, 83.1% for AGIs $10k-25k, 89.1% for AGIs $25k-50k, 87.0% for AGIs $50k-75k, 87.3% for AGIs $75k-100k, 72.3% for AGIs over 100k)
Taxable interest for individuals: $878 (reported on 34.5% of returns)
This zip code:
$878
California:
$2,365
(% of AGI for various income ranges: 2.5% for AGIs below $10k, 1.0% for AGIs $10k-25k, 0.6% for AGIs $25k-50k, 0.7% for AGIs $50k-75k, 0.8% for AGIs $75k-100k, 1.2% for AGIs over 100k)
Taxable dividends: $1,407 (reported on 11.2% of returns)
Here:
$1,407
State:
$4,746
(% of AGI for various income ranges: 1.2% for AGIs below $10k, 0.5% for AGIs $10k-25k, 0.3% for AGIs $25k-50k, 0.4% for AGIs $50k-75k, 0.5% for AGIs $75k-100k, 0.5% for AGIs over 100k)
Net capital gain/loss: +$6,269 (reported on 9.4% of returns)
Here:
+$6,269
State:
+$23,418
(% of AGI for various income ranges: -0.6% for AGIs below $10k, -0.1% for AGIs $10k-25k, 0.0% for AGIs $25k-50k, 0.4% for AGIs $50k-75k, 0.9% for AGIs $75k-100k, 8.3% for AGIs over 100k)
Profit/loss from business: +$8,912 (reported on 15.3% of returns)
Here:
+$8,912
State:
+$16,826
(% of AGI for various income ranges: 15.3% for AGIs below $10k, 7.5% for AGIs $10k-25k, 3.4% for AGIs $25k-50k, 2.4% for AGIs $50k-75k, 1.8% for AGIs $75k-100k, 3.5% for AGIs over 100k)
IRA payment deduction: $2,873 (reported on 2.0% of returns)
92804:
$2,873
California:
$3,192
(% of AGI for various income ranges: 0.1% for AGIs below $10k, 0.1% for AGIs $10k-25k, 0.2% for AGIs $25k-50k, 0.2% for AGIs $50k-75k, 0.2% for AGIs $75k-100k, 0.1% for AGIs over 100k)
Self-employed pension: $9,216 (reported on 0.3% of returns)
Here:
$9,216
California:
$17,688
(% of AGI for various income ranges: 0.2% for AGIs below $10k, 0.0% for AGIs $25k-50k, 0.1% for AGIs $50k-75k, 0.1% for AGIs $75k-100k, 0.2% for AGIs over 100k)
Total itemized deductions: $21,140 (33% of AGI, reported on 30.5% of returns)
Here:
$21,140
State:
$28,113
Here:
33.5% of AGI
State:
25.3% of AGI
(% of AGI for various income ranges: 10.2% for AGIs below $10k, 9.7% for AGIs $10k-25k, 17.1% for AGIs $25k-50k, 20.6% for AGIs $50k-75k, 22.7% for AGIs $75k-100k, 20.9% for AGIs over 100k)
Charity contributions deductions: $2,542 (4% of AGI, reported on 26.4% of returns)
Here:
$2,542
State:
$3,923
Here:
3.8% of AGI
State:
3.3% of AGI
(% of AGI for various income ranges: 0.4% for AGIs below $10k, 0.7% for AGIs $10k-25k, 1.4% for AGIs $25k-50k, 2.3% for AGIs $50k-75k, 2.8% for AGIs $75k-100k, 2.7% for AGIs over 100k)
Total tax: $4,007 (reported on 69.1% of returns)
92804:
$4,007
State:
$10,761
(% of AGI for various income ranges: 4.1% for AGIs below $10k, 3.7% for AGIs $10k-25k, 5.7% for AGIs $25k-50k, 7.8% for AGIs $50k-75k, 9.0% for AGIs $75k-100k, 14.1% for AGIs over 100k)
Earned income credit: $1,767 (reported on 19.9% of returns)
Here:
$1,767
State:
$1,763
Percentage of individuals using paid preparers for their 2004 taxes: 69.7%
Here:
70%
State:
66%
(% for various income ranges: 62.9% for AGIs below $10k, 71.8% for AGIs $10k-25k, 70.7% for AGIs $25k-50k, 70.7% for AGIs $50k-75k, 69.1% for AGIs $75k-100k, 74.3% for AGIs over 100k)
Likely homosexual households (counted as self-reported same-sex unmarried-partner households)
Lesbian couples: 0.2% of all households
Gay men: 0.2% of all households
Household received Food Stamps/SNAP in the past 12 months: 4,997 Household did not receive Food Stamps/SNAP in the past 12 months: 20,406
Women who had a birth in the past 12 months: 998 (841 now married, 154 unmarried) Women who did not have a birth in the past 12 months: 20,258 (6,706 now married, 13,607 unmarried)
Housing units in zip code 92804 with a mortgage: 6,940 (534 second mortgage, 24 home equity loan, 396 both second mortgage and home equity loan) Houses without a mortgage: 129
Median monthly owner costs for units with a mortgage: $2,619 Median monthly owner costs for units without a mortgage: $681
Residents with income below the poverty level in 2022:
This zip code:
15.3%
Whole state:
12.2%
Residents with income below 50% of the poverty level in 2022:
This zip code:
7.7%
Whole state:
6.2%
Median number of rooms in houses and condos:
Here:
5.8
State:
6.0
Median number of rooms in apartments:
Here:
3.7
State:
3.9
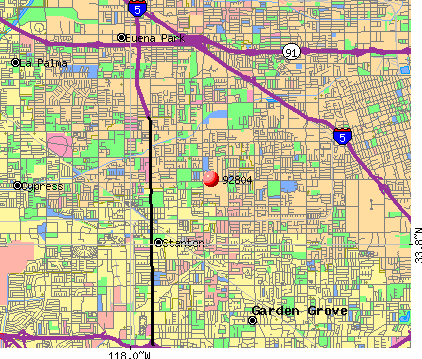
Notable locations in this zip code not listed on our city pages
Notable locations in zip code 92804: Haskett Reading Center Anaheim Public Library (A), Anaheim Fire Department Station 11 (B), Brookhurst Center (C), Anaheim Fire Department Station 4 (D). Display/hide their locations on the map
Churches in zip code 92804 include: Church In Anaheim (A), Faith Lutheran Church of Anaheim (B), Orange Avenue Baptist Church (C), Saint Justin the Martyr Church (D), West Anaheim United Methodist Church (E), Church of Jesus Christ (F), Grace Bible Church (G), Magnolia Baptist Church (H), Saint Paul's Presbyterian Church (I). Display/hide their locations on the map
Parks in zip code 92804 include: Chaparra Park (1), Modjeska Park (2), Hansen Park (3), Maxwell Park (4), Reid Park (5), Schweitzer Park (6), Barton Park (7). Display/hide their locations on the map
10,832 married couples with children.
4,447 single-parent households (1,198 men, 3,249 women).
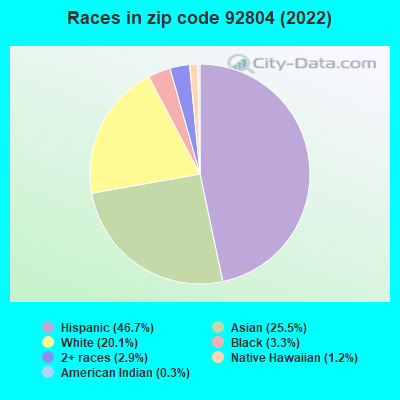
38.4% of residents of 92804 zip code speak English at home.
34.8% of residents speak Spanish at home (65% very well, 17% well, 13% not well, 5% not at all).
2.9% of residents speak other Indo-European language at home (52% very well, 33% well, 14% not well, 2% not at all).
20.8% of residents speak Asian or Pacific Island language at home (44% very well, 29% well, 21% not well, 6% not at all).
3.2% of residents speak other language at home (67% very well, 22% well, 7% not well, 4% not at all).
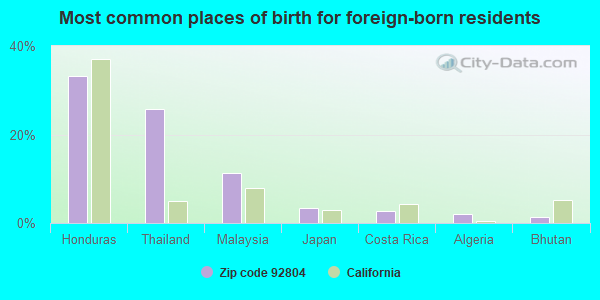
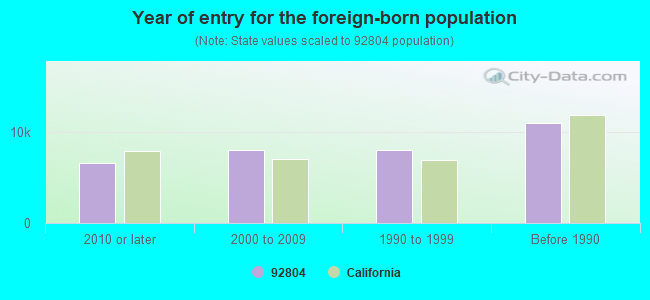
Foreign born population: 32,136 (38.3%) (57.2% of them are naturalized citizens)
Major facilities with environmental interests located in this zip code:
AMERICANA CARWASH (1725 S BROOKHUST ST in ANAHEIM, CA)
STATE MASTER (California - Hazardous Waste Tracking) - HAZARDOU WASTE PROGRAM Large Quantity Generators, more that 1000 kg of hazardous waste/month (Resource Conservation and Recovery Act (tracking hazardous waste)) Organizations: DANIEL CASSOUS (CONTACT/OPERATOR)
JIFFY LUBE #1028 (2400 W BALL RD in ANAHEIM, CA)
TRANSPORTER (Resource Conservation and Recovery Act (tracking hazardous waste)) STATE MASTER (California - Used Oil Recycling System ) - USED OIL RECYCLING Organizations: AMERICAN LUBRICATION (CONTACT/OWNER)
Alternative names: OIL CAN HENRYS
KRAEMER AUTO COLLISON INCORPORATED (1361 NORTH KRAEMER BOULEVARD in ANAHEIM, CA)
STATE MASTER (California - Hazardous Waste Tracking) - HAZARDOU WASTE PROGRAM CRITERIA AND HAZARDOUS AIR POLLUTANT INVENTORY (Inventory of air pollution sources) Small Quantity Generators, between 100 kg and 1000 kg of hazardous waste/month (Resource Conservation and Recovery Act (tracking hazardous waste)) Business SIC classification: GENERAL AUTOMOTIVE REPAIR SHOPS Business NAICS classification: AUTOMOTIVE BODY, PAINT, AND INTERIOR REPAIR AND MAINTENANCE. Alternative names: KRAEMER AUTO COLLISION, INC, KRAEMER AUTO COLLISON, J. CUEV
CHEVRON STATION NO 92069 (10972 KATELLA AVE in ANAHEIM, CA)
STATE MASTER (California - Hazardous Waste Tracking) - HAZARDOU WASTE PROGRAM Small Quantity Generators, between 100 kg and 1000 kg of hazardous waste/month (Resource Conservation and Recovery Act (tracking hazardous waste)) - notification Organizations: CHEVRON PRODUCTS CO (CONTACT/OWNER)
Alternative names: BOBS CHEVRON
HANSEN ELEMENTARY (1300 S. KNOTT in ANAHEIM, CA)
(National Center for Education Statistics) - STATE ID-6030464 Organizations: SAVANNA ELEMENTARY (SCHOOL DISTRICT)
KEY ELEMENTARY (2000 W. BALL ROAD in ANAHEIM, CA)
(National Center for Education Statistics) - STATE ID-6027296 Organizations: ANAHEIM ELEMENTARY (SCHOOL DISTRICT)
LOARA HIGH (1765 W. CERRITOS in ANAHEIM, CA)
(National Center for Education Statistics) - STATE ID-3033784 Organizations: ANAHEIM UNION HIGH (SCHOOL DISTRICT)
MADISON ELEMENTARY (1510 S. NUTWOOD ST. in ANAHEIM, CA)
(National Center for Education Statistics) - STATE ID-6027338 Organizations: ANAHEIM ELEMENTARY (SCHOOL DISTRICT)
MAGNOLIA HIGH (2450 W. BALL ROAD in ANAHEIM, CA)
(National Center for Education Statistics) - STATE ID-3034204 Organizations: ANAHEIM UNION HIGH (SCHOOL DISTRICT)
MAXWELL (MATTIE LOU) ELEMENTAR (2613 W. ORANGE AVE. in ANAHEIM, CA)
(National Center for Education Statistics) - STATE ID-6029169 Organizations: MAGNOLIA ELEMENTARY (SCHOOL DISTRICT)
CERRITOS ELEMENTARY (3731 CERRITOS in ANAHEIM, CA)
(National Center for Education Statistics) - STATE ID-6030456 Organizations: SAVANNA ELEMENTARY (SCHOOL DISTRICT)
BADEN-POWELL ELEMENTARY (2911 STONYBROOK DR. in ANAHEIM, CA)
(National Center for Education Statistics) - STATE ID-6029128 Organizations: MAGNOLIA ELEMENTARY (SCHOOL DISTRICT)
MINIT LUBE 1584 (3524 W BALL RD in ANAHEIM, CA)
(Resource Conservation and Recovery Act (tracking hazardous waste)) Organizations: QUAKER STATE MINIT-LUBE INC (CONTACT/OWNER)
Housing units lacking complete plumbing facilities: 0.7% Housing units lacking complete kitchen facilities: 5.2%
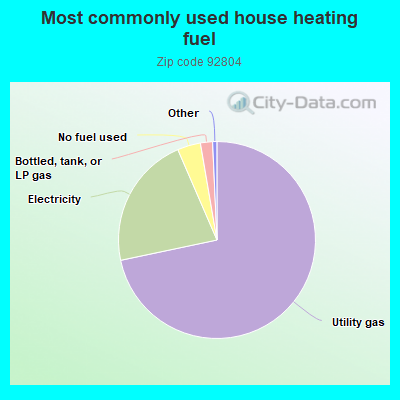
71.7%Utility gas
21.8%Electricity
3.8%No fuel used
2.0%Bottled, tank, or LP gas
Population in 1990: 63,622. Population change in the 1990s: +17,695 (+27.8%).
Place of birth for U.S.-born residents:
This state: 43,200
Northeast: 1,432
Midwest: 1,874
South: 1,743
West: 2,173
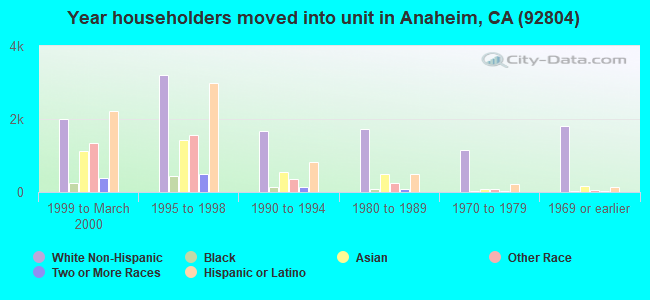
47% of the 92804 zip code residents lived in the same house 5 years ago. Out of people who lived in different houses, 75% lived in this county. Out of people who lived in different counties, 50% lived in California.
91% of the 92804 zip code residents lived in the same house 1 year ago. Out of people who lived in different houses, 60% moved from this county. Out of people who lived in different houses, 28% moved from different county within same state. Out of people who lived in different houses, 7% moved from different state. Out of people who lived in different houses, 6% moved from abroad.
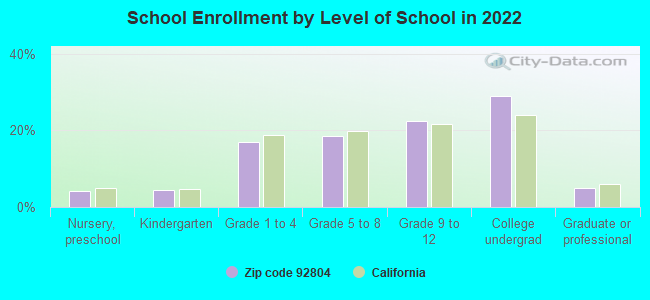
Private vs. public school enrollment:
Students in private schools in grades 1 to 8 (elementary and middle school): 605
Here:
7.7%
California:
10.5%
Students in private schools in grades 9 to 12 (high school): 130
Here:
2.6%
California:
8.5%
Students in private undergraduate colleges: 800
Here:
12.4%
California:
15.9%
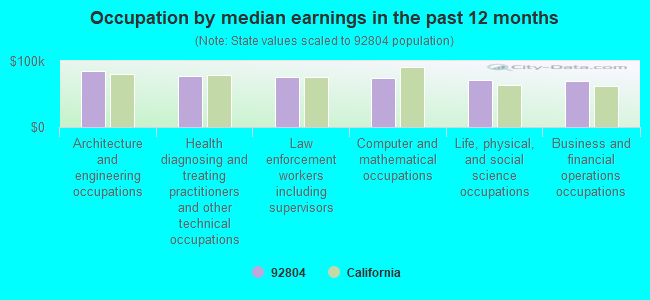
Occupation by median earnings in the past 12 months ($)
84,547Architecture and engineering occupations
77,422Health diagnosing and treating practitioners and other technical occupations
75,557Law enforcement workers including supervisors
73,624Computer and mathematical occupations
71,414Life, physical, and social science occupations
69,613Business and financial operations occupations
Companies with federal contracts located in this zip code:
GENERAL MARINE & FABRICATION, (11962 SANDY DR in ANAHEIM, LA; small business) : $733,886 in 13 contractsfrom 1999 to 2003
Contracts for Scaffolding Equipment and Concrete Forms, Aircraft Ground Servicing Equipment, Miscellaneous Materials Handling Equipment, Wallboard, Building Paper, and Thermal Insulation Materials, and moreby Army, Navy, Department of Defense, U.S. Army Corps of Engineers - civil program financing only, and others Signed by year:2000: $2,512; 2001: $66,706; 2002: $107,287; 2003: $413,842; 2004: $0; 2005: $0; 2006: $0.
Biggest contracts:
$160,860 with Army for Scaffolding Equipment and Concrete Forms. Taking place in LA. Signed on 2003-09-26. Completion date: 2003-12-26.
$143,539 with Army for Aircraft Ground Servicing Equipment. Taking place in LA. Signed on 1999-10-07. Completion date: 2000-03-05.
$113,505 with Army for Miscellaneous Materials Handling Equipment. Taking place in LA. Signed on 2003-05-07. Completion date: 2003-08-06.
$110,977 with Navy for Wallboard, Building Paper, and Thermal Insulation Materials. Taking place in LA. Signed on 2003-09-27. Completion date: 2003-12-05.
GENERAL LANDSCAPE & MAINTENANC (1825 W.ORANGEAVE SUITE D in ANAHEIM, CA; small business) : $535,167 in 9 contractsfrom 1999 to 2000
Contracts for Maintenance, Repair or Alteration of Real Property -- Family Housing Facilities, Construction of Structures and Facilities -- Other Conservation and Development Facilities by Air Force, U.S. Army Corps of Engineers - civil program financing only Signed by year:2000: -$162,177; 2001: $0; 2002: $0; 2003: $0; 2004: $0; 2005: $0; 2006: $0.
Biggest contracts:
$702,823 with Air Force for Maintenance, Repair or Alteration of Real Property -- Family Housing Facilities. Taking place in DE. Signed on 1999-10-12. Completion date: 2000-03-31.
$117,137, same as above.Signed on 2000-05-01. Completion date: 2000-05-31.
$117,137, same as above.Signed on 2000-04-03. Completion date: 2000-04-30.
$79,950, same as above.Signed on 2000-05-19. Completion date: 2000-06-30.
TONI DONESKE (3541 W CERRITOS AVE APT2 in ANAHEIM, CA; small business) : $42,391 in 6 contractsfrom 2003 to 2006
Contracts for Other Professional Services, Food Services by Army Signed by year:2000: $0; 2001: $0; 2002: $0; 2003: $32,426; 2004: $1,739; 2005: $726; 2006: $7,500.
Biggest contracts:
$17,363 with Army for Other Professional Services. Signed on 2003-11-14. Completion date: 2003-11-28.
$12,168, same as above.Signed on 2003-11-21. Completion date: 2003-11-28.
$7,500 with Army for Food Services. Signed on 2006-05-26. Completion date: 2006-06-03.
$2,895 with Army for Other Professional Services. Signed on 2003-12-11. Completion date: 2003-12-18.
abc control systems, inc. (2951 west ball road in ahaheim, ca; small business)
$332 with Bureau of Prisoners/Federal Prison System for Resistors. Taking place in CO. Signed on 2004-12-29. Completion date: 2005-01-05.
Top industries in this zip code by the number of employees in 2005:
Health Care and Social Assistance: Offices of Physical, Occupational and Speech Therapists, and Audiologists (over 1000 employees: 1 establishment, 1-4 employees: 2 establishments)
Health Care and Social Assistance: Nursing Care Facilities (100-249: 4, 50-99: 1, 20-49: 1, 10-19: 1, 1-4: 4)
2005 - 2018 National Fire Incident Reporting System (NFIRS) incidents
According to the data from the years 2005 - 2018 the average number of fire incidents per year is 51. The highest number of fire incidents - 84 took place in 2005, and the least - 0 in 2011. The data has a decreasing trend.
When looking into fire subcategories, the most incidents belonged to: Structure Fires (39.8%), and Outside Fires (34.7%).
Fire incident types reported to NFIRS in Zip Code 92804

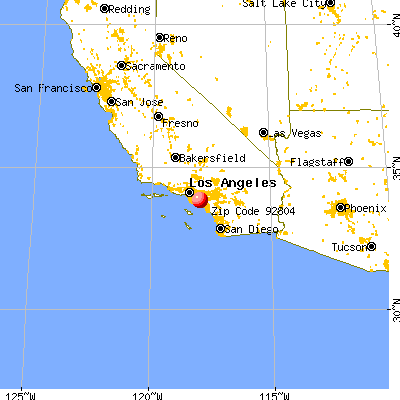


 Nearest zip codes: 90680, 92841, 92801, 90620, 92802, 92844.


 According to the data from the years 2005 - 2018 the average number of fire incidents per year is 51. The highest number of fire incidents - 84 took place in 2005, and the least - 0 in 2011. The data has a decreasing trend.
 When looking into fire subcategories, the most incidents belonged to: Structure Fires (39.8%), and Outside Fires (34.7%).