Garden Grove: Fire Incidents, California (CA)
Where are fire incidents reported in Garden Grove, CA
Something went wrong! Please refresh the page.
| Fire incidents reported | |
|---|---|
| Sreet name | Count |
| HARBOR BLVD | 154 |
| CHAPMAN AVE | 120 |
| GARDEN GROVE BLVD | 112 |
| LAMPSON AVE | 80 |
| BROOKHURST ST | 74 |
| WESTMINSTER AVE | 72 |
| KATELLA AVE | 60 |
| EUCLID ST | 52 |
| HASTER ST | 48 |
| TRASK AVE | 44 |
| MAGNOLIA ST | 42 |
| MONARCH ST | 38 |
| VALLEY VIEW ST | 36 |
| LARSON AVE | 26 |
| STANFORD AVE | 26 |
| WOODBURY RD | 26 |
| DALE ST | 24 |
| GARDEN GROVE | 24 |
| ORANGEWOOD AVE | 24 |
| WEST ST | 24 |
| WESTMINSTER | 24 |
| BIXBY AVE | 22 |
| KNOTT ST | 22 |
| STUART DR | 22 |
| WESTERN AVE | 22 |
| BROOKHURST | 20 |
| GILBERT ST | 20 |
| PALMA VISTA AVE | 20 |
| SUNSWEPT AVE | 20 |
| ACACIA AVE | 18 |
| Other | 806 |
2005 - 2018 National Fire Incident Reporting System (NFIRS) incidents
- Incident types reported to NFIRS in Garden Grove, CA
- 6,05753.0%Rescue & EMS
- 2,17519.0%Good Intent Call
- 2,12218.6%Fire
- 5324.7%Hazardous Condition
- 3733.3%Service Call
- 1571.4%False Alarm
- Fire incident types reported to NFIRS in Garden Grove, CA
- 74635.2%Structure Fires
- 71833.8%Outside Fires
- 40919.3%Mobile Property/Vehicle Fires
- 24911.7%Other
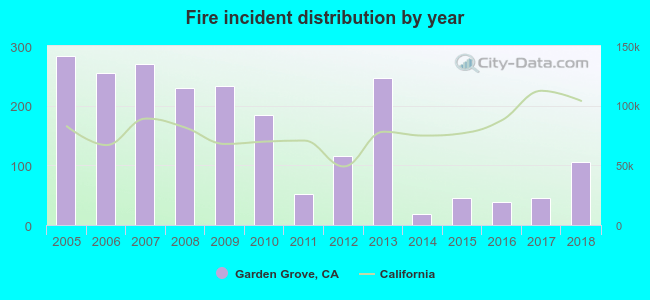 Based on the data from the years 2005 - 2018 the average number of fires per year is 152. The highest number of fire incidents - 284 took place in 2005, and the least - 18 in 2014. The data has a decreasing trend.
The average number of yearly fire incidents per 10k residents in Garden Grove, CA compared to nearest cities:
(Note: Based on data for the last 3 years, including only cities with population 5,000 and above)
| Garden Grove: | 3.6 |
| Stanton: | 12.4 |
| Westminster: | 13.8 |
| Midway City: | 10.2 |
| Fountain Valley: | 2.5 |
| Santa Ana: | 14.7 |
| Cypress: | 8.7 |
| Anaheim: | 11.0 |
| Buena Park: | 14.2 |
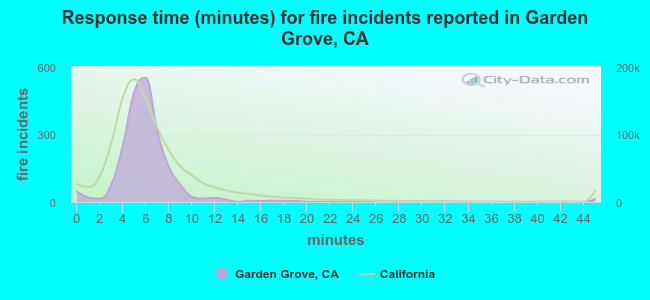 The median response time based on all reported fire incidents is 6 minutes. This is similar to the California median value.
The median response time in Garden Grove, CA compared to nearest cities:
(Note: Based on data for all years, including only cities with at least 500 fire incidents)
| Garden Grove: | 6 minutes |
| Stanton: | 5 minutes |
| Westminster: | 5 minutes |
| Fountain Valley: | 6 minutes |
| Santa Ana: | 5 minutes |
| Cypress: | 5 minutes |
| Anaheim: | 6 minutes |
| Buena Park: | 5 minutes |
| Huntington Beach: | 6 minutes |
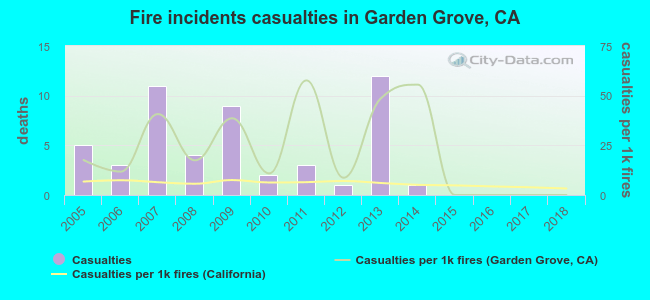 Based on the data from the years 2005 - 2018 the average number of fire-related yearly casualties is 4. The highest number of injuries - 12 took place in 2013, and the lowest - 0 in 2015. The data has a decreasing trend.
The average number of injuries per 1,000 fire incidents is 22. This indicator was the highest - 58 in 2011, and the lowest 0 in 2015. The trend for injuries per 1,000 fires is decreasing. Compared to the state value the number of casualties per 1,000 fires is much higher.
Based on the data from the years 2005 - 2018 the average number of fire-related yearly casualties is 4. The highest number of injuries - 12 took place in 2013, and the lowest - 0 in 2015. The data has a decreasing trend.
The average number of injuries per 1,000 fire incidents is 22. This indicator was the highest - 58 in 2011, and the lowest 0 in 2015. The trend for injuries per 1,000 fires is decreasing. Compared to the state value the number of casualties per 1,000 fires is much higher.Casualties per 1,000 incidents in Garden Grove, CA compared to nearest cities:
(Note: Based on data for all years, including only cities with at least 500 fire incidents)
| Garden Grove: | 24.0 |
| Stanton: | 24.7 |
| Westminster: | 24.0 |
| Fountain Valley: | 31.9 |
| Santa Ana: | 16.8 |
| Cypress: | 24.5 |
| Anaheim: | 4.3 |
| Buena Park: | 22.3 |
| Huntington Beach: | 31.1 |
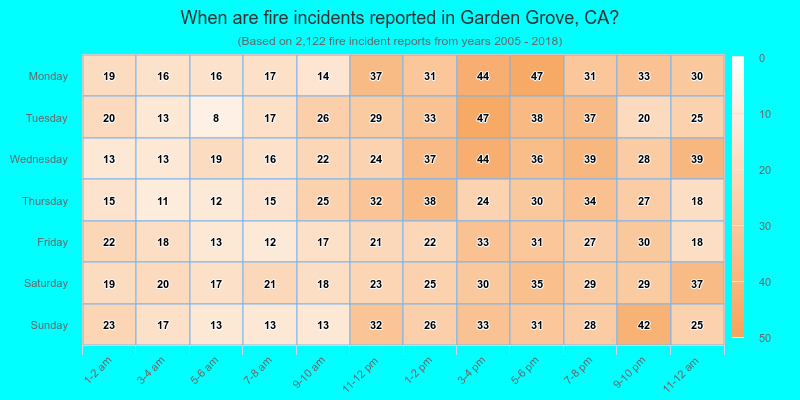
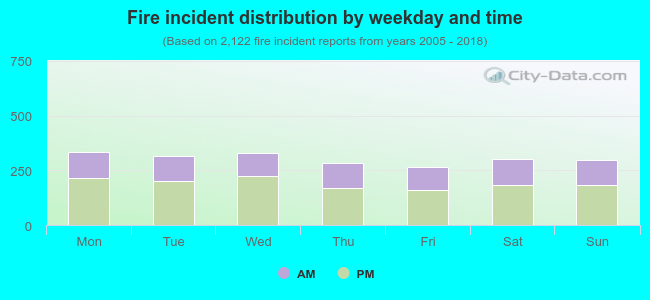 36.8% incidents where reported in the morning and 63.2% in the evening. The most fires (15.8%) took place on Monday, and the least (12.4%) on Friday.
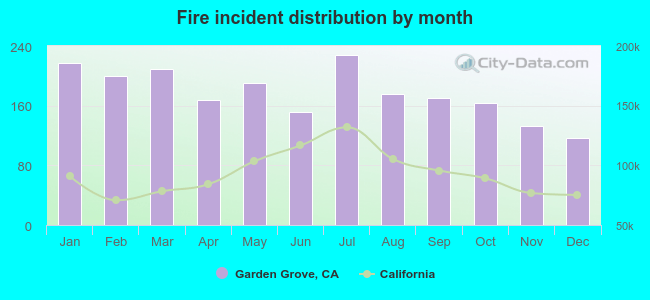 According to the 2,122 fire incidents from years 2005 - 2018 most fires (10.7%) took place during July, and the least (5.5%) in December.
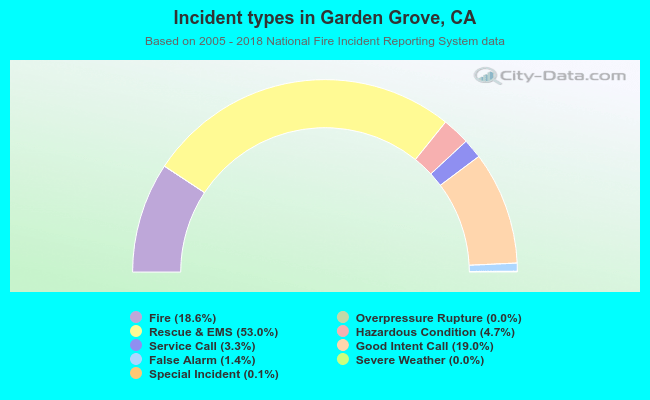 Out of all 11,428 cases reported during the years 2005 - 2018, the most belonged to the categories: Rescue & EMS (53.0%), Good Intent Call (19.0%), and Fire (18.6%).
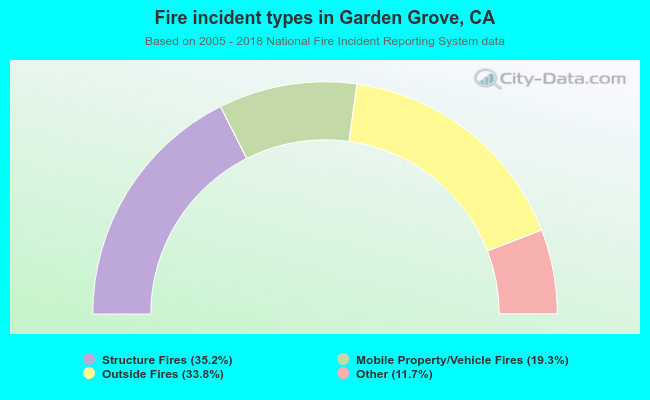 When looking into fire subcategories, the most reports belonged to: Structure Fires (35.2%), and Outside Fires (33.8%).