Estimated zip code population in 2022: 36,244 Zip code population in 2010: 36,457 Zip code population in 2000: 37,871
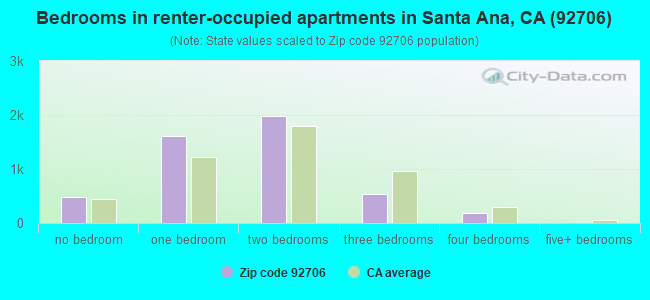
Houses and condos: 10,420 Renter-occupied apartments: 4,799
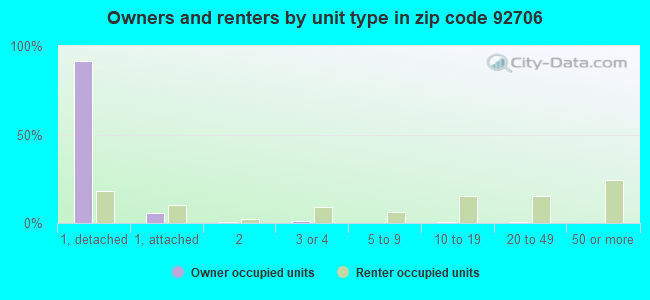
% of renters here:
47%
State:
44%
March 2022 cost of living index in zip code 92706: 87.5 (less than average, U.S. average is 100)
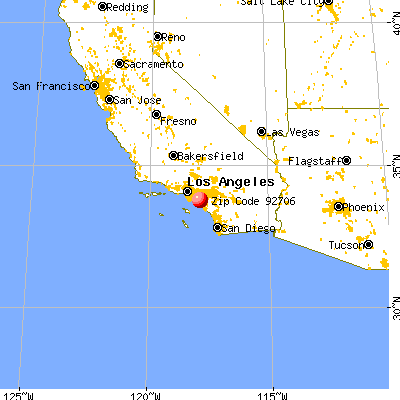
Land area: 3.4 sq. mi. Water area: 0.1 sq. mi.
Population density: 10,635 people per square mile
(high).
OSM Map
General Map
Google Map
MSN Map
OSM Map
General Map
Google Map
MSN Map
OSM Map
General Map
Google Map
MSN Map
OSM Map
General Map
Google Map
MSN Map
Please wait while loading the map...
Real estate property taxes paid for housing units in 2022:
This zip code:
0.6% ($5,089)
California:
0.7% ($4,831)
Median real estate property taxes paid for housing units with mortgages in 2022: $5,240 (0.6%) Median real estate property taxes paid for housing units with no mortgage in 2022: $4,874 (0.5%)
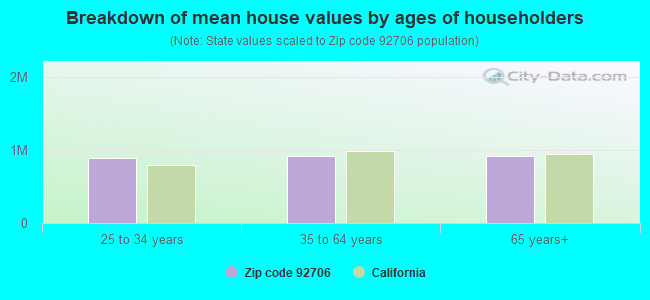
Estimated median house/condo value in 2022: $839,578
92706:
$839,578
California:
$715,900
According to our research of California and other state lists, there were 37 registered sex offenders living in 92706 zip code as of April 27, 2024. The ratio of all residents to sex offenders in zip code 92706 is 1,006 to 1. The ratio of registered sex offenders to all residents in this zip code is lower than the state average.
Median resident age:
This zip code:
37.1 years
California median age:
37.9 years
Average household size:
This zip code:
3.5 people
California:
2.8 people
Averages for the 2020 tax year for zip code 92706, filed in 2021:
Average Adjusted Gross Income (AGI) in 2020: $61,066 (Individual Income Tax Returns)
Here:
$61,066
State:
$95,910
Salary/wage: $53,738 (reported on 84.3% of returns)
Here:
$53,738
State:
$77,331
(% of AGI for various income ranges: 1390.3% for AGIs below $25k, 4322.0% for AGIs $25k-50k, 7748.4% for AGIs $50k-75k, 11441.2% for AGIs $75k-100k, 21030.0% for AGIs $100k-200k, 89533.7% for AGIs over 200k)
Taxable interest for individuals: $977 (reported on 27.6% of returns)
This zip code:
$977
California:
$2,294
(% of AGI for various income ranges: 9.2% for AGIs below $25k, 12.2% for AGIs $25k-50k, 29.0% for AGIs $50k-75k, 62.5% for AGIs $75k-100k, 125.9% for AGIs $100k-200k, 932.1% for AGIs over 200k)
Ordinary dividends: $5,547 (reported on 10.7% of returns)
Here:
$5,547
State:
$10,949
(% of AGI for various income ranges: 10.6% for AGIs below $25k, 19.2% for AGIs $25k-50k, 62.4% for AGIs $50k-75k, 114.0% for AGIs $75k-100k, 297.3% for AGIs $100k-200k, 2395.8% for AGIs over 200k)
Net capital gain/loss in AGI: +$12,404 (reported on 11.5% of returns)
Here:
+$12,404
State:
+$49,306
(% of AGI for various income ranges: 4.8% for AGIs below $25k, 13.5% for AGIs $25k-50k, 42.8% for AGIs $50k-75k, 111.6% for AGIs $75k-100k, 545.2% for AGIs $100k-200k, 9222.1% for AGIs over 200k)
Profit/loss from business: +$11,790 (reported on 17.8% of returns)
Here:
+$11,790
State:
+$15,671
(% of AGI for various income ranges: 255.8% for AGIs below $25k, 161.4% for AGIs $25k-50k, 212.7% for AGIs $50k-75k, 386.6% for AGIs $75k-100k, 632.4% for AGIs $100k-200k, 4536.3% for AGIs over 200k)
Taxable individual retirement arrangement distribution: $22,103 (reported on 3.9% of returns)
92706:
$22,103
California:
$23,505
(% of AGI for various income ranges: 16.5% for AGIs below $25k, 31.0% for AGIs $25k-50k, 84.8% for AGIs $50k-75k, 194.2% for AGIs $75k-100k, 581.1% for AGIs $100k-200k, 2722.1% for AGIs over 200k)
Self-employed (Keogh) retirement plans: $30,114 (reported on 0.4% of returns)
92706:
$30,114
California:
$30,163
(% of AGI for various income ranges: 50.7% for AGIs $100k-200k, 866.8% for AGIs over 200k)
Total itemized deductions: $33,474 (reported on 13.1% of returns)
Here:
$33,474
State:
$39,517
(% of AGI for various income ranges: 58.8% for AGIs below $25k, 147.8% for AGIs $25k-50k, 470.9% for AGIs $50k-75k, 1231.7% for AGIs $75k-100k, 3125.9% for AGIs $100k-200k, 11803.7% for AGIs over 200k)
Charity contributions: $6,359 (reported on 11.0% of returns)
Here:
$6,359
State:
$12,598
(% of AGI for various income ranges: 5.0% for AGIs below $25k, 16.6% for AGIs $25k-50k, 53.2% for AGIs $50k-75k, 143.5% for AGIs $75k-100k, 464.9% for AGIs $100k-200k, 2660.5% for AGIs over 200k)
Taxes paid: $8,712 (reported on 13.1% of returns)
92706:
$8,712
State:
$8,807
(% of AGI for various income ranges: 14.7% for AGIs below $25k, 37.6% for AGIs $25k-50k, 131.7% for AGIs $50k-75k, 370.5% for AGIs $75k-100k, 921.2% for AGIs $100k-200k, 2307.4% for AGIs over 200k)
Earned income credit: $2,165 (reported on 16.1% of returns)
Here:
$2,165
State:
$2,074
(% of AGI for various income ranges: 91.2% for AGIs below $25k, 71.2% for AGIs $25k-50k, 1.0% for AGIs $50k-75k)
Percentage of individuals using paid preparers for their 2020 taxes: 93.0%
Here:
93%
State:
92%
(% for various income ranges: 91.5% for AGIs below $25k, 93.9% for AGIs $25k-50k, 93.3% for AGIs $50k-75k, 93.8% for AGIs $75k-100k, 93.5% for AGIs $100k-200k, 95.5% for AGIs over 200k)
Averages for the 2012 tax year for zip code 92706, filed in 2013:
Average Adjusted Gross Income (AGI) in 2012: $46,704 (Individual Income Tax Returns)
Here:
$46,704
State:
$72,726
Salary/wage: $41,715 (reported on 85.8% of returns)
Here:
$41,715
State:
$59,079
(% of AGI for various income ranges: 80.7% for AGIs below $25k, 87.1% for AGIs $25k-50k, 80.4% for AGIs $50k-75k, 80.0% for AGIs $75k-100k, 77.4% for AGIs $100k-200k, 56.3% for AGIs over 200k)
Taxable interest for individuals: $1,112 (reported on 25.9% of returns)
This zip code:
$1,112
California:
$2,146
(% of AGI for various income ranges: 0.4% for AGIs below $25k, 0.5% for AGIs $25k-50k, 0.7% for AGIs $50k-75k, 0.4% for AGIs $75k-100k, 0.6% for AGIs $100k-200k, 1.0% for AGIs over 200k)
Ordinary dividends: $4,517 (reported on 9.9% of returns)
Here:
$4,517
State:
$9,308
(% of AGI for various income ranges: 0.6% for AGIs below $25k, 0.5% for AGIs $25k-50k, 1.0% for AGIs $50k-75k, 1.0% for AGIs $75k-100k, 1.2% for AGIs $100k-200k, 1.4% for AGIs over 200k)
Net capital gain/loss in AGI: +$8,259 (reported on 8.6% of returns)
Here:
+$8,259
State:
+$30,460
(% of AGI for various income ranges: 0.9% for AGIs $100k-200k, 7.5% for AGIs over 200k)
Profit/loss from business: +$13,094 (reported on 16.6% of returns)
Here:
+$13,094
State:
+$17,064
(% of AGI for various income ranges: 11.5% for AGIs below $25k, 4.5% for AGIs $25k-50k, 3.2% for AGIs $50k-75k, 2.5% for AGIs $75k-100k, 3.5% for AGIs $100k-200k, 3.7% for AGIs over 200k)
Taxable individual retirement arrangement distribution: $15,351 (reported on 4.7% of returns)
92706:
$15,351
California:
$19,557
(% of AGI for various income ranges: 0.9% for AGIs below $25k, 0.9% for AGIs $25k-50k, 1.9% for AGIs $50k-75k, 1.5% for AGIs $75k-100k, 2.5% for AGIs $100k-200k, 1.4% for AGIs over 200k)
Self-employment retirement plans: $21,300 (reported on 0.4% of returns)
92706:
$21,300
California:
$24,530
Total itemized deductions: $27,662 (27% of AGI, reported on 27.7% of returns)
Here:
$27,662
State:
$34,004
Here:
27.3% of AGI
State:
22.7% of AGI
(% of AGI for various income ranges: 6.4% for AGIs below $25k, 11.0% for AGIs $25k-50k, 18.6% for AGIs $50k-75k, 21.5% for AGIs $75k-100k, 21.2% for AGIs $100k-200k, 19.1% for AGIs over 200k)
Charity contributions: $3,634 (reported on 23.1% of returns)
Here:
$3,634
State:
$4,659
(% of AGI for various income ranges: 0.3% for AGIs below $25k, 0.9% for AGIs $25k-50k, 1.8% for AGIs $50k-75k, 1.9% for AGIs $75k-100k, 2.4% for AGIs $100k-200k, 3.1% for AGIs over 200k)
Taxes paid: $9,023 (reported on 27.6% of returns)
92706:
$9,023
State:
$14,448
(% of AGI for various income ranges: 1.2% for AGIs below $25k, 2.3% for AGIs $25k-50k, 4.7% for AGIs $50k-75k, 6.4% for AGIs $75k-100k, 7.4% for AGIs $100k-200k, 8.9% for AGIs over 200k)
Earned income credit: $2,442 (reported on 21.3% of returns)
Here:
$2,442
State:
$2,286
(% of AGI for various income ranges: 6.2% for AGIs below $25k, 1.3% for AGIs $25k-50k)
Percentage of individuals using paid preparers for their 2012 taxes: 78.9%
Here:
79%
State:
64%
(% for various income ranges: 80.1% for AGIs below $25k, 80.1% for AGIs $25k-50k, 76.8% for AGIs $50k-75k, 75.0% for AGIs $75k-100k, 72.6% for AGIs $100k-200k, 79.4% for AGIs over 200k)
Averages for the 2004 tax year for zip code 92706, filed in 2005:
Average Adjusted Gross Income (AGI) in 2004: $42,714 (Individual Income Tax Returns)
Here:
$42,714
State:
$58,600
Salary/wage: $38,546 (reported on 87.0% of returns)
Here:
$38,546
State:
$49,455
(% of AGI for various income ranges: 120.0% for AGIs below $10k, 85.9% for AGIs $10k-25k, 87.6% for AGIs $25k-50k, 82.7% for AGIs $50k-75k, 81.5% for AGIs $75k-100k, 64.7% for AGIs over 100k)
Taxable interest for individuals: $1,473 (reported on 37.4% of returns)
This zip code:
$1,473
California:
$2,365
(% of AGI for various income ranges: 3.8% for AGIs below $10k, 1.1% for AGIs $10k-25k, 1.0% for AGIs $25k-50k, 0.9% for AGIs $50k-75k, 1.0% for AGIs $75k-100k, 1.7% for AGIs over 100k)
Taxable dividends: $3,276 (reported on 14.3% of returns)
Here:
$3,276
State:
$4,746
(% of AGI for various income ranges: 3.3% for AGIs below $10k, 0.8% for AGIs $10k-25k, 0.7% for AGIs $25k-50k, 1.0% for AGIs $50k-75k, 0.9% for AGIs $75k-100k, 1.6% for AGIs over 100k)
Net capital gain/loss: +$12,136 (reported on 11.8% of returns)
Here:
+$12,136
State:
+$23,418
(% of AGI for various income ranges: -1.2% for AGIs below $10k, -0.0% for AGIs $10k-25k, 0.1% for AGIs $25k-50k, 0.8% for AGIs $50k-75k, 0.6% for AGIs $75k-100k, 9.2% for AGIs over 100k)
Profit/loss from business: +$13,566 (reported on 15.1% of returns)
Here:
+$13,566
State:
+$16,826
(% of AGI for various income ranges: 26.3% for AGIs below $10k, 6.8% for AGIs $10k-25k, 3.3% for AGIs $25k-50k, 4.4% for AGIs $50k-75k, 4.1% for AGIs $75k-100k, 4.7% for AGIs over 100k)
IRA payment deduction: $3,222 (reported on 1.9% of returns)
92706:
$3,222
California:
$3,192
(% of AGI for various income ranges: 0.4% for AGIs below $10k, 0.1% for AGIs $10k-25k, 0.1% for AGIs $25k-50k, 0.2% for AGIs $50k-75k, 0.2% for AGIs $75k-100k, 0.1% for AGIs over 100k)
Self-employed pension: $12,206 (reported on 0.8% of returns)
Here:
$12,206
California:
$17,688
Total itemized deductions: $25,877 (32% of AGI, reported on 34.0% of returns)
Here:
$25,877
State:
$28,113
Here:
32.0% of AGI
State:
25.3% of AGI
(% of AGI for various income ranges: 18.3% for AGIs below $10k, 10.1% for AGIs $10k-25k, 21.5% for AGIs $25k-50k, 23.5% for AGIs $50k-75k, 25.1% for AGIs $75k-100k, 21.0% for AGIs over 100k)
Charity contributions deductions: $3,109 (4% of AGI, reported on 29.9% of returns)
Here:
$3,109
State:
$3,923
Here:
3.6% of AGI
State:
3.3% of AGI
(% of AGI for various income ranges: 1.0% for AGIs below $10k, 0.6% for AGIs $10k-25k, 1.4% for AGIs $25k-50k, 2.3% for AGIs $50k-75k, 2.7% for AGIs $75k-100k, 3.1% for AGIs over 100k)
Total tax: $6,299 (reported on 65.0% of returns)
92706:
$6,299
State:
$10,761
(% of AGI for various income ranges: 5.6% for AGIs below $10k, 3.1% for AGIs $10k-25k, 4.9% for AGIs $25k-50k, 7.3% for AGIs $50k-75k, 9.2% for AGIs $75k-100k, 16.6% for AGIs over 100k)
Earned income credit: $1,885 (reported on 18.3% of returns)
Here:
$1,885
State:
$1,763
Percentage of individuals using paid preparers for their 2004 taxes: 76.2%
Here:
76%
State:
66%
(% for various income ranges: 68.2% for AGIs below $10k, 78.6% for AGIs $10k-25k, 77.6% for AGIs $25k-50k, 76.1% for AGIs $50k-75k, 76.1% for AGIs $75k-100k, 76.5% for AGIs over 100k)
Likely homosexual households (counted as self-reported same-sex unmarried-partner households)
Lesbian couples: 0.2% of all households
Gay men: 0.2% of all households
Household received Food Stamps/SNAP in the past 12 months: 988 Household did not receive Food Stamps/SNAP in the past 12 months: 9,140
Women who had a birth in the past 12 months: 407 (270 now married, 137 unmarried) Women who did not have a birth in the past 12 months: 8,209 (3,426 now married, 4,775 unmarried)
Housing units in zip code 92706 with a mortgage: 4,163 (475 second mortgage, 448 both second mortgage and home equity loan) Houses without a mortgage: 67
Median monthly owner costs for units with a mortgage: $2,795 Median monthly owner costs for units without a mortgage: $747
Residents with income below the poverty level in 2022:
This zip code:
12.0%
Whole state:
12.2%
Residents with income below 50% of the poverty level in 2022:
This zip code:
5.7%
Whole state:
6.2%
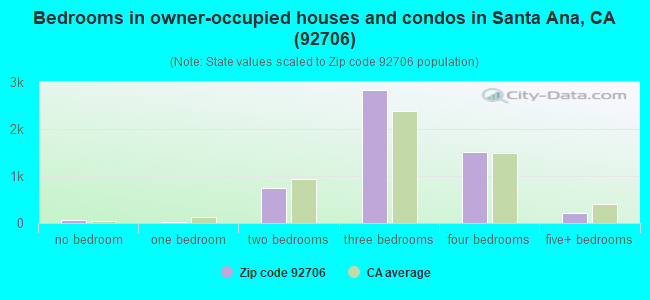
Median number of rooms in houses and condos:
Here:
6.0
State:
6.0
Median number of rooms in apartments:
Here:
3.6
State:
3.9
Notable locations in this zip code not listed on our city pages
Notable locations in zip code 92706: Riverview Golf Course (A), Bowers Museum of Cultural Art (B), Discovery Science Center (C), Russell Hall (D), Phillips Hall Theatre (E), Nealley Library (F), Johnson Campus Center (G), Hammond Hall (H), Dunlop Hall (I), Cook Gymnasium (J), Cesar Chavez Building (K), Santa Ana Fire Department Station 1 (L). Display/hide their locations on the map
Churches in zip code 92706 include: First Baptist Church of Santa Ana (A), First Christian Church of Santa Ana (B), Saint Peter Lutheran Church (C), Santa Ana Congregational Church (D), Seventh Day Adventist Church (E), Vietnamese First Christian Church (F), Wintersburg Presbyterian Church (G). Display/hide their locations on the map
Parks in zip code 92706 include: William W Eldridge Park (1), Alona Park (2), Fisher Park (3), Edna Park (4), Leonard Park (5). Display/hide their locations on the map
4,914 married couples with children.
1,589 single-parent households (473 men, 1,116 women).
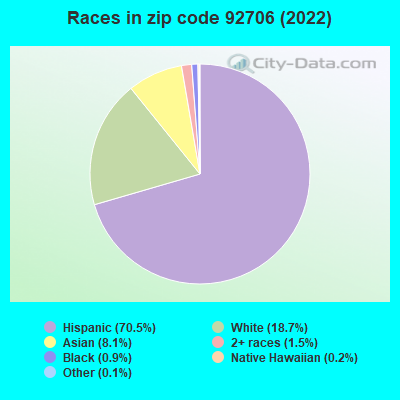
31.5% of residents of 92706 zip code speak English at home.
60.8% of residents speak Spanish at home (59% very well, 15% well, 18% not well, 7% not at all).
1.2% of residents speak other Indo-European language at home (67% very well, 23% well, 10% not well).
5.9% of residents speak Asian or Pacific Island language at home (38% very well, 26% well, 27% not well, 9% not at all).
0.4% of residents speak other language at home (76% very well, 24% well).
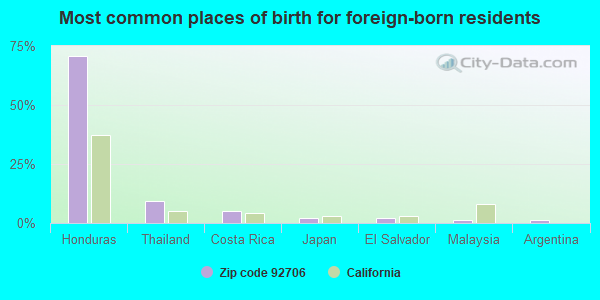
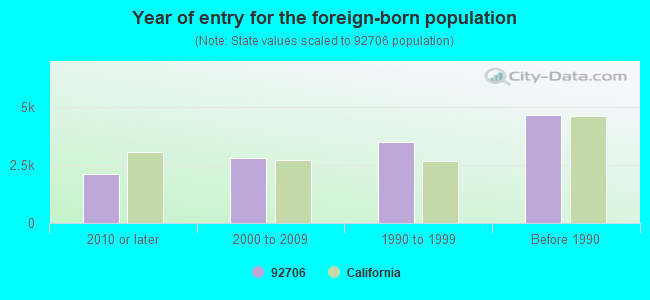
Foreign born population: 12,258 (33.8%) (45.0% of them are naturalized citizens)
Major facilities with environmental interests located in this zip code:
EQUILON ENTERPRISES (2641 N BRISTOL/ MEMORY LANE in SANTA ANA, CA) . Federal Facility
STATE MASTER (California - Hazardous Waste Tracking) - HAZARDOU WASTE PROGRAM Large Quantity Generators, more that 1000 kg of hazardous waste/month (Resource Conservation and Recovery Act (tracking hazardous waste)) Organizations: SHELL OIL PRODUCTS US (CONTACT/OPERATOR)
, EQUILON ENTERPRISES LLC DBA SHELL OIL PR (CONTACT/OWNER)
Alternative names: SHELL OIL CO
A & A CURTAIN CLEANERS (2019 N MAIN in SANTA ANA, CA)
STATE MASTER (California - Hazardous Waste Tracking) - HAZARDOU WASTE PROGRAM Small Quantity Generators, between 100 kg and 1000 kg of hazardous waste/month (Resource Conservation and Recovery Act (tracking hazardous waste)) - notification Organizations: JIM PEIRCE (CONTACT/OWNER)
ICI DULUX PAINTS (301 E SEVENTEEN ST in SANTA ANA, CA)
STATE MASTER (California - Hazardous Waste Tracking) - HAZARDOU WASTE PROGRAM Small Quantity Generators, between 100 kg and 1000 kg of hazardous waste/month (Resource Conservation and Recovery Act (tracking hazardous waste)) - notification Organizations: THE GLIDDEN CO (CONTACT/OWNER)
Alternative names: THE GLIDDEN CO DBA ICI PAINTS
CHEVRON STATION NO 94836 (400 E 17TH ST in SANTA ANA, CA)
STATE MASTER (California - Hazardous Waste Tracking) - HAZARDOU WASTE PROGRAM Small Quantity Generators, between 100 kg and 1000 kg of hazardous waste/month (Resource Conservation and Recovery Act (tracking hazardous waste)) - notification Organizations: CHEVRON PRODUCTS CO (CONTACT/OWNER)
HOOVER ELEMENTARY (408 E. SANTA CLARA AVE. in SANTA ANA, CA)
(National Center for Education Statistics) - STATE ID-6030274 Organizations: SANTA ANA UNIFIED (SCHOOL DISTRICT)
MENDEZ (GONZALO FELICITAS) FUNDAMENTAL INTERMEDIAT (2000 N. BRISTOL in SANTA ANA, CA)
(National Center for Education Statistics) - STATE ID-6117899 Organizations: SANTA ANA UNIFIED (SCHOOL DISTRICT)
MIDDLE COLLEGE HIGH (ALTERN) (1530 WEST 17TH ST. in SANTA ANA, CA)
(National Center for Education Statistics) - STATE ID-3030608 Organizations: SANTA ANA UNIFIED (SCHOOL DISTRICT)
CHEVRON NO 98787 (2702 N BRISTOL in SANTA ANA, CA)
HAZARDOUS WASTE BIENNIAL REPORTER (Resource Conservation and Recovery Act (tracking hazardous waste)) Large Quantity Generators, more that 1000 kg of hazardous waste/month (Resource Conservation and Recovery Act (tracking hazardous waste)) - notification Organizations: CHEVRON PRODUCTS CO (CONTACT/OWNER)
CALDWELLS 17TH ST AUTO BODY (2404 W 17TH ST in SANTA ANA, CA)
Small Quantity Generators, between 100 kg and 1000 kg of hazardous waste/month (Resource Conservation and Recovery Act (tracking hazardous waste)) - notification Small Quantity Generators, between 100 kg and 1000 kg of hazardous waste/month (Resource Conservation and Recovery Act (tracking hazardous waste)) Business NAICS classification: AUTOMOTIVE BODY, PAINT, AND INTERIOR REPAIR AND MAINTENANCE. Organizations: NORM & MARK PERELMAN (CONTACT/OWNER)
, TOM CALDWELL (CONTACT/OWNER)
Alternative names: CALDWELL'S 17TH ST PAINT & BODY
A Q 1HOUR PHOTO & VIDEO (1449 W 17TH ST in SANTA ANA, CA)
Small Quantity Generators, between 100 kg and 1000 kg of hazardous waste/month (Resource Conservation and Recovery Act (tracking hazardous waste)) Organizations: ONHOE KU (CONTACT/OWNER)
ED DICKENS UNION (1702 N BROADWAY in SANTA ANA, CA)
Small Quantity Generators, between 100 kg and 1000 kg of hazardous waste/month (Resource Conservation and Recovery Act (tracking hazardous waste)) - notification
CHEVRON USA (SANTA ANA & ORANGE COUNTY in SANTA ANA, CA)
National Pollutant Discharge Elimination System NON-MAJOR (Tracking pollutant discharge elimination systems) - permit
Housing units lacking complete plumbing facilities: 0.2% Housing units lacking complete kitchen facilities: 2.3%
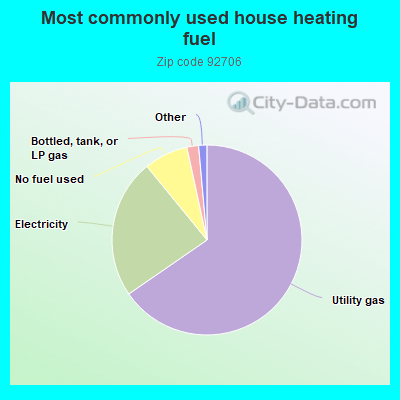
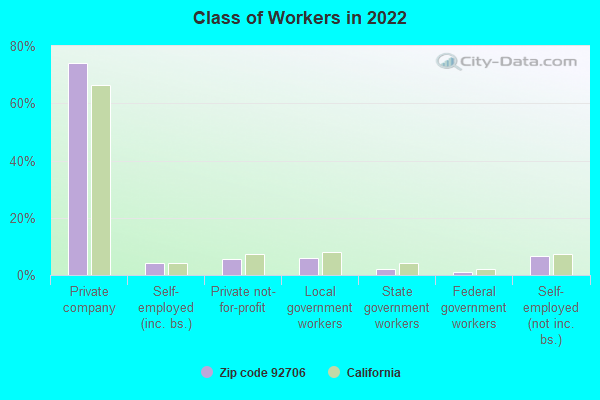
65.4%Utility gas
23.7%Electricity
7.5%No fuel used
2.0%Bottled, tank, or LP gas
0.9%Wood
0.6%Solar energy
Population in 1990: 30,673. Population change in the 1990s: +7,198 (+23.5%).
Place of birth for U.S.-born residents:
This state: 19,926
Northeast: 623
Midwest: 1,136
South: 754
West: 648
49% of the 92706 zip code residents lived in the same house 5 years ago. Out of people who lived in different houses, 87% lived in this county. Out of people who lived in different counties, 50% lived in California.
91% of the 92706 zip code residents lived in the same house 1 year ago. Out of people who lived in different houses, 69% moved from this county. Out of people who lived in different houses, 22% moved from different county within same state. Out of people who lived in different houses, 4% moved from different state. Out of people who lived in different houses, 3% moved from abroad.
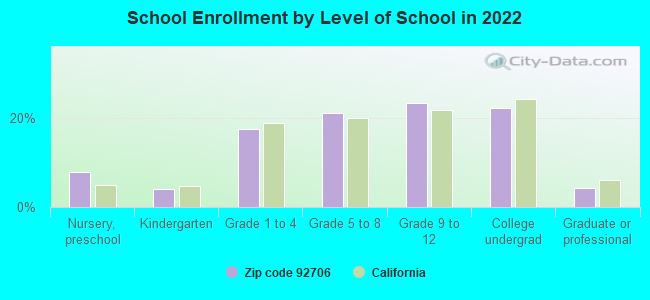
Private vs. public school enrollment:
Students in private schools in grades 1 to 8 (elementary and middle school): 347
Here:
9.8%
California:
10.5%
Students in private schools in grades 9 to 12 (high school): 219
Here:
10.2%
California:
8.5%
Students in private undergraduate colleges: 150
Here:
7.4%
California:
15.9%
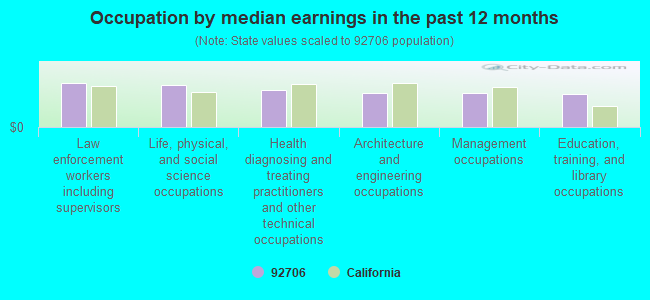
Occupation by median earnings in the past 12 months ($)
110,988Law enforcement workers including supervisors
105,925Life, physical, and social science occupations
93,765Health diagnosing and treating practitioners and other technical occupations
87,228Architecture and engineering occupations
86,105Management occupations
82,943Education, training, and library occupations
Companies with federal contracts located in this zip code:
CJW CONSTRUCTION INC (970 W 17TH ST UNIT E in SANTA ANA, CA; small business) : $4,954,614 in 13 contractsfrom 2003 to 2006
Contracts for Maintenance, Repair or Alteration of Real Property -- Dredging by Army, U.S. Army Corps of Engineers - civil program financing only Signed by year:2000: $0; 2001: $0; 2002: $0; 2003: $1,000; 2004: $3,181,684; 2005: $1,675,930; 2006: $96,000.
Biggest contracts:
$675,000 with Army for Maintenance, Repair or Alteration of Real Property -- Dredging. Signed on 2005-11-10. Completion date: 2004-12-31.
$675,000 with U.S. Army Corps of Engineers - civil program financing only for Maintenance, Repair or Alteration of Real Property -- Dredging. Signed on 2004-09-10. Completion date: 2004-12-31.
$675,000 with Army for Maintenance, Repair or Alteration of Real Property -- Dredging. Signed on 2004-09-10. Completion date: 2004-12-31.
$584,263, same as above.Signed on 2004-02-24. Completion date: 2004-12-31.
Top industries in this zip code by the number of employees in 2005:
2004 - 2018 National Fire Incident Reporting System (NFIRS) incidents
According to the data from the years 2004 - 2018 the average number of fire incidents per year is 10. The highest number of fire incidents - 82 took place in 2005, and the least - 0 in 2006. The data has an increasing trend.
When looking into fire subcategories, the most incidents belonged to: Structure Fires (45.0%), and Outside Fires (26.5%).
Fire incident types reported to NFIRS in Zip Code 92706


 Nearest zip codes: 92868, 92701, 92703, 92866, 92843, 92704.
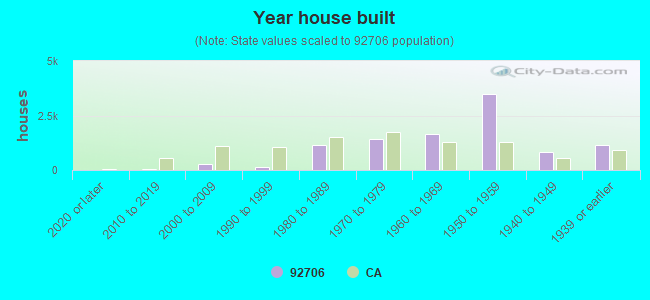


 . Federal Facility
 According to the data from the years 2004 - 2018 the average number of fire incidents per year is 10. The highest number of fire incidents - 82 took place in 2005, and the least - 0 in 2006. The data has an increasing trend.
 When looking into fire subcategories, the most incidents belonged to: Structure Fires (45.0%), and Outside Fires (26.5%).