Atlanta and Sandy Springs, both located in Georgia, offer unique amenities, opportunities, and lifestyles. Atlanta, as the state's capital and one of America's biggest metropolitan areas, is vibrant with a bustling economy, rich culture, and diverse neighborhoods. Conversely, Sandy Springs, a suburban city on Atlanta's north side, showcases quieter residential areas, reputed schools, and a family-friendly environment. This comparative analysis delves into various aspects such as crime rates, weather, cost of living, education, economy, infrastructure, and more to provide a comprehensive picture of life in both cities.
Distance between
Atlanta, GA and
Sandy Springs, GA : 12.4 miles
Atlanta's population is larger by 363%. Its population has grown by 79,987 people (19.2%) since 2000. The population of Sandy Springs has grown by 21,399 people (24.9%) during that time.
When it comes to safety, Sandy Springs has a lower crime rate compared to Atlanta. Atlanta, due to its large population size and urbanization, tends to have higher crime rates, especially in certain neighborhoods. However, Atlanta's police force is substantial and proactive in community outreach efforts. In Sandy Springs, the crime rate is less significant, reflecting its suburban nature and the tighter-knit community.
City-data.com crime index counts serious crimes and violent crime more heavily. It adjusts for the number of visitors and daily workers commuting into cities. (higher means more crime, U.S. average = 301.1)
City-data.com crime index counts serious crimes and violent crime more heavily. It adjusts for the number of visitors and daily workers commuting into cities. (higher means more crime, U.S. average = 301.1)
Sex Offenders
According to our data, there are 1,960 registered sex offenders living in Atlanta and 17 registered sex offenders living in . The ratio of residents to sex offenders in Atlanta is 241 to 1; the ratio in Sandy Springs is 6,219 to 1. The number of registered sex offenders compared to the number of residents is much larger in Atlanta than that in Sandy Springs.
Cost of Living
Living in Atlanta is generally more expensive than in Sandy Springs, largely due to the higher cost of housing. However, Sandy Springs' prices can be high, depending on the neighborhood. In both cities, other factors like transportation, groceries, and health care are relatively comparable.
Income Tax
Both cities, being in Georgia, follow the same state income tax system. Georgia's income tax rates range from 1% up to 5.75%.
Property Tax
Property taxes may vary between these two cities. Atlanta tends to have higher rates due to the higher property values, particularly in upper-end neighborhoods. In contrast, Sandy Springs has slightly lower rates.
Sales Tax
Both Atlanta and Sandy Springs apply Georgia's state sales tax rate of 4%, but with local surtaxes, Atlanta's total sales tax is 8.9%, while Sandy Springs has a total tax rate of 7%.
Income
Type
Atlanta
Sandy Springs
Estimated median household income
$74,107
$94,456
Estimated per capita income
$55,051
$76,437
Cost of living index (U.S. average is 100)
104.3
104.2
If you make $50,000 in Sandy Springs, you will have to make $50,048 in Atlanta to maintain the same standard of living.
Geographical Conditions
Both cities are located in northern Georgia, with Atlanta offering more urban landscapes, while Sandy Springs boasts more natural settings with access to the Chattahoochee River and multiple parks.
Atlanta houses some of the best universities in the nation like Georgia Tech and Emory University, making it a great location for higher education. Public schools in Atlanta vary greatly, with some highly rated and others struggling. Sandy Springs, on the other hand, is known for its excellent public and private schools, making it attractive for families.
Atlanta’s economy is robust, led by sectors such as logistics, professional and business services, media operations, and information technology. Sandy Springs, although smaller, has a strong economy propelled by the healthcare, retail, and professional services sectors. The unemployment rate is slightly lower in Sandy Springs than in Atlanta.
Biggest Employers
In Atlanta, some of the biggest employers are The Home Depot, The Coca-Cola Company, and Delta Air Lines. Sandy Springs is home to the headquarters of global companies such as UPS and Mercedes-Benz USA, making them among the largest employers in the city.
There were 855 building permits issued in Atlanta in 2012 (628 more than in 2011) compared to 260 building permits issued in Sandy Springs in 2012 (196 more than in 2011).
Weather
Both cities share a similar climate due to their close proximity. They experience a humid subtropical climate, with hot and humid summers, mild-to-chilly winters, and adequate rainfall throughout the year. Though events such as thunderstorms or occasional snowfall occur, they generally provide manageable weather conditions.
Weather and climate
Type
Atlanta
Sandy Springs
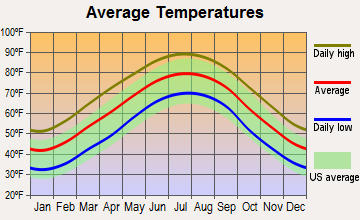
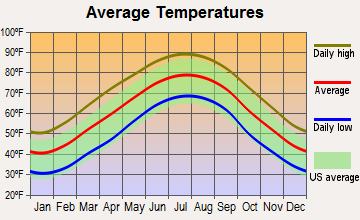
Temperature - Average
61.7°F
60.6°F
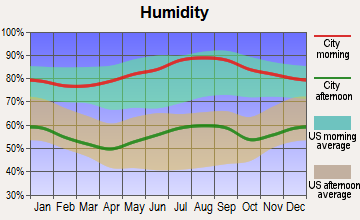
Humidity - Average morning or afternoon humidity
73.9%
74%
Humidity - Differences between morning and afternoon humidity
38%
38.1%
Humidity - Maximum monthly morning or afternoon humidity
87%
87.1%
Humidity - Minimum monthly morning or afternoon humidity
49%
49%
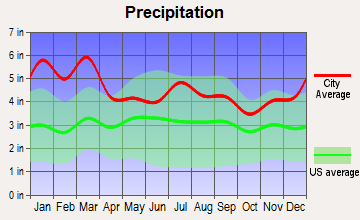
Precipitation - Yearly average
51.4 in
54.3 in
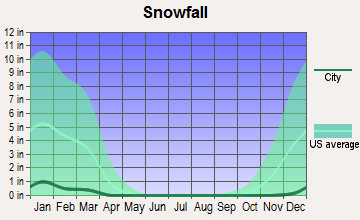
Snowfall - Yearly average
4 in
4 in
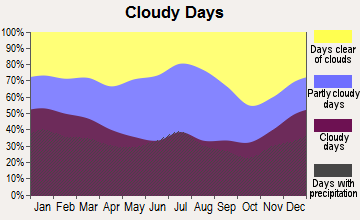
Clouds - Number of days clear of clouds
18.3%
18.4%
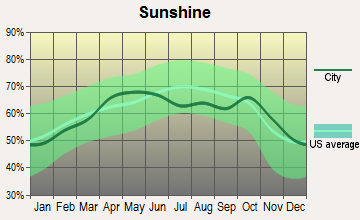
Sunshine amount - Average
65.6%
65.6%
Sunshine amount - Differences during a year
17%
17%
Sunshine amount - Maximum monthly
67%
67%
Sunshine amount - Minimum monthly
50%
50%
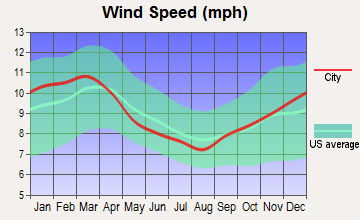
Wind speed - Average
9 mph
8.9 mph
Average climate in Atlanta, Georgia
Average climate in Sandy Springs, Georgia
Air pollution
Type
AQI
CO
NO2
OZONE
PB
PM10
PM25
SO2
Year
Atlanta
Sandy Springs
Atlanta
Sandy Springs
Atlanta
Sandy Springs
Atlanta
Sandy Springs
Atlanta
Sandy Springs
Atlanta
Sandy Springs
Atlanta
Sandy Springs
Atlanta
Sandy Springs
2018
84
84
0.27
0.27
N/A
N/A
24.7
23.3
N/A
N/A
17.5
17.5
10.6
10.0
0.8
0.5
2017
87
85
0.31
0.31
N/A
N/A
24.7
23.3
N/A
N/A
17.5
17.5
11.3
9.7
1.2
0.8
2016
105
105
0.31
0.31
N/A
N/A
25.9
25.4
N/A
N/A
17.2
17.2
11.1
10.5
1.0
0.7
2015
91
91
0.31
0.31
N/A
N/A
23.9
22.7
N/A
N/A
17.6
17.6
10.2
9.9
0.9
0.7
2014
88
87
0.31
0.31
N/A
N/A
24.0
23.0
N/A
N/A
18.4
18.4
9.1
9.8
1.1
0.8
2013
88
87
0.30
0.30
N/A
N/A
23.7
23.1
N/A
N/A
18.0
18.0
8.7
9.4
1.0
0.8
2012
109
109
0.33
0.33
N/A
N/A
26.2
25.1
N/A
N/A
19.5
19.8
9.8
10.8
1.1
0.8
2011
98
98
0.33
0.33
N/A
N/A
27.5
26.3
N/A
N/A
21.2
21.1
12.0
12.4
1.7
1.4
2010
102
102
0.35
0.35
N/A
N/A
25.8
25.1
N/A
N/A
18.5
18.5
12.5
12.4
1.9
1.8
2009
96
96
N/A
N/A
N/A
N/A
25.2
24.3
N/A
N/A
18.5
18.5
13.8
11.9
1.7
1.7
2008
99
99
0.53
0.53
15.3
15.3
31.2
29.8
0.003
0.003
22.5
22.5
16.3
14.4
2.5
2.5
2007
124
123
0.45
0.45
17.0
17.0
33.1
32.0
0.003
0.003
29.4
29.4
18.1
17.0
2.7
2.7
2006
129
124
0.58
0.58
17.9
15.2
31.3
31.6
0.003
0.003
22.9
22.9
19.7
17.0
3.4
3.4
2005
123
117
0.55
0.55
17.2
15.8
29.0
28.3
0.005
0.005
25.5
25.5
15.8
15.0
3.2
3.2
2004
118
118
0.54
0.54
16.9
16.1
28.8
27.2
0.004
0.004
22.9
22.9
14.6
14.4
2.8
2.8
2003
112
109
0.56
0.56
16.4
16.3
26.7
25.5
0.004
0.004
22.2
22.2
15.4
15.2
3.0
3.0
2002
120
119
0.60
0.60
19.4
17.4
27.9
28.2
N/A
N/A
23.2
23.2
13.1
13.1
3.0
3.0
2001
117
115
0.69
0.69
23.3
19.9
27.2
27.5
N/A
N/A
27.0
27.0
N/A
N/A
3.1
3.1
2000
132
129
0.50
0.50
22.9
19.8
31.2
30.8
N/A
N/A
28.4
28.4
N/A
N/A
3.2
3.2
Natural disasters
Type
Atlanta
Sandy Springs
Tornado activity compared to U.S. average
159.5%
160.3%
Earthquake activity compared to U.S. average
153.4%
157%
Natural disasters compared to U.S. average
15%
15%
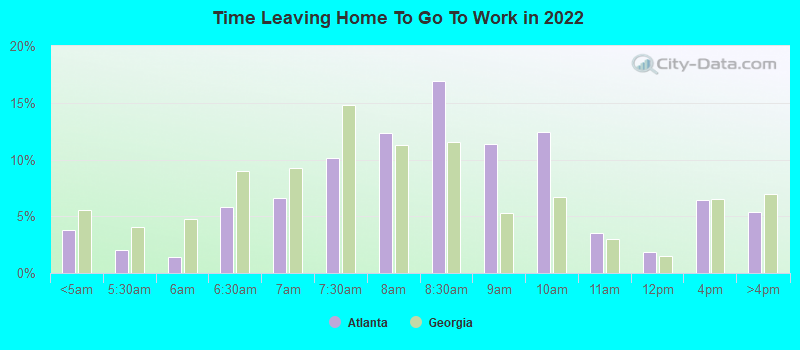
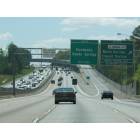
Transportation
Atlanta boasts an efficient public transit system (MARTA) and is bike-friendly. However, traffic congestion can be an issue. Sandy Springs, too, has access to MARTA and is close to major highways for easier commutes, though owning a car is more convenient, given the city’s suburban layout.
Transport
Type
Atlanta
Sandy Springs
Amtrak stations
1
0
Amtrak stations nearby
1
1
FAA registered aircraft
1
15
FAA registered aircraft manufacturers and dealers
28
2
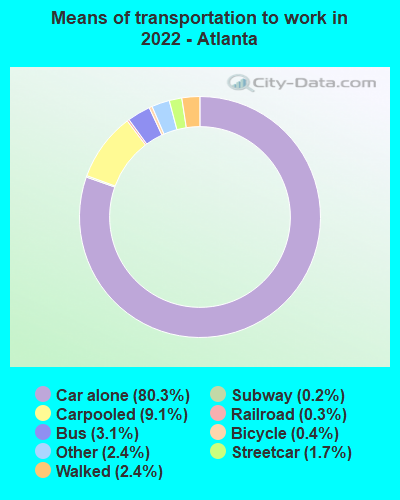
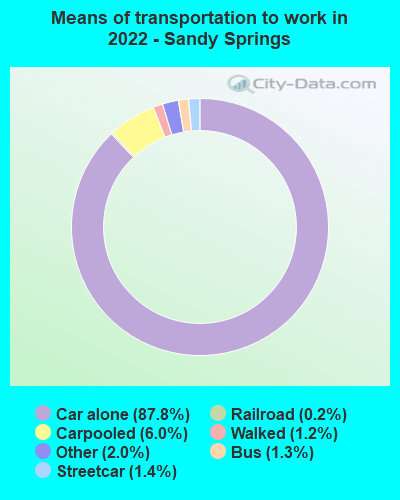
Means of transportation to work
Type
Atlanta
Sandy Springs
Bicycle
0.5%
0.1%
Bus
2.1%
1.4%
Carpooled
7.6%
6%
Car alone
84%
87.7%
Motorcycle
0.1%
0%
Railroad
0.2%
0.1%
Streetcar
1.1%
1.6%
Subway
0.4%
0.1%
Taxicab
0.3%
0.2%
Walked
1.9%
1.3%
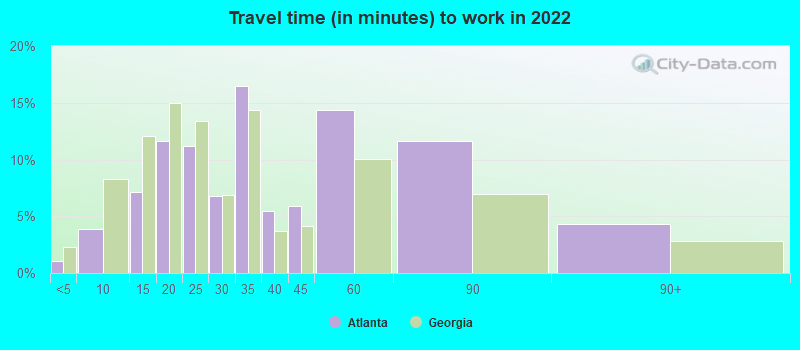
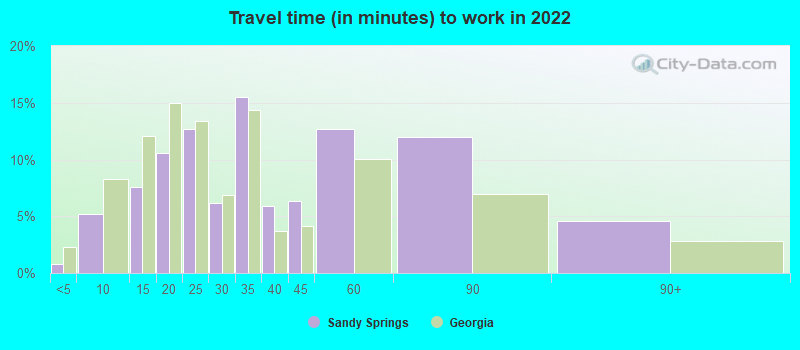
Average travel time to work
Type
Atlanta
Sandy Springs
Average
34.9 min
32.9 min
Other means
24.4 min
24.6 min
Public transportation
47.8 min
44.9 min
Private vehicle occupancy
Type
Atlanta
Sandy Springs
Average
1.1
1.1
Drove alone
92.5%
92.5%
In 2 person carpool
6.7%
6.2%
In 3 person carpool
0.6%
0.6%
In 4 person carpool
0.3%
0.4%
How many people usually rode to work in the car, truck or van.
Real Estate
While Atlanta's real estate market offers a broad spectrum, from budget apartments to luxury condos, it is generally more expensive than Sandy Springs. In contrast, Sandy Springs offers affordable suburban houses, condos, and upscale homes along the Chattahoochee River.
Neighborhoods
Atlanta is known for its diverse neighborhoods, from the high-end Buckhead to the eclectic Little Five Points. Sandy Springs has a mix of suburban neighborhoods and gated communities that appeal to families and individuals seeking peaceful living.
Houses and residents
Type
Atlanta
Sandy Springs
Houses
253,355
54,061
Average household size (people)
2.1
2.2
Median year apartment built
1996
1993
Median year house/condo built
1976
1984
Length of stay in the house since moving in
12.2 years
11 years
Houses occupied
232,720 (91.9%)
52,487 (97.1%)
Houses occupied by owners
113,092 (48.6%)
26,977 (51.4%)
Houses occupied by renters
119,628 (51.4%)
25,510 (48.6%)
Median rent asked for vacant for-rent units
$1,226
$749.88
Median monthly housing costs
$1,504
$1,587
Median price asked for vacant for-sale houses and condos
$325,147
$418,218
Estimated median house or condo value
$375,500
$588,300
Median numbers of rooms
4.5
5.3
Median number of rooms in apartments
3.5
3.7
Median number of rooms in houses and condos
6.2
8.1
Median house price - detached houses
$585,854
$837,057
Median house price - in 2-unit structures
$359,451
$227,319
Median house price - in 3-to-4-unit structures
$453,504
$109,618
Median house price - in 5 or more unit structures
$356,868
$226,897
Median house price - mobile homes
$149,278
$362,694
Median house price - Townhouses or other attached units
$383,334
$296,876
Median house price - All housing units
$508,525
$678,165
Median house age
34
33
Renting percentage
55.1%
52.4%
Housing density (houses/condos per square mile)
1,923
1,433.2
House value disparities
36.3%
33.6%
Household income disparities
47.8%
41.3%
Median household income for houses/condes with a mortgage
$123,344
$157,013
Median household income for apartments without a mortgage
$75,939
$150,827
Housing units without a mortgage
1,022 (1.3%)
564 (2.9%)
Housing units with both a second mortgage and home equity loan
5,566 (7%)
1,262 (6.4%)
Housing units with a mortgage
78,250 (98.7%)
19,106 (97.1%)
Housing units with a home equity loan
58 (0.1%)
0 (0%)
Housing units with a second mortgage
7,203 (9.1%)
1,450 (7.4%)
House/condo owner moved in on average (years ago)
7
7
House/condo renter moved in on average (years ago)
1
1
Housing units lacking complete kitchen facilities
2%
1%
Housing units in structures
Housing units in structures
Atlanta
Sandy Springs
One, detached
37.5%
38.3%
One, attached
6.6%
8.4%
Two
2.4%
1.7%
3 or 4
3.9%
3.2%
5 to 9
5.9%
15.0%
10 to 19
5.7%
15.0%
20 to 49
6.8%
4.0%
50 or more
30.7%
14.3%
Mobile homes
0.5%
0.1%
Median real estate property taxes paid for housing units
Self-employed workers in own not incorporated business
15,892
2,660
State government workers
13,288
1,788
Unpaid family workers
550
104
Industries and Occupations
Atlanta is a hotspot for industries like IT, television production, transport, and logistics. Sandy Springs' economy revolves around healthcare, tech services, and retail. Both cities offer a diverse range of job opportunities depending on one's skills and experience.
Health diagnosing and treating practitioners and other technical occupations
5.6%
6.3%
Arts, design, entertainment, sports, and media occupations
5.5%
4.3%
Food preparation and serving related occupations
4.0%
2.6%
Building and grounds cleaning and maintenance occupations
3.4%
0.9%
Personal care and service occupations
3.3%
0.7%
Legal occupations
3.3%
3.6%
Community and social service occupations
2.8%
3.3%
Computer and mathematical occupations
2.7%
4.1%
Architecture and engineering occupations
2.6%
2.1%
Health technologists and technicians
2.3%
4.1%
Transportation occupations
2.3%
1.8%
Life, physical, and social science occupations
2.2%
2.1%
Healthcare support occupations
2.2%
3.0%
Material moving occupations
1.6%
0.5%
Firefighting and prevention, and other protective service workers including supervisors
1.6%
0.0%
Health Care
Healthcare facilities in Atlanta are excellent, featuring top-rated hospitals such as Emory Healthcare and Grady Memorial Hospital. Sandy Springs residents often use these Atlanta facilities, although the city does have quality healthcare clinics and access to Northside Hospital.
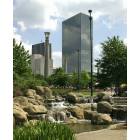
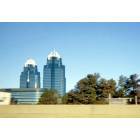
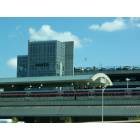
Atlanta is noted for its dense infrastructure with skyscrapers, shopping districts, entertainment centers, and extensive transit systems. Sandy Springs, although less dense, offers well-maintained suburban infrastructure with modern amenities, parks, and recreational spaces.
HMDA - Conventional home purchase loans - Applications denied
Year
Atlanta
Sandy Springs
1999
1,775
226
2000
1,902
92
2001
1,552
61
2002
1,683
62
2003
3,212
215
2004
4,962
319
2005
9,078
463
2006
10,866
653
2007
6,626
345
2008
2,140
188
2009
731
103
Culture and Food
Cultural diversity in Atlanta is evident through its dynamic food scene, vibrant nightlife, arts, and music festivals. In contrast, Sandy Springs, while less culturally diverse, offers a quieter lifestyle with family-friendly events, farmer's markets, and a range of dining options.
Sports Teams
Atlanta hosts several major sports teams including the Atlanta Braves (MLB), Atlanta Hawks (NBA), and Atlanta Falcons (NFL), providing sports fans with a rich and exciting environment. Sandy Springs residents typically support these Atlanta teams.


 Atlanta, GA
 Sandy Springs, GA