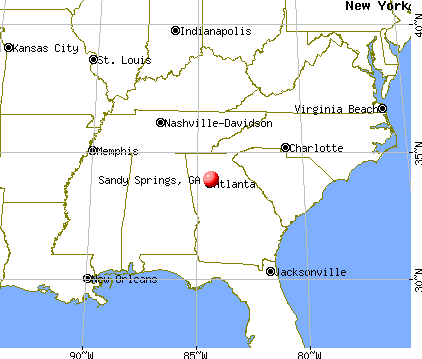
Sandy Springs, Georgia

Sandy Springs: Concourse Towers from Mt. Vernon Hwy

Sandy Springs: City of Sandy Springs at night looking toward Atlanta

Sandy Springs: MARTA Station from GA 400
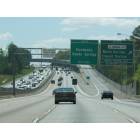
Sandy Springs: Driving South on GA 400

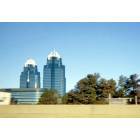
Sandy Springs: Sandy Springs King and Queen building from GA 400
Sandy Springs: Sandy Springs, GA: Concourse Towers
- add
your
Submit your own pictures of this place and show them to the world
- OSM Map
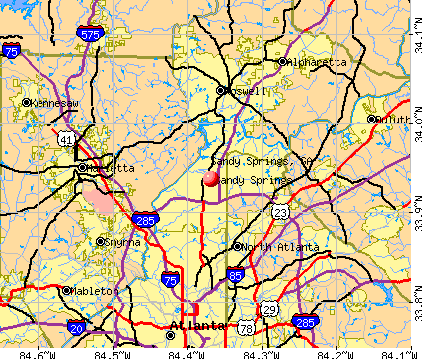
- General Map
- Google Map
- MSN Map
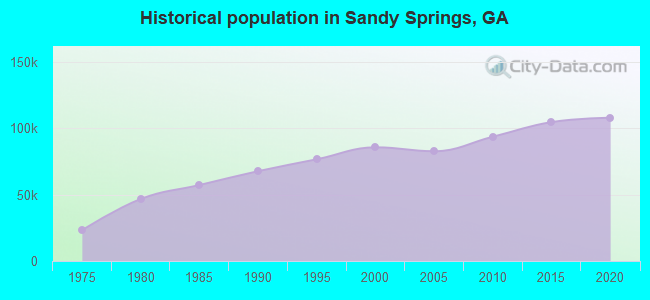
Population change since 2000: +25.6%
 |
| Males: 51,130 | |
| Females: 56,633 |
| Median resident age: | 39.2 years |
| Georgia median age: | 37.6 years |
Zip codes: 30328.
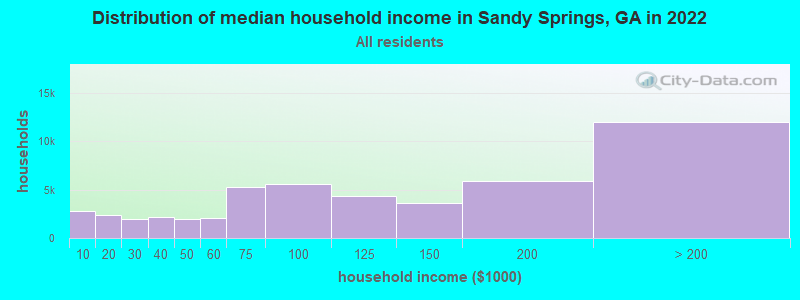
| Sandy Springs: | $104,394 |
| GA: | $72,837 |
Estimated per capita income in 2022: $79,089 (it was $45,494 in 2000)
Sandy Springs CDP income, earnings, and wages data
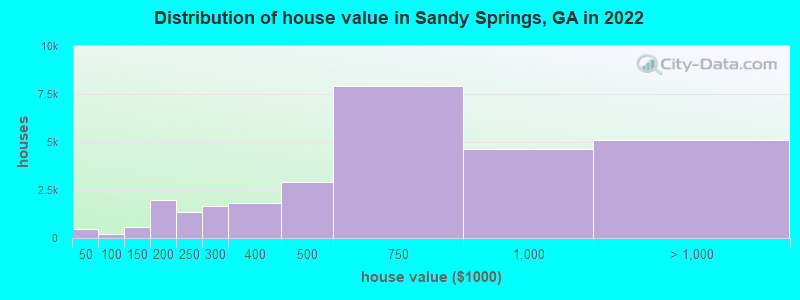
Estimated median house or condo value in 2022: $649,500 (it was $316,600 in 2000)
| Sandy Springs: | $649,500 |
| GA: | $297,400 |
Mean prices in 2022: all housing units: $814,219; detached houses: over $1,000,000; townhouses or other attached units: $349,999; in 2-unit structures: $221,970; in 3-to-4-unit structures: $131,062; in 5-or-more-unit structures: $265,773; mobile homes: $433,465
Median gross rent in 2022: $1,713.
(6.3% for White Non-Hispanic residents, 10.7% for Black residents, 17.9% for Hispanic or Latino residents, 19.1% for American Indian residents, 32.9% for other race residents, 11.1% for two or more races residents)
Detailed information about poverty and poor residents in Sandy Springs, GA


Compare current foreclosures near Sandy Springs, GA:
| Photo | Address | Area | Beds / Baths | Price | Details |
|---|---|---|---|---|---|

|
#1
Westmont Rd SW
Atlanta, GA 30311
|
1,338 sq. feet
|
1 baths 2 beds |
$190,000
|
show details |

|
#2
Spencers Way
Stone Mountain, GA 30087
|
- sq. feet
|
4 baths 4 beds |
$728,000
|
show details |

|
#3
Bell Flower Ct
Stone Mountain, GA 30088
|
- sq. feet
|
2 baths 4 beds |
$249,900
|
show details |

|
#4
Billings Farm Ln
Canton, GA 30115
|
- sq. feet
|
5 baths 7 beds |
$1,274,999
|
show details |

|
#5
Mayson Turner Rd NW Unit 1419
Atlanta, GA 30314
|
872 sq. feet
|
1 baths 2 beds |
show details | |

|
#6
Ivy Ridge Dr SE
Atlanta, GA 30339
|
1,709 sq. feet
|
2 baths 2 beds |
show details | |

|
#7
Coventry Rd Apt 11b
Decatur, GA 30030
|
923 sq. feet
|
1 baths 2 beds |
show details | |

|
#8
Grant Cir SE Unit 404
Atlanta, GA 30315
|
1,250 sq. feet
|
2 baths 2 beds |
show details | |

|
#9
Bayrose Cir
Atlanta, GA 30344
|
1,326 sq. feet
|
3 baths 3 beds |
show details | |

|
#10
Thames Willow Way
Suwanee, GA 30024
|
1,802 sq. feet
|
3 baths 3 beds |
show details |
| Photo | Address | Area | Beds / Baths | Price | Details |
|---|---|---|---|---|---|

|
#11
Peachtree Road NE
Atlanta, GA 30309
|
741 sq. feet
|
1 baths 1 beds |
show details | |

|
#12
Peachtree St NE Unit 3415
Atlanta, GA 30309
|
2,416 sq. feet
|
3 baths 3 beds |
show details | |

|
#13
Caroline St NE Apt 203
Atlanta, GA 30307
|
1,072 sq. feet
|
1 baths 1 beds |
show details | |

|
#14
Windsor Wood Dr
Roswell, GA 30075
|
3,456 sq. feet
|
3 baths 4 beds |
show details | |

|
#15
Whitworth Dr SW
Atlanta, GA 30331
|
1,032 sq. feet
|
3 baths 4 beds |
show details | |

|
#16
Heritage Park Trce NW
Kennesaw, GA 30144
|
1,841 sq. feet
|
3 baths 3 beds |
show details | |

|
#17
Nathan Rd SW
Atlanta, GA 30331
|
1,014 sq. feet
|
2 baths 3 beds |
show details | |

|
#18
Anna Ln
Alpharetta, GA 30004
|
2,420 sq. feet
|
2 baths 4 beds |
show details | |

|
#19
Cedar Ridge Trl
Stone Mountain, GA 30083
|
1,377 sq. feet
|
2 baths 3 beds |
show details | |

|
#20
Venus Pl NW
Atlanta, GA 30331
|
925 sq. feet
|
2 baths 3 beds |
show details |
| Photo | Address | Area | Beds / Baths | Price | Details |
|---|---|---|---|---|---|

|
#21
Nash Rd NW
Atlanta, GA 30331
|
1,296 sq. feet
|
2 baths 3 beds |
show details | |

|
#22
Northwoods Dr
Marietta, GA 30066
|
1,925 sq. feet
|
2 baths 3 beds |
show details | |

|
#23
Martinique Trce
Canton, GA 30115
|
1,952 sq. feet
|
2 baths 3 beds |
show details | |

|
#24
E Cherokee Dr
Woodstock, GA 30188
|
1,560 sq. feet
|
2 baths 3 beds |
show details | |

|
#25
Bay Overlook Dr
Woodstock, GA 30188
|
1,870 sq. feet
|
2 baths 2 beds |
show details | |

|
#26
Cardinal Lake Dr
Duluth, GA 30096
|
1,884 sq. feet
|
3 baths 4 beds |
show details | |

|
#27
Wood Path Dr
Stone Mountain, GA 30083
|
1,181 sq. feet
|
2 baths 3 beds |
show details | |

|
#28
Heritage Park Trce NW
Kennesaw, GA 30144
|
1,780 sq. feet
|
3 baths 3 beds |
show details | |

|
#29
Knights Bridge Ct
Norcross, GA 30093
|
1,272 sq. feet
|
2 baths 3 beds |
show details | |

|
#30
Veltre Cir SW
Atlanta, GA 30311
|
1,456 sq. feet
|
3 baths 5 beds |
show details |
| Photo | Address | Area | Beds / Baths | Price | Details |
|---|---|---|---|---|---|

|
#31
Howell Park Rd
Duluth, GA 30096
|
1,428 sq. feet
|
2 baths 3 beds |
show details | |

|
#32
Centra Villa Dr SW
Atlanta, GA 30311
|
1,898 sq. feet
|
3 baths 3 beds |
show details | |

|
#33
Martindale Ct
Stone Mountain, GA 30088
|
1,710 sq. feet
|
3 baths 4 beds |
show details | |

|
#34
Robinhill Ct
Tucker, GA 30084
|
1,128 sq. feet
|
1 baths 3 beds |
show details | |

|
#35
Forsyth St NW Apt 15d
Atlanta, GA 30303
|
868 sq. feet
|
2 baths 2 beds |
show details | |

|
#36
Forest Path
Stone Mountain, GA 30088
|
1,368 sq. feet
|
2 baths 3 beds |
show details | |

|
#37
Landington Way
Duluth, GA 30096
|
1,244 sq. feet
|
2 baths 3 beds |
show details | |

|
#38
Mount Vernon Pl
Atlanta, GA 30338
|
2,540 sq. feet
|
3 baths 4 beds |
show details | |

|
#39
Merritts Ave NW
Atlanta, GA 30313
|
1,596 sq. feet
|
2 baths 2 beds |
show details | |

|
#40
Harlan Rd SW
Atlanta, GA 30311
|
1,344 sq. feet
|
2 baths 3 beds |
show details |
| Photo | Address | Area | Beds / Baths | Price | Details |
|---|---|---|---|---|---|

|
#41
Broadview Place NE
Atlanta, GA 30324
|
1,440 sq. feet
|
3 baths 2 beds |
show details | |

|
#42
Old Coach Rd SW
Marietta, GA 30008
|
882 sq. feet
|
1 baths 2 beds |
show details | |

|
#43
Clifton Rd SE
Atlanta, GA 30316
|
1,128 sq. feet
|
1 baths 3 beds |
show details | |

|
#44
Champions Pt
Duluth, GA 30097
|
4,363 sq. feet
|
4 baths 4 beds |
show details | |

|
#45
Old Alabama Pl
Roswell, GA 30076
|
2,004 sq. feet
|
2 baths 4 beds |
show details | |

|
#46
Ralph Mcgill Blvd NE Unit 337
Atlanta, GA 30312
|
1,237 sq. feet
|
2 baths 2 beds |
show details | |

|
#47
Parkside Close
Alpharetta, GA 30022
|
2,678 sq. feet
|
2 baths 4 beds |
show details | |

|
#48
Shale Ct
Alpharetta, GA 30022
|
1,661 sq. feet
|
3 baths 3 beds |
show details | |

|
#49
Nelenox Rd
Atlanta, GA 30324
|
- sq. feet
|
2 baths 2 beds |
show details | |

|
Check over 1 million property listings on Foreclosure.com!
|
browse all offers | |||


- 60,42556.1%White alone
- 18,97317.6%Black alone
- 12,60811.7%Hispanic
- 9,1068.4%Asian alone
- 5,2274.9%Two or more races
- 1,1641.1%Other race alone
- 1740.2%American Indian alone
- 900.08%Native Hawaiian and Other
Pacific Islander alone

Races in Sandy Springs detailed stats: ancestries, foreign born residents, place of birth
According to our research of Georgia and other state lists, there were 17 registered sex offenders living in Sandy Springs, Georgia as of April 27, 2024.
The ratio of all residents to sex offenders in Sandy Springs is 6,219 to 1.
The ratio of registered sex offenders to all residents in this city is much lower than the state average.
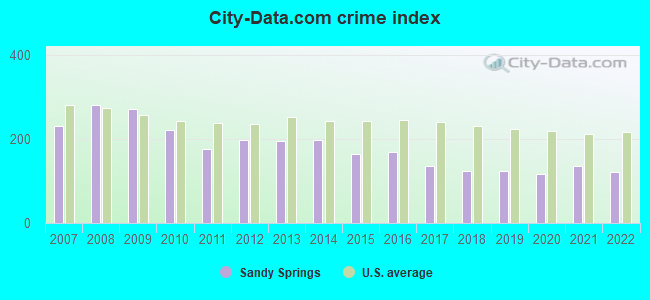
The City-Data.com crime index weighs serious crimes and violent crimes more heavily. Higher means more crime, U.S. average is 246.1. It adjusts for the number of visitors and daily workers commuting into cities.
- means the value is smaller than the state average.- means the value is about the same as the state average.
- means the value is bigger than the state average.
- means the value is much bigger than the state average.
Crime rate in Sandy Springs detailed stats: murders, rapes, robberies, assaults, burglaries, thefts, arson
Full-time law enforcement employees in 2021, including police officers: 160 (139 officers - 127 male; 12 female).
| Officers per 1,000 residents here: | 1.25 |
| Georgia average: | 2.45 |
 Recent articles from our blog. Our writers, many of them Ph.D. graduates or candidates, create easy-to-read articles on a wide variety of topics.


Latest news from Sandy Springs, GA collected exclusively by city-data.com from local newspapers, TV, and radio stations
Ancestries: English (8.0%), American (7.2%), German (4.2%), European (3.7%), Irish (3.6%), Scotch-Irish (2.1%).
Current Local Time: EST time zone
Elevation: 1032 feet
Land area: 37.7 square miles.
Population density: 2,857 people per square mile (average).
18,965 residents are foreign born (6.4% Asia, 5.3% Latin America, 2.6% Africa, 2.3% Europe).
| This place: | 17.5% |
| Georgia: | 10.4% |
Median real estate property taxes paid for housing units with mortgages in 2022: $5,927 (0.9%)
Median real estate property taxes paid for housing units with no mortgage in 2022: $4,414 (0.8%)
Nearest city with pop. 200,000+: Atlanta, GA  (12.5 miles , pop. 416,474).
Nearest city with pop. 1,000,000+: Chicago, IL (575.6 miles , pop. 2,896,016).
Nearest cities:
), ), Latitude: 33.94 N, Longitude: 84.37 W
Daytime population change due to commuting: +39,340 (+36.5%)
Workers who live and work in this place: 28,776 (46.3%)
Property values in Sandy Springs, GA
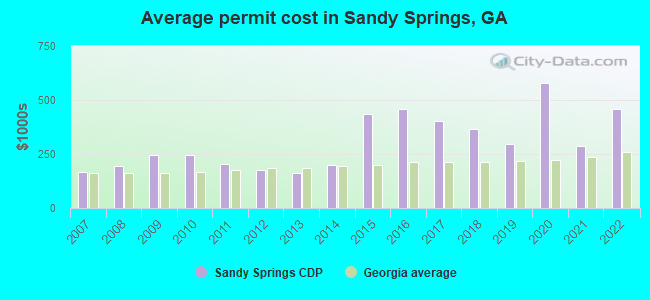
Single-family new house construction building permits:
- 2022: 119 buildings, average cost: $457,200
- 2021: 260 buildings, average cost: $284,500
- 2020: 138 buildings, average cost: $579,500
- 2019: 201 buildings, average cost: $295,400
- 2018: 481 buildings, average cost: $366,000
- 2017: 372 buildings, average cost: $405,000
- 2016: 204 buildings, average cost: $457,700
- 2015: 137 buildings, average cost: $433,800
- 2014: 256 buildings, average cost: $197,600
- 2013: 352 buildings, average cost: $161,600
- 2012: 213 buildings, average cost: $176,600
- 2011: 64 buildings, average cost: $201,800
- 2010: 50 buildings, average cost: $245,000
- 2009: 27 buildings, average cost: $243,700
- 2008: 136 buildings, average cost: $195,100
- 2007: 149 buildings, average cost: $167,600
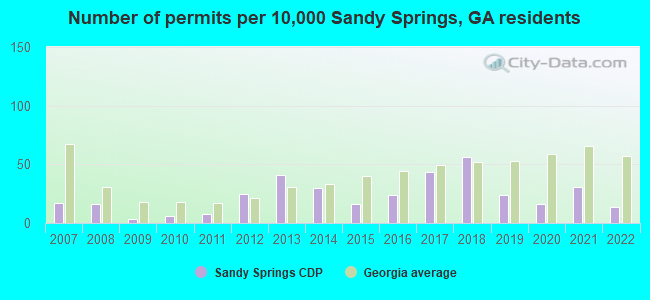
| Here: | 3.1% |
| Georgia: | 2.9% |
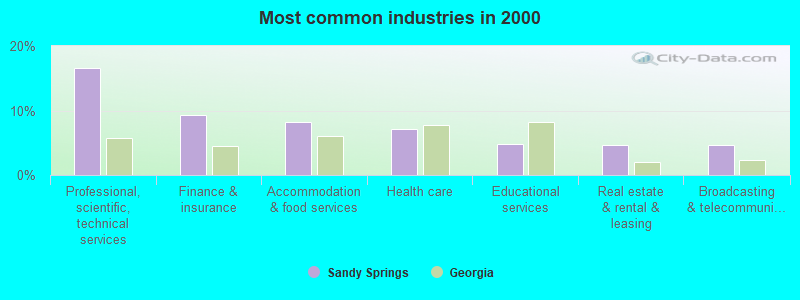
- Professional, scientific, technical services (16.6%)
- Finance & insurance (9.4%)
- Accommodation & food services (8.3%)
- Health care (7.1%)
- Educational services (4.8%)
- Real estate & rental & leasing (4.7%)
- Broadcasting & telecommunications (4.6%)
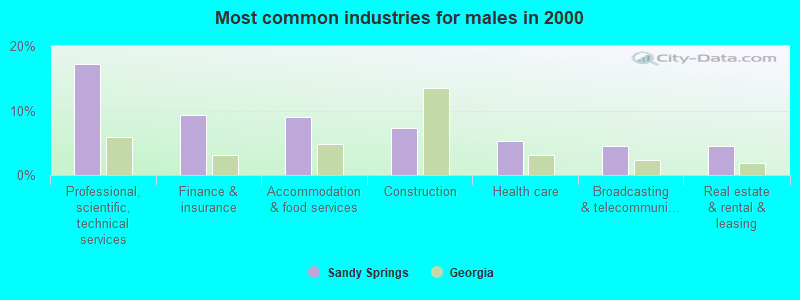
- Professional, scientific, technical services (17.3%)
- Finance & insurance (9.3%)
- Accommodation & food services (9.0%)
- Construction (7.3%)
- Health care (5.2%)
- Broadcasting & telecommunications (4.6%)
- Real estate & rental & leasing (4.5%)
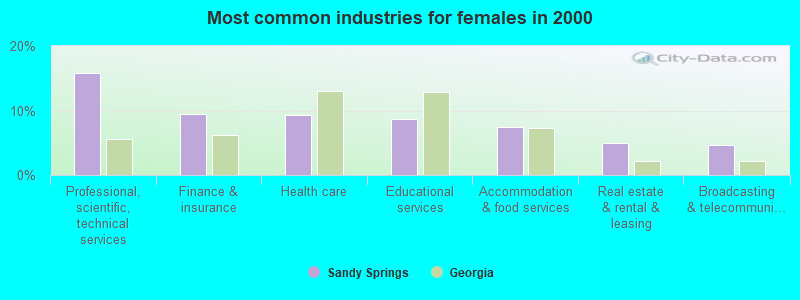
- Professional, scientific, technical services (15.8%)
- Finance & insurance (9.4%)
- Health care (9.2%)
- Educational services (8.7%)
- Accommodation & food services (7.4%)
- Real estate & rental & leasing (5.0%)
- Broadcasting & telecommunications (4.7%)
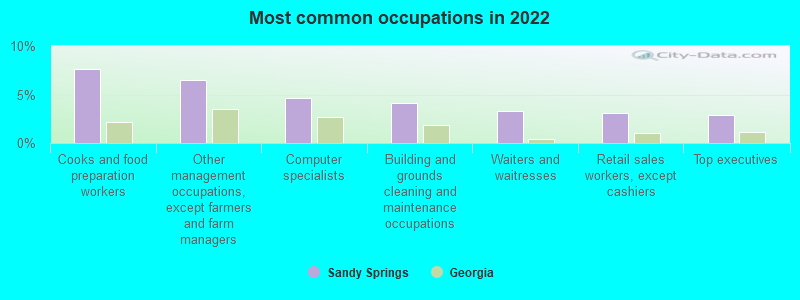
- Cooks and food preparation workers (7.6%)
- Other management occupations, except farmers and farm managers (6.5%)
- Computer specialists (4.6%)
- Building and grounds cleaning and maintenance occupations (4.1%)
- Waiters and waitresses (3.3%)
- Retail sales workers, except cashiers (3.1%)
- Top executives (2.9%)
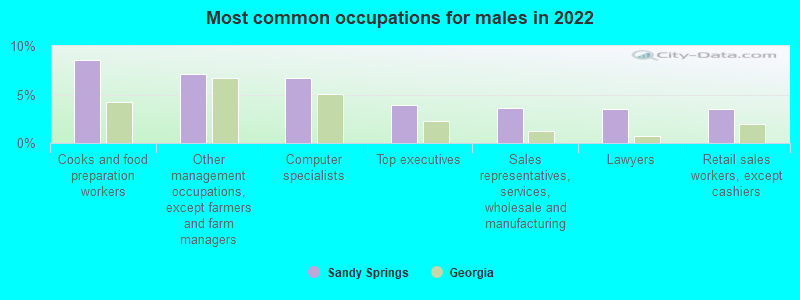
- Cooks and food preparation workers (8.5%)
- Other management occupations, except farmers and farm managers (7.1%)
- Computer specialists (6.7%)
- Top executives (3.9%)
- Sales representatives, services, wholesale and manufacturing (3.6%)
- Lawyers (3.5%)
- Retail sales workers, except cashiers (3.5%)
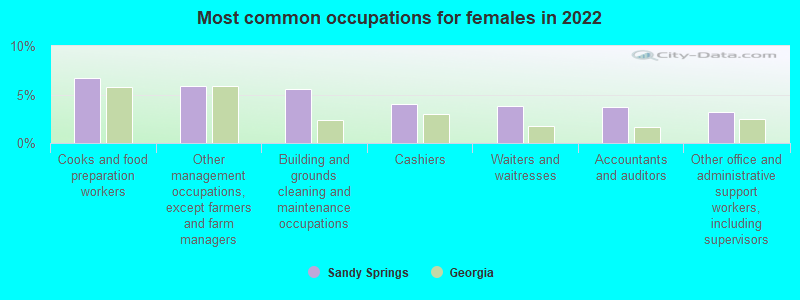
- Cooks and food preparation workers (6.7%)
- Other management occupations, except farmers and farm managers (5.8%)
- Building and grounds cleaning and maintenance occupations (5.6%)
- Cashiers (4.0%)
- Waiters and waitresses (3.8%)
- Accountants and auditors (3.7%)
- Other office and administrative support workers, including supervisors (3.2%)
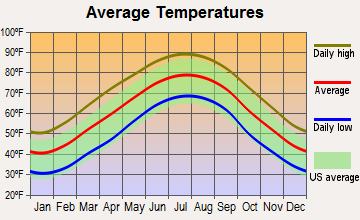
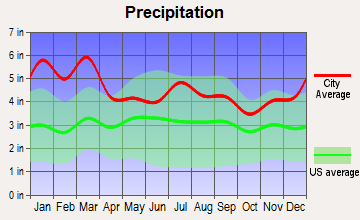
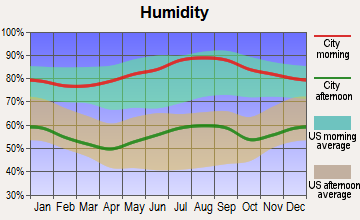
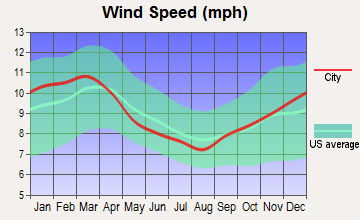
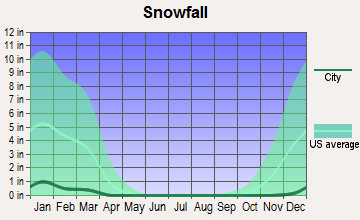
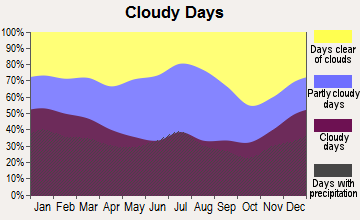
Average climate in Sandy Springs, Georgia
Based on data reported by over 4,000 weather stations

(lower is better)
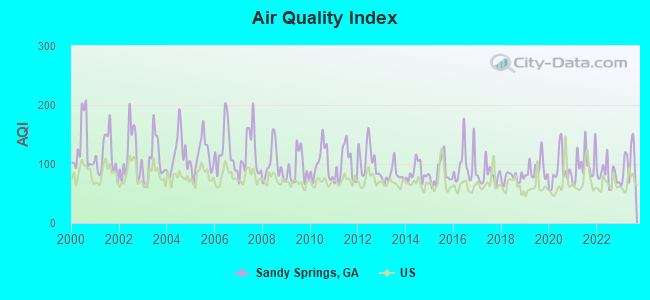
Air Quality Index (AQI) level in 2023 was 102. This is significantly worse than average.
| City: | 102 |
| U.S.: | 73 |
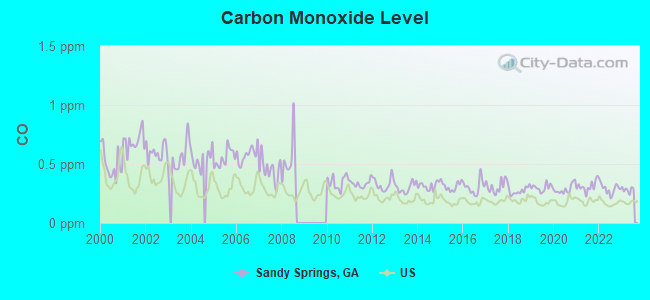
Carbon Monoxide (CO) [ppm] level in 2023 was 0.282. This is about average. Closest monitor was 10.4 miles away from the city center.
| City: | 0.282 |
| U.S.: | 0.251 |
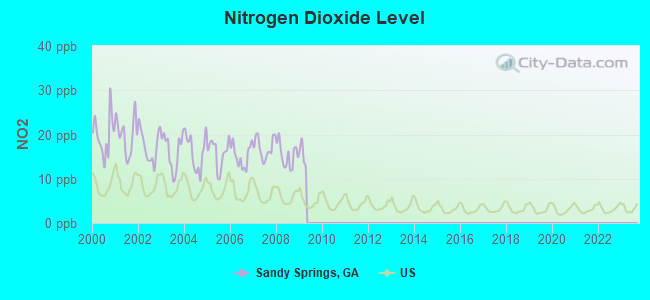
Nitrogen Dioxide (NO2) [ppb] level in 2008 was 15.3. This is significantly worse than average. Closest monitor was 9.3 miles away from the city center.
| City: | 15.3 |
| U.S.: | 5.1 |

Sulfur Dioxide (SO2) [ppb] level in 2023 was 1.20. This is better than average. Closest monitor was 9.3 miles away from the city center.
| City: | 1.20 |
| U.S.: | 1.51 |
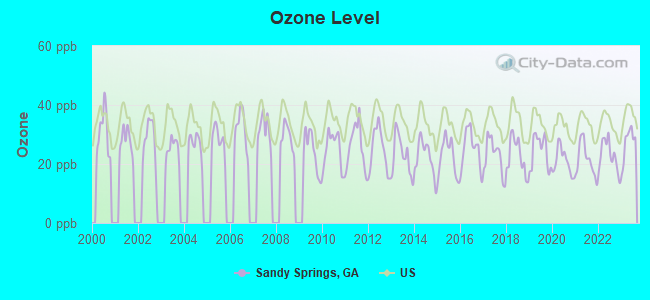
Ozone [ppb] level in 2023 was 27.2. This is better than average. Closest monitor was 10.4 miles away from the city center.
| City: | 27.2 |
| U.S.: | 33.3 |
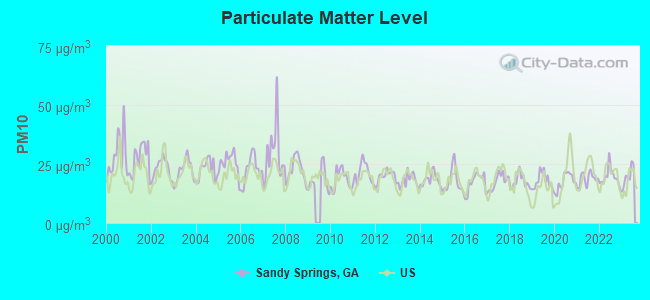
Particulate Matter (PM10) [µg/m3] level in 2023 was 19.7. This is about average. Closest monitor was 5.7 miles away from the city center.
| City: | 19.7 |
| U.S.: | 19.2 |
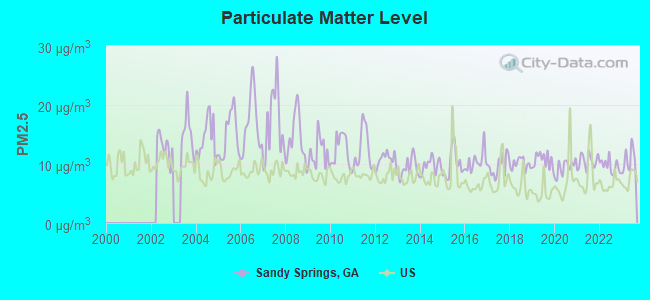
Particulate Matter (PM2.5) [µg/m3] level in 2023 was 10.6. This is worse than average. Closest monitor was 5.7 miles away from the city center.
| City: | 10.6 |
| U.S.: | 8.1 |
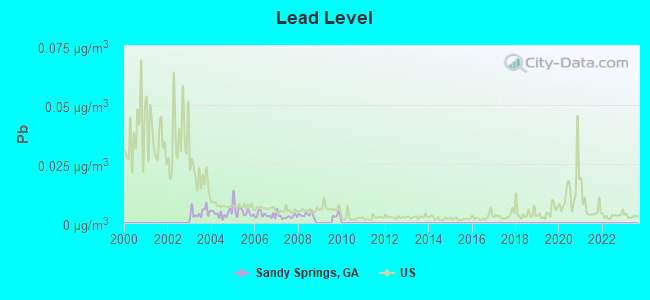
Lead (Pb) [µg/m3] level in 2008 was 0.00340. This is significantly better than average. Closest monitor was 10.1 miles away from the city center.
| City: | 0.00340 |
| U.S.: | 0.00931 |
Tornado activity:
Sandy Springs-area historical tornado activity is slightly above Georgia state average. It is 60% greater than the overall U.S. average.
On 11/22/1992, a category F4 (max. wind speeds 207-260 mph) tornado 16.5 miles away from the Sandy Springs place center injured 46 people and caused between $5,000,000 and $50,000,000 in damages.
On 3/24/1975, a category F3 (max. wind speeds 158-206 mph) tornado 3.4 miles away from the place center killed 3 people and injured 152 people and caused between $50,000,000 and $500,000,000 in damages.
Earthquake activity:
Sandy Springs-area historical earthquake activity is significantly above Georgia state average. It is 57% greater than the overall U.S. average.On 4/29/2003 at 08:59:39, a magnitude 4.9 (4.4 MB, 4.6 MW, 4.9 LG, Class: Light, Intensity: IV - V) earthquake occurred 81.7 miles away from Sandy Springs center
On 8/2/1974 at 08:52:09, a magnitude 4.9 (4.3 MB, 4.9 LG) earthquake occurred 108.1 miles away from Sandy Springs center
On 4/29/2003 at 08:59:39, a magnitude 4.6 (4.6 MW, Depth: 12.3 mi) earthquake occurred 81.8 miles away from the city center
On 11/30/1973 at 07:48:41, a magnitude 4.7 (4.7 MB, 4.6 ML) earthquake occurred 130.8 miles away from the city center
On 1/18/1999 at 07:00:53, a magnitude 4.8 (4.8 MB, 4.0 LG, Depth: 0.6 mi) earthquake occurred 170.2 miles away from Sandy Springs center
On 12/12/2018 at 09:14:43, a magnitude 4.4 (4.4 MW, Depth: 4.9 mi) earthquake occurred 117.7 miles away from the city center
Magnitude types: regional Lg-wave magnitude (LG), body-wave magnitude (MB), local magnitude (ML), moment magnitude (MW)
Natural disasters:
The number of natural disasters in Fulton County (15) is near the US average (15).Major Disasters (Presidential) Declared: 10
Emergencies Declared: 4
Causes of natural disasters: Tornadoes: 5, Floods: 4, Storms: 4, Winter Storms: 4, Hurricanes: 3, Heavy Rains: 2, Drought: 1, Snowfall: 1, Tropical Storm: 1, Wind: 1, Other: 1 (Note: some incidents may be assigned to more than one category).
Hospitals and medical centers in Sandy Springs:
Other hospitals and medical centers near Sandy Springs:
- ASERACARE HOSPICE (Hospital, about 2 miles away; ATLANTA, GA)
- JOURNEY HOSPICE (Hospital, about 2 miles away; ATLANTA, GA)
- FRESENIUS MEDICAL CARE PERIMETER (Dialysis Facility, about 2 miles away; ATLANTA, GA)
- NORTHSIDE HOSPITAL HOME CARE S (Home Health Center, about 2 miles away; ATLANTA, GA)
- INTERIM HEALTHCARE OF ATLANTA INC (Home Health Center, about 2 miles away; ATLANTA, GA)
- WILLOW WAY, INC. (Hospital, about 2 miles away; ATLANTA, GA)
- ODYSSEY HEALTHCARE OF GEORGIA (Hospital, about 2 miles away; ATLANTA, GA)
Heliports located in Sandy Springs:
Amtrak station near Sandy Springs:
Colleges/Universities in Sandy Springs:
- University of Phoenix-Atlanta Campus (Full-time enrollment: 1,343; Location: 8200 Roberts Dr; Private, for-profit; Website: www.phoenix.edu; Offers Master's degree)
- Elaine Sterling Institute (Full-time enrollment: 160; Location: 4840 Roswell Road NE Bldg E Ste 201; Private, for-profit; Website: www.elainesterling.com)
- Gwinnett College-Sandy Springs (Full-time enrollment: 126; Location: 6690 Roswell Road NE Ste. 2200; Private, for-profit; Website: www.RisingSpirit.edu)
Colleges/universities with over 2000 students nearest to Sandy Springs:
- The Art Institute of Atlanta (about 1 miles; Atlanta, GA; Full-time enrollment: 3,140)
- Strayer University-Georgia (about 7 miles; Atlanta, GA; FT enrollment: 4,447)
- Southern Polytechnic State University (about 9 miles; Marietta, GA; FT enrollment: 5,258)
- Emory University (about 10 miles; Atlanta, GA; FT enrollment: 14,382)
- Chattahoochee Technical College (about 11 miles; Marietta, GA; FT enrollment: 8,173)
- Georgia Institute of Technology-Main Campus (about 12 miles; Atlanta, GA; FT enrollment: 24,183)
- DeVry University-Georgia (about 12 miles; Decatur, GA; FT enrollment: 4,157)
User-submitted facts and corrections:
- Colleges/Universities with over 2000 students nearest to Sandy Springs: DEVRY UNIVERSITY, ALPHARETTA. 7.5 miles fro city center. Very nice campus. Low student to instructor ratio. added by ScotD
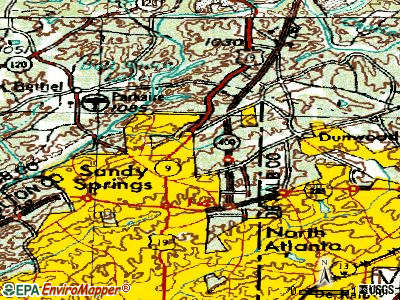
Points of interest:
Notable locations in Sandy Springs: Cherokee Country Club (A), Dunwoody Country Club (B), Sandy Springs Fire / Rescue Department Station 1 (C), Sandy Springs Fire / Rescue Department Station 3 (D), Sandy Springs Fire / Rescue Department Station 2 (E), North Fulton County Annex Building - Courthouse (F), North Fulton County Annex Building (G), Sandy Springs Branch Atlanta-Fulton Public Library (H). Display/hide their locations on the map
Shopping Centers: Cedar Ridge Plaza Shopping Center (1), Cromwell Square Shopping Center (2), Hammond Square Shopping Center (3), North River Village Shopping Center (4), North Springs Shopping Center (5), Northridge Shopping Center (6), Orchard Park Shopping Center (7), Dover Square Shopping Center (8), Powers Ferry Shopping Center (9). Display/hide their locations on the map
Churches in Sandy Springs include: Belle Isle Church (A), Cross Roads Church (B), Ebenezer Church (C), Morgan Falls Church (D), Mount Paran Church (E), Providence Church (F), Rivercliff Lutheran Church (G), North Springs Church (H), Church of Saint Andrew (I). Display/hide their locations on the map
Cemeteries: Arlington Cemetery (1), Heards Cemetery (2). Display/hide their locations on the map
Reservoirs: Peppertree Lake (A), Berezney and Lee Lake (B), Bull Sluice Lake (C), Morgan Falls Reservoir (D), Orkin Lake (E), Patronis Lake (F), Northridge Lake (G). Display/hide their locations on the map
Creeks: March Creek (A), Ball Mill Creek (B), Heards Creek (C), Long Island Creek (D). Display/hide their locations on the map
Parks in Sandy Springs include: Allen Park (1), Hammond Park (2), Lake Forest Park (3), Abernathy Park (4). Display/hide their locations on the map
| This place: | 2.2 people |
| Georgia: | 2.6 people |
| This place: | 53.2% |
| Whole state: | 68.5% |
| This place: | 5.8% |
| Whole state: | 5.9% |
Likely homosexual households (counted as self-reported same-sex unmarried-partner households)
- Lesbian couples: 0.4% of all households
- Gay men: 0.5% of all households
People in group quarters in Sandy Springs in 2010:
- 205 people in nursing facilities/skilled-nursing facilities
- 78 people in residential treatment centers for adults
- 41 people in workers' group living quarters and job corps centers
- 3 people in other noninstitutional facilities
People in group quarters in Sandy Springs in 2000:
- 260 people in other group homes
- 143 people in other noninstitutional group quarters
- 37 people in nursing homes
- 34 people in mental (psychiatric) hospitals or wards
- 7 people in homes or halfway houses for drug/alcohol abuse
- 4 people in religious group quarters
Banks with branches in Sandy Springs (2011 data):
- Signature Bank of Georgia: Signature Bank Of Georgia at 6065 Roswell Road, Suite 110, branch established on 2005/11/07; Sandy Springs Branch at 6065 Roswell Road, Suite 600, branch established on 2006/05/04. Info updated 2007/03/21: Bank assets: $172.8 mil, Deposits: $154.3 mil, local headquarters, negative income in the last year, Commercial Lending Specialization, 4 total offices, Holding Company: Signature Bancshares, Inc.
- SunTrust Bank: Sandy Springs Branch at 5898 Roswell Road, N.E., branch established on 1967/04/27. Info updated 2010/05/27: Bank assets: $171,291.7 mil, Deposits: $129,833.2 mil, headquarters in Atlanta, GA, positive income, Commercial Lending Specialization, 1716 total offices, Holding Company: Suntrust Banks, Inc.
- CornerstoneBank: Roswell Road Branch at 6344 Roswell Road, branch established on 2006/06/30. Info updated 2011/07/21: Bank assets: $408.0 mil, Deposits: $347.4 mil, headquarters in Atlanta, GA, negative income in the last year, Commercial Lending Specialization, 3 total offices
- First-Citizens Bank & Trust Company: Sandy Springs Branch at 325 Mount Vernon Highway, branch established on 2001/01/16. Info updated 2011/10/11: Bank assets: $20,566.4 mil, Deposits: $17,596.8 mil, headquarters in Raleigh, NC, positive income, Commercial Lending Specialization, 433 total offices, Holding Company: First Citizens Bancshares, Inc.
- Wells Fargo Bank, National Association: Sandy Springs Express Branch at 369 Sandy Springs Circle, branch established on 1994/11/22. Info updated 2011/04/05: Bank assets: $1,161,490.0 mil, Deposits: $905,653.0 mil, headquarters in Sioux Falls, SD, positive income, 6395 total offices, Holding Company: Wells Fargo & Company
- Synovus Bank: Sandy Springs Branch at 280 Sandy Springs Circle, Ne, branch established on 2007/10/22. Info updated 2011/01/25: Bank assets: $26,863.3 mil, Deposits: $22,415.0 mil, headquarters in Columbus, GA, positive income, Commercial Lending Specialization, 296 total offices, Holding Company: Synovus Financial Corp.
- PNC Bank, National Association: Atlanta-Prado Branch at 5640 Roswell Road Ne, branch established on 2009/02/23. Info updated 2012/03/20: Bank assets: $263,309.6 mil, Deposits: $197,343.0 mil, headquarters in Wilmington, DE, positive income, Commercial Lending Specialization, 3085 total offices, Holding Company: Pnc Financial Services Group, Inc., The
- Fidelity Bank: Sandy Springs Branch at 225 Sandy Springs Circle, branch established on 1982/12/03. Info updated 2011/10/24: Bank assets: $2,231.8 mil, Deposits: $1,889.9 mil, headquarters in Atlanta, GA, positive income, Commercial Lending Specialization, 31 total offices, Holding Company: Fidelity Southern Corporation
For population 15 years and over in Sandy Springs:
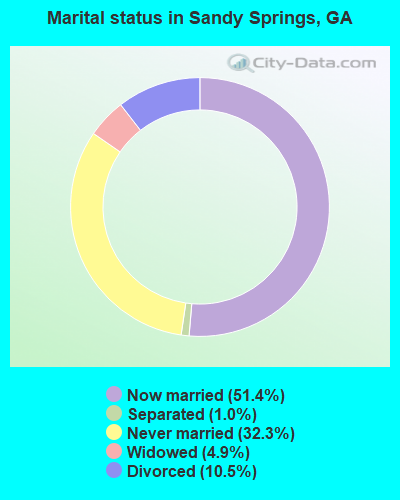
- Never married: 32.3%
- Now married: 51.4%
- Separated: 1.0%
- Widowed: 4.9%
- Divorced: 10.5%
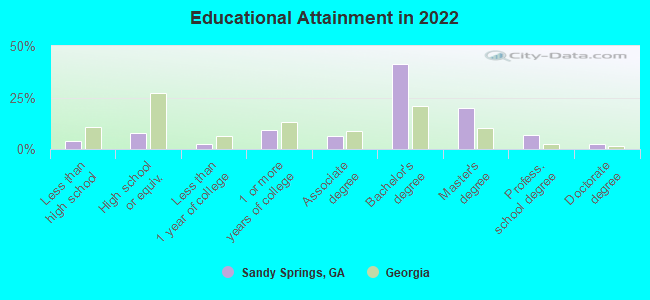
For population 25 years and over in Sandy Springs:
- High school or higher: 96.2%
- Bachelor's degree or higher: 70.5%
- Graduate or professional degree: 29.3%
- Unemployed: 2.9%
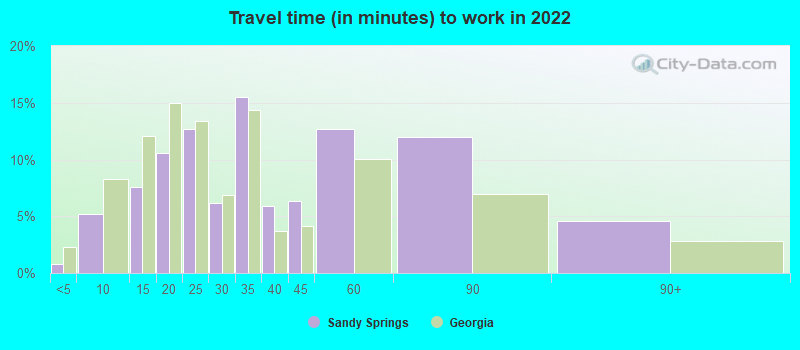
- Mean travel time to work (commute): 18.4 minutes
| Here: | 9.6 |
| Georgia average: | 12.2 |
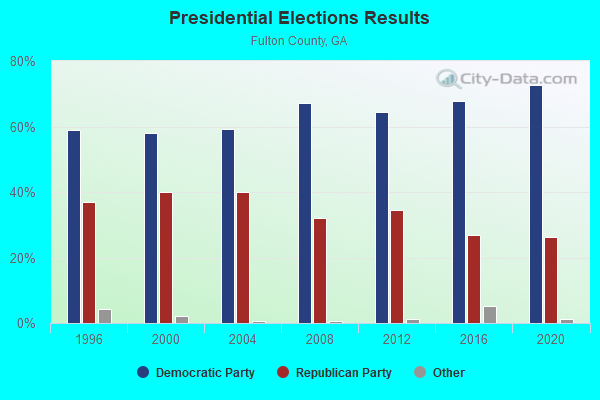
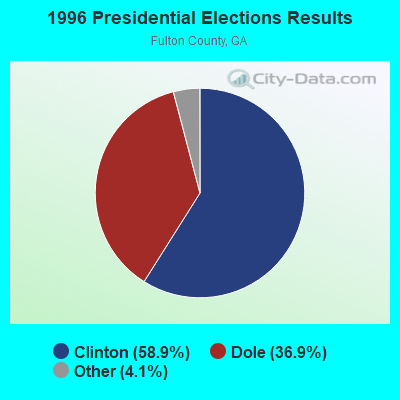
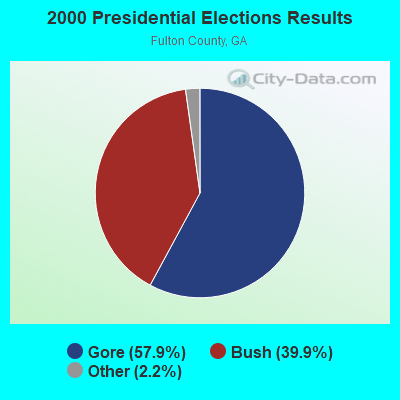
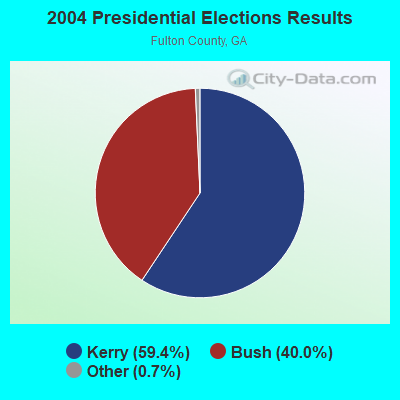
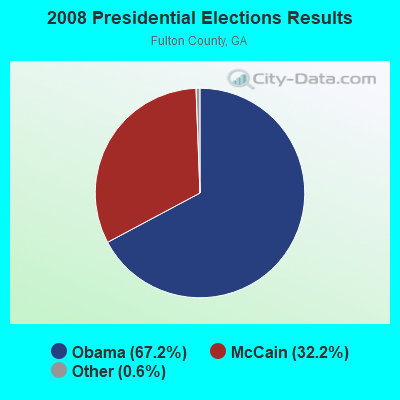
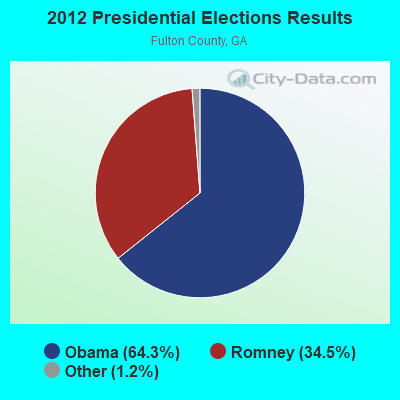
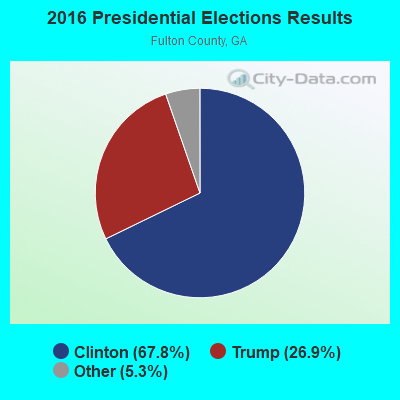
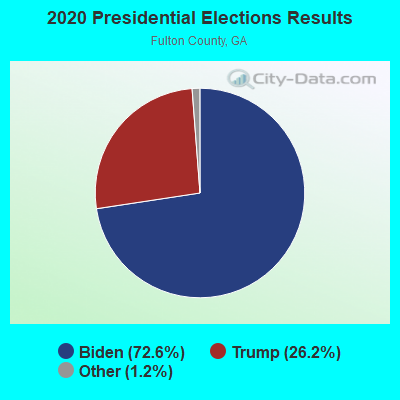
Graphs represent county-level data. Detailed 2008 Election Results
Religion statistics for Sandy Springs, GA (based on Fulton County data)
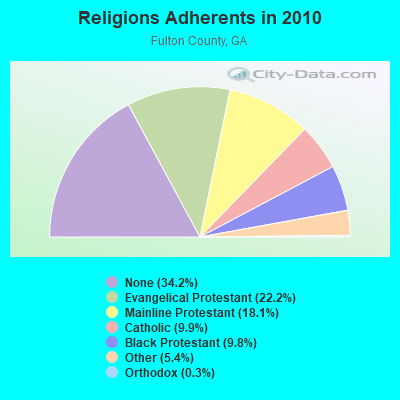
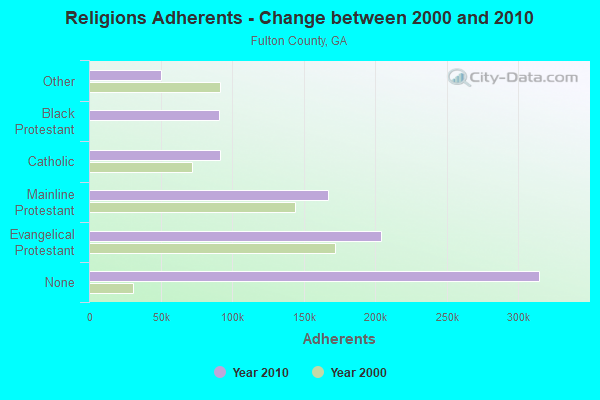
| Religion | Adherents | Congregations |
|---|---|---|
| Evangelical Protestant | 204,409 | 357 |
| Mainline Protestant | 166,727 | 153 |
| Catholic | 91,391 | 18 |
| Black Protestant | 90,642 | 135 |
| Other | 50,075 | 86 |
| Orthodox | 2,496 | 6 |
| None | 314,841 | - |
Food Environment Statistics:
| This county: | 1.91 / 10,000 pop. |
| State: | 1.91 / 10,000 pop. |
| Fulton County: | 0.07 / 10,000 pop. |
| Georgia: | 0.15 / 10,000 pop. |
| Here: | 0.59 / 10,000 pop. |
| Georgia: | 0.86 / 10,000 pop. |
| Here: | 3.00 / 10,000 pop. |
| Georgia: | 5.12 / 10,000 pop. |
| This county: | 11.10 / 10,000 pop. |
| Georgia: | 7.41 / 10,000 pop. |
| This county: | 8.6% |
| Georgia: | 10.4% |
| Fulton County: | 23.2% |
| Georgia: | 27.8% |
| This county: | 15.1% |
| Georgia: | 14.6% |
Health and Nutrition:
| This city: | 52.1% |
| Georgia: | 48.9% |
| Sandy Springs: | 52.4% |
| State: | 46.5% |
| Sandy Springs: | 27.8 |
| Georgia: | 28.9 |
| Sandy Springs: | 18.4% |
| Georgia: | 20.4% |
| Sandy Springs: | 8.8% |
| State: | 10.8% |
| Here: | 6.8 |
| State: | 6.7 |
| Sandy Springs: | 30.8% |
| Georgia: | 33.5% |
| Sandy Springs: | 60.9% |
| Georgia: | 56.2% |
| This city: | 82.4% |
| Georgia: | 80.8% |
More about Health and Nutrition of Sandy Springs, GA Residents
| Local government employment and payroll (March 2022) | |||||
| Function | Full-time employees | Monthly full-time payroll | Average yearly full-time wage | Part-time employees | Monthly part-time payroll |
|---|---|---|---|---|---|
| Police Protection - Officers | 163 | $1,140,556 | $83,967 | 13 | $36,880 |
| Firefighters | 107 | $708,894 | $79,502 | 0 | $0 |
| Financial Administration | 34 | $224,687 | $79,301 | 0 | $0 |
| Other Government Administration | 12 | $115,444 | $115,444 | 0 | $0 |
| Judicial and Legal | 10 | $43,006 | $51,607 | 0 | $0 |
| Fire - Other | 2 | $12,145 | $72,870 | 4 | $11,423 |
| Totals for Government | 328 | $2,244,732 | $82,124 | 17 | $48,303 |
Sandy Springs government finances - Expenditure in 2021 (per resident):
- Construction - Regular Highways: $20,990,000 ($194.78)
Police Protection: $13,289,000 ($123.32)
Parks and Recreation: $2,910,000 ($27.00)
Central Staff Services: $1,192,000 ($11.06)
General Public Buildings: $699,000 ($6.49)
Local Fire Protection: $73,000 ($0.68)
- Current Operations - Police Protection: $21,887,000 ($203.10)
Local Fire Protection: $14,121,000 ($131.04)
Regular Highways: $11,046,000 ($102.50)
Central Staff Services: $9,248,000 ($85.82)
General - Other: $7,998,000 ($74.22)
Parks and Recreation: $6,568,000 ($60.95)
General Public Buildings: $3,935,000 ($36.52)
Financial Administration: $3,831,000 ($35.55)
Judicial and Legal Services: $3,067,000 ($28.46)
Sewerage: $92,000 ($0.85)
- General - Interest on Debt: $6,753,000 ($62.67)
- Other Capital Outlay - Local Fire Protection: $2,958,000 ($27.45)
Police Protection: $507,000 ($4.70)
Parks and Recreation: $99,000 ($0.92)
Financial Administration: $52,000 ($0.48)
Sandy Springs government finances - Revenue in 2021 (per resident):
- Charges - Other: $4,472,000 ($41.50)
Parks and Recreation: $704,000 ($6.53)
Regular Highways: $141,000 ($1.31)
- Federal Intergovernmental - Housing and Community Development: $2,034,000 ($18.87)
Other: $603,000 ($5.60)
- Local Intergovernmental - General Local Government Support: $47,681,000 ($442.46)
Other: $5,465,000 ($50.71)
- Miscellaneous - Fines and Forfeits: $2,537,000 ($23.54)
General Revenue - Other: $732,000 ($6.79)
Rents: $286,000 ($2.65)
Interest Earnings: $124,000 ($1.15)
Sale of Property: $19,000 ($0.18)
Donations From Private Sources: $4,000 ($0.04)
- State Intergovernmental - Other: $969,000 ($8.99)
General Local Government Support: $591,000 ($5.48)
- Tax - Property: $46,336,000 ($429.98)
Occupation and Business License - Other: $10,028,000 ($93.06)
Public Utilities Sales: $9,025,000 ($83.75)
Insurance Premiums Sales: $7,535,000 ($69.92)
Other Selective Sales: $2,718,000 ($25.22)
Other License: $1,949,000 ($18.09)
Alcoholic Beverage Sales: $1,748,000 ($16.22)
Alcoholic Beverage License: $687,000 ($6.38)
Sandy Springs government finances - Debt in 2021 (per resident):
- Long Term Debt - Outstanding Unspecified Public Purpose: $246,056,000 ($2283.31)
Issue, Unspecified Public Purpose: $223,407,000 ($2073.13)
Beginning Outstanding - Unspecified Public Purpose: $172,966,000 ($1605.06)
Retired Unspecified Public Purpose: $150,317,000 ($1394.89)
Sandy Springs government finances - Cash and Securities in 2021 (per resident):
- Bond Funds - Cash and Securities: $156,469,000 ($1451.97)
- Other Funds - Cash and Securities: $71,767,000 ($665.97)
11.63% of this county's 2021 resident taxpayers lived in other counties in 2020 ($85,149 average adjusted gross income)
| Here: | 11.63% |
| Georgia average: | 10.21% |
0.01% of residents moved from foreign countries ($76 average AGI)
Fulton County: 0.01% Georgia average: 0.04%
Top counties from which taxpayers relocated into this county between 2020 and 2021:
| from DeKalb County, GA | |
| from Cobb County, GA | |
| from Gwinnett County, GA |
12.21% of this county's 2020 resident taxpayers moved to other counties in 2021 ($93,086 average adjusted gross income)
| Here: | 12.21% |
| Georgia average: | 9.60% |
0.01% of residents moved to foreign countries ($58 average AGI)
Fulton County: 0.01% Georgia average: 0.03%
Top counties to which taxpayers relocated from this county between 2020 and 2021:
| to DeKalb County, GA | |
| to Cobb County, GA | |
| to Gwinnett County, GA |
| Businesses in Sandy Springs, GA | ||||
| Name | Count | Name | Count | |
|---|---|---|---|---|
| Ace Hardware | 1 | McDonald's | 2 | |
| CVS | 1 | Office Depot | 1 | |
| Domino's Pizza | 1 | Panda Express | 1 | |
| Dunkin Donuts | 1 | Payless | 1 | |
| FedEx | 1 | Plato's Closet | 1 | |
| H&R Block | 2 | Publix Super Markets | 1 | |
| Hardee's | 1 | SAS Shoes | 1 | |
| IHOP | 1 | Starbucks | 1 | |
| InTown Suites | 1 | Taco Bell | 1 | |
| Jimmy John's | 1 | Target | 1 | |
| Kroger | 1 | Trader Joe's | 1 | |
| LA Fitness | 1 | U-Haul | 2 | |
| Little Caesars Pizza | 1 | Waffle House | 2 | |
| Lowe's | 1 | Walgreens | 2 | |
| Marshalls | 1 | |||
Strongest AM radio stations in Sandy Springs:
- WCNN (680 AM; 50 kW; NORTH ATLANTA, GA; Owner: DICKEY BROADCASTING COMPANY)
- WSB (750 AM; 50 kW; ATLANTA, GA; Owner: CXR HOLDINGS, INC.)
- WQXI (790 AM; 28 kW; ATLANTA, GA; Owner: JEFFERSON-PILOT COMMUNICATIONS COMPANY OF GEORGIA)
- WGST (640 AM; 50 kW; ATLANTA, GA; Owner: CITICASTERS LICENSES, L.P.)
- WAZX (1550 AM; 50 kW; SMYRNA, GA; Owner: GA-MEX BROADCASTING, INC.)
- WGKA (1190 AM; 25 kW; ATLANTA, GA; Owner: SALEM MEDIA OF GEORGIA, INC.)
- WAOK (1380 AM; 50 kW; ATLANTA, GA; Owner: INFINITY BROADCASTING OPERATIONS, INC.)
- WMLB (1160 AM; 50 kW; EAST POINT, GA; Owner: ATLANTA AREA BROADCASTING, INC.)
- WGUN (1010 AM; 50 kW; ATLANTA, GA; Owner: WGUN, INC.)
- WFTD (1080 AM; daytime; 50 kW; MARIETTA, GA; Owner: PRIETO ENTERPRISES, INC.)
- WAFS (920 AM; 5 kW; ATLANTA, GA; Owner: THE MOODY BIBLE INSTITUTE OF CHICAGO)
- WNIV (970 AM; 5 kW; ATLANTA, GA; Owner: SALEM MEDIA OF GEORGIA, INC.)
- WAOS (1600 AM; 20 kW; AUSTELL, GA; Owner: LA FAVORITA, INC.)
Strongest FM radio stations in Sandy Springs:
- WJZZ-FM (107.5 FM; ROSWELL, GA; Owner: ROA LICENSES, LLC)
- WKHX-FM (101.5 FM; MARIETTA, GA; Owner: ABC, INC.)
- WKLS (96.1 FM; ATLANTA, GA; Owner: CITICASTERS LICENSES, L.P.)
- WLTM (94.9 FM; ATLANTA, GA; Owner: CITICASTERS LICENSES, L.P.)
- WWWQ (100.5 FM; ANNISTON, AL; Owner: WNNX LICO, INC.)
- WNNX (99.7 FM; ATLANTA, GA; Owner: WNNX LICO, INC.)
- WLCL (105.7 FM; CANTON, GA; Owner: CHEROKEE BROADCASTING CO., INC.)
- WSB-FM (98.5 FM; ATLANTA, GA; Owner: CXR HOLDINGS, INC.)
- WSTR (94.1 FM; SMYRNA, GA; Owner: JEFFERSON-PILOT COMMUNICATIONS COMPANY OF GEORGIA)
- WVEE (103.3 FM; ATLANTA, GA; Owner: INFINITY BROADCASTING OPERATIONS, INC.)
- WZGC (92.9 FM; ATLANTA, GA; Owner: INFINITY BROADCASTING CORP. OF ATLANTA)
- W265BD (100.9 FM; WOODSTOCK, GA; Owner: IMMANUEL BROADCASTING NETWORK, INC.)
- WRFG (89.3 FM; ATLANTA, GA; Owner: RADIO FREE GEORGIA BROADCASTING FOUNDATION INC)
- WABE (90.1 FM; ATLANTA, GA; Owner: BOARD OF EDUCATION, CITY OF ATLANTA)
- WFOX (97.1 FM; GAINESVILLE, GA; Owner: COX RADIO, INC.)
- W221AW (92.1 FM; NORTH CANTON, GA; Owner: IMMANUEL BROADCASTING NETWORK, INC.)
- W214AS (90.7 FM; WALESKA, GA; Owner: CALVARY CHAPEL OF TWIN FALLS, INC.)
- WWEV-FM (91.5 FM; CUMMING, GA; Owner: CURRICULUM DEVELOPMENT FOUNDATION)
- WYAY (106.7 FM; GAINESVILLE, GA; Owner: ABC, INC.)
- WREK (91.1 FM; ATLANTA, GA; Owner: RADIO COMMNS. BD, GEORGIA INST. TECH)
TV broadcast stations around Sandy Springs:
- WUVG (Channel 34; ATHENS, GA; Owner: UNIVISION ATLANTA LLC)
- WAGA (Channel 5; ATLANTA, GA; Owner: FOX TELEVISION STATIONS, INC.)
- WATL (Channel 36; ATLANTA, GA; Owner: WATL, LLC)
- WTBS (Channel 17; ATLANTA, GA; Owner: SUPERSTATION, INC.)
- WGCL-TV (Channel 46; ATLANTA, GA; Owner: MEREDITH CORPORATION)
- WSB-TV (Channel 2; ATLANTA, GA; Owner: WSB-TV HOLDINGS, INC.)
- WXIA-TV (Channel 11; ATLANTA, GA; Owner: GANNETT GEORGIA, L.P.)
- WIRE-CA (Channel 40; ATLANTA, GA; Owner: COMMERCIAL BROADCASTING CORP.)
- WSKC-LP (Channel 59; ATLANTA, GA; Owner: KM LPTV OF ATLANTA, L.L.C.)
- WANN-LP (Channel 32; ATLANTA, GA; Owner: PRISM BROADCASTING NETWORK, INC.)
- WDTA-LP (Channel 53; FAYETTEVILLE, GA; Owner: WORD OF GOD FELLOWSHIP, INC.)
- WTHC-LP (Channel 42; ATLANTA, GA; Owner: THE ATLANTA CHANNEL, INC.)
- WPBA (Channel 30; ATLANTA, GA; Owner: BOARD OF EDUCATION OF THE CITY OF ATLANTA)
- WHSG (Channel 63; MONROE, GA; Owner: TRINITY BROADCASTING NETWORK)
- WUPA (Channel 69; ATLANTA, GA; Owner: VIACOM STATIONS GROUP OF ATLANTA INC.)
- W24AL (Channel 24; ATLANTA, GA; Owner: VENTANA TELEVISION, INC.)
- WANX-LP (Channel 26; ATLANTA, GA; Owner: PRISM BROADCASTING NETWORK, INC.)
- WATC (Channel 57; ATLANTA, GA; Owner: COMMUNITY TELEVISION, INC.)
- W38CU (Channel 38; ATLANTA, GA; Owner: KOREAN AMERICAN TV BROADCASTING CORP.)
- W50AB (Channel 50; HIAWASSEE, GA; Owner: GEORGIA PUBLIC TELECOMMUNICATIONS COMMISSION)
- WGTV (Channel 8; ATHENS, GA; Owner: GEORGIA PUBLIC TELECOMMUNICATIONS COMMISSION)
- WPXA (Channel 14; ROME, GA; Owner: PAXSON ATLANTA LICENSE, INC.)
- W04DB (Channel 4; ATLANTA, GA; Owner: VVILPTV, INC.)
- W55BM (Channel 55; MARIETTA, GA; Owner: TRINITY BROADCASTING NETWORK)
- National Bridge Inventory (NBI) Statistics
- 120Number of bridges
- 1,657ft / 505mTotal length
- $363,228,000Total costs
- 8,386,597Total average daily traffic
- 115,312Total average daily truck traffic
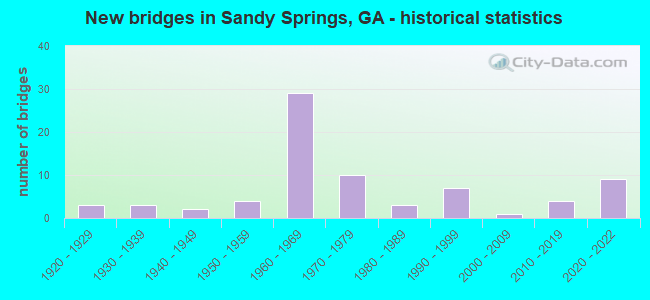
- New bridges - historical statistics
- 31920-1929
- 31930-1939
- 21940-1949
- 41950-1959
- 291960-1969
- 101970-1979
- 31980-1989
- 71990-1999
- 12000-2009
- 42010-2019
- 92020-2022
FCC Registered Private Land Mobile Towers: 1 (See the full list of FCC Registered Private Land Mobile Towers in Sandy Springs, GA)
FCC Registered Broadcast Land Mobile Towers: 8 (See the full list of FCC Registered Broadcast Land Mobile Towers)
FCC Registered Microwave Towers: 29 (See the full list of FCC Registered Microwave Towers in this town)
FCC Registered Amateur Radio Licenses: 57 (See the full list of FCC Registered Amateur Radio Licenses in Sandy Springs)
FAA Registered Aircraft Manufacturers and Dealers: 2 (See the full list of FAA Registered Manufacturers and Dealers in Sandy Springs)
FAA Registered Aircraft: 15 (See the full list of FAA Registered Aircraft)
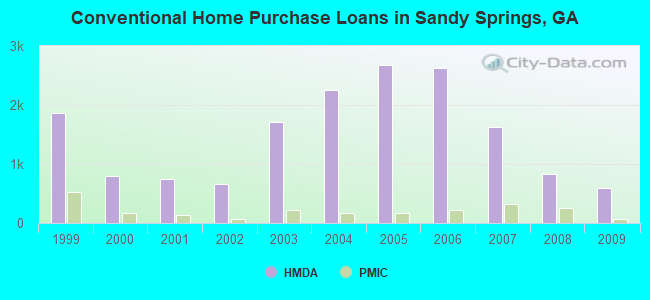
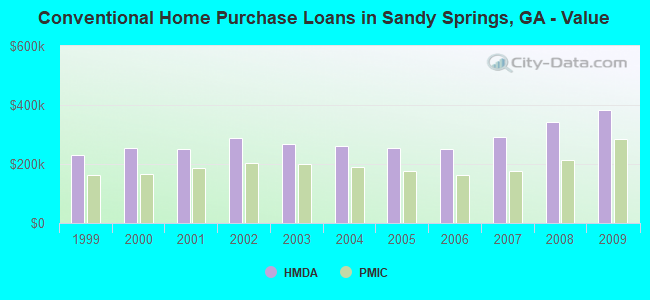
| Home Mortgage Disclosure Act Aggregated Statistics For Year 2009 (Based on 14 full and 2 partial tracts) | ||||||||||||||
| A) FHA, FSA/RHS & VA Home Purchase Loans | B) Conventional Home Purchase Loans | C) Refinancings | D) Home Improvement Loans | E) Loans on Dwellings For 5+ Families | F) Non-occupant Loans on < 5 Family Dwellings (A B C & D) | G) Loans On Manufactured Home Dwelling (A B C & D) | ||||||||
|---|---|---|---|---|---|---|---|---|---|---|---|---|---|---|
| Number | Average Value | Number | Average Value | Number | Average Value | Number | Average Value | Number | Average Value | Number | Average Value | Number | Average Value | |
| LOANS ORIGINATED | 242 | $182,322 | 588 | $383,150 | 2,100 | $329,409 | 56 | $142,577 | 3 | $7,953,050 | 98 | $306,291 | 0 | $0 |
| APPLICATIONS APPROVED, NOT ACCEPTED | 10 | $130,280 | 56 | $445,748 | 182 | $342,437 | 8 | $60,852 | 0 | $0 | 10 | $244,305 | 0 | $0 |
| APPLICATIONS DENIED | 56 | $183,276 | 103 | $347,755 | 551 | $381,048 | 33 | $95,326 | 0 | $0 | 45 | $199,661 | 2 | $37,160 |
| APPLICATIONS WITHDRAWN | 62 | $164,598 | 113 | $368,095 | 429 | $321,217 | 13 | $252,344 | 0 | $0 | 38 | $217,559 | 0 | $0 |
| FILES CLOSED FOR INCOMPLETENESS | 5 | $208,136 | 26 | $386,779 | 120 | $323,334 | 4 | $227,550 | 0 | $0 | 8 | $190,105 | 0 | $0 |
Detailed mortgage data for all 16 tracts in Sandy Springs, GA
| Private Mortgage Insurance Companies Aggregated Statistics For Year 2009 (Based on 14 full and 2 partial tracts) | ||||||
| A) Conventional Home Purchase Loans | B) Refinancings | C) Non-occupant Loans on < 5 Family Dwellings (A & B) | ||||
|---|---|---|---|---|---|---|
| Number | Average Value | Number | Average Value | Number | Average Value | |
| LOANS ORIGINATED | 76 | $283,317 | 35 | $260,526 | 2 | $247,000 |
| APPLICATIONS APPROVED, NOT ACCEPTED | 37 | $265,599 | 18 | $244,752 | 2 | $106,500 |
| APPLICATIONS DENIED | 7 | $322,500 | 11 | $255,066 | 0 | $0 |
| APPLICATIONS WITHDRAWN | 7 | $304,067 | 3 | $271,000 | 0 | $0 |
| FILES CLOSED FOR INCOMPLETENESS | 3 | $272,203 | 2 | $315,770 | 0 | $0 |
2008 - 2018 National Fire Incident Reporting System (NFIRS) incidents
- Fire incident types reported to NFIRS in Sandy Springs, GA
- 82238.9%Structure Fires
- 75335.6%Outside Fires
- 53325.2%Mobile Property/Vehicle Fires
- 70.3%Other
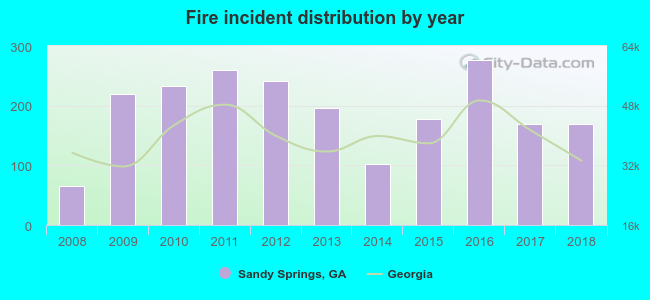 According to the data from the years 2008 - 2018 the average number of fire incidents per year is 192. The highest number of reported fires - 276 took place in 2016, and the least - 66 in 2008. The data has a rising trend.
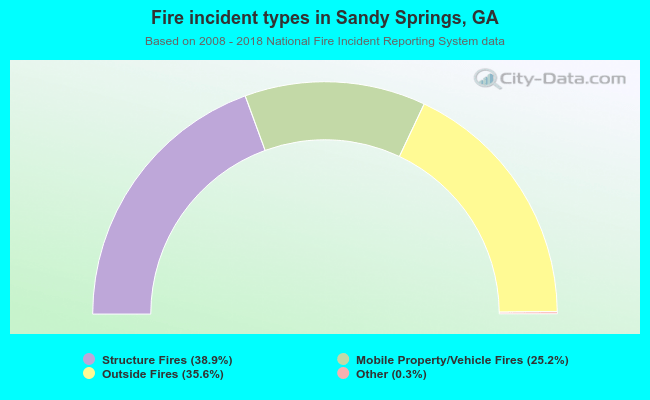 When looking into fire subcategories, the most reports belonged to: Structure Fires (38.9%), and Outside Fires (35.6%).
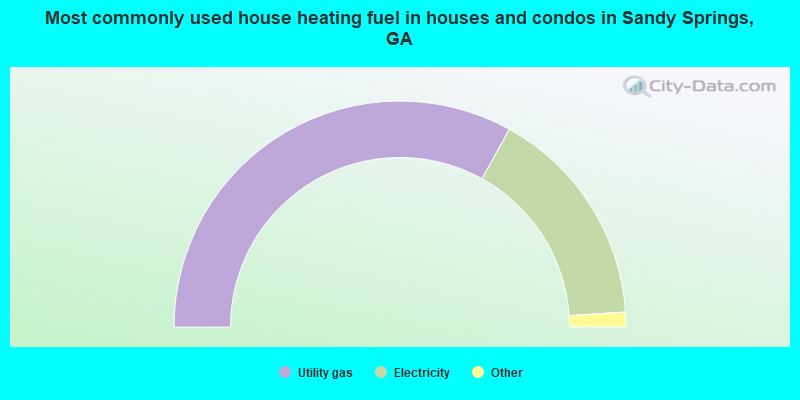
- 66.1%Utility gas
- 31.8%Electricity
- 1.6%Bottled, tank, or LP gas
- 0.5%Other fuel
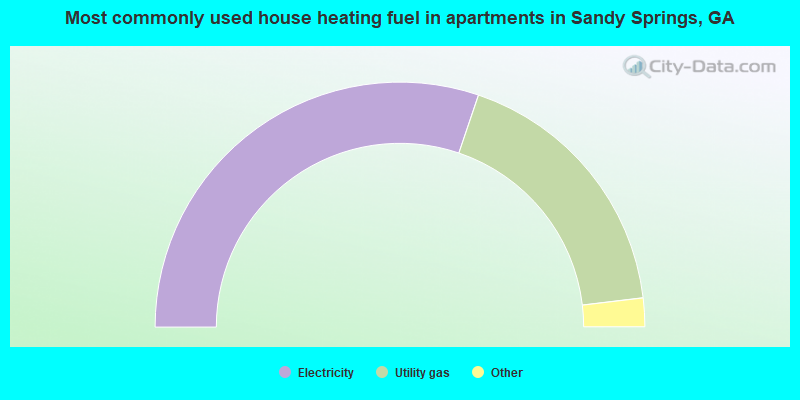
- 60.4%Electricity
- 35.8%Utility gas
- 2.7%Bottled, tank, or LP gas
- 1.0%No fuel used
Sandy Springs compared to Georgia state average:
- Median house value above state average.
- Unemployed percentage significantly below state average.
- Median age below state average.
- Foreign-born population percentage above state average.
- Renting percentage above state average.
- Percentage of population with a bachelor's degree or higher significantly above state average.
Sandy Springs, GA compared to other similar cities:
Sandy Springs on our top lists:
- #3 on the list of "Top 101 cities with largest percentage of females in occupations: sales and related occupations (population 50,000+)"
- #4 on the list of "Top 101 cities with the largest percentage of elementary and middle school students in private schools (5,000+ students)"
- #4 on the list of "Top 101 cities with the largest percentage of high school students in private schools (3,000+ students)"
- #10 on the list of "Top 101 cities with largest percentage of females in occupations: legal occupations (population 50,000+)"
- #10 on the list of "Top 101 cities with largest percentage of females in industries: information (population 50,000+)"
- #12 on the list of "Top 101 cities with largest percentage of males in occupations: arts, design, entertainment, sports, and media occupations (population 50,000+)"
- #14 on the list of "Top 101 cities with largest percentage of males in occupations: food preparation and serving related occupations (population 50,000+)"
- #19 on the list of "Top 101 cities with largest percentage of males in occupations: personal care and service occupations (population 50,000+)"
- #24 on the list of "Top 101 cities with the largest percentage of elementary and middle school students in private schools (1,000+ students)"
- #28 on the list of "Top 101 larger cities with the largest decrease or smallest increase in household income from 2000 (population 50,000+)"
- #32 on the list of "Top 101 cities with largest percentage of males in occupations: legal occupations (population 50,000+)"
- #34 on the list of "Top 101 cities with largest percentage of males in industries: accommodation and food services (population 50,000+)"
- #38 on the list of "Top 101 cities with the lowest number of rapes per 100,000 residents (population 50,000+)"
- #43 on the list of "Top 101 cities with largest percentage of males in industries: professional, scientific, and technical services (population 50,000+)"
- #51 on the list of "Top 101 cities with the largest racial income disparity between any two races with at least 2,000 householders"
- #54 on the list of "Top 101 cities with the largest percentage of high school students in private schools (500+ students)"
- #55 on the list of "Top 101 cities with largest percentage of females in industries: real estate and rental and leasing (population 50,000+)"
- #56 on the list of "Top 101 cities with the most people having professional degrees (population 50,000+)"
- #57 on the list of "Top 101 cities with largest percentage of males in industries: information (population 50,000+)"
- #58 on the list of "Top 101 cities with largest percentage of females in industries: professional, scientific, and technical services (population 50,000+)"
- #24 (30328) on the list of "Top 101 zip codes with the most finance and insurance companies in 2005"
- #52 (30328) on the list of "Top 101 zip codes with the most medium-big companies in 2005 (at least 100 employees)"
- #82 (30328) on the list of "Top 101 zip codes with the most Internet business establishments in 2005"
- #5 on the list of "Top 101 counties with the most Mainline Protestant adherents"
- #6 on the list of "Top 101 counties with the most Black Protestant adherents"
- #9 on the list of "Top 101 counties with the most Black Protestant congregations"
- #11 on the list of "Top 101 counties with the highest percentage of residents relocating from other counties between 2010 and 2011 (pop. 50,000+)"
- #13 on the list of "Top 101 counties with the highest percentage of residents relocating to other counties in 2011 (pop. 50,000+)"

|
|
Total of 323 patent applications in 2008-2024.