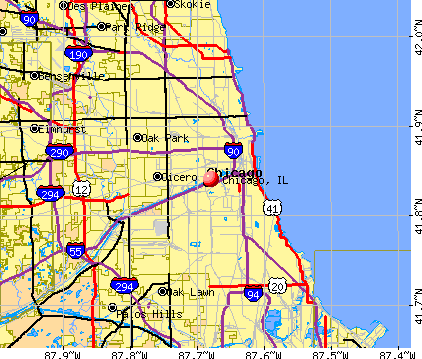
Chicago, Illinois
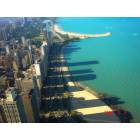
Chicago: View from Hancock Building

Chicago: Downtown. It's amazing!!
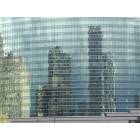
Chicago: Reflection of the City
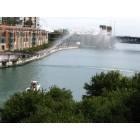
Chicago: The Chicago River, towards Navy Pier

Chicago: View from Navy Pier
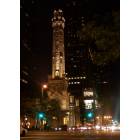
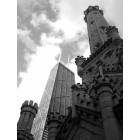
Chicago: Water Tower

Chicago: Clear summer's night in Chicago
Chicago: Old Meets New
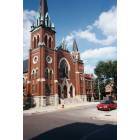
Chicago: St. Volodimir Church, Ukrainian Village - Chicago
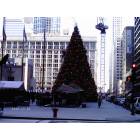
Chicago: Tree at the 2006 Christkindle Market December 3

Chicago: paddle boating the Lincoln Park Zoo pond
- see
428
more - add
your
Submit your own pictures of this city and show them to the world
- OSM Map
- General Map
- Google Map
- MSN Map
Population change since 2000: -8.0%
 |
| Males: 1,295,010 | |
| Females: 1,370,029 |
| Median resident age: | 35.8 years |
| Illinois median age: | 39.1 years |
Zip codes: 60018, 60068, 60176, 60601, 60602, 60603, 60604, 60605, 60606, 60607, 60608, 60609, 60610, 60611, 60612, 60613, 60614, 60615, 60616, 60617, 60618, 60619, 60620, 60621, 60622, 60623, 60624, 60625, 60626, 60628, 60630, 60631, 60632, 60634, 60636, 60637, 60639, 60640, 60641, 60642, 60643, 60644, 60645, 60646, 60647, 60649, 60651, 60652, 60653, 60654, 60655, 60656, 60657, 60659, 60660, 60661, 60706, 60707, 60714.
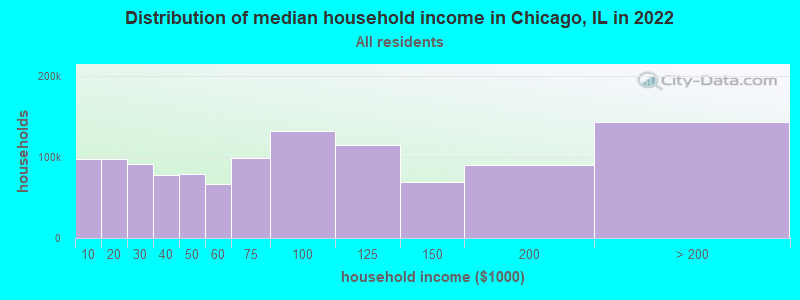
Chicago Zip Code Map| Chicago: | $70,386 |
| IL: | $76,708 |
Estimated per capita income in 2022: $45,449 (it was $20,175 in 2000)
Chicago city income, earnings, and wages data
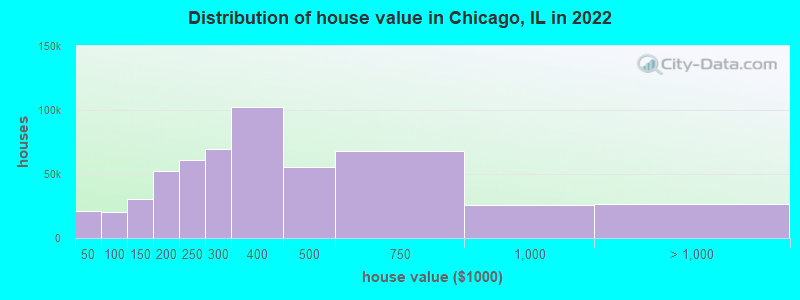
Estimated median house or condo value in 2022: $313,300 (it was $144,300 in 2000)
| Chicago: | $313,300 |
| IL: | $251,600 |
Mean prices in 2022: all housing units: $397,550; detached houses: $393,455; townhouses or other attached units: $498,446; in 2-unit structures: $320,802; in 3-to-4-unit structures: $416,830; in 5-or-more-unit structures: $416,975; mobile homes: $116,082; occupied boats, rvs, vans, etc.: $140,000
Median gross rent in 2022: $1,324.
(9.3% for White Non-Hispanic residents, 28.7% for Black residents, 14.8% for Hispanic or Latino residents, 11.8% for American Indian residents, 24.1% for Native Hawaiian and other Pacific Islander residents, 16.1% for other race residents, 13.7% for two or more races residents)
Detailed information about poverty and poor residents in Chicago, IL


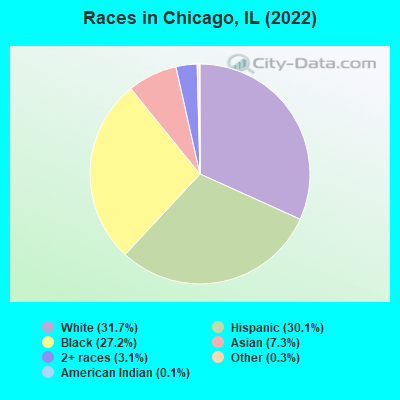
- 846,12731.7%White alone
- 802,08730.1%Hispanic
- 726,17027.2%Black alone
- 194,8197.3%Asian alone
- 82,5843.1%Two or more races
- 9,1960.3%Other race alone
- 3,0170.1%American Indian alone
- 1,0640.04%Native Hawaiian and Other
Pacific Islander alone
Races in Chicago detailed stats: ancestries, foreign born residents, place of birth
According to our research of Illinois and other state lists, there were 3,388 registered sex offenders living in Chicago, Illinois as of April 27, 2024.
The ratio of all residents to sex offenders in Chicago is 798 to 1.
The ratio of registered sex offenders to all residents in this city is near the state average.
The City-Data.com crime index weighs serious crimes and violent crimes more heavily. Higher means more crime, U.S. average is 246.1. It adjusts for the number of visitors and daily workers commuting into cities.
- means the value is smaller than the state average.- means the value is about the same as the state average.
- means the value is bigger than the state average.
- means the value is much bigger than the state average.
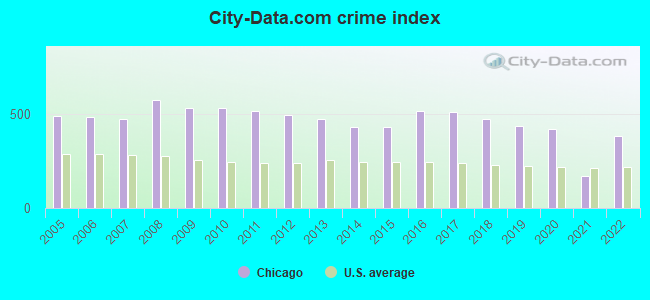
Crime rate in Chicago detailed stats: murders, rapes, robberies, assaults, burglaries, thefts, arson
Full-time law enforcement employees in 2020, including police officers: 13,562 (12,727 officers - 9,770 male; 2,957 female).
| Officers per 1,000 residents here: | 4.72 |
| Illinois average: | 3.04 |
 Recent articles from our blog. Our writers, many of them Ph.D. graduates or candidates, create easy-to-read articles on a wide variety of topics.

 | Chicago is the REAL 2nd biggest city (98 replies) |
| Chicago 2021 and Beyond (130 replies) |
| Vista Tower Chicago (123 replies) |
| What has happened to Chicago? (237 replies) |
| Chicago Union Station Access Project (11 replies) |
| Condé Nast Traveler Readers’ Choice Awards 2022 - Chicago again for the 6th year voted best big US city to visit. (4 replies) |
Latest news from Chicago, IL collected exclusively by city-data.com from local newspapers, TV, and radio stations
Ancestries: Polish (3.7%), Irish (3.0%), German (2.5%), Italian (1.9%), American (1.8%), English (1.4%).
Current Local Time: CST time zone
Incorporated on 05/12/1875
Elevation: 596 feet
Land area: 227.1 square miles.
Population density: 11,733 people per square mile (high).
548,452 residents are foreign born (11.0% Latin America, 5.2% Asia, 3.2% Europe).
| This city: | 20.6% |
| Illinois: | 14.4% |
Median real estate property taxes paid for housing units with mortgages in 2022: $4,935 (1.5%)
Median real estate property taxes paid for housing units with no mortgage in 2022: $3,955 (1.4%)
Nearest cities:
 ),
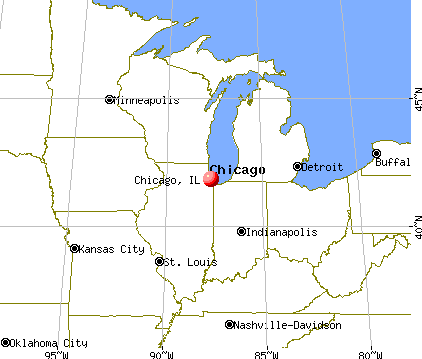
), Latitude: 41.84 N, Longitude: 87.68 W
Daytime population change due to commuting: +90,412 (+3.4%)
Workers who live and work in this city: 1,023,397 (75.2%)
Area codes: 773, 312, 708, 847, 630, 217, 815, 618, 309
Detailed articles:
- Chicago: Introduction
- Chicago Basic Facts
- Chicago: Communications
- Chicago: Convention Facilities
- Chicago: Economy
- Chicago: Education and Research
- Chicago: Geography and Climate
- Chicago: Health Care
- Chicago: History
- Chicago: Municipal Government
- Chicago: Population Profile
- Chicago: Recreation
- Chicago: Transportation
Chicago tourist attractions:
- Allstate Arena Rosemont, Illinois
- Andersonville Neighborhood in Chicago, Illinois
- Albany Park Neighborhood Part of Colorful Chicago History
- The United Center Hosts Chicago Sports and Much More
- Lincoln Park Zoo Brings Wildlife to the City of Chicago
- The Art Institute In Chicago, Illinois
- Bobby's Bike Hike in Chicago, Illinois
- Cafy Iberico in Chicago, Illinois
- Chicago Place - Chicago, Illinois - Large Tower Block Featuring Shops and Restaurants
- Chicago Botanic Garden in Chicago, Illinois
- Chicago Children's Museum in Chicago, Illinois
- Chicago Food Planet Tours in Chicago, Illinois
- Chicago Midway International Airport - Chicago IL Chicago Midway Flights Airport
- Chicago Segway Tours in Chicago, Illinois
- Chicago Shakespeare Theater on Navy Pier in Chicago, Illinois
- Chicago Theater in Chicago, Illinois
- Cloud Gate in Chicago, Illinois
- Devon Avenue in Chicago, Illinois
- Ford City Mall - Chicago, Illinois - Shopping Center
- Garfield Park Conservatory in Chicago, Illinois
- Grant Park in Chicago, Illinois
- Hancock Observatory and Tower in Chicago, Illinois
- Hyde Park Neighborhood in Chicago, Illinois
- Irving Park, Chicago, History and Community
- Japonais Restaurant: Chicago, Illinois
- The Jefferson Park Neighborhood, Chicago Undergoes Resurgence
- John G. Shedd Aquarium in Chicago, Illinois
- Lakeview Neighborhood In Chicago, Illinois
- Legoland in Chicago, Illinois
- Lincoln Park Zoo - Chicago, Illinois - zoo focusing on nature preservation location at the edge of a large city
- With a Zoo, a Park, Clubs, Restaurants and Theater, You Have It All in Lincoln Park neighborhood, Chicago
- Lincoln Park Neighborhood in Chicago, Illinois
- Eclectic Architecture and Abundant Shopping Make the Magnificent Mile in Chicago a Must See
- Marina City in Chicago, Illinois
- McCormick Tribune Plaza and Ice Rink in Chicago, Illinois
- Merchandise Mart in Chicago, Illinois
- Millennium Park, Chicago - Built on Chicago Traditions of Excellence
- Museum of Contemporary Art, Chicago, IL
- Museum of Science and Industry in Chicago, Illinois
- Navy Pier In Chicago, Illinois
- Belden-Stratford Hotel
- Hotel Cass Holiday Inn Express
- Hotel Burnham, a Kimpton Hotel
- The Sutton Place Hotel
- Embassy Suites Hotel Chicago Downtown Lakefront
- Marriott Chicago Downtown Magnificent Mile
- W Chicago Lakeshore
- Renaissance Chicago Hotel
- Hotel Monaco Chicago
- The Raffaello Hotel
- W Chicago City Center
- Conrad Chicago
- Hilton Chicago
- The Talbott Hotel
- The Westin Michigan Avenue Chicago
- Intercontinental Chicago
- The Blackstone
- Embassy Suites Chicago - Downtown
- Hyatt Regency Chicago
- theWit - A Doubletree Hotel
- The Palmer House Hilton
- The Drake
- Omni Chicago Hotel
- James Chicago
- Hotel Sax Chicago
- Sheraton Chicago Hotel and Towers
- Sofitel Chicago Water Tower
- Hyatt Regency McCormick Place
- Swissotel Chicago
- Embassy Suites Hotel Lakefront
- Amalfi Hotel Chicago
- Dana Hotel & Spa
- The Ritz-Carlton Chicago (A Four Seasons Hotel)
- Homewood Suites by Hilton Chicago Downtown
- Hotel Blake
- Hotel Felix
- Hotel Indigo Chicago Downtown Gold Coast
- Wyndham Chicago
- Millennium Knickerbocker Hotel Chicago
- Residence Inn Chicago Downtown / River North
- Residence Inn Chicago Downtown / River North
- Affinia Chicago
- Hard Rock Hotel Chicago
- Courtyard by Marriott Chicago Downtown
- Hotel Allegro Chicago - a Kimpton Hotel
- Crowne Plaza Avenue Chicago Downtown
- Courtyard Chicago Downtown/Magnificent Mile
- Hilton Garden Inn Chicago Downtown / Magnificent Mile
- Allerton Hotel
- Hotel 71
- Chicago's Essex Inn
- Hampton Inn Majestic Chicago
- Doubletree Hotel Chicago - Magnificent Mile
- Hampton Inn and Suites Chicago - Downtown
- Best Western River North Chicago Downtown Hotel
- Hilton Suites Chicago/Magnificent Mile
- Crowne Plaza Chicago- The Metro
- The Silversmith Hotel and Suites
- The Whitehall Hotel
- City Suites Hotel
- Fairfield Inn & Suites Chicago Downtown
- Ambassador East Hotel
- Park Hyatt Chicago
- Four Points by Sheraton Chicago Downtown / Magnificent Mile
- The Willows
- Comfort Inn & Suites Downtown
- Majestic Hotel
- The Tremont - Chicago
- O'Hare International Airport in Chicago, Illinois
- Peggy Notebaert Nature Museum in Chicago, Illinois
- Pullman Historic District in Chicago, Illinois
- Ravinia Park in Highland Park, Illinois
- Rogers Park Neighborhood In Chicago, Illinois
- Shedd Aquarium: Chicago, Illinois
- Shoreline Sightseeing In Chicago, Illinois
- Soldier Field - Chicago, Illinois - Home to the NFL's Chicago Bears
- Supernatural in Chicago, Illinois
- Tango Sur in Chicago, Illinois
- The Shops at North Bridge, Chicago, Illinois
- The Field Museum in Chicago, Illinois
- The Gateway Arch in St. Louis, Missouri
- The Historical Society and Museum in Galena, Illinois
- The Lincoln Square Neighborhood in Chicago, Illinois
- The Logan Square Neighborhood in Chicago, Illinois
- The Loop Neighborhood in Chicago, Illinois
- The Peninsula Hotel in Chicago, Illinois
- The Sears Tower in Chicago, Illinois
- The Sushi Samba Rio In Chicago, Illinois
- Trump International Hotel and Tower in Chicago, Illinois
- U.S. Cellular Field in Chicago, Illinois
- UIC Pavilion, Chicago, Illinois
- US Cellular Field in Chicago, Illinois
- Water Tower Place, Chicago, Illinois
- Wrigley Field in Chicago to have New Owner
Chicago, Illinois accommodation & food services, waste management - Economy and Business Data
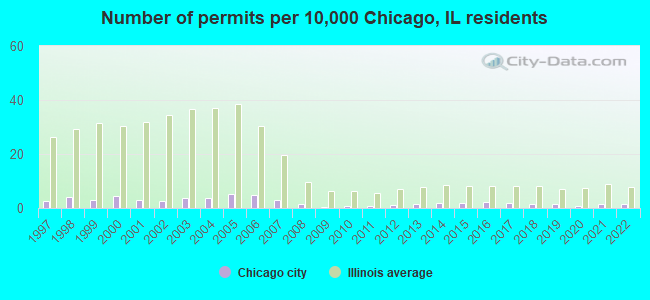
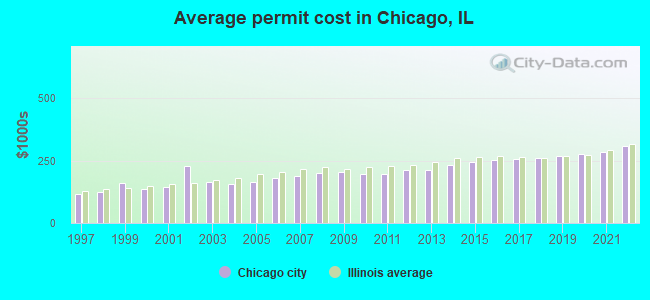
Single-family new house construction building permits:
- 2022: 412 buildings, average cost: $307,100
- 2021: 414 buildings, average cost: $283,500
- 2020: 248 buildings, average cost: $276,100
- 2019: 410 buildings, average cost: $266,700
- 2018: 439 buildings, average cost: $258,500
- 2017: 525 buildings, average cost: $258,200
- 2016: 613 buildings, average cost: $252,700
- 2015: 503 buildings, average cost: $245,000
- 2014: 536 buildings, average cost: $233,000
- 2013: 448 buildings, average cost: $213,000
- 2012: 317 buildings, average cost: $210,800
- 2011: 214 buildings, average cost: $197,500
- 2010: 164 buildings, average cost: $195,600
- 2009: 129 buildings, average cost: $205,900
- 2008: 381 buildings, average cost: $200,500
- 2007: 870 buildings, average cost: $188,800
- 2006: 1415 buildings, average cost: $180,500
- 2005: 1507 buildings, average cost: $165,300
- 2004: 1087 buildings, average cost: $156,600
- 2003: 1023 buildings, average cost: $165,800
- 2002: 754 buildings, average cost: $227,100
- 2001: 883 buildings, average cost: $142,900
- 2000: 1334 buildings, average cost: $137,000
- 1999: 839 buildings, average cost: $158,700
- 1998: 1225 buildings, average cost: $125,600
- 1997: 720 buildings, average cost: $118,200
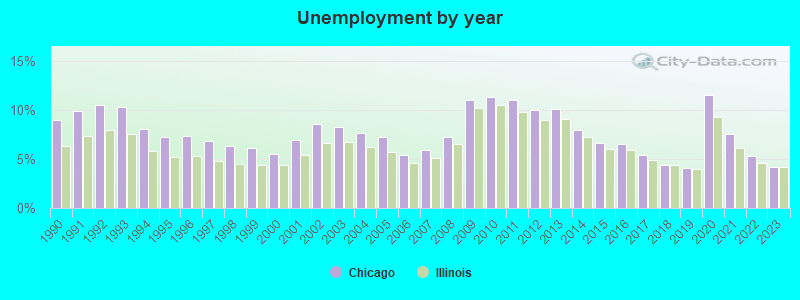
| Here: | 4.2% |
| Illinois: | 4.2% |
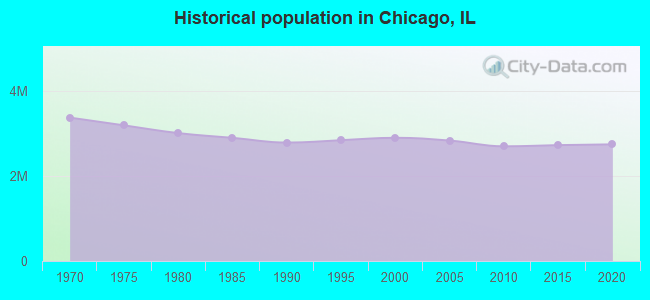
Population change in the 1990s: +110,188 (+4.0%).
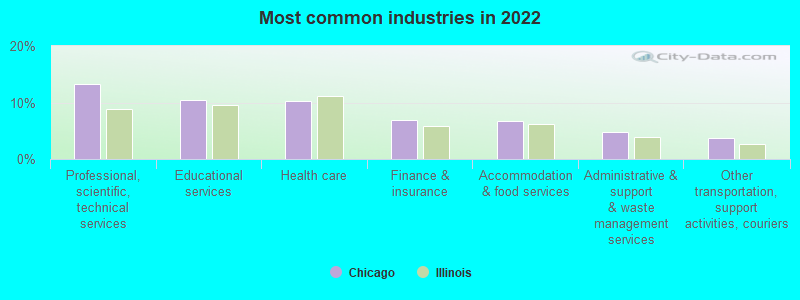
- Professional, scientific, technical services (13.3%)
- Educational services (10.5%)
- Health care (10.2%)
- Finance & insurance (6.9%)
- Accommodation & food services (6.7%)
- Administrative & support & waste management services (4.7%)
- Other transportation, support activities, couriers (3.7%)
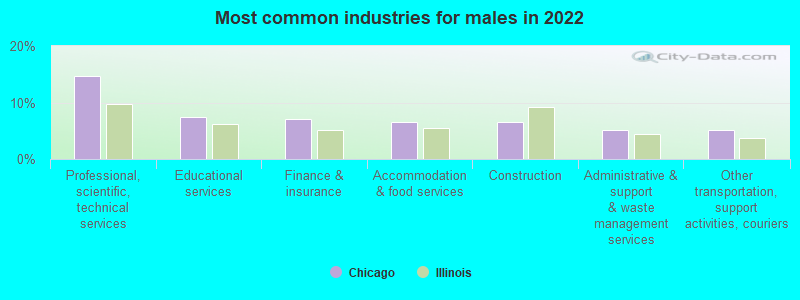
- Professional, scientific, technical services (14.6%)
- Educational services (7.4%)
- Finance & insurance (7.0%)
- Accommodation & food services (6.5%)
- Construction (6.5%)
- Administrative & support & waste management services (5.2%)
- Other transportation, support activities, couriers (5.1%)
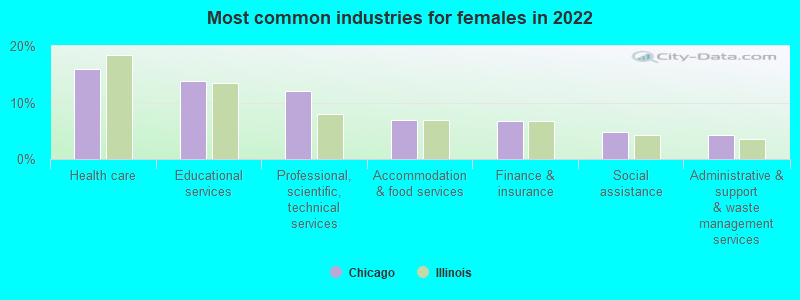
- Health care (16.0%)
- Educational services (13.7%)
- Professional, scientific, technical services (12.0%)
- Accommodation & food services (6.9%)
- Finance & insurance (6.8%)
- Social assistance (4.9%)
- Administrative & support & waste management services (4.2%)
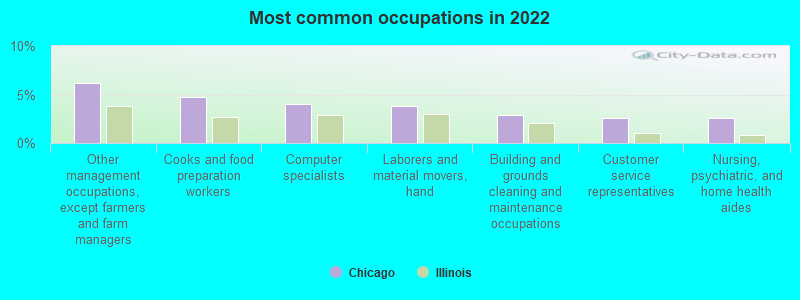
- Other management occupations, except farmers and farm managers (6.2%)
- Cooks and food preparation workers (4.8%)
- Computer specialists (4.0%)
- Laborers and material movers, hand (3.8%)
- Building and grounds cleaning and maintenance occupations (2.9%)
- Customer service representatives (2.6%)
- Nursing, psychiatric, and home health aides (2.5%)
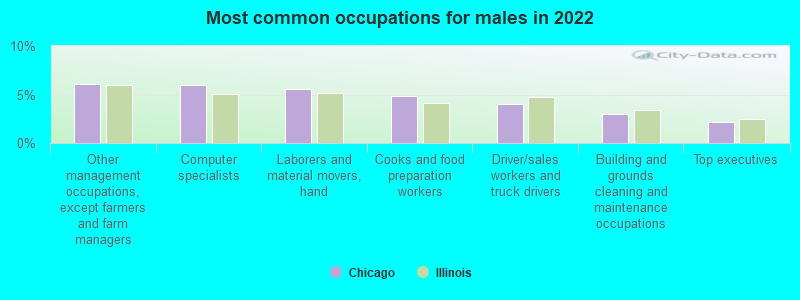
- Other management occupations, except farmers and farm managers (6.1%)
- Computer specialists (6.0%)
- Laborers and material movers, hand (5.6%)
- Cooks and food preparation workers (4.9%)
- Driver/sales workers and truck drivers (4.0%)
- Building and grounds cleaning and maintenance occupations (3.0%)
- Top executives (2.2%)
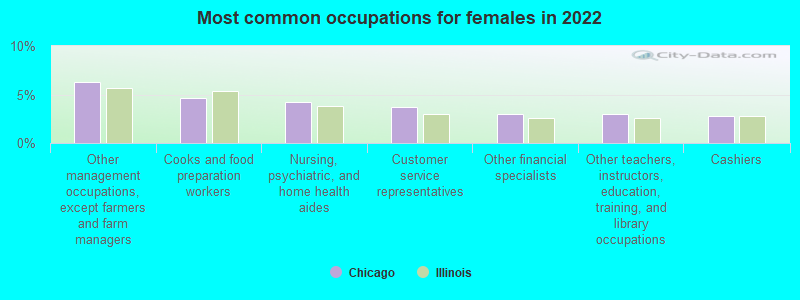
- Other management occupations, except farmers and farm managers (6.3%)
- Cooks and food preparation workers (4.7%)
- Nursing, psychiatric, and home health aides (4.3%)
- Customer service representatives (3.7%)
- Other financial specialists (3.0%)
- Other teachers, instructors, education, training, and library occupations (3.0%)
- Cashiers (2.8%)
Average climate in Chicago, Illinois
Based on data reported by over 4,000 weather stations


|
|

(lower is better)
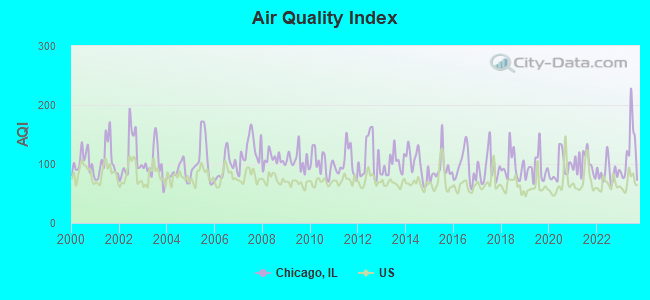
Air Quality Index (AQI) level in 2023 was 120. This is significantly worse than average.
| City: | 120 |
| U.S.: | 73 |
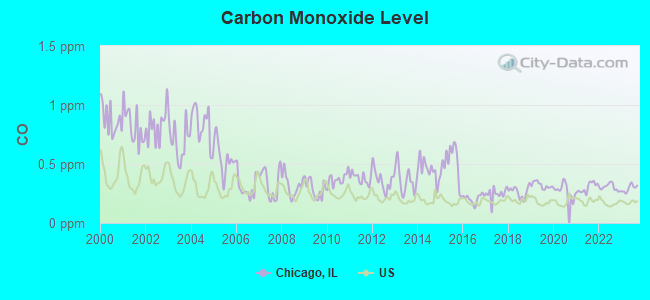
Carbon Monoxide (CO) [ppm] level in 2023 was 0.294. This is about average. Closest monitor was 2.2 miles away from the city center.
| City: | 0.294 |
| U.S.: | 0.251 |
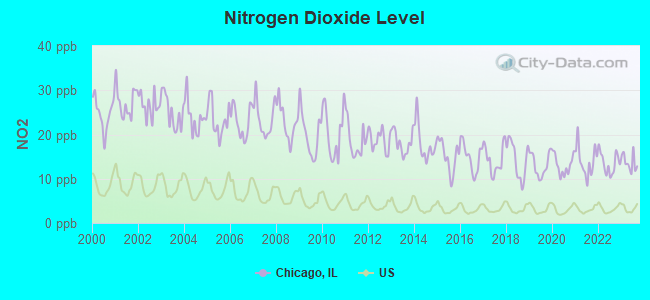
Nitrogen Dioxide (NO2) [ppb] level in 2023 was 13.7. This is significantly worse than average. Closest monitor was 1.8 miles away from the city center.
| City: | 13.7 |
| U.S.: | 5.1 |
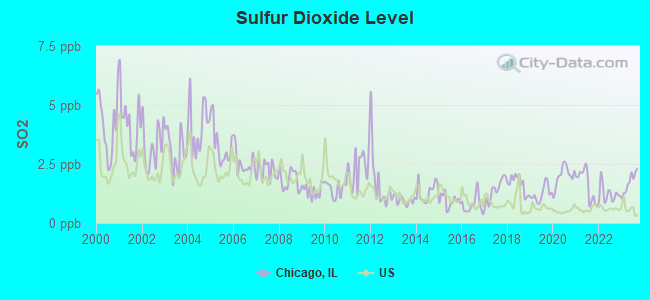
Sulfur Dioxide (SO2) [ppb] level in 2023 was 1.71. This is about average. Closest monitor was 1.8 miles away from the city center.
| City: | 1.71 |
| U.S.: | 1.51 |
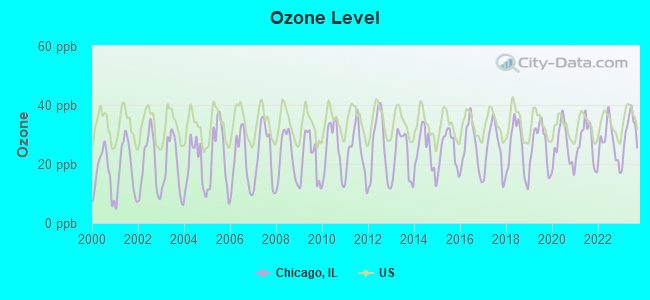
Ozone [ppb] level in 2023 was 30.8. This is about average. Closest monitor was 2.2 miles away from the city center.
| City: | 30.8 |
| U.S.: | 33.3 |
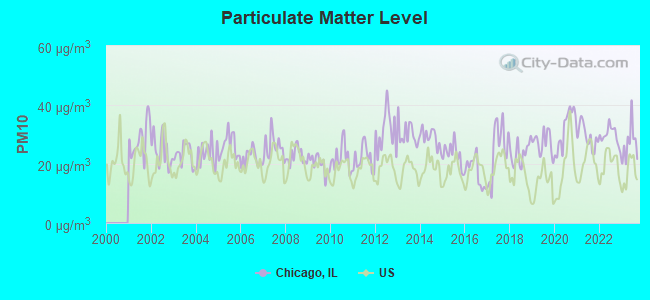
Particulate Matter (PM10) [µg/m3] level in 2023 was 27.0. This is significantly worse than average. Closest monitor was 2.9 miles away from the city center.
| City: | 27.0 |
| U.S.: | 19.2 |
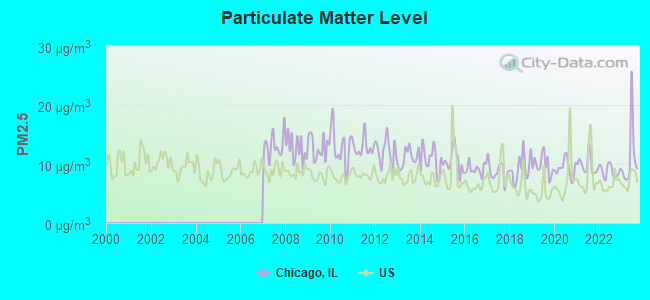
Particulate Matter (PM2.5) [µg/m3] level in 2023 was 11.1. This is worse than average. Closest monitor was 2.9 miles away from the city center.
| City: | 11.1 |
| U.S.: | 8.1 |
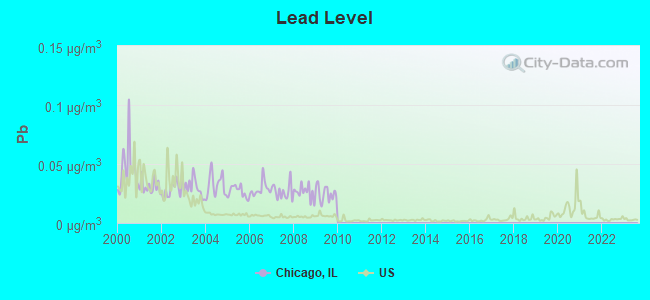
Lead (Pb) [µg/m3] level in 2009 was 0.0248. This is significantly worse than average. Closest monitor was 1.8 miles away from the city center.
| City: | 0.0248 |
| U.S.: | 0.0093 |
Tornado activity:
Chicago-area historical tornado activity is slightly below Illinois state average. It is 46% greater than the overall U.S. average.
On 4/21/1967, a category F4 (max. wind speeds 207-260 mph) tornado 10.2 miles away from the Chicago city center killed 33 people and injured 500 people and caused between $5,000,000 and $50,000,000 in damages.
On 8/28/1990, a category F5 (max. wind speeds 261-318 mph) tornado 31.1 miles away from the city center killed 29 people and injured 350 people and caused between $50,000 and $500,000 in damages.
Earthquake activity:
Chicago-area historical earthquake activity is significantly above Illinois state average. It is 37% greater than the overall U.S. average.On 4/18/2008 at 09:36:59, a magnitude 5.4 (5.1 MB, 4.8 MS, 5.4 MW, 5.2 MW, Class: Moderate, Intensity: VI - VII) earthquake occurred 234.6 miles away from Chicago center
On 6/10/1987 at 23:48:54, a magnitude 5.1 (4.9 MB, 4.4 MS, 4.6 MS, 5.1 LG) earthquake occurred 209.1 miles away from Chicago center
On 4/18/2008 at 09:36:59, a magnitude 5.2 (5.2 MW, Depth: 8.9 mi) earthquake occurred 234.7 miles away from the city center
On 6/28/2004 at 06:10:52, a magnitude 4.2 (4.2 MW, Depth: 6.2 mi, Class: Light, Intensity: IV - V) earthquake occurred 68.4 miles away from Chicago center
On 6/18/2002 at 17:37:15, a magnitude 5.0 (4.3 MB, 4.6 MW, 5.0 LG) earthquake occurred 266.6 miles away from the city center
On 4/18/2008 at 15:14:16, a magnitude 4.8 (4.5 MB, 4.8 MW, 4.6 MW) earthquake occurred 232.9 miles away from the city center
Magnitude types: regional Lg-wave magnitude (LG), body-wave magnitude (MB), surface-wave magnitude (MS), moment magnitude (MW)
Natural disasters:
The number of natural disasters in Cook County (20) is greater than the US average (15).Major Disasters (Presidential) Declared: 15
Emergencies Declared: 4
Causes of natural disasters: Floods: 13, Storms: 12, Tornadoes: 3, Snowstorms: 2, Winter Storms: 2, Blizzard: 1, Hurricane: 1, Snow: 1, Wind: 1, Other: 1 (Note: some incidents may be assigned to more than one category).
Main business address for: ARCHIPELAGO HOLDINGS INC (SECURITY & COMMODITY BROKERS, DEALERS, EXCHANGES & SERVICES), ARVIDA JMB PARTNERS L P (OPERATIVE BUILDERS), FIRST CAPITAL INCOME PROPERTIES LTD SERIES XI (REAL ESTATE), CLICK COMMERCE INC (SERVICES-PREPACKAGED SOFTWARE), IDS MANAGED FUTURES II L P (REAL ESTATE INVESTMENT TRUSTS), GENERAL GROWTH PROPERTIES INC (REAL ESTATE INVESTMENT TRUSTS), OIL DRI CORPORATION OF AMERICA (MISCELLANEOUS MANUFACTURING INDUSTRIES), OLD REPUBLIC INTERNATIONAL CORP (SURETY INSURANCE) and 102 other public companies.
Hospitals in Chicago:
- A TOUCH OF GRACE HOSPICE, INC (1033 WEST VAN BUREN, SUITE 705)
- CHILDRENS MEMORIAL HOSPITAL (provides emergency services, 2300 CHILDRENS PLAZA)
- HARTGROVE HOSPITAL (520 N RIDGEWAY)
- ILLINOIS STATE PSYCHIATRIC INSTITUTE (1153 NORTH LAVERGENE AVENUE)
- LINCOLN WEST HOSPITAL (provides emergency services, 2544 W MONTROSE AVE)
- MERCY HOSPITAL AND MEDICAL CENTER (Voluntary non-profit - Private, 2525 S MICHIGAN AVE)
- NORTHWESTERN MEM HOSPITAL HOSPICE PROG (676 N ST CLAIR, SUITE 720)
- PROVIDENT HOSPITAL OF CHICAGO (Government - Local, 500 E 51ST ST)
- SIX CORNERS SAMEDAY SURGERY (4211 NORTH CICERO AVENUE)
- THC CHICAGO INC DBA KINDRED CHICAGO (4058 W MELROSE)
- WOODLAWN HOSPITAL (6060 S DREXEL AVENUE)
Airports and heliports located in Chicago:
- Chicago O'Hare International Airport (ORD) (Runways: 10, Commercial Ops: 621,564, Air Taxi Ops: 334,895, Itinerant Ops: 7,425, Military Ops: 207)
- Chicago Midway International Airport (MDW) (Runways: 5, Commercial Ops: 185,535, Air Taxi Ops: 26,557, Itinerant Ops: 38,773, Military Ops: 2,255)
- Lansing Municipal Airport (IGQ) (Runways: 2, Air Taxi Ops: 5,500, Itinerant Ops: 24,200, Local Ops: 29,700)
- Heliports: 11
Biggest Colleges/Universities in Chicago:
- DeVry University-Illinois (Full-time enrollment: 26,380; Location: 3300 N Campbell Ave; Private, for-profit; Website: www.devry.edu; Offers Master's degree)
- University of Illinois at Chicago (Full-time enrollment: 23,703; Location: 601 S Morgan; Public; Website: www.uic.edu/index.html/; Offers Doctor's degree)
- DePaul University (Full-time enrollment: 20,620; Location: 1 E Jackson Blvd; Private, not-for-profit; Website: www.depaul.edu; Offers Doctor's degree)
- Loyola University Chicago (Full-time enrollment: 13,233; Location: 1032 W. Sheridan Rd; Private, not-for-profit; Website: www.luc.edu; Offers Doctor's degree)
- University of Chicago (Full-time enrollment: 11,506; Location: 5801 S Ellis Ave; Private, not-for-profit; Website: WWW.UCHICAGO.EDU; Offers Doctor's degree)
- Columbia College-Chicago (Full-time enrollment: 9,711; Location: 600 South Michigan; Private, not-for-profit; Website: www.colum.edu; Offers Master's degree)
- City Colleges of Chicago-Harry S Truman College (Full-time enrollment: 9,050; Location: 1145 W Wilson Ave.; Public; Website: ccc.edu/colleges/truman/pages/default.aspx)
- City Colleges of Chicago-Wilbur Wright College (Full-time enrollment: 8,683; Location: 4300 N Narragansett; Public; Website: ccc.edu/colleges/wright/pages/default.aspx)
- Northeastern Illinois University (Full-time enrollment: 8,004; Location: 5500 N Saint Louis Ave; Public; Website: www.neiu.edu/; Offers Master's degree)
- City Colleges of Chicago-Richard J Daley College (Full-time enrollment: 7,497; Location: 7500 S Pulaski Rd; Public; Website: ccc.edu/colleges/daley/pages/default.aspx)
- City Colleges of Chicago-Harold Washington College (Full-time enrollment: 6,987; Location: 30 E Lake St; Public; Website: www.ccc.edu/colleges/washington/Pages/default.aspx)
- City Colleges of Chicago-Malcolm X College (Full-time enrollment: 5,494; Location: 1900 W Van Buren; Public; Website: www.ccc.edu/colleges/malcolm-x/pages/default.aspx)
- Illinois Institute of Technology (Full-time enrollment: 5,450; Location: 3300 S Federal St; Private, not-for-profit; Website: www.iit.edu; Offers Doctor's degree)
- City Colleges of Chicago-Kennedy-King College (Full-time enrollment: 5,044; Location: 6301 S Halsted St; Public; Website: www.ccc.edu/colleges/kennedy/pages/default.aspx)
- Roosevelt University (Full-time enrollment: 4,683; Location: 430 S Michigan Ave; Private, not-for-profit; Website: www.roosevelt.edu; Offers Doctor's degree)
- Chicago State University (Full-time enrollment: 4,352; Location: 9501 S. King Drive; Public; Website: www.csu.edu; Offers Doctor's degree)
- City Colleges of Chicago-Olive-Harvey College (Full-time enrollment: 4,110; Location: 10001 S Woodlawn Ave; Public; Website: ccc.edu/colleges/olive-harvey/pages/default.aspx)
- National Louis University (Full-time enrollment: 4,093; Location: 122 S Michigan Ave; Private, not-for-profit; Website: www.nl.edu; Offers Doctor's degree)
- Robert Morris University Illinois (Full-time enrollment: 3,975; Location: 401 S State Street; Private, not-for-profit; Website: www.robertmorris.edu/; Offers Master's degree)
- Saint Xavier University (Full-time enrollment: 3,576; Location: 3700 W 103rd St; Private, not-for-profit; Website: WWW.SXU.EDU; Offers Master's degree)
Biggest public high schools in Chicago:
- LANE TECHNICAL HIGH SCHOOL (Students: 4,088, Location: 2501 W ADDISON ST, Grades: 7-12)
- CURIE METROPOLITAN HIGH SCHOOL (Students: 3,252, Location: 4959 S ARCHER AVE, Grades: 9-12)
- KELLY HIGH SCHOOL (Students: 3,195, Location: 4136 S CALIFORNIA AVE, Grades: 9-12)
- YOUTH CONNECTIONS CHARTER HS (Students: 2,842, Location: 10 W 35TH ST, Grades: 10-12, Charter school)
- TAFT HIGH SCHOOL (Students: 2,596, Location: 6530 W BRYN MAWR AVE, Grades: 7-12)
- HYDE PARK ACADEMY HIGH SCHOOL (Students: 2,313, Location: 6220 S STONY ISLAND AVE, Grades: 9-12)
- LINCOLN PARK HIGH SCHOOL (Students: 2,215, Location: 2001 N ORCHARD ST, Grades: 9-12)
- YOUNG MAGNET HIGH SCHOOL (Students: 2,185, Location: 211 S LAFLIN ST, Grades: 7-12)
- CLEMENTE COMMUNITY ACADEMY HS (Students: 2,183, Location: 1147 N WESTERN AVE, Grades: 9-12)
- FARRAGUT CAREER ACADEMY HS (Students: 2,114, Location: 2345 S CHRISTIANA AVE, Grades: PK-12)
Biggest private high schools in Chicago:
- UNIV OF CHICAGO LAB SCHOOL (Students: 1,809, Location: 1362 E 59TH ST, Grades: PK-12)
- MARIST HIGH SCHOOL (Students: 1,780, Location: 4200 W 115TH ST, Grades: 9-12)
- ST IGNATIUS COLLEGE PREP (Students: 1,378, Location: 1076 W ROOSEVELT RD, Grades: 9-12)
- DE LA SALLE INSTITUTE - INSTITUTE CAMPUS (Students: 1,108, Location: 3434 S MICHIGAN, Grades: 9-12)
- THE LATIN SCHOOL OF CHICAGO (Students: 1,105, Location: 59 W NORTH BLVD, Grades: PK-12)
- BR RICE HIGH SCHOOL (Students: 842, Location: 10001 S PULASKI RD, Grades: 9-12, Boys only)
- ST PATRICK HIGH SCHOOL (Students: 808, Location: 5900 W BELMONT, Grades: 9-12, Boys only)
- MOUNT CARMEL HIGH SCHOOL (Students: 755, Location: 6410 S DANTE AVE, Grades: 9-12, Boys only)
- ST RITA OF CASCIA HIGH SCHOOL (Students: 711, Location: 7740 S WESTERN AVE, Grades: 9-12, Boys only)
- BRITISH SCHOOL OF CHICAGO (Students: 700, Location: 814 W EASTMAN ST, Grades: PK-12)
Biggest public elementary/middle schools in Chicago:
- SAWYER ELEM SCHOOL (Students: 2,044, Location: 5248 S SAWYER AVE, Grades: KG-8)
- SHIELDS ELEM SCHOOL (Students: 1,843, Location: 4250 S ROCKWELL ST, Grades: PK-4)
- EBERHART ELEM SCHOOL (Students: 1,795, Location: 3400 W 65TH PL, Grades: PK-8)
- MARQUETTE ELEM SCHOOL (Students: 1,668, Location: 6550 S RICHMOND ST, Grades: PK-8)
- HANSON PARK ELEM SCHOOL (Students: 1,569, Location: 5411 W FULLERTON AVE, Grades: PK-8)
- DAVIS N ELEM SCHOOL (Students: 1,565, Location: 3014 W 39TH PL, Grades: PK-8)
- REILLY ELEM SCHOOL (Students: 1,560, Location: 3650 W SCHOOL ST, Grades: PK-8)
- EDWARDS ELEM SCHOOL (Students: 1,532, Location: 4815 S KARLOV AVE, Grades: PK-8)
- FALCONER ELEM SCHOOL (Students: 1,532, Location: 3020 N LAMON AVE, Grades: PK-6)
- DISNEY ELEM MAGNET SCHOOL (Students: 1,528, Location: 4140 N MARINE DR, Grades: PK-8)
Biggest private elementary/middle schools in Chicago:
- FRANCES XAVIER WARDE SCHOOL (Students: 895, Location: 751 N STATE ST, Grades: PK-8)
- BAIS YAAKOV HEBREW PAROCHIAL (Students: 709, Location: 3200 W PETERSON AVE, Grades: KG-8, Girls only)
- ST JOHN FISHER ELEMENTARY SCHOOL (Students: 701, Location: 10200 S WASHTENAW AVE, Grades: PK-8)
- SACRED HEART SCHOOLS (Students: 700, Location: 6250 N SHERIDAN RD, Grades: KG-8)
- ST DANIEL THE PROPHET SCHOOL (Students: 640, Location: 5337 S NATOMA AVE, Grades: PK-8)
- EVANGELICAL CHRISTIAN SCHOOL (Students: 571, Location: 9130 S VINCENNES AVE, Grades: PK-8)
- JOAN DACHS BAIS YAAKOV ELEMENTARY SCHOOL (Students: 548, Location: 6110 N CALIFORNIA AVE, Grades: PK-8)
- ST JULIANA SCHOOL (Students: 537, Location: 7400 W TOUHY AVE, Grades: PK-8)
- ST CHRISTINA SCHOOL (Students: 535, Location: 3333 W 110TH ST, Grades: PK-8)
- BERNARD ZELL ANSHE EMET DAY SCHOOL (Students: 523, Location: 3751 N BROADWAY ST, Grades: PK-8)
Library in Chicago:
- CHICAGO PUBLIC LIBRARY (Operating income: $99,548,289; Location: 400 SOUTH STATE STREET; 5,526,677 books; 1,095 e-books; 254,956 audio materials; 364,629 video materials; 61 local licensed databases; 18 state licensed databases; 5 other licensed databases; 16,905 print serial subscriptions; 773 electronic serial subscriptions)
User-submitted facts and corrections:
- Other notable locations in the city include Navy Pier, Sears Tower, U.S Cellular Field formerly known as Comisky Park. Another beach to include is Foster Avenue Beach.
- WFBT-CA (Channel 23; CHICAGO, IL; Owner: CHANNEL 23 LIMITED PARTNERSHIP) has added one more Channel in 2005. Now they also own WFBT-CA Channel 48. added by Thomas
- WOCH-LP Channel 28 Has Canged It's Channel to Channel 41 is a Class A CHannel Korean Channel WOCH-CA Channel 41 added by randallrocket
- Marist High School turned Co-Ed in 2002.
- Calumet Heights (Stony Island Heights & Pill Hill) UC Physicians Hospital; Stony Island Medical; Advocate Hospital/Clinic; Advocate Trinity Hospital added by Calumetman
- The area codes for chicago are only 773 and 312. The others are surrounding suburbs or city businesses placed in suburban areas
- "One of the cool buildings from the ground" is the Aon Building (formerly the Standard Oil building, which then was known as the BP Amoco Building) on the East Loop of Chicago
- Meigs Field (airport) has been demolished! It no longer exists! The area is now the Museum Campus.
- In "Other Use Airports" listing * MERRILL C MEIGS (about 6 miles; CHICAGO, IL; ID: CGX).* Meigs Field no longer exists. It was destroyed at Mayor Daley's request in January 2003.
- The former Meigs Field, is not the Musem Campus, it is Northerly Island, which includes open parkland under the administration of the Chicago Park District as well as Charter One Pavilion, an open-air ampitheatre for concerts and other live performances.
Points of interest:
Notable locations in Chicago: Jackson Park Yacht Club (A), Billy Caldwell Golf Course (B), Storks at Play (C), Council Ring (D), North Pier Terminal (E), Lake Meadows Tennis Club (F), Congress Plaza (G), Model Yacht Basin (H), Maplewood Station (I), Addison-Kedzie Industrial District (J), South Water Market (K), South Slip (L), Grayland Station (M), LaSalle Street Station (N), Jackson Park Motor Boat Club (O), Signal of Peace Monument (P), Francis S Drexel Fountain (Q), Douglas Station (R), Waveland Avenue Golf Course (S), Wrigley Field (T). Display/hide their locations on the map
Shopping Centers: Portage Park Shopping Center (1), Lincoln Village Shopping Center (2), Ford City Mall Shopping Center (3), Brickyard Mall Shopping Center (4), Holiday Plaza Shopping Center (5), Kimbark Plaza Shopping Center (6), Hyde Park Shopping Center (7), Harper Court Shopping Center (8), Dorchester Commons Shopping Center (9). Display/hide their locations on the map
Main business address in Chicago include: ARCHIPELAGO HOLDINGS INC (A), ARVIDA JMB PARTNERS L P (B), FIRST CAPITAL INCOME PROPERTIES LTD SERIES XI (C), CLICK COMMERCE INC (D), IDS MANAGED FUTURES II L P (E), GENERAL GROWTH PROPERTIES INC (F), OIL DRI CORPORATION OF AMERICA (G), OLD REPUBLIC INTERNATIONAL CORP (H). Display/hide their locations on the map
Churches in Chicago include: Abundant Life Missionary Baptist Church (A), Addison Street Congregational Church (B), Albany Park Baptist Church (C), Albany Park Lutheran Church (D), All Angels Deaf Congregation (E), All Nation Pentecost Assembly Church (F), All Nation Pentecostal House of Prayer (G), All Nations Church of God (H), All Nations Church of God and Christ (I). Display/hide their locations on the map
Cemeteries: Acacia Park Cemetery (1), All Saints Polish National Catholic Cemetery (2), Westlawn Jewish Cemetery (3), Bethel Cemetery (4), Bohemian National Cemetery of Chicago (5), Wunders Lutheran Cemetery (6), Resthaven Cemetery (7). Display/hide their locations on the map
Lakes, reservoirs, and swamps: North Pond (A), Wolf Lake (B), West Lagoon (C), Schiller Pond (D), South Lagoon (E), South Pond (F), Gun Club Ponds (G), Dead Stick Pond (H). Display/hide their locations on the map
Rivers and creeks: Chicago River (A), Calumet River (B), Higgins Creek (C). Display/hide their locations on the map
Parks in Chicago include: Ohio Park (1), Ohio and Harding Park (2), Palmer Park (3), Palmer Square (4), Lincoln Memorial (5), Lake Shore Playground (6), Parkview Park (7), Paschen Park (8), Pasteur Park (9). Display/hide their locations on the map
Beaches: Sixty-seventh Street Beach (A), Ardmore Hollywood Beach (B), Fullerton Beach (C), Thirty-first Street Beach (D), Fortyninth Street Beach (E), Wilson Beach (F), Thorndale Avenue Beach (G), Fiftyninth Street Beach (H), Forty-Ninth Street Beach (I). Display/hide their locations on the map
Tourist attractions: Chicago Historical Society (Museums; Clark Street At N Avenue) (1), Chicago Then & Now (Museums; 5600 North Mannheim Road) (2), Adler Planetarium & Astronomy Museum (1300 South Lake Shore Drive) (3), Edgewater Historical Society (Museums; 5358 North Ashland Avenue) (4), Field Museum (1400 South Lake Shore Drive) (5), Arts Club of Chicago (Museums; 201 East Ontario Street) (6), Dusable Museum of African American History (740 East 56th Place) (7), Chicago Peregrine Release (Museums; 4001 North Ravenswood Avenue) (8), Chinatown Museum Foundation (601 West 31st Street) (9). Display/hide their approximate locations on the map
Hotels: Extended Stay America (7524 South State Road) (1), Embassy Suites Lakefront (511 North Columbus Drive) (2), Cottage Inn (8135 South Cottage Grove Avenue) (3), Holiday Inn Express (350 W. Hubbard) (4), Club Quarters (75 East Wacker Drive) (5), Gold Coast Bed & Breakfast (113 West Elm Street) (6), Bialystok Pub (3653 West Diversey Avenue) (7), Fairmont Hotel - Regional Sales Office (200 North Columbus Drive) (8), Burnham Hotel (One West Washington) (9). Display/hide their approximate locations on the map
Courts: Cook County Departments - Circuit Court Clerk- First Municipal Criminal Departments- Branc (155 West 51st Street) (1), Cook County Departments - Circuit Court Clerk- First Municipal Criminal Departments- Genl (118 North Clark Street) (2), Illinois State - Human Services Dept- Assistant Secretary-Operations (401 South Clinton Street) (3), Illinois State - Courts- Supreme Court Of Iii (160 North La Salle Street) (4), Courts - Federal - Appeals Court - 7th Circuit- Clerk's Office Informa (219 South Dearborn Street) (5), Illinois State - Revenue Dept- Illinois Gaming Board (160 North La Salle Street) (6), Illinois State - Appellate Defender- First Judicial District (100 West Randolph Street) (7), Judicial Inquiry Board - Executive Ofc (100 West Randolph Street) (8), Cook County - Chicago- Circuit Court Clerk- Criminal Division- General Information Chi (2600 South California Avenue) (9). Display/hide their approximate locations on the map
Birthplace of: Olaf M. Hustvedt - Admiral, Dennis DeYoung - Male singer, Rickey Henderson - (born 1958), baseball player, Theodore Kaczynski - (born 1942), the Unabomber, John C. Reilly - Actor, Michael Crichton - Novelist, Michael Carlson - Chef, John Ashcroft - Attorney General of US, CM Punk - Professional wrestler, Jason Robards - Film actor.
Drinking water stations with addresses in Chicago and their reported violations in the past:
CHICAGO (Population served: 2,695,598, Surface water):Past monitoring violations:CENTRAL STICKNEY SD (Population served: 1,800, Purch surface water):
- Monitoring, Turbidity (Enhanced SWTR) - In OCT-2012, Contaminant: IESWTR. Follow-up actions: St Public Notif requested (NOV-13-2012), St Violation/Reminder Notice (NOV-13-2012), St Compliance achieved (DEC-06-2012), St Public Notif received (JUL-10-2013)
- Monitoring, Turbidity (Enhanced SWTR) - In SEP-2012, Contaminant: IESWTR. Follow-up actions: St Public Notif requested (OCT-11-2012), St Violation/Reminder Notice (OCT-11-2012), St Compliance achieved (DEC-06-2012), St Public Notif received (JUL-10-2013)
- Monitoring, Turbidity (Enhanced SWTR) - In DEC-2008, Contaminant: IESWTR. Follow-up actions: St Public Notif requested (JAN-13-2009), St Violation/Reminder Notice (JAN-13-2009), St Compliance achieved (FEB-09-2009), St Public Notif received (JUL-01-2009)
Past monitoring violations:BLACKHAWK ESTATES LLC (Population served: 1,238, Groundwater):
- Monitoring and Reporting (DBP) - Between OCT-2007 and DEC-2007, Contaminant: Chlorine. Follow-up actions: St Compliance achieved (NOV-16-2007), St Violation/Reminder Notice (NOV-28-2007)
Past health violations:THOUSAND TRAILS CONROE (Serves TX, Population served: 375, Groundwater):Past monitoring violations:
- MCL, Average - Between OCT-2005 and DEC-2005, Contaminant: Combined Radium (-226 and -228). Follow-up actions: St Formal NOV issued (JAN-26-2004), St BCA signed (MAR-23-2004), St Compliance achieved (OCT-10-2005), St Public Notif requested (NOV-08-2005), St Violation/Reminder Notice (NOV-08-2005), St Public Notif received (DEC-12-2005)
- MCL, Average - Between JUL-2005 and SEP-2005, Contaminant: Combined Radium (-226 and -228). Follow-up actions: St Formal NOV issued (JAN-26-2004), St BCA signed (MAR-23-2004), St Public Notif requested (OCT-07-2005), St Violation/Reminder Notice (OCT-07-2005), St Compliance achieved (OCT-10-2005), St Public Notif received (OCT-26-2005)
- MCL, Average - Between APR-2005 and JUN-2005, Contaminant: Combined Radium (-226 and -228). Follow-up actions: St Formal NOV issued (JAN-26-2004), St BCA signed (MAR-23-2004), St Public Notif requested (JUN-03-2005), St Violation/Reminder Notice (JUN-03-2005), St Public Notif received (JUN-17-2005), St Compliance achieved (OCT-10-2005)
- MCL, Average - Between APR-2005 and JUN-2005, Contaminant: Gross Alpha, Excl. Radon and U. Follow-up actions: St Formal NOV issued (OCT-27-2004), St BCA signed (JAN-19-2005), St Compliance achieved (APR-12-2005), St Public Notif requested (JUN-03-2005), St Violation/Reminder Notice (JUN-03-2005), St Public Notif received (JUN-17-2005)
- Lead Consumer Notice - In JAN-02-2013, Contaminant: Lead and Copper Rule. Follow-up actions: St Violation/Reminder Notice (JAN-04-2013), St Compliance achieved (JAN-18-2013)
- Monitoring and Reporting (DBP) - Between JUL-2012 and SEP-2012, Contaminant: Chlorine. Follow-up actions: St Compliance achieved (OCT-05-2012), St Public Notif requested (OCT-16-2012), St Violation/Reminder Notice (OCT-16-2012), St Public Notif received (JUN-27-2013)
- Lead Consumer Notice - In JAN-02-2010, Contaminant: Lead and Copper Rule. Follow-up actions: St Violation/Reminder Notice (JAN-12-2010), St Compliance achieved (MAR-29-2010)
- One regular monitoring violation
Past monitoring violations:ELDORADO ESTATES (Serves FL, Population served: 264, Groundwater):
- One routine major monitoring violation
Past health violations:NATIONAL SHOPPING PLAZA (Address: 333 W WACKER DRIVE, SUITE 2750 , Population served: 175, Groundwater):
- MCL, Average - Between APR-2006 and JUN-2006, Contaminant: TTHM. Follow-up actions: St Violation/Reminder Notice (JUL-18-2006), St Compliance achieved (AUG-03-2007)
- MCL, Average - Between JAN-2006 and MAR-2006, Contaminant: TTHM. Follow-up actions: St Violation/Reminder Notice (APR-19-2006), St Public Notif requested (APR-19-2006), St Public Notif received (APR-26-2006), St Compliance achieved (AUG-03-2007)
- MCL, Average - Between OCT-2005 and DEC-2005, Contaminant: Total Haloacetic Acids (HAA5). Follow-up actions: St Violation/Reminder Notice (JAN-23-2006), St Public Notif requested (JAN-23-2006), St Public Notif received (JAN-26-2006), St Compliance achieved (AUG-03-2007)
- MCL, Average - Between OCT-2005 and DEC-2005, Contaminant: TTHM. Follow-up actions: St Violation/Reminder Notice (JAN-23-2006), St Public Notif requested (JAN-23-2006), St Public Notif received (JAN-26-2006), St Compliance achieved (AUG-03-2007)
- MCL, Average - Between JUL-2005 and SEP-2005, Contaminant: TTHM. Follow-up actions: St Violation/Reminder Notice (JUN-29-2005), St Compliance Meeting conducted (SEP-08-2005), St Public Notif requested (OCT-10-2005), St Public Notif received (OCT-18-2005), St Compliance achieved (AUG-03-2007)
- MCL, Average - Between APR-2005 and JUN-2005, Contaminant: TTHM. Follow-up actions: St Violation/Reminder Notice (JUN-29-2005), St Public Notif requested (JUL-22-2005), St Public Notif received (JUL-27-2005), St Compliance Meeting conducted (SEP-08-2005), St Compliance achieved (AUG-03-2007)
Past monitoring violations:THOUSAND TRAILS PALM SPRINGS - MHC (Serves CA, Population served: 125, Groundwater):
- One regular monitoring violation
Past health violations:LYNN HILL COURT (Serves IN, Population served: 112, Groundwater):Past monitoring violations:
- MCL, Monthly (TCR) - In DEC-2012, Contaminant: Coliform. Follow-up actions: St Formal NOV issued (JAN-08-2013)
- One routine major monitoring violation
- One regular monitoring violation
Past health violations:Past monitoring violations:
- MCL, Monthly (TCR) - In SEP-2010, Contaminant: Coliform. Follow-up actions: St Boil Water Order (OCT-04-2010), St Violation/Reminder Notice (OCT-04-2010), St Public Notif requested (OCT-04-2010), St Compliance achieved (2 times from JAN-20-2011 to OCT-26-2011)
- MCL, Monthly (TCR) - In OCT-2008, Contaminant: Coliform. Follow-up actions: St Boil Water Order (OCT-21-2008), St Violation/Reminder Notice (OCT-21-2008), St Public Notif requested (OCT-21-2008), St Compliance achieved (3 times from JAN-28-2009 to OCT-26-2011)
- MCL, Monthly (TCR) - In JUL-2008, Contaminant: Coliform. Follow-up actions: St Public Notif requested (JUL-25-2008), St Violation/Reminder Notice (JUL-25-2008), St Compliance achieved (3 times from JAN-28-2009 to OCT-26-2011)
- Follow-up Or Routine LCR Tap M/R - In OCT-01-2010, Contaminant: Lead and Copper Rule. Follow-up actions: St Public Notif requested (DEC-01-2010), St Violation/Reminder Notice (DEC-01-2010), St Compliance achieved (AUG-31-2012)
- Monitoring, Repeat Major (TCR) - In AUG-2008, Contaminant: Coliform (TCR). Follow-up actions: St Public Notif requested (JUL-25-2008), St Violation/Reminder Notice (JUL-25-2008), St Public Notif received (SEP-26-2008), St Compliance achieved (3 times from JAN-28-2009 to OCT-26-2011)
- Follow-up Or Routine LCR Tap M/R - In OCT-10-2006, Contaminant: Lead and Copper Rule. Follow-up actions: St Public Notif requested (NOV-09-2006), St Violation/Reminder Notice (NOV-09-2006), St Compliance achieved (2 times from OCT-19-2007 to MAR-17-2010)
- 11 routine major monitoring violations
- 6 minor monitoring violations
- 13 regular monitoring violations
Drinking water stations with addresses in Chicago that have no violations reported:
- THOUSAND TRAILS CAMPGROUND (Address: Suite 800 , Serves MI, Population served: 600, Primary Water Source Type: Groundwater)
- PLYMOUTH ROCK CAMPGROUND -RESTAURANT WELL (Serves WI, Population served: 516, Primary Water Source Type: Groundwater)
- PLYMOUTH ROCK CAMPGROUND -SNOB HILL (Serves WI, Population served: 516, Primary Water Source Type: Groundwater)
- PLYMOUTH ROCK CAMPGROUND -STORE WELL (Serves WI, Population served: 516, Primary Water Source Type: Groundwater)
- PLYMOUTH ROCK CAMPGROUND -NORTHWOODS LANDING (Serves WI, Population served: 516, Primary Water Source Type: Groundwater)
- PLYMOUTH ROCK CAMPGROUND -600 AREA (Serves WI, Population served: 516, Primary Water Source Type: Groundwater)
- MHC MEDINA LAKE CAMPGROUNDS (Serves TX, Population served: 400, Primary Water Source Type: Groundwater)
- CORTLAND CORNERS MHP (Population served: 250, Primary Water Source Type: Groundwater)
- SALVATION ARMY WONDERLAND CAMP (Serves WI, Population served: 200, Primary Water Source Type: Groundwater)
- COUNTRY ACRES (Address: 134 NORTH LASALLE STREET, SUITE 1515 , Serves MI, Population served: 160, Primary Water Source Type: Groundwater)
| This city: | 2.5 people |
| Illinois: | 2.6 people |
| This city: | 55.2% |
| Whole state: | 65.8% |
| This city: | 7.8% |
| Whole state: | 6.3% |
Likely homosexual households (counted as self-reported same-sex unmarried-partner households)
- Lesbian couples: 0.4% of all households
- Gay men: 0.7% of all households
People in group quarters in Chicago in 2010:
- 20,784 people in college/university student housing
- 14,382 people in nursing facilities/skilled-nursing facilities
- 9,507 people in local jails and other municipal confinement facilities
- 4,212 people in other noninstitutional facilities
- 3,915 people in emergency and transitional shelters (with sleeping facilities) for people experiencing homelessness
- 2,225 people in residential treatment centers for adults
- 1,531 people in group homes intended for adults
- 1,323 people in correctional residential facilities
- 609 people in federal detention centers
- 360 people in residential treatment centers for juveniles (non-correctional)
- 338 people in mental (psychiatric) hospitals and psychiatric units in other hospitals
- 313 people in workers' group living quarters and job corps centers
- 245 people in group homes for juveniles (non-correctional)
- 179 people in state prisons
- 161 people in hospitals with patients who have no usual home elsewhere
- 139 people in correctional facilities intended for juveniles
- 16 people in military barracks and dormitories (nondisciplinary)
- 7 people in in-patient hospice facilities
People in group quarters in Chicago in 2000:
- 15,887 people in college dormitories (includes college quarters off campus)
- 13,839 people in nursing homes
- 10,565 people in local jails and other confinement facilities (including police lockups)
- 6,632 people in other noninstitutional group quarters
- 2,827 people in other nonhousehold living situations
- 2,484 people in religious group quarters
- 1,674 people in homes or halfway houses for drug/alcohol abuse
- 1,264 people in other group homes
- 934 people in homes for the mentally ill
- 629 people in mental (psychiatric) hospitals or wards
- 477 people in state prisons
- 473 people in federal prisons and detention centers
- 368 people in hospitals/wards and hospices for chronically ill
- 368 people in other hospitals or wards for chronically ill
- 364 people in hospitals or wards for drug/alcohol abuse
- 280 people in agriculture workers' dormitories on farms
- 168 people in homes for abused, dependent, and neglected children
- 151 people in homes for the mentally retarded
- 143 people in halfway houses
- 96 people in wards in general hospitals for patients who have no usual home elsewhere
- 90 people in training schools for juvenile delinquents
- 61 people in homes for the physically handicapped
- 56 people in unknown juvenile institutions
- 41 people in residential treatment centers for emotionally disturbed children
- 17 people in job corps and vocational training facilities
- 13 people in short-term care, detention or diagnostic centers for delinquent children
- 12 people in other workers' dormitories
Arenas or stadiums:
- Soldier Field. Capacity: 63,000. Chicago Bears.
- Wrigley Field. Capacity: 41,118. Chicago Cubs.
- U.S. Cellular Field. Capacity: 40,615. Chicago White Sox.
- UIC Pavilion. Chicago Sky (WNBA).
- United Center. Chicago Bulls (NBA), Chicago Blackhawks (NHL).
- Alumni Hall (DePaul University). DePaul University.
- Joseph J. Gentile Center. Loyola University Chicago.
Banks with most branches in Chicago (2011 data):
- JPMorgan Chase Bank, National Association: 127 branches. Info updated 2011/11/10: Bank assets: $1,811,678.0 mil, Deposits: $1,190,738.0 mil, headquarters in Columbus, OH, positive income, International Specialization, 5577 total offices, Holding Company: Jpmorgan Chase & Co.
- Bank of America, National Association: 67 branches. Info updated 2009/11/18: Bank assets: $1,451,969.3 mil, Deposits: $1,077,176.8 mil, headquarters in Charlotte, NC, positive income, 5782 total offices, Holding Company: Bank Of America Corporation
- TCF National Bank: 45 branches. Info updated 2009/11/23: Bank assets: $19,007.0 mil, Deposits: $12,377.0 mil, headquarters in Sioux Falls, SD, positive income, Commercial Lending Specialization, 441 total offices, Holding Company: Tcf Financial Corporation
- PNC Bank, National Association: 42 branches. Info updated 2012/03/20: Bank assets: $263,309.6 mil, Deposits: $197,343.0 mil, headquarters in Wilmington, DE, positive income, Commercial Lending Specialization, 3085 total offices, Holding Company: Pnc Financial Services Group, Inc., The
- Fifth Third Bank: 39 branches. Info updated 2009/10/05: Bank assets: $114,540.4 mil, Deposits: $89,689.1 mil, headquarters in Cincinnati, OH, positive income, Commercial Lending Specialization, 1378 total offices, Holding Company: Fifth Third Bancorp
- Citibank, National Association: 34 branches. Info updated 2012/01/10: Bank assets: $1,288,658.0 mil, Deposits: $882,541.0 mil, headquarters in Sioux Falls, SD, positive income, International Specialization, 1048 total offices, Holding Company: Citigroup Inc.
- North Community Bank: 32 branches. Info updated 2011/04/12: Bank assets: $952.1 mil, Deposits: $858.0 mil, local headquarters, negative income in the last year, Commercial Lending Specialization, 41 total offices, Holding Company: Metropolitan Bank Group, Inc.
- MB Financial Bank, National Association: 31 branches. Info updated 2010/04/27: Bank assets: $9,792.4 mil, Deposits: $7,757.4 mil, local headquarters, positive income, Commercial Lending Specialization, 93 total offices, Holding Company: Mb Financial, Inc
- BMO Harris Bank National Association: 31 branches. Info updated 2011/07/14: Bank assets: $97,264.0 mil, Deposits: $75,624.6 mil, local headquarters, positive income, 717 total offices, Holding Company: Bank Of Montreal
- 90 other banks with 292 local branches
For population 15 years and over in Chicago:
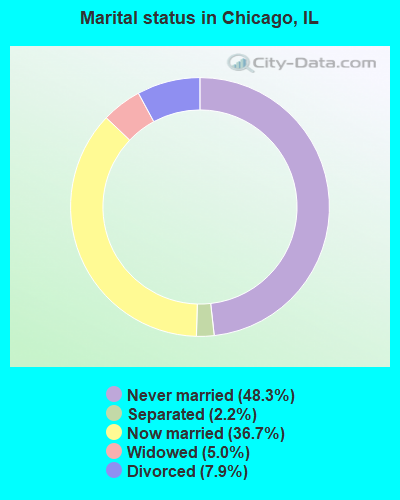
- Never married: 48.3%
- Now married: 36.7%
- Separated: 2.2%
- Widowed: 5.0%
- Divorced: 7.9%
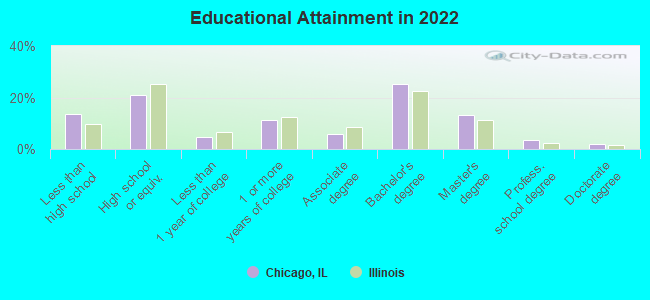
For population 25 years and over in Chicago:
- High school or higher: 86.5%
- Bachelor's degree or higher: 43.7%
- Graduate or professional degree: 18.6%
- Unemployed: 5.4%
- Mean travel time to work (commute): 26.4 minutes
| Here: | 14.5 |
| Illinois average: | 12.5 |


Graphs represent county-level data. Detailed 2008 Election Results
Neighborhoods in Chicago:
(Chicago, Illinois Neighborhood Map)- Albany Park neighborhood
- Andersonville neighborhood
- Archer Heights neighborhood
- Armour Square neighborhood
- Ashburn neighborhood
- Auburn Gresham neighborhood
- Austin neighborhood
- Avalon Park neighborhood
- Avondale neighborhood
- Belmont Cragin neighborhood
- Beverly neighborhood
- Brainerd neighborhood
- Bridgeport neighborhood
- Brighton Park neighborhood
- Bronzeville neighborhood
- Bucktown neighborhood
- Burnside neighborhood
- Cabrini-Green (Cabrini Green) neighborhood
- Canaryville neighborhood
- Chatham neighborhood
- Chicago Loop (The Loop) neighborhood
- Chinatown neighborhood
- Clearing neighborhood
- Cragin (Belmont Cragin) neighborhood
- Depaul neighborhood
- Douglas neighborhood
- Dunning neighborhood
- East Garfield Park neighborhood
- East Side neighborhood
- Edgewater neighborhood
- Edison Park neighborhood
- Englewood neighborhood
- Forest Glen neighborhood
- Fuller Park neighborhood
- Fulton Market neighborhood
- Gage Park neighborhood
- Garfield Ridge neighborhood
- Gold Coast neighborhood
- Goose Island neighborhood
- Grand Boulevard neighborhood
- Greater Grand Crossing neighborhood
- Greektown neighborhood
- Hegewisch neighborhood
- Hermosa neighborhood
- Humboldt Park neighborhood
- Hyde Park neighborhood
- Irving Park neighborhood
- Jefferson Park neighborhood
- Jeffery Manor neighborhood
- Kenwood neighborhood
- Lakeview (Wrigleyville) neighborhood
- Lakeview East (East LakeView) neighborhood
- Lawndale neighborhood
- Lincoln Park neighborhood
- Lincoln Square neighborhood
- Little Italy neighborhood
- Logan Square neighborhood
- Loop neighborhood
- Lower West Side (Pilsen) neighborhood
- Madison Square neighborhood
- Magnificent Mile (Michigan Avenue) neighborhood
- Marquette Park (Chicago Lawn) neighborhood
- McKinley Park neighborhood
- Medical Village neighborhood
- Morgan Park neighborhood
- Mount Greenwood neighborhood
- Near North Side neighborhood
- Near South Side neighborhood
- Near West Side neighborhood
- New City (Back of the Yards) neighborhood
- New Eastside neighborhood
- Noble Square neighborhood
- North Center neighborhood
- North Lawndale neighborhood
- North Park neighborhood
- Northalsted (Boys Town) neighborhood
- Norwood Park neighborhood
- O'Hare neighborhood
- Oakland neighborhood
- Old Town neighborhood
- Pill Hill (Calumet Heights) neighborhood
- Portage Park neighborhood
- Printer's Row (Printers Row) neighborhood
- Pullman neighborhood
- Ravenswood neighborhood
- River East neighborhood
- River North neighborhood
- River West neighborhood
- Riverdale neighborhood
- Rogers Park neighborhood
- Roscoe Village neighborhood
- Roseland neighborhood
- Sauganash neighborhood
- Scottsdale neighborhood
- South Chicago neighborhood
- South Deering neighborhood
- South Lawndale (Little Village) neighborhood
- South Loop neighborhood
- South Shore neighborhood
- Streeterville neighborhood
- Tri-taylor neighborhood
- Ukrainian Village neighborhood
- University Village neighborhood
- Uptown neighborhood
- Washington Heights neighborhood
- Washington Park neighborhood
- West Elsdon neighborhood
- West Englewood neighborhood
- West Garfield Park neighborhood
- West Lawn neighborhood
- West Loop neighborhood
- West Park neighborhood
- West Pullman neighborhood
- West Ridge (West Rogers Park) neighborhood
- West Town neighborhood
- Wicker Park neighborhood
- Woodlawn neighborhood
Religion statistics for Chicago, IL (based on Cook County data)


| Religion | Adherents | Congregations |
|---|---|---|
| Catholic | 1,947,223 | 376 |
| Evangelical Protestant | 432,975 | 1,484 |
| Other | 312,636 | 403 |
| Mainline Protestant | 202,114 | 630 |
| Black Protestant | 148,895 | 395 |
| Orthodox | 53,276 | 66 |
| None | 2,097,556 | - |
Food Environment Statistics:
| This county: | 2.77 / 10,000 pop. |
| Illinois: | 2.24 / 10,000 pop. |
| Here: | 0.04 / 10,000 pop. |
| Illinois: | 0.08 / 10,000 pop. |
| Cook County: | 0.93 / 10,000 pop. |
| Illinois: | 0.75 / 10,000 pop. |
| This county: | 1.53 / 10,000 pop. |
| Illinois: | 2.61 / 10,000 pop. |
| Cook County: | 6.67 / 10,000 pop. |
| Illinois: | 6.86 / 10,000 pop. |
| This county: | 8.4% |
| Illinois: | 8.3% |
| Cook County: | 23.5% |
| Illinois: | 25.2% |
| Cook County: | 16.3% |
| Illinois: | 14.5% |
Health and Nutrition:
| This city: | 48.9% |
| Illinois: | 49.5% |
| This city: | 48.2% |
| State: | 47.2% |
| This city: | 28.7 |
| Illinois: | 28.6 |
| Chicago: | 18.6% |
| State: | 20.5% |
| This city: | 11.2% |
| Illinois: | 10.8% |
| Here: | 6.7 |
| Illinois: | 6.8 |
| Chicago: | 32.8% |
| Illinois: | 33.4% |
| Chicago: | 56.6% |
| Illinois: | 56.4% |
| Chicago: | 82.4% |
| State: | 79.9% |
More about Health and Nutrition of Chicago, IL Residents
| Local government employment and payroll (March 2022) | |||||
| Function | Full-time employees | Monthly full-time payroll | Average yearly full-time wage | Part-time employees | Monthly part-time payroll |
|---|---|---|---|---|---|
| Police Protection - Officers | 11,596 | $100,811,773 | $104,324 | 5 | $10,099 |
| Firefighters | 3,946 | $36,067,023 | $109,682 | 0 | $0 |
| Other and Unallocable | 2,956 | $22,792,212 | $92,526 | 197 | $378,646 |
| Streets and Highways | 2,019 | $14,572,604 | $86,613 | 0 | $0 |
| Airports | 1,497 | $10,866,623 | $87,107 | 28 | $51,332 |
| Water Supply | 1,444 | $11,749,175 | $97,639 | 0 | $0 |
| Other Government Administration | 945 | $6,901,405 | $87,637 | 66 | $119,480 |
| Police - Other | 857 | $6,040,272 | $84,578 | 0 | $0 |
| Fire - Other | 849 | $7,337,711 | $103,713 | 0 | $0 |
| Local Libraries | 703 | $4,607,244 | $78,644 | 281 | $460,113 |
| Financial Administration | 688 | $5,184,656 | $90,430 | 1 | $2,888 |
| Health | 658 | $5,109,238 | $93,178 | 9 | $17,580 |
| Solid Waste Management | 450 | $3,254,145 | $86,777 | 0 | $0 |
| Judicial and Legal | 302 | $2,593,370 | $103,048 | 0 | $0 |
| Welfare | 287 | $2,217,396 | $92,713 | 278 | $127,487 |
| Sewerage | 235 | $2,145,261 | $109,545 | 0 | $0 |
| Housing and Community Development (Local) | 80 | $622,405 | $93,361 | 5 | $11,935 |
| Totals for Government | 29,512 | $242,872,513 | $98,755 | 870 | $1,179,560 |
Chicago government finances - Expenditure in 2021 (per resident):
- Construction - Air Transportation: $874,764,000 ($328.24)
Regular Highways: $280,554,000 ($105.27)
Sewerage: $225,715,000 ($84.69)
Water Utilities: $198,918,000 ($74.64)
General - Other: $39,333,000 ($14.76)
Housing and Community Development: $17,043,000 ($6.40)
Libraries: $6,023,000 ($2.26)
General Public Buildings: $9,000 ($0.00)
- Current Operations - Police Protection: $1,726,801,000 ($647.95)
General - Other: $1,296,914,000 ($486.64)
Air Transportation: $787,686,000 ($295.56)
Local Fire Protection: $635,421,000 ($238.43)
Public Welfare - Other: $394,489,000 ($148.02)
Regular Highways: $329,442,000 ($123.62)
General Public Buildings: $229,729,000 ($86.20)
Housing and Community Development: $221,948,000 ($83.28)
Water Utilities: $215,305,000 ($80.79)
Health - Other: $172,744,000 ($64.82)
Solid Waste Management: $171,472,000 ($64.34)
Financial Administration: $162,867,000 ($61.11)
Libraries: $110,221,000 ($41.36)
Sewerage: $88,897,000 ($33.36)
Central Staff Services: $58,247,000 ($21.86)
Judicial and Legal Services: $31,922,000 ($11.98)
Parks and Recreation: $23,714,000 ($8.90)
Protective Inspection and Regulation - Other: $22,149,000 ($8.31)
Parking Facilities: $7,055,000 ($2.65)
Natural Resources - Other: $1,688,000 ($0.63)
- General - Interest on Debt: $1,036,813,000 ($389.04)
- Other Capital Outlay - General - Other: $58,168,000 ($21.83)
Police Protection: $22,059,000 ($8.28)
Local Fire Protection: $1,952,000 ($0.73)
General Public Building: $1,672,000 ($0.63)
Housing and Community Development: $1,626,000 ($0.61)
Libraries: $894,000 ($0.34)
Public Welfare - Other: $891,000 ($0.33)
Regular Highways: $460,000 ($0.17)
Judicial and Legal Services: $434,000 ($0.16)
Health - Other: $68,000 ($0.03)
Central Staff Services: $33,000 ($0.01)
Protective Inspection and Regulation - Other: $28,000 ($0.01)
Financial Administration: $4,000 ($0.00)
- Water Utilities - Interest on Debt: $95,895,000 ($35.98)
Chicago government finances - Revenue in 2021 (per resident):
- Charges - Air Transportation: $1,186,082,000 ($445.05)
Sewerage: $333,959,000 ($125.31)
Other: $255,681,000 ($95.94)
Solid Waste Management: $57,918,000 ($21.73)
Regular Highways: $22,326,000 ($8.38)
Parking Facilities: $7,055,000 ($2.65)
Parks and Recreation: $3,444,000 ($1.29)
Housing and Community Development: $563,000 ($0.21)
- Federal Intergovernmental - Air Transportation: $543,186,000 ($203.82)
Other: $388,832,000 ($145.90)
Housing and Community Development: $2,643,000 ($0.99)
Public Welfare: $747,000 ($0.28)
Highways: $73,000 ($0.03)
Health and Hospitals: $18,000 ($0.01)
- Local Intergovernmental - Other: $16,825,000 ($6.31)
Housing and Community Development: $6,857,000 ($2.57)
- Miscellaneous - Special Assessments: $844,162,000 ($316.75)
General Revenue - Other: $299,587,000 ($112.41)
Fines and Forfeits: $226,411,000 ($84.96)
Interest Earnings: $152,711,000 ($57.30)
Rents: $12,647,000 ($4.75)
Sale of Property: $1,160,000 ($0.44)
- Revenue - Water Utilities: $736,578,000 ($276.39)
- State Intergovernmental - General Local Government Support: $868,811,000 ($326.00)
Highways: $182,218,000 ($68.37)
Public Welfare: $88,313,000 ($33.14)
Other: $21,936,000 ($8.23)
Housing and Community Development: $14,210,000 ($5.33)
Health and Hospitals: $7,161,000 ($2.69)
- Tax - Property: $1,450,233,000 ($544.17)
Other Selective Sales: $898,380,000 ($337.10)
Public Utilities Sales: $584,793,000 ($219.43)
General Sales and Gross Receipts: $265,269,000 ($99.54)
Documentary and Stock Transfer: $182,376,000 ($68.43)
Amusements Sales: $104,657,000 ($39.27)
Other License: $91,820,000 ($34.45)
Motor Fuels Sales: $34,113,000 ($12.80)
Motor Vehicle License: $31,272,000 ($11.73)
Alcoholic Beverage Sales: $27,478,000 ($10.31)
Occupation and Business License - Other: $25,562,000 ($9.59)
Tobacco Products Sales: $20,815,000 ($7.81)
Alcoholic Beverage License: $10,136,000 ($3.80)
Insurance Premiums Sales: $6,146,000 ($2.31)
Other: $2,691,000 ($1.01)
Pari - mutuels Sales: $251,000 ($0.09)
Chicago government finances - Debt in 2021 (per resident):
- Long Term Debt - Beginning Outstanding - Unspecified Public Purpose: $26,929,170,000 ($10104.61)
Outstanding Unspecified Public Purpose: $26,721,488,000 ($10026.68)
Retired Unspecified Public Purpose: $3,562,549,000 ($1336.77)
Issue, Unspecified Public Purpose: $3,354,877,000 ($1258.85)
Beginning Outstanding - Public Debt for Private Purpose: $195,725,000 ($73.44)
Outstanding Nonguaranteed - Industrial Revenue: $177,707,000 ($66.68)
Retired Nonguaranteed - Public Debt for Private Purpose: $18,018,000 ($6.76)
Chicago government finances - Cash and Securities in 2021 (per resident):
- Bond Funds - Cash and Securities: $2,627,068,000 ($985.75)
- Other Funds - Cash and Securities: $5,596,961,000 ($2100.14)
- Sinking Funds - Cash and Securities: $1,367,945,000 ($513.29)
3.53% of this county's 2021 resident taxpayers lived in other counties in 2020 ($82,405 average adjusted gross income)
| Here: | 3.53% |
| Illinois average: | 5.09% |
0.01% of residents moved from foreign countries ($114 average AGI)
Cook County: 0.01% Illinois average: 0.01%
Top counties from which taxpayers relocated into this county between 2020 and 2021:
| from DuPage County, IL | |
| from Lake County, IL | |
| from Will County, IL |
5.44% of this county's 2020 resident taxpayers moved to other counties in 2021 ($120,340 average adjusted gross income)
| Here: | 5.44% |
| Illinois average: | 6.10% |
0.01% of residents moved to foreign countries ($140 average AGI)
Cook County: 0.01% Illinois average: 0.01%
Top counties to which taxpayers relocated from this county between 2020 and 2021:
| to DuPage County, IL | |
| to Will County, IL | |
| to Lake County, IL |
| Businesses in Chicago, IL | ||||
| Name | Count | Name | Count | |
|---|---|---|---|---|
| 7-Eleven | 74 | Jones New York | 14 | |
| ALDI | 27 | Juicy Couture | 1 | |
| ALDO | 9 | Just Tires | 2 | |
| AT&T | 18 | Justice | 1 | |
| Abercrombie & Fitch | 1 | KFC | 32 | |
| Abercrombie Kids | 1 | Kincaid | 1 | |
| Ace Hardware | 27 | Kmart | 5 | |
| Advance Auto Parts | 18 | Kohl's | 1 | |
| Aeropostale | 1 | Kroger | 4 | |
| Aerosoles | 1 | LA Fitness | 13 | |
| American Eagle Outfitters | 2 | La Quinta | 1 | |
| Ann Taylor | 8 | La-Z-Boy | 1 | |
| Apple Store | 2 | Lane Bryant | 3 | |
| Applebee's | 1 | Lane Furniture | 4 | |
| Arby's | 7 | LensCrafters | 4 | |
| Ascend Collection | 1 | Levi Strauss & Co. | 2 | |
| Audi | 1 | Little Caesars Pizza | 23 | |
| AutoZone | 35 | Long John Silver's | 6 | |
| Avenue | 5 | Lowe's | 3 | |
| BMW | 1 | Macy's | 2 | |
| Bakers | 2 | Marriott | 14 | |
| Bakers Square | 3 | Marshalls | 4 | |
| Bally Total Fitness | 11 | MasterBrand Cabinets | 53 | |
| Banana Republic | 4 | McDonald's | 123 | |
| Barnes & Noble | 2 | Men's Wearhouse | 7 | |
| Baskin-Robbins | 77 | Menards | 2 | |
| Bath & Body Works | 4 | Motherhood Maternity | 5 | |
| Bebe | 4 | New Balance | 13 | |
| Bed Bath & Beyond | 4 | New York & Co | 2 | |
| Ben & Jerry's | 3 | Nike | 175 | |
| Best Western | 3 | Nissan | 2 | |
| Blockbuster | 19 | Nordstrom | 3 | |
| Brooks Brothers | 2 | Office Depot | 7 | |
| Brookstone | 3 | OfficeMax | 2 | |
| Budget Car Rental | 6 | Old Country Buffet | 4 | |
| Buffalo Wild Wings | 1 | Old Navy | 4 | |
| Burger King | 28 | Outback | 1 | |
| Burlington Coat Factory | 5 | Outback Steakhouse | 1 | |
| CVS | 71 | Panda Express | 13 | |
| Cache | 1 | Panera Bread | 10 | |
| Caribou Coffee | 15 | Papa John's Pizza | 2 | |
| Carson Pirie Scott | 2 | Payless | 40 | |
| Casual Male XL | 2 | Penske | 11 | |
| Catherines | 2 | PetSmart | 3 | |
| Charlotte Russe | 2 | Pier 1 Imports | 5 | |
| Chevrolet | 4 | Pizza Hut | 14 | |
| Chico's | 1 | Plato's Closet | 1 | |
| Chipotle | 21 | Popeyes | 36 | |
| Chuck E. Cheese's | 2 | Pottery Barn | 1 | |
| Church's Chicken | 17 | Pottery Barn Kids | 1 | |
| Cinnabon | 4 | Qdoba Mexican Grill | 7 | |
| Circle K | 4 | Quiznos | 14 | |
| Clarks | 1 | RadioShack | 35 | |
| Cold Stone Creamery | 2 | Red Lobster | 1 | |
| Comfort Inn | 1 | Red Roof Inn | 1 | |
| Comfort Suites | 1 | Ryder Rental & Truck Leasing | 2 | |
| Costco | 1 | SAS Shoes | 3 | |
| Crate & Barrel | 3 | Safeway | 15 | |
| Cricket Wireless | 149 | Saks Fifth Avenue | 2 | |
| Curves | 13 | Sears | 15 | |
| DHL | 25 | Sephora | 3 | |
| Dairy Queen | 5 | Sheraton | 1 | |
| Deb | 1 | Shoe Carnival | 1 | |
| Decora Cabinetry | 5 | Skechers USA | 2 | |
| Domino's Pizza | 15 | Soma Intimates | 1 | |
| DressBarn | 3 | Sprint Nextel | 19 | |
| Dressbarn | 3 | Staples | 12 | |
| Dunkin Donuts | 168 | Starbucks | 131 | |
| Eddie Bauer | 1 | Subaru | 1 | |
| Ethan Allen | 1 | Subway | 114 | |
| Express | 5 | Super 8 | 1 | |
| Famous Footwear | 5 | T-Mobile | 35 | |
| Fashion Bug | 3 | T.G.I. Driday's | 1 | |
| FedEx | 225 | T.J.Maxx | 4 | |
| Finish Line | 2 | Taco Bell | 12 | |
| Firestone Complete Auto Care | 9 | Target | 10 | |
| Foot Locker | 18 | The Athlete's Foot | 10 | |
| Ford | 1 | The Cheesecake Factory | 1 | |
| Forever 21 | 4 | The Limited | 2 | |
| GNC | 29 | The Room Place | 3 | |
| GameStop | 37 | Toyota | 4 | |
| Gap | 7 | Toys"R"Us | 8 | |
| Gymboree | 1 | Trader Joe's | 5 | |
| H&M | 1 | True Value | 24 | |
| H&R Block | 102 | U-Haul | 54 | |
| Haagen-Dazs | 3 | U.S. Cellular | 13 | |
| Haworth | 2 | UPS | 303 | |
| Hilton | 22 | Urban Outfitters | 5 | |
| Holiday Inn | 10 | Vans | 7 | |
| Hollister Co. | 1 | Verizon Wireless | 10 | |
| Home Depot | 10 | Victoria's Secret | 5 | |
| Honda | 4 | Volkswagen | 2 | |
| Houlihan's | 1 | Vons | 15 | |
| Hyatt | 11 | Walgreens | 44 | |
| Hyundai | 2 | Walmart | 1 | |
| IHOP | 5 | Wendy's | 18 | |
| J. Jill | 1 | Westin | 2 | |
| J.Crew | 2 | Wet Seal | 2 | |
| JCPenney | 1 | White Castle | 21 | |
| Jamba Juice | 15 | Whole Foods Market | 6 | |
| Jewel-Osco | 34 | World Gym | 3 | |
| Jimmy Jazz | 2 | YMCA | 15 | |
| JoS. A. Bank | 4 | Z Gallerie | 1 | |
| Johnny Rockets | 4 | |||
Strongest AM radio stations in Chicago:
- WCEV (1450 AM; 1 kW; CICERO, IL; Owner: MIGALA COMMUNICATIONS CORPORATION)
- WVON (1450 AM; 1 kW; CICERO, IL; Owner: MIDWAY BROADCASTING CORPORATION)
- WMVP (1000 AM; 50 kW; CHICAGO, IL; Owner: ABC, INC.)
- WSCR (670 AM; 50 kW; CHICAGO, IL; Owner: INFINITY BROADCASTING OPERATIONS, INC.)
- WBBM (780 AM; 50 kW; CHICAGO, IL; Owner: INFINITY BROADCASTING OPERATIONS, INC.)
- WGN (720 AM; 50 kW; CHICAGO, IL; Owner: WGN CONTINENTAL BROADCASTING CO.)
- WLS (890 AM; 50 kW; CHICAGO, IL; Owner: WLS, INC.)
- WVIV (1200 AM; 20 kW; CHICAGO, IL; Owner: WLXX-AM LICENSE CORP.)
- WCSN (820 AM; 5 kW; CHICAGO, IL; Owner: WYPA, INC.)
- WYLL (1160 AM; 50 kW; CHICAGO, IL; Owner: SCA LICENSE CORPORATION)
- WGCI (1390 AM; 5 kW; CHICAGO, IL; Owner: AMFM RADIO LICENSES, L.L.C.)
- WRDZ (1300 AM; 4 kW; LA GRANGE, IL; Owner: ABC, INC.)
- WNTD (950 AM; 5 kW; CHICAGO, IL; Owner: RADIO UNICA OF CHICAGO LICENSE CORP.)
Strongest FM radio stations in Chicago:
- WCKG (105.9 FM; ELMWOOD PARK, IL; Owner: INFINITY HOLDINGS CORPORATION OF ORLANDO)
- WLIT-FM (93.9 FM; CHICAGO, IL; Owner: AMFM RADIO LICENSES, L.L.C.)
- WJMK (104.3 FM; CHICAGO, IL; Owner: INFINITY BROADCASTING CORP. OF ILLINOIS)
- WNUA (95.5 FM; CHICAGO, IL; Owner: AMFM RADIO LICENSES, L.L.C.)
- WBBM-FM (96.3 FM; CHICAGO, IL; Owner: INFINITY BROADCASTING OPERATIONS, INC.)
- WTMX (101.9 FM; SKOKIE, IL; Owner: BONNEVILLE HOLDING COMPANY)
- WFMT (98.7 FM; CHICAGO, IL; Owner: WINDOW TO THE WORLD COMMUNICATIONS)
- WKSC-FM (103.5 FM; CHICAGO, IL; Owner: AMFM RADIO LICENSES, L.L.C.)
- WZZN (94.7 FM; CHICAGO, IL; Owner: ABC CHICAGO FM RADIO,INC.)
- WGCI-FM (107.5 FM; CHICAGO, IL; Owner: AMFM RADIO LICENSES, L.L.C.)
- WDRV (97.1 FM; CHICAGO, IL; Owner: BONNEVILLE HOLDING COMPANY)
- WBEZ (91.5 FM; CHICAGO, IL; Owner: THE WBEZ ALLIANCE, INC.)
- WKQX (101.1 FM; CHICAGO, IL; Owner: EMMIS RADIO LICENSE CORPORATION)
- WLUP-FM (97.9 FM; CHICAGO, IL; Owner: BONNEVILLE HOLDING COMPANY)
- WNND (100.3 FM; CHICAGO, IL; Owner: BONNEVILLE HOLDING COMPANY)
- WOJO (105.1 FM; EVANSTON, IL; Owner: TICHENOR LICENSE CORPORATION ("TLC"))
- WUSN (99.5 FM; CHICAGO, IL; Owner: INFINITY BROADCASTING CORPORATION OF CHICAGO)
- WVAZ (102.7 FM; OAK PARK, IL; Owner: AMFM RADIO LICENSES, L.L.C.)
- WXRT-FM (93.1 FM; CHICAGO, IL; Owner: INFINITY BROADCASTING OPERATIONS, INC.)
- WRTE (90.5 FM; CHICAGO, IL; Owner: MEXICAN FINE ARTS CENTER MUSEUM)
TV broadcast stations around Chicago:
- WLS-TV (Channel 7; CHICAGO, IL; Owner: WLS TELEVISION, INC.)
- WMAQ-TV (Channel 5; CHICAGO, IL; Owner: NBC SUBSIDIARY (WMAQ-TV), INC.)
- WTTW (Channel 11; CHICAGO, IL; Owner: WINDOW TO THE WORLD COMMUNICATIONS, INC.)
- WGN-TV (Channel 9; CHICAGO, IL; Owner: WGN CONTINENTAL BROADCASTING COMPANY)
- WPWR-TV (Channel 50; GARY, IN; Owner: FOX TELEVISION STATIONS, INC.)
- WXFT (Channel 60; AURORA, IL; Owner: TELEFUTURA CHICAGO LLC)
- WCIU-TV (Channel 26; CHICAGO, IL; Owner: WCIU-TV LIMITED PARTNERSHIP)
- WCPX (Channel 38; CHICAGO, IL; Owner: PAXSON CHICAGO LICENSE, INC.)
- WFLD (Channel 32; CHICAGO, IL; Owner: FOX TELEVISION STATIONS, INC.)
- W68DO (Channel 68; PALATINE, IL; Owner: TRINITY BROADCASTING NETWORK)
- WFBT-CA (Channel 23; CHICAGO, IL; Owner: CHANNEL 23 LIMITED PARTNERSHIP)
- WJYS (Channel 62; HAMMOND, IN; Owner: JOVON BROADCASTING CORPORATION)
- WGBO-TV (Channel 66; JOLIET, IL; Owner: WGBO LICENSE PARTNERSHIP, G.P.)
- WBBM-TV (Channel 2; CHICAGO, IL; Owner: CBS BROADCASTING INC.)
- WSNS-TV (Channel 44; CHICAGO, IL; Owner: TELEMUNDO OF CHICAGO, INC.)
- WOCH-LP (Channel 28; CHICAGO, IL; Owner: KM LPTV OF CHICAGO-28, L.L.C.)
- WYCC (Channel 20; CHICAGO, IL; Owner: COLLEGE DIST. #508, COUNTY OF COOK)
- WOCK-CA (Channel 13; CHICAGO, IL; Owner: KM LPTV OF CHICAGO-13, L.L.C.)
- W34CK (Channel 34; ARLINGTON HEIGHTS, IL; Owner: FIRST UNITED, INC.)
- WYIN (Channel 56; GARY, IN; Owner: NORTHWEST INDIANA PUBLIC BROADCASTING, INC.)
- W64CQ (Channel 64; ARLINGTON HEIGHTS, IL; Owner: TRINITY BROADCASTING NETWORK)
- W54AP (Channel 54; BLUE ISLAND, IL; Owner: CATHOLIC VIEWS BROADCASTS, INC.)
Medal of Honor Recipients
Medal of Honor Recipients born in Chicago: Addison E. Baker, Allen James Lynch, Anthony L. Krotiak, Edward C. Krzyzowski, Edward J. Moskala, Edward S. Michael, Gerald O. Young, Harold Ernest Goettler, Henry F. Schroeder, James Robb Church, John Harold Leims, John Henry Helms, John Joseph Kelly, John Peter Fardy, Joseph Jeremiah McCarthy, Milton L. Iii Olive, Richard Edward Kraus, Robert E. Gerstung, Thomas A. Pope, Weedon E. Osborne, William Charlie Horton, William G. Windrich, William P. Johnston, Willie Cronan.
- National Bridge Inventory (NBI) Statistics
- 1,288Number of bridges
- 22,359ft / 6,815mTotal length
- $1,244,483,000Total costs
- 60,573,280Total average daily traffic
- 3,993,040Total average daily truck traffic
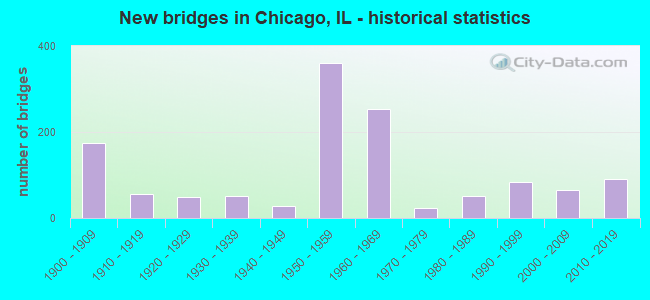
- New bridges - historical statistics
- 2Before 1900
- 1741900-1909
- 561910-1919
- 481920-1929
- 521930-1939
- 271940-1949
- 3611950-1959
- 2541960-1969
- 231970-1979
- 511980-1989
- 831990-1999
- 642000-2009
- 902010-2019
- 12020-2022
FCC Registered Antenna Towers: 2,100 (See the full list of FCC Registered Antenna Towers)
FCC Registered Commercial Land Mobile Towers: 46 (See the full list of FCC Registered Commercial Land Mobile Towers in Chicago, IL)
FCC Registered Private Land Mobile Towers: 105 (See the full list of FCC Registered Private Land Mobile Towers)
FCC Registered Broadcast Land Mobile Towers: 1,784 (See the full list of FCC Registered Broadcast Land Mobile Towers)
FCC Registered Microwave Towers: 1,777 (See the full list of FCC Registered Microwave Towers in this town)
FCC Registered Paging Towers: 102 (See the full list of FCC Registered Paging Towers)
FCC Registered Maritime Coast & Aviation Ground Towers: 207 (See the full list of FCC Registered Maritime Coast & Aviation Ground Towers)
FCC Registered Amateur Radio Licenses: 2,995 (See the full list of FCC Registered Amateur Radio Licenses in Chicago)
FAA Registered Aircraft Manufacturers and Dealers: 12 (See the full list of FAA Registered Manufacturers and Dealers in Chicago)
FAA Registered Aircraft: 1,507 (See the full list of FAA Registered Aircraft)
| Home Mortgage Disclosure Act Aggregated Statistics For Year 2009 (Based on 848 full and 5 partial tracts) | ||||||||||||||
| A) FHA, FSA/RHS & VA Home Purchase Loans | B) Conventional Home Purchase Loans | C) Refinancings | D) Home Improvement Loans | E) Loans on Dwellings For 5+ Families | F) Non-occupant Loans on < 5 Family Dwellings (A B C & D) | G) Loans On Manufactured Home Dwelling (A B C & D) | ||||||||
|---|---|---|---|---|---|---|---|---|---|---|---|---|---|---|
| Number | Average Value | Number | Average Value | Number | Average Value | Number | Average Value | Number | Average Value | Number | Average Value | Number | Average Value | |
| LOANS ORIGINATED | 5,671 | $213,018 | 12,387 | $267,790 | 44,484 | $261,007 | 1,501 | $98,739 | 739 | $922,389 | 5,483 | $251,756 | 67 | $321,298 |
| APPLICATIONS APPROVED, NOT ACCEPTED | 518 | $195,075 | 1,391 | $277,986 | 4,897 | $259,749 | 363 | $54,431 | 39 | $710,564 | 602 | $243,763 | 4 | $152,250 |
| APPLICATIONS DENIED | 2,045 | $208,201 | 3,506 | $248,431 | 17,372 | $245,576 | 2,334 | $56,029 | 129 | $1,006,731 | 2,738 | $217,649 | 16 | $49,551 |
| APPLICATIONS WITHDRAWN | 903 | $196,931 | 1,409 | $267,362 | 7,387 | $240,666 | 374 | $95,727 | 39 | $2,572,374 | 984 | $223,092 | 3 | $235,667 |
| FILES CLOSED FOR INCOMPLETENESS | 469 | $204,448 | 577 | $256,452 | 3,456 | $237,562 | 190 | $85,574 | 12 | $1,167,500 | 342 | $215,205 | 0 | $0 |
Detailed mortgage data for all 873 tracts in Chicago, IL
| Private Mortgage Insurance Companies Aggregated Statistics For Year 2009 (Based on 675 full and 5 partial tracts) | ||||||
| A) Conventional Home Purchase Loans | B) Refinancings | C) Non-occupant Loans on < 5 Family Dwellings (A & B) | ||||
|---|---|---|---|---|---|---|
| Number | Average Value | Number | Average Value | Number | Average Value | |
| LOANS ORIGINATED | 2,204 | $259,734 | 1,052 | $274,188 | 50 | $280,680 |
| APPLICATIONS APPROVED, NOT ACCEPTED | 1,038 | $253,979 | 714 | $264,103 | 76 | $225,382 |
| APPLICATIONS DENIED | 495 | $247,480 | 432 | $256,053 | 16 | $303,812 |
| APPLICATIONS WITHDRAWN | 264 | $258,178 | 246 | $270,940 | 10 | $243,500 |
| FILES CLOSED FOR INCOMPLETENESS | 129 | $247,187 | 58 | $266,543 | 20 | $265,150 |
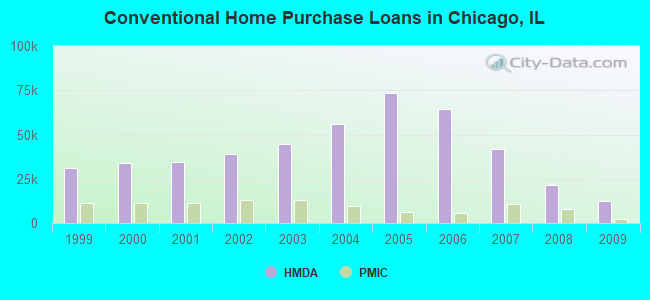
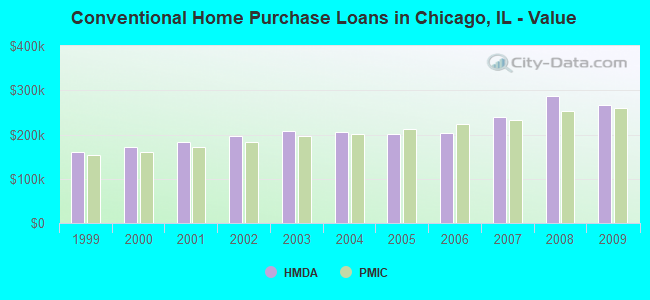
2009 - 2018 National Fire Incident Reporting System (NFIRS) incidents
- Fire incident types reported to NFIRS in Chicago, IL
- 65,05553.5%Structure Fires
- 24,78020.4%Outside Fires
- 21,73017.9%Mobile Property/Vehicle Fires
- 9,9688.2%Other
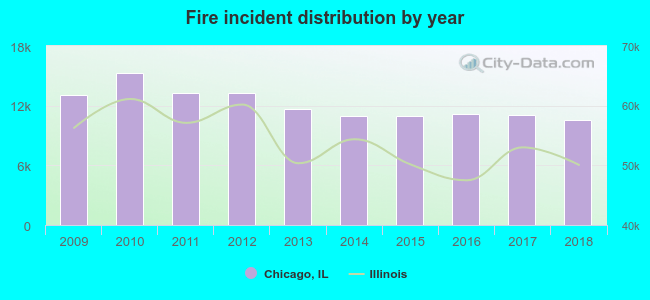 Based on the data from the years 2009 - 2018 the average number of fire incidents per year is 12147. The highest number of fire incidents - 15,319 took place in 2010, and the least - 10,581 in 2018. The data has a dropping trend.
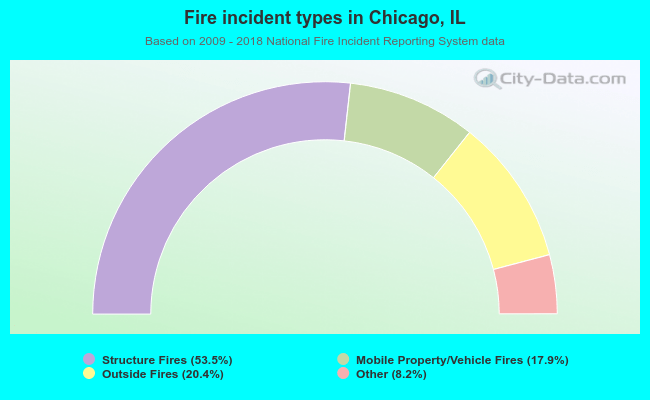 When looking into fire subcategories, the most reports belonged to: Structure Fires (53.5%), and Outside Fires (20.4%).
Fire-safe hotels and motels in Chicago, Illinois:
- Edgebrook Motel, 6401 W Touhy, Chicago, Illinois 60646 , Phone: (773) 774-4200
- Chicago Ohare Garden Hotel, 8201 W Higgins Rd, Chicago, Illinois 60631 , Phone: (773) 693-2323, Fax: (773) 693-3771
- Four Seasons Hotel Chicago, 120 E Delaware PL, Chicago, Illinois 60611 , Phone: (312) 280-8800, Fax: (312) 280-9184
- Hotel Intercontinental, 505 N Michigan Ave, Chicago, Illinois 60611 , Phone: (312) 944-4100, Fax: (312) 944-0240
- Residence Inn By Marriott Chicago Downtown, 201 E Walton, Chicago, Illinois 60611 , Phone: (312) 943-9800, Fax: (312) 943-8579
- W Chicago City Center, 172 W Adams, Chicago, Illinois 60603 , Phone: (312) 332-1200, Fax: (312) 332-5909
- Villa Motel, 5952 N Lincoln, Chicago, Illinois 60659 , Phone: (773) 561-9509
- LaQuinta Inn & Suites Chicago Lake Shore, 4900 S Lk Shore Dr, Chicago, Illinois 60615 , Phone: (773) 324-3000
- 121 other hotels and motels
| Most common first names in Chicago, IL among deceased individuals | ||
| Name | Count | Lived (average) |
|---|---|---|
| John | 27,131 | 73.4 years |
| Mary | 22,402 | 78.5 years |
| Joseph | 17,098 | 74.2 years |
| William | 15,967 | 72.7 years |
| James | 15,145 | 69.5 years |
| Frank | 12,075 | 74.8 years |
| Anna | 11,511 | 81.7 years |
| George | 11,051 | 73.3 years |
| Robert | 10,970 | 67.9 years |
| Edward | 10,788 | 71.9 years |
| Most common last names in Chicago, IL among deceased individuals | ||
| Last name | Count | Lived (average) |
|---|---|---|
| Johnson | 8,733 | 72.3 years |
| Smith | 7,467 | 71.4 years |
| Williams | 7,341 | 70.1 years |
| Jones | 5,552 | 70.3 years |
| Brown | 5,296 | 71.1 years |
| Davis | 3,951 | 70.4 years |
| Jackson | 3,710 | 70.0 years |
| Anderson | 3,402 | 74.4 years |
| Miller | 3,266 | 73.8 years |
| Harris | 3,129 | 70.6 years |
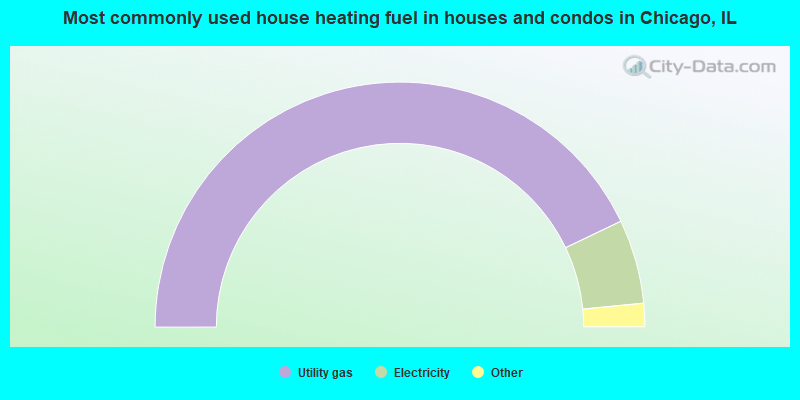
- 85.8%Utility gas
- 11.1%Electricity
- 1.8%Bottled, tank, or LP gas
- 0.5%Other fuel
- 0.5%No fuel used
- 0.2%Fuel oil, kerosene, etc.
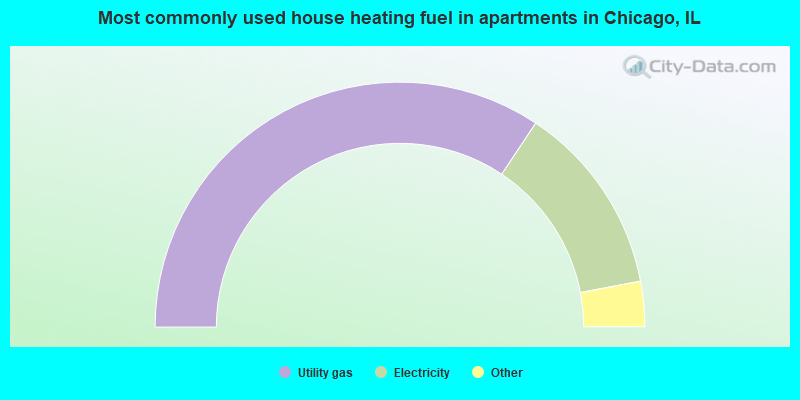
- 68.6%Utility gas
- 25.2%Electricity
- 2.5%No fuel used
- 2.1%Bottled, tank, or LP gas
- 1.3%Other fuel
- 0.1%Fuel oil, kerosene, etc.
Chicago compared to Illinois state average:
- Unemployed percentage below state average.
- Black race population percentage above state average.
- Median age below state average.
- Renting percentage above state average.
- Percentage of population with a bachelor's degree or higher above state average.
Chicago, IL compared to other similar cities:
Chicago on our top lists:
- #2 on the list of "Top 101 cities with largest percentage of males in industries: broadcasting, internet publishing, and telecommunications services (population 50,000+)"
- #2 on the list of "Top 101 cities with largest percentage of females in industries: broadcasting, internet publishing, and telecommunications services (population 50,000+)"
- #2 on the list of "Top 101 cities with largest percentage of males in industries: wholesale electronic markets and agents and brokers (population 50,000+)"
- #2 on the list of "Top 101 cities with largest percentage of females in industries: wholesale electronic markets and agents and brokers (population 50,000+)"
- #3 on the list of "Top 101 cities with the highest number of police officers per 1000 residents (population 50,000+)"
- #3 on the list of "Top 101 biggest cities in 2013"
- #3 on the list of "Top 100 biggest cities"
- #6 on the list of "Top 101 cities with the most mentions on city-data.com forum"
- #20 on the list of "Top 101 cities with the most people taking subway or elevated to work (population 5,000+)"
- #26 on the list of "Top 101 cities with the highest number of robberies per 100,000 residents, excludes tourist destinations and others with a lot of outsiders visiting based on city industries data (population 50,000+)"
- #26 on the list of "Top 101 cities with the least cars per house, population 50,000+"
- #30 on the list of "Top 101 cities with the highest number of murders per 100,000 residents, excludes tourist destinations and others with a lot of outsiders visiting based on city industries data (population 50,000+)"
- #32 on the list of "Top 100 cities with declining populations from 2000 to 2014 (pop. 50,000+)"
- #33 on the list of "Top 101 cities with the largest percentage population decrease from 2000 (population 50,000+)"
- #41 on the list of "Top 101 cities with the largest percentage of likely gay men couples (counted as self-reported male-male unmarried-partner households) (population 50,000+)"
- #47 on the list of "Top 101 cities with the most people taking railroad to work (population 5,000+)"
- #47 on the list of "Top 100 cities with largest land areas (pop. 50,000+)"
- #49 on the list of "Top 101 cities with the largest racial income disparity between any two races with at least 200 householders"
- #50 on the list of "Top 100 cities with old houses but young residents (pop. 50,000+)"
- #53 on the list of "Top 101 cities with the most people taking a bus, a trolley bus, a streetcar, or a trolley car to work (population 5,000+)"
- #1 (60601) on the list of "Top 101 zip codes with the largest charity contributions deductions as a percentage of AGI in 2012 (pop 1,000+)"
- #2 (60176) on the list of "Top 101 zip codes with the largest percentage of Polish first ancestries (pop 5,000+)"
- #2 (60606) on the list of "Top 101 zip codes with the most finance and insurance companies in 2005"
- #2 (60602) on the list of "Top 101 zip codes with the most offices of lawyers in 2005"
- #3 (60636) on the list of "Top 101 zip codes with the lowest 2012 average net capital gain/loss (pop 1,000+)"
- #4 (60614) on the list of "Top 101 zip codes with the most alcohol drinking places in 2005"
- #5 (60606) on the list of "Top 101 zip codes with the most medium-big companies in 2005 (at least 100 employees)"
- #5 (60621) on the list of "Top 101 zip codes with the smallest percentage of taxpayers reporting net capital gain/loss in 2012 (pop 5,000+)"
- #6 (60606) on the list of "Top 101 zip codes with the highest 2012 average reported profit/loss from business (pop 1,000+)"
- #8 (60606) on the list of "Top 101 zip codes with the most Internet business establishments in 2005"
- #12 (60655) on the list of "Top 101 zip codes with the largest percentage of Irish first ancestries (pop 5,000+)"
- #12 (60610) on the list of "Top 101 zip codes with the most full service restaurants in 2005"
- #13 (60601) on the list of "Top 101 zip codes with the most big companies in 2005 (at least 1000 employees)"
- #13 (60611) on the list of "Top 101 zip codes with the most beauty salons in 2005"
- #14 (60619) on the list of "Top 101 zip codes with the largest percentage of Subsaharan African first ancestries (pop 5,000+)"
- #16 (60632) on the list of "Top 101 zip codes with the largest percentage of Lithuanian first ancestries (pop 5,000+)"
- #16 (60606) on the list of "Top 101 zip codes with the highest 2012 average taxable interest for individuals (pop 1,000+)"
- #20 (60622) on the list of "Top 101 zip codes with the largest percentage of Ukrainian first ancestries (pop 5,000+)"
- #26 (60659) on the list of "Top 101 zip codes with the largest percentage of Arab first ancestries (pop 5,000+)"
- #30 (60611) on the list of "Top 101 zip codes with the most museums in 2005"
- #1 on the list of "Top 101 counties with the most Black Protestant congregations"
- #1 on the list of "Top 101 counties with the most Catholic congregations"
- #1 on the list of "Top 101 counties with the highest surface withdrawal of fresh water for public supply"
- #2 on the list of "Top 101 counties with the most Black Protestant adherents"
- #2 on the list of "Top 101 counties with the most Orthodox congregations (pop. 50,000+)"
State forum archive:
- Illinois Pages: 2 3 4 5 6 7 8 9 10 11 12 13 14 15 16 17 18 19
- Chicago Pages: 2 3 4 5 6 7 8 9 10 11 12 13 14 15 16 17 18 19 20 21 22 23 24 25 26 27 28 29 30 31 32 33 34 35 36 37 38 39 40 41 42 43 44 45 46 47 48 49 50 51 52 53 54 55 56 57 58 59 60 61 62 63 64 65 66 67 68 69 70 71 72 73 74 75 76 77 78 79 80 81 82 83 84
- Chicago Suburbs Pages: 2 3 4 5 6 7 8 9 10 11 12 13 14 15 16 17 18 19 20 21 22 23 24 25 26 27 28 29 30 31 32 33 34 35 36 37 38 39 40 41 42 43 44 45 46 47 48 49 50 51 52

|
|
Total of 14702 patent applications in 2008-2024.


