Estimated zip code population in 2022: 42,304 Zip code population in 2010: 42,752 Zip code population in 2000: 47,726
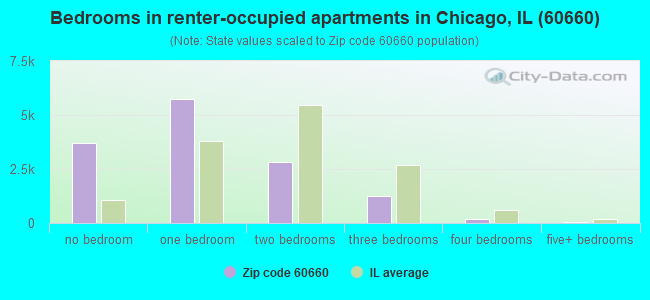
Houses and condos: 23,528 Renter-occupied apartments: 13,367
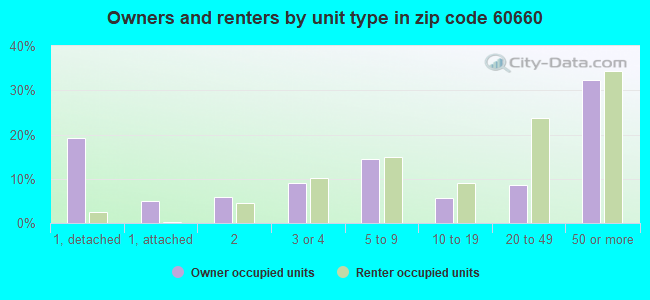
% of renters here:
63%
State:
33%
March 2022 cost of living index in zip code 60660: 101.8 (near average, U.S. average is 100)
Land area: 1.3 sq. mi. Water area: 0.2 sq. mi.
Population density: 33,153 people per square mile
(very high).
OSM Map
General Map
Google Map
MSN Map
OSM Map
General Map
Google Map
MSN Map
OSM Map
General Map
Google Map
MSN Map
OSM Map
General Map
Google Map
MSN Map
Please wait while loading the map...
Real estate property taxes paid for housing units in 2022:
This zip code:
1.6% ($4,630)
Illinois:
2.0% ($4,912)
Median real estate property taxes paid for housing units with mortgages in 2022: $5,034 (1.6%) Median real estate property taxes paid for housing units with no mortgage in 2022: $3,592 (1.4%)
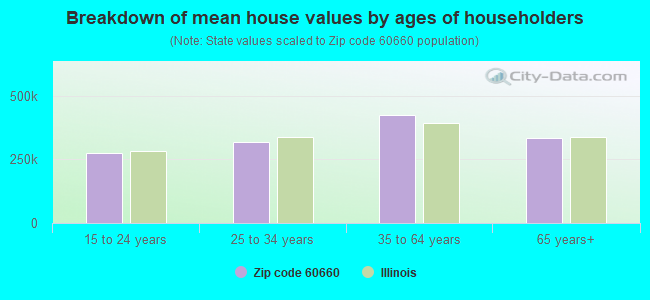
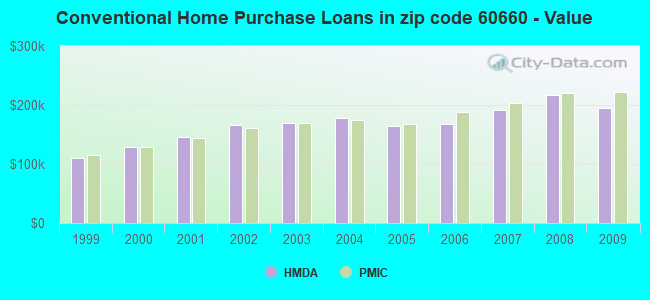
Estimated median house/condo value in 2022: $292,218
60660:
$292,218
Illinois:
$251,600
According to our research of Illinois and other state lists, there were 20 registered sex offenders living in 60660 zip code as of April 27, 2024. The ratio of all residents to sex offenders in zip code 60660 is 2,104 to 1. The ratio of registered sex offenders to all residents in this zip code is much lower than the state average.
Median resident age:
This zip code:
36.5 years
Illinois median age:
39.1 years
Average household size:
This zip code:
1.8 people
Illinois:
2.4 people
Averages for the 2020 tax year for zip code 60660, filed in 2021:
Average Adjusted Gross Income (AGI) in 2020: $67,221 (Individual Income Tax Returns)
Here:
$67,221
State:
$82,626
Salary/wage: $61,852 (reported on 82.3% of returns)
Here:
$61,852
State:
$66,640
(% of AGI for various income ranges: 1083.8% for AGIs below $25k, 3600.5% for AGIs $25k-50k, 6970.7% for AGIs $50k-75k, 10079.4% for AGIs $75k-100k, 18118.0% for AGIs $100k-200k, 72784.7% for AGIs over 200k)
Taxable interest for individuals: $1,152 (reported on 26.3% of returns)
This zip code:
$1,152
Illinois:
$2,376
(% of AGI for various income ranges: 15.2% for AGIs below $25k, 17.0% for AGIs $25k-50k, 22.9% for AGIs $50k-75k, 46.9% for AGIs $75k-100k, 98.1% for AGIs $100k-200k, 615.6% for AGIs over 200k)
Ordinary dividends: $5,581 (reported on 21.4% of returns)
Here:
$5,581
State:
$9,061
(% of AGI for various income ranges: 31.5% for AGIs below $25k, 43.7% for AGIs $25k-50k, 71.1% for AGIs $50k-75k, 156.6% for AGIs $75k-100k, 363.2% for AGIs $100k-200k, 3437.6% for AGIs over 200k)
Net capital gain/loss in AGI: +$12,739 (reported on 20.0% of returns)
Here:
+$12,739
State:
+$31,684
(% of AGI for various income ranges: 10.6% for AGIs below $25k, 38.3% for AGIs $25k-50k, 76.4% for AGIs $50k-75k, 231.6% for AGIs $75k-100k, 493.1% for AGIs $100k-200k, 11105.9% for AGIs over 200k)
Profit/loss from business: +$10,246 (reported on 22.5% of returns)
Here:
+$10,246
State:
+$12,175
(% of AGI for various income ranges: 258.7% for AGIs below $25k, 222.6% for AGIs $25k-50k, 260.1% for AGIs $50k-75k, 301.0% for AGIs $75k-100k, 541.0% for AGIs $100k-200k, 2344.7% for AGIs over 200k)
Taxable individual retirement arrangement distribution: $20,004 (reported on 6.1% of returns)
60660:
$20,004
Illinois:
$21,613
(% of AGI for various income ranges: 41.1% for AGIs below $25k, 80.0% for AGIs $25k-50k, 132.2% for AGIs $50k-75k, 296.4% for AGIs $75k-100k, 474.7% for AGIs $100k-200k, 1524.4% for AGIs over 200k)
Self-employed (Keogh) retirement plans: $23,678 (reported on 0.9% of returns)
60660:
$23,678
Illinois:
$30,962
(% of AGI for various income ranges: 21.6% for AGIs $50k-75k, 48.8% for AGIs $100k-200k, 856.5% for AGIs over 200k)
Total itemized deductions: $25,665 (reported on 10.1% of returns)
Here:
$25,665
State:
$34,948
(% of AGI for various income ranges: 46.7% for AGIs below $25k, 90.9% for AGIs $25k-50k, 207.4% for AGIs $50k-75k, 523.4% for AGIs $75k-100k, 1102.6% for AGIs $100k-200k, 5178.2% for AGIs over 200k)
Charity contributions: $6,414 (reported on 8.0% of returns)
Here:
$6,414
State:
$13,122
(% of AGI for various income ranges: 3.2% for AGIs below $25k, 13.5% for AGIs $25k-50k, 31.3% for AGIs $50k-75k, 72.8% for AGIs $75k-100k, 187.6% for AGIs $100k-200k, 1482.4% for AGIs over 200k)
Taxes paid: $8,308 (reported on 10.1% of returns)
60660:
$8,308
State:
$8,563
(% of AGI for various income ranges: 11.9% for AGIs below $25k, 24.1% for AGIs $25k-50k, 67.3% for AGIs $50k-75k, 187.0% for AGIs $75k-100k, 420.0% for AGIs $100k-200k, 1378.5% for AGIs over 200k)
Earned income credit: $1,518 (reported on 11.8% of returns)
Here:
$1,518
State:
$2,311
(% of AGI for various income ranges: 57.0% for AGIs below $25k, 31.0% for AGIs $25k-50k, 0.5% for AGIs $50k-75k)
Percentage of individuals using paid preparers for their 2020 taxes: 92.3%
Here:
92%
State:
93%
(% for various income ranges: 89.4% for AGIs below $25k, 93.4% for AGIs $25k-50k, 94.5% for AGIs $50k-75k, 91.7% for AGIs $75k-100k, 93.5% for AGIs $100k-200k, 94.1% for AGIs over 200k)
Averages for the 2012 tax year for zip code 60660, filed in 2013:
Average Adjusted Gross Income (AGI) in 2012: $49,919 (Individual Income Tax Returns)
Here:
$49,919
State:
$68,058
Salary/wage: $48,150 (reported on 84.5% of returns)
Here:
$48,150
State:
$55,396
(% of AGI for various income ranges: 75.9% for AGIs below $25k, 88.3% for AGIs $25k-50k, 86.1% for AGIs $50k-75k, 84.5% for AGIs $75k-100k, 81.8% for AGIs $100k-200k, 66.7% for AGIs over 200k)
Taxable interest for individuals: $931 (reported on 27.6% of returns)
This zip code:
$931
Illinois:
$1,969
(% of AGI for various income ranges: 0.8% for AGIs below $25k, 0.4% for AGIs $25k-50k, 0.3% for AGIs $50k-75k, 0.5% for AGIs $75k-100k, 0.5% for AGIs $100k-200k, 0.8% for AGIs over 200k)
Ordinary dividends: $4,652 (reported on 17.6% of returns)
Here:
$4,652
State:
$7,786
(% of AGI for various income ranges: 1.5% for AGIs below $25k, 0.7% for AGIs $25k-50k, 1.0% for AGIs $50k-75k, 1.3% for AGIs $75k-100k, 1.8% for AGIs $100k-200k, 3.9% for AGIs over 200k)
Net capital gain/loss in AGI: +$6,055 (reported on 13.9% of returns)
Here:
+$6,055
State:
+$22,183
(% of AGI for various income ranges: 0.2% for AGIs $25k-50k, 0.3% for AGIs $50k-75k, 0.4% for AGIs $75k-100k, 1.6% for AGIs $100k-200k, 8.0% for AGIs over 200k)
Profit/loss from business: +$10,277 (reported on 20.2% of returns)
Here:
+$10,277
State:
+$12,903
(% of AGI for various income ranges: 15.5% for AGIs below $25k, 3.5% for AGIs $25k-50k, 3.0% for AGIs $50k-75k, 2.2% for AGIs $75k-100k, 3.0% for AGIs $100k-200k, 2.7% for AGIs over 200k)
Taxable individual retirement arrangement distribution: $14,670 (reported on 6.4% of returns)
60660:
$14,670
Illinois:
$17,929
(% of AGI for various income ranges: 2.2% for AGIs below $25k, 1.4% for AGIs $25k-50k, 1.7% for AGIs $50k-75k, 2.1% for AGIs $75k-100k, 2.1% for AGIs $100k-200k, 2.0% for AGIs over 200k)
Self-employment retirement plans: $16,207 (reported on 0.7% of returns)
60660:
$16,207
Illinois:
$24,666
(% of AGI for various income ranges: 0.1% for AGIs below $25k, 0.2% for AGIs $50k-75k, 0.3% for AGIs $100k-200k, 0.7% for AGIs over 200k)
Total itemized deductions: $20,172 (21% of AGI, reported on 27.1% of returns)
Here:
$20,172
State:
$26,433
Here:
20.6% of AGI
State:
19.2% of AGI
(% of AGI for various income ranges: 6.5% for AGIs below $25k, 6.8% for AGIs $25k-50k, 10.7% for AGIs $50k-75k, 13.0% for AGIs $75k-100k, 14.1% for AGIs $100k-200k, 12.9% for AGIs over 200k)
Charity contributions: $2,841 (reported on 21.7% of returns)
Here:
$2,841
State:
$4,525
(% of AGI for various income ranges: 0.5% for AGIs below $25k, 0.7% for AGIs $25k-50k, 1.1% for AGIs $50k-75k, 1.4% for AGIs $75k-100k, 1.6% for AGIs $100k-200k, 2.0% for AGIs over 200k)
Taxes paid: $7,945 (reported on 27.0% of returns)
60660:
$7,945
State:
$11,968
(% of AGI for various income ranges: 1.6% for AGIs below $25k, 1.9% for AGIs $25k-50k, 3.6% for AGIs $50k-75k, 5.0% for AGIs $75k-100k, 6.3% for AGIs $100k-200k, 6.5% for AGIs over 200k)
Earned income credit: $1,700 (reported on 16.2% of returns)
Here:
$1,700
State:
$2,349
(% of AGI for various income ranges: 4.6% for AGIs below $25k, 0.5% for AGIs $25k-50k)
Percentage of individuals using paid preparers for their 2012 taxes: 51.2%
Here:
51%
State:
57%
(% for various income ranges: 53.0% for AGIs below $25k, 48.1% for AGIs $25k-50k, 48.5% for AGIs $50k-75k, 49.2% for AGIs $75k-100k, 54.3% for AGIs $100k-200k, 70.8% for AGIs over 200k)
Averages for the 2004 tax year for zip code 60660, filed in 2005:
Average Adjusted Gross Income (AGI) in 2004: $42,955 (Individual Income Tax Returns)
Here:
$42,955
State:
$54,625
Salary/wage: $40,000 (reported on 84.9% of returns)
Here:
$40,000
State:
$46,811
(% of AGI for various income ranges: 117.1% for AGIs below $10k, 82.0% for AGIs $10k-25k, 89.2% for AGIs $25k-50k, 86.6% for AGIs $50k-75k, 85.4% for AGIs $75k-100k, 62.0% for AGIs over 100k)
Taxable interest for individuals: $1,433 (reported on 39.0% of returns)
This zip code:
$1,433
Illinois:
$2,101
(% of AGI for various income ranges: 7.1% for AGIs below $10k, 1.5% for AGIs $10k-25k, 1.0% for AGIs $25k-50k, 1.2% for AGIs $50k-75k, 1.1% for AGIs $75k-100k, 1.4% for AGIs over 100k)
Taxable dividends: $2,809 (reported on 19.6% of returns)
Here:
$2,809
State:
$4,306
(% of AGI for various income ranges: 5.2% for AGIs below $10k, 1.1% for AGIs $10k-25k, 0.9% for AGIs $25k-50k, 1.2% for AGIs $50k-75k, 1.6% for AGIs $75k-100k, 1.4% for AGIs over 100k)
Net capital gain/loss: +$8,440 (reported on 15.3% of returns)
Here:
+$8,440
State:
+$17,321
(% of AGI for various income ranges: -0.1% for AGIs below $10k, 0.0% for AGIs $10k-25k, 0.2% for AGIs $25k-50k, 0.7% for AGIs $50k-75k, 1.4% for AGIs $75k-100k, 8.3% for AGIs over 100k)
Profit/loss from business: +$8,265 (reported on 17.5% of returns)
Here:
+$8,265
State:
+$11,771
(% of AGI for various income ranges: 11.1% for AGIs below $10k, 8.9% for AGIs $10k-25k, 2.9% for AGIs $25k-50k, 2.1% for AGIs $50k-75k, 2.4% for AGIs $75k-100k, 2.7% for AGIs over 100k)
IRA payment deduction: $2,829 (reported on 2.5% of returns)
60660:
$2,829
Illinois:
$3,087
(% of AGI for various income ranges: 0.5% for AGIs below $10k, 0.2% for AGIs $10k-25k, 0.3% for AGIs $25k-50k, 0.2% for AGIs $50k-75k, 0.1% for AGIs $75k-100k, 0.1% for AGIs over 100k)
Self-employed pension: $12,287 (reported on 0.8% of returns)
Here:
$12,287
Illinois:
$16,965
(% of AGI for various income ranges: 0.0% for AGIs $10k-25k, 0.1% for AGIs $25k-50k, 0.1% for AGIs $50k-75k, 0.2% for AGIs $75k-100k, 0.5% for AGIs over 100k)
Total itemized deductions: $16,375 (20% of AGI, reported on 29.1% of returns)
Here:
$16,375
State:
$20,239
Here:
19.6% of AGI
State:
19.5% of AGI
(% of AGI for various income ranges: 19.3% for AGIs below $10k, 8.6% for AGIs $10k-25k, 9.9% for AGIs $25k-50k, 13.4% for AGIs $50k-75k, 14.8% for AGIs $75k-100k, 9.8% for AGIs over 100k)
Charity contributions deductions: $2,607 (3% of AGI, reported on 24.5% of returns)
Here:
$2,607
State:
$3,719
Here:
2.9% of AGI
State:
3.4% of AGI
(% of AGI for various income ranges: 0.8% for AGIs below $10k, 0.8% for AGIs $10k-25k, 1.2% for AGIs $25k-50k, 1.7% for AGIs $50k-75k, 1.9% for AGIs $75k-100k, 1.7% for AGIs over 100k)
Total tax: $7,694 (reported on 77.8% of returns)
60660:
$7,694
State:
$9,882
(% of AGI for various income ranges: 6.6% for AGIs below $10k, 4.8% for AGIs $10k-25k, 8.4% for AGIs $25k-50k, 12.0% for AGIs $50k-75k, 13.5% for AGIs $75k-100k, 22.8% for AGIs over 100k)
Earned income credit: $1,477 (reported on 16.6% of returns)
Here:
$1,477
State:
$1,788
Percentage of individuals using paid preparers for their 2004 taxes: 55.8%
Here:
56%
State:
61%
(% for various income ranges: 56.8% for AGIs below $10k, 60.9% for AGIs $10k-25k, 52.2% for AGIs $25k-50k, 50.7% for AGIs $50k-75k, 53.8% for AGIs $75k-100k, 61.8% for AGIs over 100k)
Likely homosexual households (counted as self-reported same-sex unmarried-partner households)
Lesbian couples: 0.6% of all households
Gay men: 1.9% of all households
Household received Food Stamps/SNAP in the past 12 months: 3,138 Household did not receive Food Stamps/SNAP in the past 12 months: 18,236
Women who had a birth in the past 12 months: 454 (380 now married, 72 unmarried) Women who did not have a birth in the past 12 months: 11,740 (3,149 now married, 8,644 unmarried)
Housing units in zip code 60660 with a mortgage: 4,873 (373 second mortgage, 245 both second mortgage and home equity loan) Houses without a mortgage: 228
Median monthly owner costs for units with a mortgage: $2,165 Median monthly owner costs for units without a mortgage: $1,039
Residents with income below the poverty level in 2022:
This zip code:
16.4%
Whole state:
11.9%
Residents with income below 50% of the poverty level in 2022:
This zip code:
8.3%
Whole state:
5.7%
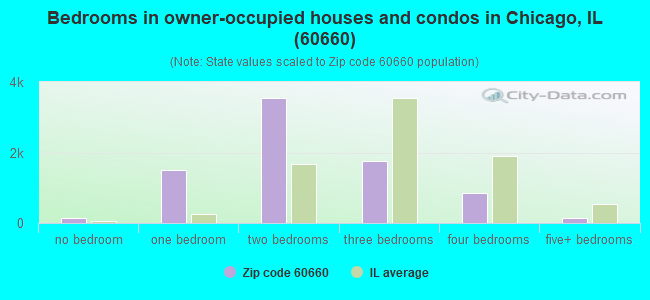
Median number of rooms in houses and condos:
Here:
5.0
State:
6.4
Median number of rooms in apartments:
Here:
3.4
State:
4.1
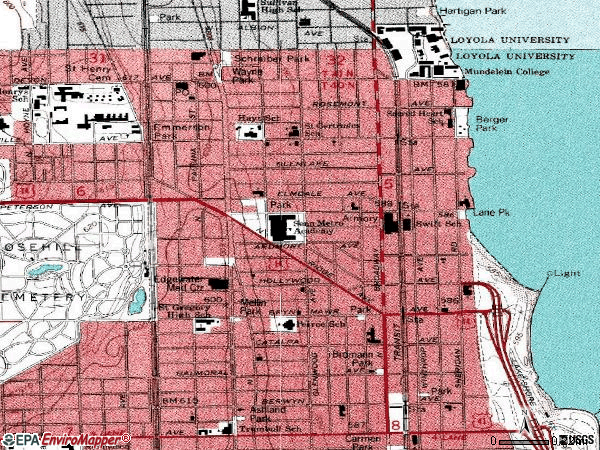
Notable locations in this zip code not listed on our city pages
Notable locations in zip code 60660: Chicago Fire Department District 2 Station 59 (A), Chicago Fire Department District 2 Station 70 (B), Skyscraper Building (C), Berger Park South Mansion (D), Yellow House (E), Angel Guardian Orphanage (F), Loyola University Living and Learning Center (G), North Lakeside Cultural Center (H), Piper Hall (I), Chicago Engine Company 70 (J), Chicago Engine Company 59 (K), Saint John Vianny Residence Hall (L). Display/hide their locations on the map
Churches in zip code 60660 include: Edgewater Baptist Church (A), Edgewater Covenant Church (B), Edgewater Presbyterian Church (C), Bethany Evangelical Lutheran Church (D), Chinese Christian Church (E), Church of the Atonement (F), Granville Avenue Presbyterian Church (G), Granville Avenue United Methodist Church (H), Sacred Heart Convent (I). Display/hide their locations on the map
Parks in zip code 60660 include: Lane Park (1), Senn Park (2), Glenlake Avenue Park (3), Thorndale Avenue Park (4), Devon Avenue Park (5), Emmerson Park (6), Wayne Park (7), Berger Park (8). Display/hide their locations on the map
Beaches: Granville Avenue Beach (A), Ardmore Hollywood Beach (B), Thorndale Avenue Beach (C), Glenlake Avenue Beach (D), Devon Avenue Beach (E), Rosemont Avenue Beach (F). Display/hide their locations on the map
3,681 married couples with children.
1,028 single-parent households (142 men, 886 women).
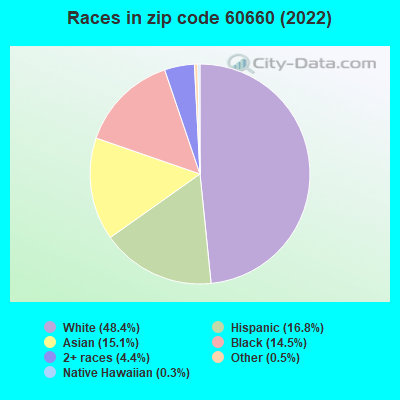
61.4% of residents of 60660 zip code speak English at home.
13.9% of residents speak Spanish at home (55% very well, 29% well, 12% not well, 4% not at all).
13.9% of residents speak other Indo-European language at home (66% very well, 23% well, 8% not well, 2% not at all).
7.6% of residents speak Asian or Pacific Island language at home (48% very well, 25% well, 21% not well, 6% not at all).
3.4% of residents speak other language at home (56% very well, 36% well, 7% not well, 1% not at all).
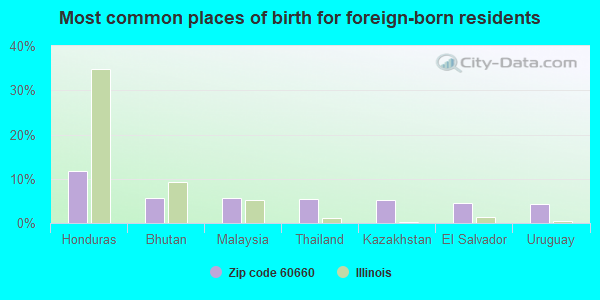
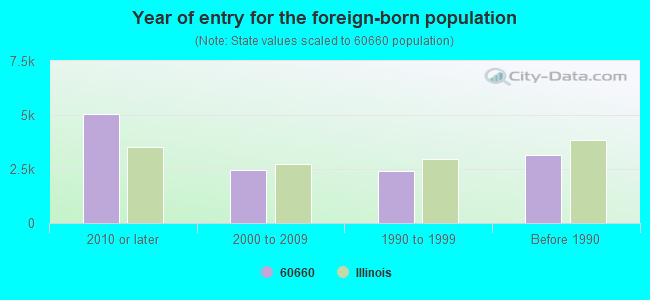
Foreign born population: 12,117 (28.6%) (54.3% of them are naturalized citizens)
Major facilities with environmental interests located in this zip code:
ONE HOUR CLEANERS (1110-1112 W GRANVILLE AVE in CHICAGO, IL)
STATE MASTER (Illinois EPA Project) - AIR PROGRAM STATE MASTER (Illinois EPA Project) - HAZARDOUS WASTE PROGRAM AIR MINOR (AIRS/AFS) Small Quantity Generators, between 100 kg and 1000 kg of hazardous waste/month (Resource Conservation and Recovery Act (tracking hazardous waste)) - notification Business SIC classification: DRYCLEANING PLANTS, EXCEPT RUG CLEANING Organizations: YANG TOM (CONTACT/OWNER)
NICHOLAS SENN HIGH SCHOOL (5900 NORTH GLENWOOD AVENUE in CHICAGO, IL)
STATE MASTER (Illinois EPA Project) - SOLID WASTE PROGRAM, AIR PROGRAM, HAZARDOUS WASTE PROGRAM AIR MINOR (AIRS/AFS) COMPLIANCE ACTIVITY (Tracking inspections of insecticide, fungicide, and rodenticide, and toxic substances) (National Center for Education Statistics) - STATE ID-1501629900037 Small Quantity Generators, between 100 kg and 1000 kg of hazardous waste/month (Resource Conservation and Recovery Act (tracking hazardous waste)) - notification Business SIC classification: ELEMENTARY AND SECONDARY SCHOOLS Organizations: CHICAGO PUBLIC SCHOOLS (CONTACT/OWNER)
, CITY OF CHICAGO SCHOOL DIST 299 (SCHOOL DISTRICT)
Alternative names: SENN METRO ACADEMY
PEIRCE (1423 W BRYN MAWR in CHICAGO, IL)
STATE MASTER (Illinois EPA Project) - HAZARDOUS WASTE PROGRAM (National Center for Education Statistics) - STATE ID-1501629902399 Small Quantity Generators, between 100 kg and 1000 kg of hazardous waste/month (Resource Conservation and Recovery Act (tracking hazardous waste)) - notification Organizations: CHICAGO PUBLIC SCHOOLS (CONTACT/OWNER)
, CITY OF CHICAGO SCHOOL DIST 299 (SCHOOL DISTRICT)
Alternative names: PEIRCE SCHOOL
LAKE SHORE CLEANERS (1035 W. GRANVILLE AVENUE in CHICAGO, IL)
STATE MASTER (Illinois EPA Project) - AIR PROGRAM, HAZARDOUS WASTE PROGRAM AIR MINOR (AIRS/AFS) CRITERIA AND HAZARDOUS AIR POLLUTANT INVENTORY (Inventory of air pollution sources) Small Quantity Generators, between 100 kg and 1000 kg of hazardous waste/month (Resource Conservation and Recovery Act (tracking hazardous waste)) - notification Business SIC classification: DRYCLEANING PLANTS, EXCEPT RUG CLEANING Business NAICS classification: DRYCLEANING AND LAUNDRY SERVICES (EXCEPT COIN-OPERATED). Organizations: PARISI D D (CONTACT/OWNER)
MISERICORDIA SCHOOL - NORTH (6300 N. RIDGE AVE. in CHICAGO, IL)
STATE MASTER (Illinois EPA Project) - AIR PROGRAM AIR MINOR (AIRS/AFS) COMPLIANCE ACTIVITY (Tracking inspections of insecticide, fungicide, and rodenticide, and toxic substances) CRITERIA AND HAZARDOUS AIR POLLUTANT INVENTORY (Inventory of air pollution sources) Business SIC classification: ELEMENTARY AND SECONDARY SCHOOLS Alternative names: MISERICORDIA HOME NORTH
ONE HOUR CARE CLEANERS (6120 RAVENSWOOD in CHICAGO, IL)
STATE MASTER (Illinois EPA Project) - HAZARDOUS WASTE PROGRAM (Resource Conservation and Recovery Act (tracking hazardous waste)) Organizations: PATEL NITIN (CONTACT/OWNER)
COM ED ARDMORE STA (1128 ARDMORE AVE in CHICAGO, IL)
STATE MASTER (Illinois EPA Project) - HAZARDOUS WASTE PROGRAM Large Quantity Generators, more that 1000 kg of hazardous waste/month (Resource Conservation and Recovery Act (tracking hazardous waste)) - notification Organizations: COMMONWEALTH EDISON CO (CONTACT/OWNER)
Alternative names: COMMONWEALTH EDISON CO 638 ARDMORE STA
LINVATEC (5645 NO RAVENSWOOD AVE in CHICAGO, IL)
STATE MASTER (Illinois EPA Project) - SOLID WASTE PROGRAM, AIR PROGRAM, HAZARDOUS WASTE PROGRAM AIR MINOR (AIRS/AFS) Conditionally Exempt Small Quantity Generators, less than 100 kg/month of hazardous waste (Resource Conservation and Recovery Act (tracking hazardous waste)) - notification Business SIC classification: NONCLASSIFIABLE ESTABLISHMENTS Organizations: WECK EDWARD INC (CONTACT/OWNER)
CHICAGO DISCOUNT CLEANERS (6116 N BROADWAY in CHICAGO, IL)
STATE MASTER (Illinois EPA Project) - SOLID WASTE PROGRAM (Resource Conservation and Recovery Act (tracking hazardous waste)) Organizations: DA DOR INC (CONTACT/OWNER)
HOLLYWOOD TOWERS CONDOMINIUM ASSN (5701 N SHERIDAN in CHICAGO, IL)
STATE MASTER (Illinois EPA Project) - SOLID WASTE PROGRAM, AIR PROGRAM AIR MINOR (AIRS/AFS) Business SIC classification: REAL ESTATE AGENTS AND MANAGERS Alternative names: HOLLYWOOD TOWERS CONDOMINIUM ASSOCIATION
JIFFY LUBE (5601 N ASHLAND in CHICAGO, IL)
STATE MASTER (Illinois EPA Project) - HAZARDOUS WASTE PROGRAM Large Quantity Generators, more that 1000 kg of hazardous waste/month (Resource Conservation and Recovery Act (tracking hazardous waste)) - notification Organizations: F AND D LTD (CONTACT/OWNER)
Alternative names: JIFFY LUBE 780
HUNTER PROPERTIES (5943 N BROADWAY in CHICAGO, IL)
STATE MASTER (Illinois EPA Project) - HAZARDOUS WASTE PROGRAM Small Quantity Generators, between 100 kg and 1000 kg of hazardous waste/month (Resource Conservation and Recovery Act (tracking hazardous waste))
ACE LAUNDRY CO (17865-73 W PETERSON AVE in CHICAGO, IL)
STATE MASTER (Illinois EPA Project) - AIR PROGRAM AIR MINOR (AIRS/AFS) Business SIC classification: DRYCLEANING PLANTS, EXCEPT RUG CLEANING
Housing units lacking complete plumbing facilities: 0.7% Housing units lacking complete kitchen facilities: 1.4%
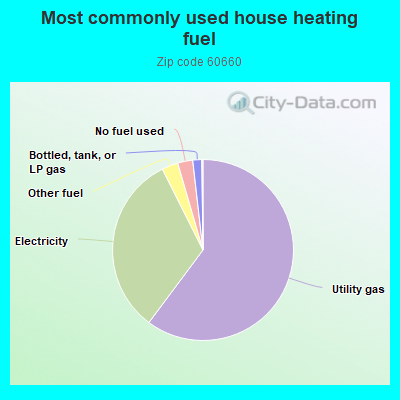
60.2%Utility gas
32.4%Electricity
2.9%Other fuel
2.7%No fuel used
1.6%Bottled, tank, or LP gas
Population in 1990: 45,106. Population change in the 1990s: +2,620 (+5.8%).
Place of birth for U.S.-born residents:
This state: 18,433
Northeast: 1,839
Midwest: 5,198
South: 2,620
West: 1,709
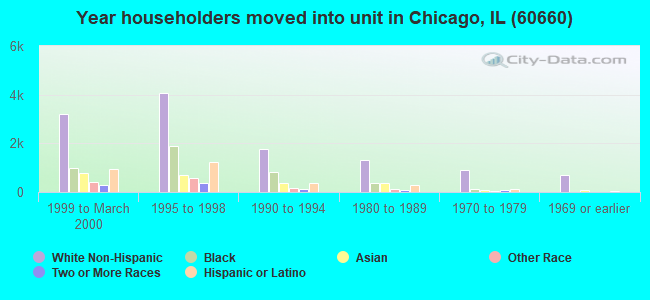
47% of the 60660 zip code residents lived in the same house 5 years ago. Out of people who lived in different houses, 73% lived in this county. Out of people who lived in different counties, 50% lived in Illinois.
85% of the 60660 zip code residents lived in the same house 1 year ago. Out of people who lived in different houses, 73% moved from this county. Out of people who lived in different houses, 4% moved from different county within same state. Out of people who lived in different houses, 16% moved from different state. Out of people who lived in different houses, 5% moved from abroad.
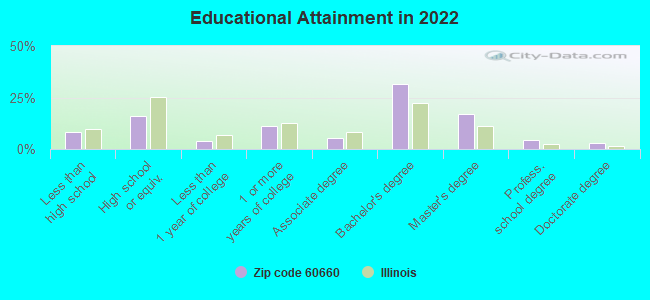
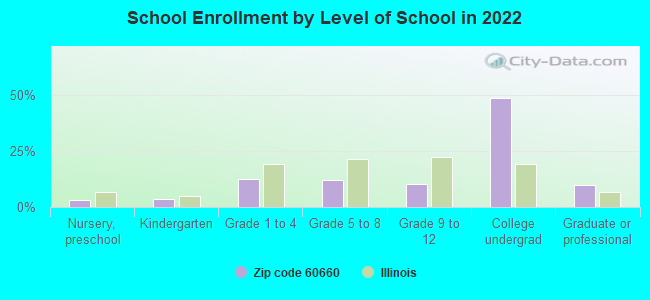
Private vs. public school enrollment:
Students in private schools in grades 1 to 8 (elementary and middle school): 761
Here:
34.8%
Illinois:
13.3%
Students in private schools in grades 9 to 12 (high school): 46
Here:
5.2%
Illinois:
9.9%
Students in private undergraduate colleges: 3,003
Here:
69.3%
Illinois:
27.4%
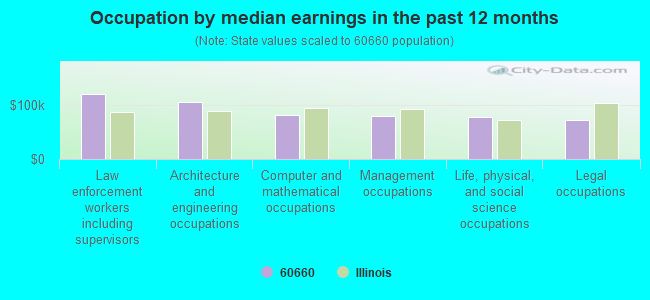
Occupation by median earnings in the past 12 months ($)
120,340Law enforcement workers including supervisors
105,869Architecture and engineering occupations
81,265Computer and mathematical occupations
78,423Management occupations
77,945Life, physical, and social science occupations
71,844Legal occupations
Companies with federal contracts located in this zip code:
ARIES DESIGN AUTOMATION, LLC (6157 N SHERIDAN RD, SUITE in CHICAGO, IL; small business)
$100,000 with Air Force for Other Defense -- Applied Research and Exploratory Development (R&D). Signed on 2006-04-28. Completion date: 2006-10-28.
Top industries in this zip code by the number of employees in 2005:
Health Care and Social Assistance: Residential Mental Retardation Facilities (500-999 employees: 1 establishment, 1-4 employees: 1 establishment)
Other Services (except Public Administration): Other Similar Organizations (except Business, Professional, Labor, and Political Organizations) (20-49: 1, 10-19: 8, 5-9: 2, 1-4: 11)
Health Care and Social Assistance: General Medical and Surgical Hospitals (100-249: 1)
2002 - 2018 National Fire Incident Reporting System (NFIRS) incidents
Based on the data from the years 2002 - 2018 the average number of fires per year is 102. The highest number of fire incidents - 177 took place in 2014, and the least - 0 in 2005. The data has an increasing trend.
When looking into fire subcategories, the most reports belonged to: Structure Fires (65.0%), and Outside Fires (14.3%).
Fire incident types reported to NFIRS in Zip Code 60660


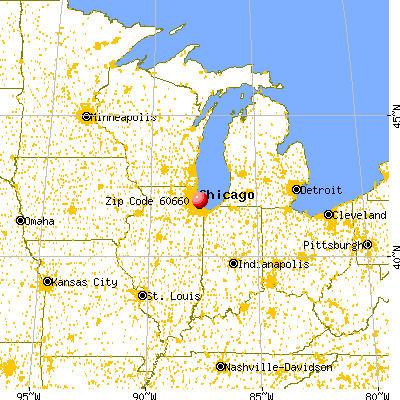


 Nearest zip codes: 60640, 60626, 60613, 60645, 60659, 60625.


 Based on the data from the years 2002 - 2018 the average number of fires per year is 102. The highest number of fire incidents - 177 took place in 2014, and the least - 0 in 2005. The data has an increasing trend.
 When looking into fire subcategories, the most reports belonged to: Structure Fires (65.0%), and Outside Fires (14.3%).