Estimated zip code population in 2022: 51,245 Zip code population in 2010: 48,281 Zip code population in 2000: 50,548
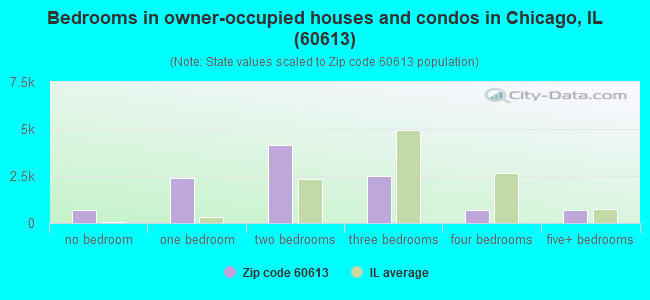
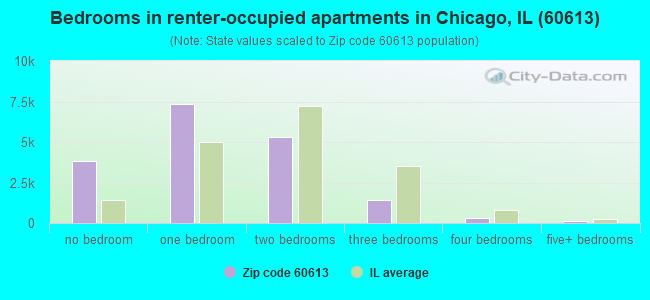
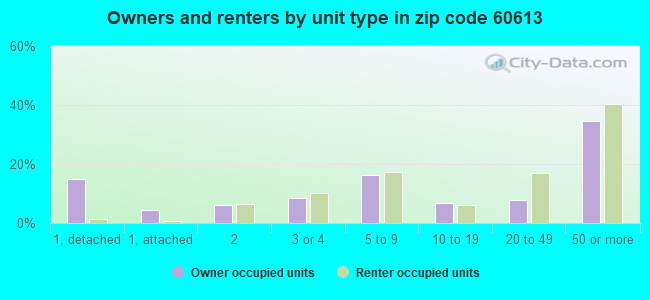
Houses and condos: 31,153 Renter-occupied apartments: 17,892
% of renters here:
62%
State:
33%
March 2022 cost of living index in zip code 60613: 103.1 (near average, U.S. average is 100)
Land area: 2.2 sq. mi. Water area: 0.4 sq. mi.
Population density: 23,566 people per square mile
(very high).
OSM Map
General Map
Google Map
MSN Map
OSM Map
General Map
Google Map
MSN Map
OSM Map
General Map
Google Map
MSN Map
OSM Map
General Map
Google Map
MSN Map
Please wait while loading the map...
Real estate property taxes paid for housing units in 2022:
This zip code:
1.7% ($6,943)
Illinois:
2.0% ($4,912)
Median real estate property taxes paid for housing units with mortgages in 2022: $6,954 (1.6%) Median real estate property taxes paid for housing units with no mortgage in 2022: $6,623 (1.8%)
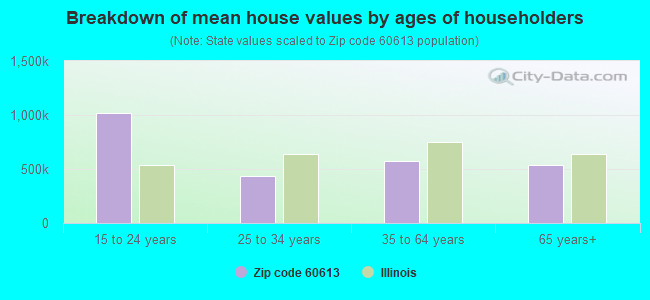
Estimated median house/condo value in 2022: $420,175
60613:
$420,175
Illinois:
$251,600
According to our research of Illinois and other state lists, there were 12 registered sex offenders living in 60613 zip code as of April 27, 2024. The ratio of all residents to sex offenders in zip code 60613 is 4,186 to 1. The ratio of registered sex offenders to all residents in this zip code is much lower than the state average.
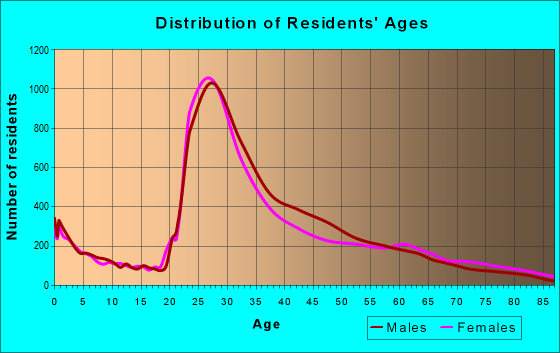
Median resident age:
This zip code:
34.0 years
Illinois median age:
39.1 years
Average household size:
This zip code:
1.8 people
Illinois:
2.4 people
Averages for the 2020 tax year for zip code 60613, filed in 2021:
Average Adjusted Gross Income (AGI) in 2020: $119,159 (Individual Income Tax Returns)
Here:
$119,159
State:
$82,626
Salary/wage: $94,747 (reported on 87.9% of returns)
Here:
$94,747
State:
$66,640
(% of AGI for various income ranges: 1125.9% for AGIs below $25k, 3760.4% for AGIs $25k-50k, 6970.3% for AGIs $50k-75k, 10517.9% for AGIs $75k-100k, 19128.4% for AGIs $100k-200k, 112251.0% for AGIs over 200k)
Taxable interest for individuals: $1,980 (reported on 32.8% of returns)
This zip code:
$1,980
Illinois:
$2,376
(% of AGI for various income ranges: 14.1% for AGIs below $25k, 13.9% for AGIs $25k-50k, 20.5% for AGIs $50k-75k, 41.6% for AGIs $75k-100k, 97.3% for AGIs $100k-200k, 1357.4% for AGIs over 200k)
Ordinary dividends: $7,790 (reported on 31.5% of returns)
Here:
$7,790
State:
$9,061
(% of AGI for various income ranges: 48.0% for AGIs below $25k, 39.9% for AGIs $25k-50k, 78.3% for AGIs $50k-75k, 111.2% for AGIs $75k-100k, 376.9% for AGIs $100k-200k, 5315.3% for AGIs over 200k)
Net capital gain/loss in AGI: +$47,194 (reported on 29.1% of returns)
Here:
+$47,194
State:
+$31,684
(% of AGI for various income ranges: 32.4% for AGIs below $25k, 48.1% for AGIs $25k-50k, 73.3% for AGIs $50k-75k, 132.9% for AGIs $75k-100k, 574.0% for AGIs $100k-200k, 39487.4% for AGIs over 200k)
Profit/loss from business: +$20,490 (reported on 17.3% of returns)
Here:
+$20,490
State:
+$12,175
(% of AGI for various income ranges: 171.0% for AGIs below $25k, 185.5% for AGIs $25k-50k, 171.2% for AGIs $50k-75k, 204.4% for AGIs $75k-100k, 653.0% for AGIs $100k-200k, 5777.7% for AGIs over 200k)
Taxable individual retirement arrangement distribution: $24,808 (reported on 5.5% of returns)
60613:
$24,808
Illinois:
$21,613
(% of AGI for various income ranges: 42.2% for AGIs below $25k, 57.7% for AGIs $25k-50k, 91.2% for AGIs $50k-75k, 124.6% for AGIs $75k-100k, 447.9% for AGIs $100k-200k, 1584.9% for AGIs over 200k)
Self-employed (Keogh) retirement plans: $37,239 (reported on 1.5% of returns)
60613:
$37,239
Illinois:
$30,962
(% of AGI for various income ranges: 5.5% for AGIs below $25k, 8.4% for AGIs $50k-75k, 62.6% for AGIs $100k-200k, 1521.3% for AGIs over 200k)
Total itemized deductions: $29,953 (reported on 15.3% of returns)
Here:
$29,953
State:
$34,948
(% of AGI for various income ranges: 61.9% for AGIs below $25k, 86.5% for AGIs $25k-50k, 172.3% for AGIs $50k-75k, 483.7% for AGIs $75k-100k, 1145.0% for AGIs $100k-200k, 7777.3% for AGIs over 200k)
Charity contributions: $8,601 (reported on 12.1% of returns)
Here:
$8,601
State:
$13,122
(% of AGI for various income ranges: 4.0% for AGIs below $25k, 14.2% for AGIs $25k-50k, 18.9% for AGIs $50k-75k, 42.6% for AGIs $75k-100k, 150.1% for AGIs $100k-200k, 2444.8% for AGIs over 200k)
Taxes paid: $8,955 (reported on 15.3% of returns)
60613:
$8,955
State:
$8,563
(% of AGI for various income ranges: 17.6% for AGIs below $25k, 25.3% for AGIs $25k-50k, 62.7% for AGIs $50k-75k, 191.0% for AGIs $75k-100k, 451.1% for AGIs $100k-200k, 1819.0% for AGIs over 200k)
Earned income credit: $1,234 (reported on 6.4% of returns)
Here:
$1,234
State:
$2,311
(% of AGI for various income ranges: 36.7% for AGIs below $25k, 14.3% for AGIs $25k-50k)
Percentage of individuals using paid preparers for their 2020 taxes: 93.6%
Here:
94%
State:
93%
(% for various income ranges: 90.4% for AGIs below $25k, 94.1% for AGIs $25k-50k, 94.7% for AGIs $50k-75k, 94.6% for AGIs $75k-100k, 94.1% for AGIs $100k-200k, 94.9% for AGIs over 200k)
Averages for the 2012 tax year for zip code 60613, filed in 2013:
Average Adjusted Gross Income (AGI) in 2012: $85,707 (Individual Income Tax Returns)
Here:
$85,707
State:
$68,058
Salary/wage: $73,184 (reported on 89.6% of returns)
Here:
$73,184
State:
$55,396
(% of AGI for various income ranges: 82.0% for AGIs below $25k, 91.6% for AGIs $25k-50k, 90.9% for AGIs $50k-75k, 88.4% for AGIs $75k-100k, 85.9% for AGIs $100k-200k, 59.8% for AGIs over 200k)
Taxable interest for individuals: $1,644 (reported on 35.2% of returns)
This zip code:
$1,644
Illinois:
$1,969
(% of AGI for various income ranges: 0.9% for AGIs below $25k, 0.4% for AGIs $25k-50k, 0.4% for AGIs $50k-75k, 0.4% for AGIs $75k-100k, 0.5% for AGIs $100k-200k, 1.0% for AGIs over 200k)
Ordinary dividends: $6,423 (reported on 26.9% of returns)
Here:
$6,423
State:
$7,786
(% of AGI for various income ranges: 1.9% for AGIs below $25k, 0.8% for AGIs $25k-50k, 0.9% for AGIs $50k-75k, 1.3% for AGIs $75k-100k, 1.5% for AGIs $100k-200k, 3.1% for AGIs over 200k)
Net capital gain/loss in AGI: +$23,788 (reported on 21.5% of returns)
Here:
+$23,788
State:
+$22,183
(% of AGI for various income ranges: 0.3% for AGIs $25k-50k, 0.4% for AGIs $50k-75k, 0.6% for AGIs $75k-100k, 1.5% for AGIs $100k-200k, 13.3% for AGIs over 200k)
Profit/loss from business: +$17,717 (reported on 15.4% of returns)
Here:
+$17,717
State:
+$12,903
(% of AGI for various income ranges: 9.6% for AGIs below $25k, 3.1% for AGIs $25k-50k, 2.3% for AGIs $50k-75k, 2.3% for AGIs $75k-100k, 2.9% for AGIs $100k-200k, 3.2% for AGIs over 200k)
Taxable individual retirement arrangement distribution: $21,584 (reported on 6.2% of returns)
60613:
$21,584
Illinois:
$17,929
(% of AGI for various income ranges: 2.2% for AGIs below $25k, 1.2% for AGIs $25k-50k, 1.2% for AGIs $50k-75k, 1.3% for AGIs $75k-100k, 1.8% for AGIs $100k-200k, 1.6% for AGIs over 200k)
Self-employment retirement plans: $26,177 (reported on 1.3% of returns)
60613:
$26,177
Illinois:
$24,666
(% of AGI for various income ranges: 0.1% for AGIs $75k-100k, 0.3% for AGIs $100k-200k, 0.8% for AGIs over 200k)
Total itemized deductions: $28,580 (16% of AGI, reported on 33.6% of returns)
Here:
$28,580
State:
$26,433
Here:
16.3% of AGI
State:
19.2% of AGI
(% of AGI for various income ranges: 8.3% for AGIs below $25k, 5.5% for AGIs $25k-50k, 8.7% for AGIs $50k-75k, 11.4% for AGIs $75k-100k, 14.1% for AGIs $100k-200k, 12.3% for AGIs over 200k)
Charity contributions: $4,433 (reported on 27.0% of returns)
Here:
$4,433
State:
$4,525
(% of AGI for various income ranges: 0.5% for AGIs below $25k, 0.5% for AGIs $25k-50k, 0.7% for AGIs $50k-75k, 0.9% for AGIs $75k-100k, 1.2% for AGIs $100k-200k, 2.2% for AGIs over 200k)
Taxes paid: $13,356 (reported on 33.5% of returns)
60613:
$13,356
State:
$11,968
(% of AGI for various income ranges: 2.2% for AGIs below $25k, 1.6% for AGIs $25k-50k, 3.1% for AGIs $50k-75k, 4.7% for AGIs $75k-100k, 6.5% for AGIs $100k-200k, 6.6% for AGIs over 200k)
Earned income credit: $1,329 (reported on 7.6% of returns)
Here:
$1,329
State:
$2,349
(% of AGI for various income ranges: 2.5% for AGIs below $25k, 0.2% for AGIs $25k-50k)
Percentage of individuals using paid preparers for their 2012 taxes: 42.9%
Here:
43%
State:
57%
(% for various income ranges: 42.0% for AGIs below $25k, 35.7% for AGIs $25k-50k, 38.0% for AGIs $50k-75k, 43.3% for AGIs $75k-100k, 50.7% for AGIs $100k-200k, 71.4% for AGIs over 200k)
Averages for the 2004 tax year for zip code 60613, filed in 2005:
Average Adjusted Gross Income (AGI) in 2004: $62,576 (Individual Income Tax Returns)
Here:
$62,576
State:
$54,625
Salary/wage: $55,988 (reported on 89.9% of returns)
Here:
$55,988
State:
$46,811
(% of AGI for various income ranges: 223.7% for AGIs below $10k, 85.4% for AGIs $10k-25k, 93.0% for AGIs $25k-50k, 90.8% for AGIs $50k-75k, 89.3% for AGIs $75k-100k, 68.8% for AGIs over 100k)
Taxable interest for individuals: $1,513 (reported on 46.7% of returns)
This zip code:
$1,513
Illinois:
$2,101
(% of AGI for various income ranges: 16.1% for AGIs below $10k, 1.7% for AGIs $10k-25k, 0.8% for AGIs $25k-50k, 0.9% for AGIs $50k-75k, 0.8% for AGIs $75k-100k, 1.2% for AGIs over 100k)
Taxable dividends: $3,162 (reported on 29.7% of returns)
Here:
$3,162
State:
$4,306
(% of AGI for various income ranges: 14.7% for AGIs below $10k, 1.4% for AGIs $10k-25k, 0.8% for AGIs $25k-50k, 1.0% for AGIs $50k-75k, 1.0% for AGIs $75k-100k, 1.9% for AGIs over 100k)
Net capital gain/loss: +$15,825 (reported on 24.0% of returns)
Here:
+$15,825
State:
+$17,321
(% of AGI for various income ranges: 11.8% for AGIs below $10k, 0.5% for AGIs $10k-25k, 0.2% for AGIs $25k-50k, 0.6% for AGIs $50k-75k, 1.1% for AGIs $75k-100k, 11.6% for AGIs over 100k)
Profit/loss from business: +$14,110 (reported on 14.4% of returns)
Here:
+$14,110
State:
+$11,771
(% of AGI for various income ranges: 8.9% for AGIs below $10k, 6.7% for AGIs $10k-25k, 2.6% for AGIs $25k-50k, 2.5% for AGIs $50k-75k, 2.7% for AGIs $75k-100k, 3.4% for AGIs over 100k)
Profit/loss from farming: +$2,000 (reported on 0.1% of returns)
Here:
+$2,000
State:
+$2,327
IRA payment deduction: $2,662 (reported on 2.5% of returns)
60613:
$2,662
Illinois:
$3,087
(% of AGI for various income ranges: 1.0% for AGIs below $10k, 0.3% for AGIs $10k-25k, 0.2% for AGIs $25k-50k, 0.1% for AGIs $50k-75k, 0.1% for AGIs $75k-100k, 0.0% for AGIs over 100k)
Self-employed pension: $18,284 (reported on 1.6% of returns)
Here:
$18,284
Illinois:
$16,965
(% of AGI for various income ranges: 0.1% for AGIs $10k-25k, 0.1% for AGIs $25k-50k, 0.2% for AGIs $50k-75k, 0.2% for AGIs $75k-100k, 0.8% for AGIs over 100k)
Total itemized deductions: $20,081 (17% of AGI, reported on 34.2% of returns)
Here:
$20,081
State:
$20,239
Here:
16.8% of AGI
State:
19.5% of AGI
(% of AGI for various income ranges: 34.2% for AGIs below $10k, 7.4% for AGIs $10k-25k, 7.5% for AGIs $25k-50k, 11.6% for AGIs $50k-75k, 13.7% for AGIs $75k-100k, 11.6% for AGIs over 100k)
Charity contributions deductions: $3,149 (2% of AGI, reported on 29.6% of returns)
Here:
$3,149
State:
$3,719
Here:
2.5% of AGI
State:
3.4% of AGI
(% of AGI for various income ranges: 1.5% for AGIs below $10k, 0.6% for AGIs $10k-25k, 0.8% for AGIs $25k-50k, 1.2% for AGIs $50k-75k, 1.5% for AGIs $75k-100k, 1.9% for AGIs over 100k)
Total tax: $11,984 (reported on 86.9% of returns)
60613:
$11,984
State:
$9,882
(% of AGI for various income ranges: 8.2% for AGIs below $10k, 5.6% for AGIs $10k-25k, 10.2% for AGIs $25k-50k, 13.7% for AGIs $50k-75k, 14.9% for AGIs $75k-100k, 21.6% for AGIs over 100k)
Earned income credit: $1,185 (reported on 7.0% of returns)
Here:
$1,185
State:
$1,788
Percentage of individuals using paid preparers for their 2004 taxes: 46.4%
Here:
46%
State:
61%
(% for various income ranges: 47.3% for AGIs below $10k, 46.8% for AGIs $10k-25k, 40.0% for AGIs $25k-50k, 43.9% for AGIs $50k-75k, 48.4% for AGIs $75k-100k, 61.7% for AGIs over 100k)
Likely homosexual households (counted as self-reported same-sex unmarried-partner households)
Lesbian couples: 0.2% of all households
Gay men: 1.2% of all households
Household received Food Stamps/SNAP in the past 12 months: 2,281 Household did not receive Food Stamps/SNAP in the past 12 months: 26,411
Women who had a birth in the past 12 months: 590 (560 now married, 28 unmarried) Women who did not have a birth in the past 12 months: 16,028 (4,713 now married, 11,374 unmarried)
Housing units in zip code 60613 with a mortgage: 7,881 (495 second mortgage, 415 both second mortgage and home equity loan) Houses without a mortgage: 116
Median monthly owner costs for units with a mortgage: $2,543 Median monthly owner costs for units without a mortgage: $1,201
Residents with income below the poverty level in 2022:
This zip code:
9.3%
Whole state:
11.9%
Residents with income below 50% of the poverty level in 2022:
This zip code:
3.9%
Whole state:
5.7%
Median number of rooms in houses and condos:
Here:
4.6
State:
6.4
Median number of rooms in apartments:
Here:
3.2
State:
4.1
Notable locations in this zip code not listed on our city pages
Notable locations in zip code 60613: Waveland Avenue Golf Course (A), Wrigley Field (B), Chicago Corinthian Yacht Club (C), Wilson Avenue Crib Light (D), Montrose Breakwater Light (E), Chicago Fire Department District 1 Station 78 (F), Chicago Fire Department (G), Isaac G Ettleson Building (H), Northland Hall (I), Northside Auditorium (J), Chicago Engine Company 78 (K), Saint Josephs Hall (L). Display/hide their locations on the map
Churches in zip code 60613 include: Bethany United Church of Christ (A), Buena Memorial Presbyterian Church (B), Christian Fellowship United Methodist Church (C), Church Universal and Triumphant (D), Cuyler Covenant Church (E), First Independent Church (F), Gospel Outreach Christian Fellowship Church (G), Korean Presbyterian Church of Chicago (H), Lake View Presbyterian Church (I). Display/hide their locations on the map
Parks in zip code 60613 include: Jniper Park (1), Gill Park (2), Greenview Park (3), Filber Park (4), Cranberry Park (5), Park 411 (6). Display/hide their locations on the map
4,611 married couples with children.
1,015 single-parent households (307 men, 708 women).
78.7% of residents of 60613 zip code speak English at home.
7.5% of residents speak Spanish at home (68% very well, 16% well, 13% not well, 3% not at all).
6.4% of residents speak other Indo-European language at home (71% very well, 14% well, 12% not well, 3% not at all).
4.5% of residents speak Asian or Pacific Island language at home (71% very well, 22% well, 5% not well, 2% not at all).
2.4% of residents speak other language at home (64% very well, 23% well, 13% not well).
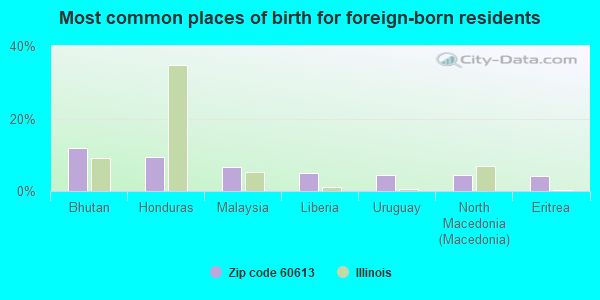
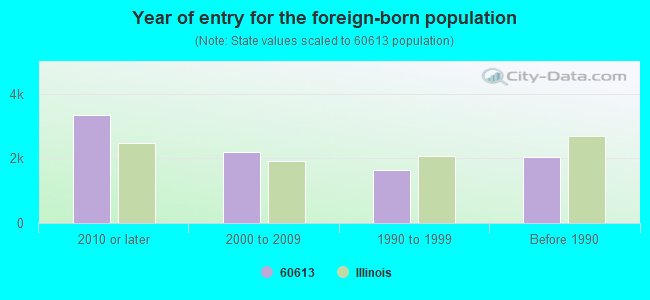
Foreign born population: 8,302 (16.2%) (54.1% of them are naturalized citizens)
Major facilities with environmental interests located in this zip code:
LAKEVIEW HIGH SCHOOL (4015 N ASHLAND AVE in CHICAGO, IL)
STATE MASTER (Illinois EPA Project) - SOLID WASTE PROGRAM, HAZARDOUS WASTE PROGRAM AIR MONITORING SITE (Airborne pollution emission tracking) (Geographic Names Information System) (National Center for Education Statistics) - STATE ID-1501629900026 Small Quantity Generators, between 100 kg and 1000 kg of hazardous waste/month (Resource Conservation and Recovery Act (tracking hazardous waste)) - notification Organizations: CHICAGO PUBLIC SCHOOLS (CONTACT/OWNER)
, CITY OF CHICAGO SCHOOL DIST 299 (SCHOOL DISTRICT)
Alternative names: LAKE VIEW HIGH SCHOOL
MARY E COURTENAY SCHOOL (1726 W BERTEAU in CHICAGO, IL)
STATE MASTER (Illinois EPA Project) - HAZARDOUS WASTE PROGRAM (National Center for Education Statistics) - STATE ID-1501629902921 Small Quantity Generators, between 100 kg and 1000 kg of hazardous waste/month (Resource Conservation and Recovery Act (tracking hazardous waste)) - notification Organizations: CHICAGO PUBLIC SCHOOLS (CONTACT/OWNER)
, CITY OF CHICAGO SCHOOL DIST 299 (SCHOOL DISTRICT)
GRAYMILLS CORP (3705 N. LINCOLN AVENUE in CHICAGO, IL)
STATE MASTER (Illinois EPA Project) - AIR PROGRAM, SOLID WASTE PROGRAM AIR MINOR (AIRS/AFS) (Resource Conservation and Recovery Act (tracking hazardous waste)) Business SIC classification: PUMPS AND PUMPING EQUIPMENT Organizations: SHIELDS J CHAIRMAN AND PRES (CONTACT/OWNER)
Alternative names: RAYMOND HOLLIS
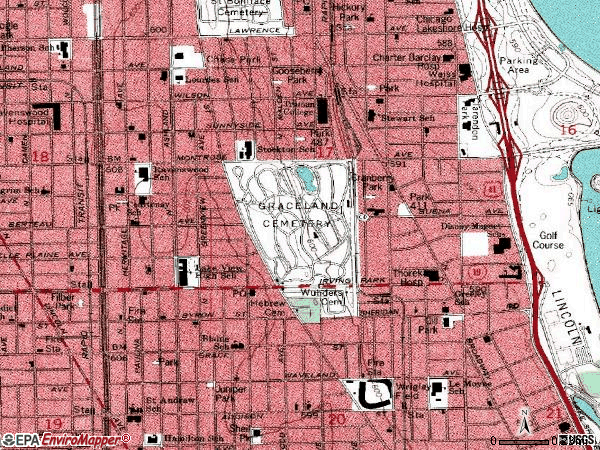
GRACELAND CEMETERY (4001 NORTH CLARK in CHICAGO, IL)
STATE MASTER (Illinois EPA Project) - AIR PROGRAM, HAZARDOUS WASTE PROGRAM AIR MINOR (AIRS/AFS) CRITERIA AND HAZARDOUS AIR POLLUTANT INVENTORY (Inventory of air pollution sources) Small Quantity Generators, between 100 kg and 1000 kg of hazardous waste/month (Resource Conservation and Recovery Act (tracking hazardous waste)) - notification Business SIC classification: FUNERAL SERVICE AND CREMATORIES Organizations: TRUSTEES GRACELAND IMP FUND (CONTACT/OWNER)
Alternative names: GRACELAND CEMETARY
ATS DESIGN STUDIO INC (4229 NORTH HONORE in CHICAGO, IL)
STATE MASTER (Illinois EPA Project) - AIR PROGRAM, HAZARDOUS WASTE PROGRAM AIR MINOR (AIRS/AFS) Small Quantity Generators, between 100 kg and 1000 kg of hazardous waste/month (Resource Conservation and Recovery Act (tracking hazardous waste)) Business SIC classification: NONCLASSIFIABLE ESTABLISHMENTS Alternative names: GRAYMILLS CORPORATION
NEW CLEANERS (3232 N. BROADWAY in CHICAGO, IL)
STATE MASTER (Illinois EPA Project) - SOLID WASTE PROGRAM, AIR PROGRAM, HAZARDOUS WASTE PROGRAM AIR MINOR (AIRS/AFS) Small Quantity Generators, between 100 kg and 1000 kg of hazardous waste/month (Resource Conservation and Recovery Act (tracking hazardous waste)) - notification Business SIC classification: DRYCLEANING PLANTS, EXCEPT RUG CLEANING Organizations: LEE CHUNG (CONTACT/OWNER)
RAVENSWOOD SCHOOL (4332 N PAULINE in CHICAGO, IL)
STATE MASTER (Illinois EPA Project) - AIR PROGRAM, HAZARDOUS WASTE PROGRAM, SOLID WASTE PROGRAM AIR MINOR (AIRS/AFS) CRITERIA AND HAZARDOUS AIR POLLUTANT INVENTORY (Inventory of air pollution sources) Conditionally Exempt Small Quantity Generators, less than 100 kg/month of hazardous waste (Resource Conservation and Recovery Act (tracking hazardous waste)) - notification Business SIC and NAICS classification: ELEMENTARY AND SECONDARY SCHOOLS Organizations: CHICAGO PUBLIC SCHOOLS (CONTACT/OWNER)
Alternative names: CHICAGO BOARD OF EDUCATION, RAVENSWOOD ELEM SCHOOL, RAVENSWOOD SCHOOL-CHGO. BD. ED.
PRINCESS CLEANERS (4136 N. BROADWAY ST. in CHICAGO, IL)
STATE MASTER (Illinois EPA Project) - AIR PROGRAM, HAZARDOUS WASTE PROGRAM AIR MINOR (AIRS/AFS) CRITERIA AND HAZARDOUS AIR POLLUTANT INVENTORY (Inventory of air pollution sources) Small Quantity Generators, between 100 kg and 1000 kg of hazardous waste/month (Resource Conservation and Recovery Act (tracking hazardous waste)) - notification Business SIC classification: DRYCLEANING PLANTS, EXCEPT RUG CLEANING Business NAICS classification: DRYCLEANING AND LAUNDRY SERVICES (EXCEPT COIN-OPERATED). Organizations: RHEE TAE BOCK (CONTACT/OWNER)
MASTERWORK INC (4011 N RAVENSWOOD in CHICAGO, IL)
STATE MASTER (Illinois EPA Project) - SOLID WASTE PROGRAM, HAZARDOUS WASTE PROGRAM Large Quantity Generators, more that 1000 kg of hazardous waste/month (Resource Conservation and Recovery Act (tracking hazardous waste)) - notification Organizations: BENNETT WILLIAM (CONTACT/OWNER)
HILL MECHANICAL GROUP (4241 N RAVENSWOOD AVENUE in CHICAGO, IL)
STATE MASTER (Illinois EPA Project) - SOLID WASTE PROGRAM, AIR PROGRAM, HAZARDOUS WASTE PROGRAM AIR MINOR (AIRS/AFS) Small Quantity Generators, between 100 kg and 1000 kg of hazardous waste/month (Resource Conservation and Recovery Act (tracking hazardous waste)) - notification Business SIC classification: NONCLASSIFIABLE ESTABLISHMENTS Alternative names: HILL MECHANICAL GRP L C KOHLMAN INCORPORATED
ASI SIGN SYSTEMS (4147 N RAVENSWOOD AVE in CHICAGO, IL)
STATE MASTER (Illinois EPA Project) - SOLID WASTE PROGRAM, HAZARDOUS WASTE PROGRAM Large Quantity Generators, more that 1000 kg of hazardous waste/month (Resource Conservation and Recovery Act (tracking hazardous waste)) - notification Organizations: COX ROBERT (CONTACT/OWNER)
AMERICAN ISLAMIC CENTER (630 W IRVING PARK RD in CHICAGO, IL)
STATE MASTER (Illinois EPA Project) - HAZARDOUS WASTE PROGRAM Large Quantity Generators, more that 1000 kg of hazardous waste/month (Resource Conservation and Recovery Act (tracking hazardous waste)) - notification
LINCOLN & LINCOLN GARAGE (3740 N LINCOLN in CHICAGO, IL)
STATE MASTER (Illinois EPA Project) - SOLID WASTE PROGRAM (Resource Conservation and Recovery Act (tracking hazardous waste))
Housing units lacking complete plumbing facilities: 0.5% Housing units lacking complete kitchen facilities: 1.2%
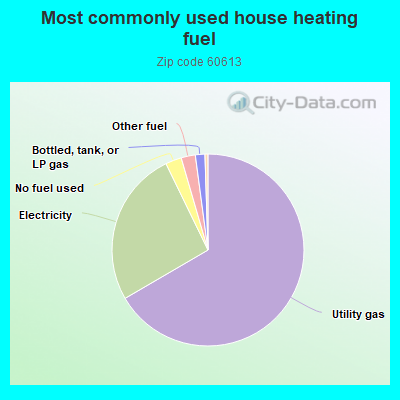
66.6%Utility gas
26.2%Electricity
2.7%No fuel used
2.4%Other fuel
1.6%Bottled, tank, or LP gas
Population in 1990: 48,963. Population change in the 1990s: +1,585 (+3.2%).
Place of birth for U.S.-born residents:
This state: 22,599
Northeast: 3,936
Midwest: 9,652
South: 4,001
West: 2,254
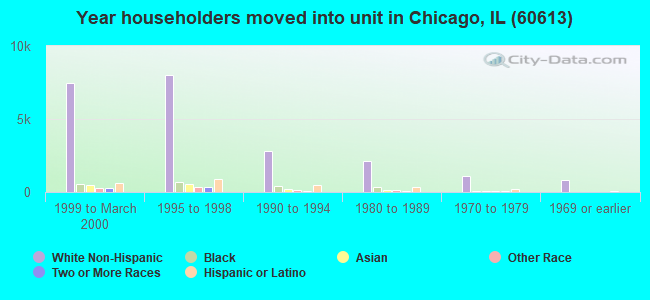
38% of the 60613 zip code residents lived in the same house 5 years ago. Out of people who lived in different houses, 58% lived in this county. Out of people who lived in different counties, 50% lived in Illinois.
79% of the 60613 zip code residents lived in the same house 1 year ago. Out of people who lived in different houses, 68% moved from this county. Out of people who lived in different houses, 5% moved from different county within same state. Out of people who lived in different houses, 22% moved from different state. Out of people who lived in different houses, 3% moved from abroad.
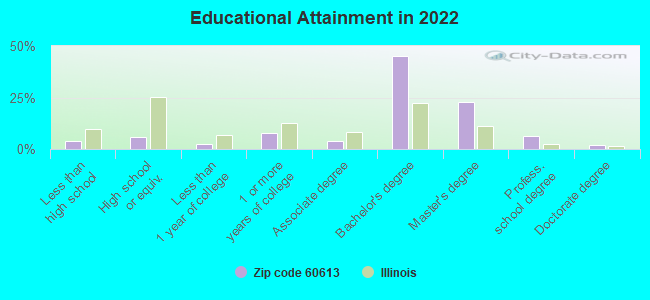
Private vs. public school enrollment:
Students in private schools in grades 1 to 8 (elementary and middle school): 589
Here:
26.1%
Illinois:
13.3%
Students in private schools in grades 9 to 12 (high school): 178
Here:
22.8%
Illinois:
9.9%
Students in private undergraduate colleges: 966
Here:
51.9%
Illinois:
27.4%
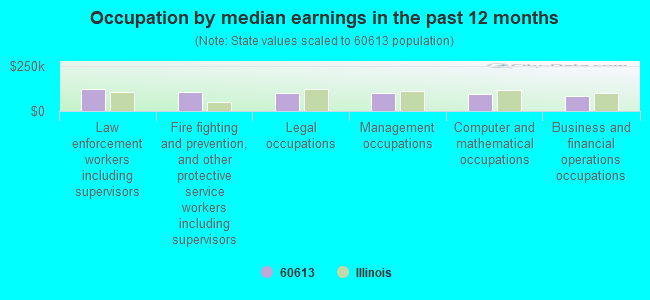
Occupation by median earnings in the past 12 months ($)
120,598Law enforcement workers including supervisors
106,197Fire fighting and prevention, and other protective service workers including supervisors
100,638Legal occupations
100,621Management occupations
93,591Computer and mathematical occupations
84,585Business and financial operations occupations
Companies with federal contracts located in this zip code (CHICAGO, IL):
ATLAS MATERIAL TESTING TECHNOL (4114 N RAVENSWOOD AVE; small business) : $728,895 in 25 contractsfrom 2000 to 2006
Contracts for Electric Portable and Hand Lighting Equipment, Meteorological Instruments and Apparatus, Environmental Chambers and Related Equipment, Laboratory Equipment and Supplies, and moreby Army, U.S. Army Corps of Engineers - civil program financing only, NASA, Navy, and others Signed by year:2000: $46,328; 2001: $105,140; 2002: $60,579; 2003: $88,421; 2004: $46,619; 2005: $343,131; 2006: $38,677.
Biggest contracts:
$166,223 with Army for Electric Portable and Hand Lighting Equipment. Signed on 2005-06-09. Completion date: 2005-10-04.
$135,709 with Army for Meteorological Instruments and Apparatus. Signed on 2005-09-12. Completion date: 2006-11-10.
$60,148 with U.S. Army Corps of Engineers - civil program financing only for Environmental Chambers and Related Equipment. Signed on 2001-05-23. Completion date: 2001-08-31.
$56,000 with NASA for Laboratory Equipment and Supplies. Signed on 2002-06-15. Completion date: 2002-09-15.
SOLID WASTE SOLUTIONS CORP (4043 N RAVENSWOOD; small business) : $244,364 in 11 contractsfrom 2003 to 2006
Contracts for Other Environmental Services, Studies, and Analytical Support, Environmental Studies and Assessments, Engineering and Technical Services, Chemical/Biological Studies and Analyses, and moreby Army, Public Buildings Service, Air Force, EPA, and others Signed by year:2000: $0; 2001: $0; 2002: $0; 2003: $17,364; 2004: $95,000; 2005: $82,000; 2006: $50,000.
Biggest contracts:
$68,000 with Army for Other Environmental Services, Studies, and Analytical Support. Signed on 2004-07-09. Completion date: 2004-12-31.
$50,000 with Public Buildings Service for Environmental Studies and Assessments. Taking place in DC. Signed on 2006-04-27. Effective on 2006-04-25. Completion date: 2007-04-30.
$30,000 with Army for Engineering and Technical Services. Signed on 2005-07-11. Completion date: 2005-09-15.
$30,000, same as above.Signed on 2005-09-01. Completion date: 2005-09-15.
INNOVATIVE SPORTS TRAINING (3711 N RAVENSWOOD AVE; small business) : $123,773 in 4 contractsfrom 2005 to 2006
$71,829 with Uniformed Services University of the Health Sciences for Miscellaneous Electrical and Electronic Components. Signed on 2006-06-21. Completion date: 2006-07-26.
$30,160 with Department of Veterans Affairs for Electrical and Electronic Properties Measuring and Testing Instruments. Taking place in MD. Signed on 2005-09-12. Completion date: 2005-12-30.
$21,784 with Army for Physical Properties Testing and Inspection. Signed on 2006-05-05. Completion date: 2006-06-30.
$0 with Centers for Disease Control and Prevention for Other Professional Services. Signed on 2005-04-05. Completion date: 2005-04-29.
KELMAN NORTH AMERICA INC (4147 N RAVENS WOOD AVE; small business) : $100,650 in 3 contractsfrom 2005 to 2006
$37,700 with Bureau of Reclamation for Chemical Analysis Instruments. Taking place in CO. Signed on 2005-08-11. Completion date: 2005-10-14.
$33,350 with Army for Electrical and Electronic Properties Measuring and Testing Instruments. Signed on 2006-06-06. Completion date: 2006-07-18.
$29,600 with Bureau of Reclamation for Liquid and Gas Flow, Liquid Level, and Mechanical Motion Measuring Instruments. Signed on 2005-03-08. Completion date: 2005-03-31.
CHICAGO COMEDY COMPANY (1800 W BERENICE AVE; small business) : $32,000 in 4 contractsin 2004
$8,000 with Army for Scientific and Management Education. Signed on 2004-12-16. Completion date: 2005-02-03.
$8,000 with U.S. Army Corps of Engineers - civil program financing only for Scientific and Management Education. Signed on 2004-12-16. Completion date: 2005-02-03.
$8,000 with U.S. Army Corps of Engineers - civil program financing only for Educational Services. Signed on 2004-01-02. Completion date: 2004-01-06.
$8,000 with Army for Educational Services. Signed on 2004-01-02. Completion date: 2004-01-06.
Top industries in this zip code by the number of employees in 2005:
Health Care and Social Assistance: General Medical and Surgical Hospitals (500-999 employees: 1 establishment)
Other Services (except Public Administration): Other Similar Organizations (except Business, Professional, Labor, and Political Organizations) (20-49: 3, 10-19: 10, 5-9: 3, 1-4: 8)
2002 - 2018 National Fire Incident Reporting System (NFIRS) incidents
According to the data from the years 2002 - 2018 the average number of fires per year is 92. The highest number of fires - 171 took place in 2010, and the least - 0 in 2005. The data has a declining trend.
When looking into fire subcategories, the most incidents belonged to: Structure Fires (53.0%), and Outside Fires (21.8%).
Fire incident types reported to NFIRS in Zip Code 60613


 Nearest zip codes: 60640, 60657, 60614, 60660, 60625, 60618.


 According to the data from the years 2002 - 2018 the average number of fires per year is 92. The highest number of fires - 171 took place in 2010, and the least - 0 in 2005. The data has a declining trend.
 When looking into fire subcategories, the most incidents belonged to: Structure Fires (53.0%), and Outside Fires (21.8%).