Estimated zip code population in 2022: 70,714 Zip code population in 2010: 66,617 Zip code population in 2000: 65,474
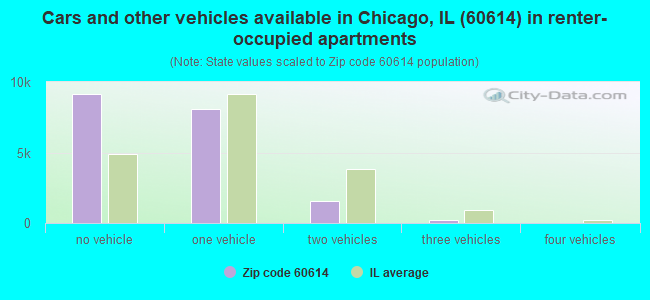
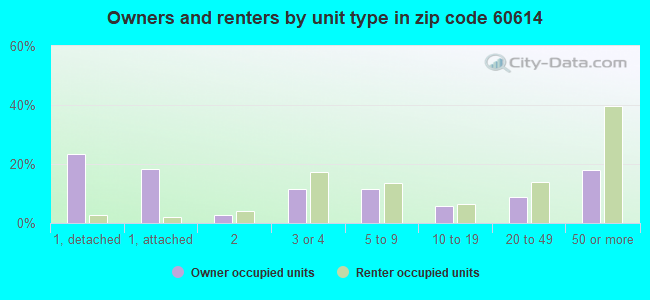
Houses and condos: 37,814 Renter-occupied apartments: 18,769
% of renters here:
54%
State:
33%
March 2022 cost of living index in zip code 60614: 105.6 (more than average, U.S. average is 100)
Land area: 3.2 sq. mi. Water area: 0.3 sq. mi.
Population density: 22,334 people per square mile
(very high).
OSM Map
General Map
Google Map
MSN Map
OSM Map
General Map
Google Map
MSN Map
OSM Map
General Map
Google Map
MSN Map
OSM Map
General Map
Google Map
MSN Map
Please wait while loading the map...
Real estate property taxes paid for housing units in 2022:
This zip code:
1.3% ($9,718)
Illinois:
2.0% ($4,912)
Median real estate property taxes paid for housing units with mortgages in 2022: $9,569 (1.2%) Median real estate property taxes paid for housing units with no mortgage in 2022: $9,944 (1.3%)
Estimated median house/condo value in 2022: $768,480
60614:
$768,480
Illinois:
$251,600
According to our research of Illinois and other state lists, there were 7 registered sex offenders living in 60614 zip code as of April 27, 2024. The ratio of all residents to sex offenders in zip code 60614 is 10,117 to 1. The ratio of registered sex offenders to all residents in this zip code is much lower than the state average.
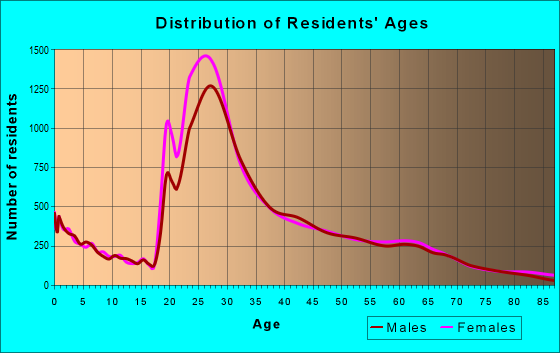
Median resident age:
This zip code:
31.3 years
Illinois median age:
39.1 years
Average household size:
This zip code:
1.9 people
Illinois:
2.4 people
Averages for the 2020 tax year for zip code 60614, filed in 2021:
Average Adjusted Gross Income (AGI) in 2020: $289,112 (Individual Income Tax Returns)
Here:
$289,112
State:
$82,626
Salary/wage: $167,497 (reported on 87.0% of returns)
Here:
$167,497
State:
$66,640
(% of AGI for various income ranges: 1184.5% for AGIs below $25k, 3967.4% for AGIs $25k-50k, 7051.3% for AGIs $50k-75k, 10898.2% for AGIs $75k-100k, 19967.5% for AGIs $100k-200k, 164804.0% for AGIs over 200k)
Taxable interest for individuals: $8,094 (reported on 45.7% of returns)
This zip code:
$8,094
Illinois:
$2,376
(% of AGI for various income ranges: 37.0% for AGIs below $25k, 34.9% for AGIs $25k-50k, 28.6% for AGIs $50k-75k, 63.5% for AGIs $75k-100k, 162.9% for AGIs $100k-200k, 5550.2% for AGIs over 200k)
Ordinary dividends: $23,986 (reported on 49.5% of returns)
Here:
$23,986
State:
$9,061
(% of AGI for various income ranges: 111.5% for AGIs below $25k, 143.2% for AGIs $25k-50k, 125.5% for AGIs $50k-75k, 248.2% for AGIs $75k-100k, 748.2% for AGIs $100k-200k, 17246.6% for AGIs over 200k)
Net capital gain/loss in AGI: +$209,210 (reported on 45.8% of returns)
Here:
+$209,210
State:
+$31,684
(% of AGI for various income ranges: 96.9% for AGIs below $25k, 99.2% for AGIs $25k-50k, 128.0% for AGIs $50k-75k, 238.3% for AGIs $75k-100k, 1067.8% for AGIs $100k-200k, 155565.0% for AGIs over 200k)
Profit/loss from business: +$44,695 (reported on 15.4% of returns)
Here:
+$44,695
State:
+$12,175
(% of AGI for various income ranges: 134.8% for AGIs below $25k, 182.0% for AGIs $25k-50k, 162.8% for AGIs $50k-75k, 254.5% for AGIs $75k-100k, 695.7% for AGIs $100k-200k, 8910.1% for AGIs over 200k)
Taxable individual retirement arrangement distribution: $41,080 (reported on 7.1% of returns)
60614:
$41,080
Illinois:
$21,613
(% of AGI for various income ranges: 59.0% for AGIs below $25k, 74.7% for AGIs $25k-50k, 94.4% for AGIs $50k-75k, 189.6% for AGIs $75k-100k, 573.8% for AGIs $100k-200k, 3109.5% for AGIs over 200k)
Self-employed (Keogh) retirement plans: $39,825 (reported on 3.2% of returns)
60614:
$39,825
Illinois:
$30,962
(% of AGI for various income ranges: 8.7% for AGIs $25k-50k, 10.5% for AGIs $50k-75k, 21.5% for AGIs $75k-100k, 68.5% for AGIs $100k-200k, 1895.1% for AGIs over 200k)
Total itemized deductions: $64,067 (reported on 23.1% of returns)
Here:
$64,067
State:
$34,948
(% of AGI for various income ranges: 159.9% for AGIs below $25k, 179.5% for AGIs $25k-50k, 205.4% for AGIs $50k-75k, 436.4% for AGIs $75k-100k, 1300.4% for AGIs $100k-200k, 20515.8% for AGIs over 200k)
Charity contributions: $41,955 (reported on 19.3% of returns)
Here:
$41,955
State:
$13,122
(% of AGI for various income ranges: 9.2% for AGIs below $25k, 17.4% for AGIs $25k-50k, 24.4% for AGIs $50k-75k, 47.7% for AGIs $75k-100k, 210.8% for AGIs $100k-200k, 12866.1% for AGIs over 200k)
Taxes paid: $9,581 (reported on 23.1% of returns)
60614:
$9,581
State:
$8,563
(% of AGI for various income ranges: 38.7% for AGIs below $25k, 53.2% for AGIs $25k-50k, 69.9% for AGIs $50k-75k, 167.9% for AGIs $75k-100k, 472.0% for AGIs $100k-200k, 2273.4% for AGIs over 200k)
Earned income credit: $1,127 (reported on 3.1% of returns)
Here:
$1,127
State:
$2,311
(% of AGI for various income ranges: 27.3% for AGIs below $25k, 8.8% for AGIs $25k-50k)
Percentage of individuals using paid preparers for their 2020 taxes: 94.2%
Here:
94%
State:
93%
(% for various income ranges: 90.5% for AGIs below $25k, 94.2% for AGIs $25k-50k, 95.2% for AGIs $50k-75k, 94.7% for AGIs $75k-100k, 94.8% for AGIs $100k-200k, 94.9% for AGIs over 200k)
Averages for the 2012 tax year for zip code 60614, filed in 2013:
Average Adjusted Gross Income (AGI) in 2012: $194,238 (Individual Income Tax Returns)
Here:
$194,238
State:
$68,058
Salary/wage: $123,294 (reported on 87.3% of returns)
Here:
$123,294
State:
$55,396
(% of AGI for various income ranges: 79.4% for AGIs below $25k, 89.5% for AGIs $25k-50k, 89.7% for AGIs $50k-75k, 85.2% for AGIs $75k-100k, 80.3% for AGIs $100k-200k, 45.1% for AGIs over 200k)
Taxable interest for individuals: $6,955 (reported on 47.1% of returns)
This zip code:
$6,955
Illinois:
$1,969
(% of AGI for various income ranges: 1.4% for AGIs below $25k, 0.6% for AGIs $25k-50k, 0.7% for AGIs $50k-75k, 0.6% for AGIs $75k-100k, 0.9% for AGIs $100k-200k, 2.0% for AGIs over 200k)
Ordinary dividends: $21,438 (reported on 42.5% of returns)
Here:
$21,438
State:
$7,786
(% of AGI for various income ranges: 5.4% for AGIs below $25k, 2.0% for AGIs $25k-50k, 1.8% for AGIs $50k-75k, 2.2% for AGIs $75k-100k, 3.1% for AGIs $100k-200k, 5.4% for AGIs over 200k)
Net capital gain/loss in AGI: +$114,799 (reported on 36.9% of returns)
Here:
+$114,799
State:
+$22,183
(% of AGI for various income ranges: 1.4% for AGIs below $25k, 1.1% for AGIs $25k-50k, 1.0% for AGIs $50k-75k, 1.3% for AGIs $75k-100k, 3.0% for AGIs $100k-200k, 28.9% for AGIs over 200k)
Profit/loss from business: +$31,249 (reported on 15.7% of returns)
Here:
+$31,249
State:
+$12,903
(% of AGI for various income ranges: 10.0% for AGIs below $25k, 3.6% for AGIs $25k-50k, 2.6% for AGIs $50k-75k, 2.9% for AGIs $75k-100k, 3.5% for AGIs $100k-200k, 2.2% for AGIs over 200k)
Taxable individual retirement arrangement distribution: $47,534 (reported on 7.8% of returns)
60614:
$47,534
Illinois:
$17,929
(% of AGI for various income ranges: 2.3% for AGIs below $25k, 1.4% for AGIs $25k-50k, 1.5% for AGIs $50k-75k, 2.2% for AGIs $75k-100k, 2.6% for AGIs $100k-200k, 1.9% for AGIs over 200k)
Self-employment retirement plans: $34,548 (reported on 3.3% of returns)
60614:
$34,548
Illinois:
$24,666
(% of AGI for various income ranges: 0.1% for AGIs $25k-50k, 0.1% for AGIs $50k-75k, 0.2% for AGIs $75k-100k, 0.4% for AGIs $100k-200k, 0.7% for AGIs over 200k)
Total itemized deductions: $59,210 (15% of AGI, reported on 42.1% of returns)
Here:
$59,210
State:
$26,433
Here:
14.8% of AGI
State:
19.2% of AGI
(% of AGI for various income ranges: 13.0% for AGIs below $25k, 6.2% for AGIs $25k-50k, 7.6% for AGIs $50k-75k, 11.9% for AGIs $75k-100k, 14.7% for AGIs $100k-200k, 13.3% for AGIs over 200k)
Charity contributions: $17,680 (reported on 35.5% of returns)
Here:
$17,680
State:
$4,525
(% of AGI for various income ranges: 0.8% for AGIs below $25k, 0.5% for AGIs $25k-50k, 0.7% for AGIs $50k-75k, 1.0% for AGIs $75k-100k, 1.4% for AGIs $100k-200k, 4.0% for AGIs over 200k)
Taxes paid: $27,977 (reported on 41.9% of returns)
60614:
$27,977
State:
$11,968
(% of AGI for various income ranges: 4.1% for AGIs below $25k, 2.1% for AGIs $25k-50k, 2.9% for AGIs $50k-75k, 5.0% for AGIs $75k-100k, 7.1% for AGIs $100k-200k, 6.4% for AGIs over 200k)
Earned income credit: $1,099 (reported on 4.1% of returns)
Here:
$1,099
State:
$2,349
(% of AGI for various income ranges: 1.6% for AGIs below $25k)
Percentage of individuals using paid preparers for their 2012 taxes: 48.9%
Here:
49%
State:
57%
(% for various income ranges: 45.1% for AGIs below $25k, 36.5% for AGIs $25k-50k, 37.8% for AGIs $50k-75k, 45.7% for AGIs $75k-100k, 55.2% for AGIs $100k-200k, 76.9% for AGIs over 200k)
Averages for the 2004 tax year for zip code 60614, filed in 2005:
Average Adjusted Gross Income (AGI) in 2004: $133,271 (Individual Income Tax Returns)
Here:
$133,271
State:
$54,625
Salary/wage: $91,629 (reported on 87.0% of returns)
Here:
$91,629
State:
$46,811
(% of AGI for various income ranges: 83.0% for AGIs $10k-25k, 90.9% for AGIs $25k-50k, 87.6% for AGIs $50k-75k, 84.1% for AGIs $75k-100k, 51.2% for AGIs over 100k)
Taxable interest for individuals: $5,664 (reported on 57.5% of returns)
This zip code:
$5,664
Illinois:
$2,101
(% of AGI for various income ranges: 2.3% for AGIs $10k-25k, 1.1% for AGIs $25k-50k, 1.1% for AGIs $50k-75k, 1.5% for AGIs $75k-100k, 2.4% for AGIs over 100k)
Taxable dividends: $8,863 (reported on 45.5% of returns)
Here:
$8,863
State:
$4,306
(% of AGI for various income ranges: 3.6% for AGIs $10k-25k, 1.5% for AGIs $25k-50k, 1.7% for AGIs $50k-75k, 2.3% for AGIs $75k-100k, 3.2% for AGIs over 100k)
Net capital gain/loss: +$63,415 (reported on 40.1% of returns)
Here:
+$63,415
State:
+$17,321
(% of AGI for various income ranges: 2.3% for AGIs $10k-25k, 1.2% for AGIs $25k-50k, 1.5% for AGIs $50k-75k, 2.9% for AGIs $75k-100k, 23.3% for AGIs over 100k)
Profit/loss from business: +$29,216 (reported on 16.0% of returns)
Here:
+$29,216
State:
+$11,771
(% of AGI for various income ranges: 7.1% for AGIs $10k-25k, 3.0% for AGIs $25k-50k, 3.3% for AGIs $50k-75k, 3.9% for AGIs $75k-100k, 3.5% for AGIs over 100k)
IRA payment deduction: $3,036 (reported on 2.7% of returns)
60614:
$3,036
Illinois:
$3,087
(% of AGI for various income ranges: 0.3% for AGIs $10k-25k, 0.2% for AGIs $25k-50k, 0.1% for AGIs $50k-75k, 0.1% for AGIs $75k-100k, 0.0% for AGIs over 100k)
Self-employed pension: $27,507 (reported on 4.0% of returns)
Here:
$27,507
Illinois:
$16,965
(% of AGI for various income ranges: 0.2% for AGIs $10k-25k, 0.2% for AGIs $25k-50k, 0.3% for AGIs $50k-75k, 0.4% for AGIs $75k-100k, 1.0% for AGIs over 100k)
Total itemized deductions: $33,636 (13% of AGI, reported on 42.3% of returns)
Here:
$33,636
State:
$20,239
Here:
12.7% of AGI
State:
19.5% of AGI
(% of AGI for various income ranges: 10.6% for AGIs $10k-25k, 7.9% for AGIs $25k-50k, 11.0% for AGIs $50k-75k, 14.6% for AGIs $75k-100k, 10.4% for AGIs over 100k)
Charity contributions deductions: $9,580 (3% of AGI, reported on 37.5% of returns)
Here:
$9,580
State:
$3,719
Here:
3.3% of AGI
State:
3.4% of AGI
(% of AGI for various income ranges: 0.8% for AGIs $10k-25k, 0.8% for AGIs $25k-50k, 1.2% for AGIs $50k-75k, 1.5% for AGIs $75k-100k, 3.1% for AGIs over 100k)
Total tax: $32,347 (reported on 88.8% of returns)
60614:
$32,347
State:
$9,882
(% of AGI for various income ranges: 5.9% for AGIs $10k-25k, 10.6% for AGIs $25k-50k, 14.2% for AGIs $50k-75k, 15.3% for AGIs $75k-100k, 23.6% for AGIs over 100k)
Earned income credit: $899 (reported on 3.8% of returns)
Here:
$899
State:
$1,788
Percentage of individuals using paid preparers for their 2004 taxes: 51.9%
Here:
52%
State:
61%
(% for various income ranges: 54.3% for AGIs below $10k, 47.7% for AGIs $10k-25k, 40.5% for AGIs $25k-50k, 43.1% for AGIs $50k-75k, 52.4% for AGIs $75k-100k, 69.4% for AGIs over 100k)
Likely homosexual households (counted as self-reported same-sex unmarried-partner households)
Lesbian couples: 0.1% of all households
Gay men: 0.3% of all households
Household received Food Stamps/SNAP in the past 12 months: 1,347 Household did not receive Food Stamps/SNAP in the past 12 months: 32,851
Women who had a birth in the past 12 months: 699 (673 now married, 23 unmarried) Women who did not have a birth in the past 12 months: 22,999 (6,911 now married, 16,167 unmarried)
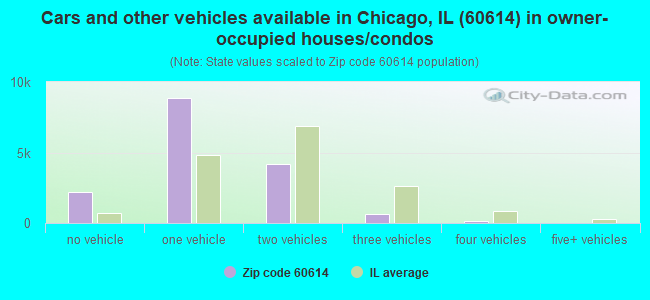
Housing units in zip code 60614 with a mortgage: 11,018 (795 second mortgage, 32 home equity loan, 645 both second mortgage and home equity loan) Houses without a mortgage: 395
Median monthly owner costs for units with a mortgage: $3,701 Median monthly owner costs for units without a mortgage: $1,519
Residents with income below the poverty level in 2022:
This zip code:
8.9%
Whole state:
11.9%
Residents with income below 50% of the poverty level in 2022:
This zip code:
3.4%
Whole state:
5.7%
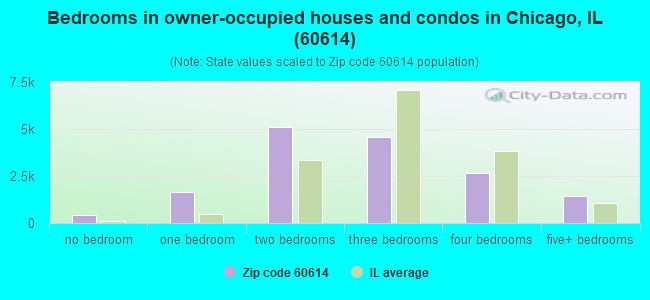
Median number of rooms in houses and condos:
Here:
5.6
State:
6.4
Median number of rooms in apartments:
Here:
3.1
State:
4.1
Notable locations in this zip code not listed on our city pages
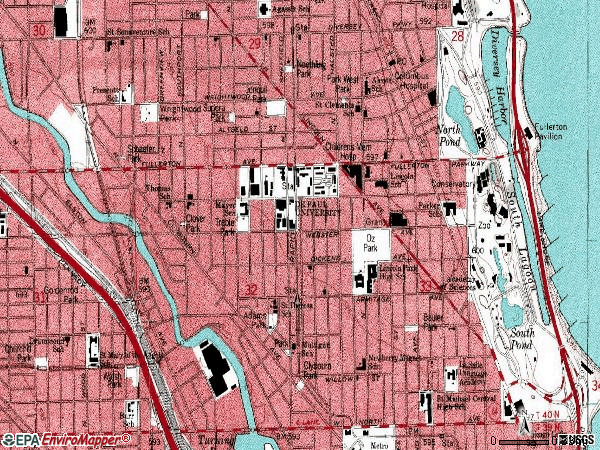
Notable locations in zip code 60614: Storks at Play (A), Oglesby Monument (B), Lincoln Park Boat Club (C), William E Dever Crib Light (D), North Avenue Jetty Light (E), Licoln Park Boat Club (F), Diversey Yacht Club (G), Byrne Hall (H), Centennial Hall (I), Corcoran Hall (J), Cortelyou Commons (K), Hayes-Healy Athletic Center (L), Levan Center (M), McCabe Hall (N), McGaw Hall (O), McGowan Biological and Environmental Sciences Center (P), Munroe Hall (Q), Ray Meyer Fitness and Recreation Center (R), Sanctuary Hall (S), Seton Hall (T). Display/hide their locations on the map
Shopping Centers: Pipers Alley Commercial Mall Shopping Center (1), Treasure Island Market Square Shopping Center (2). Display/hide their locations on the map
Churches in zip code 60614 include: Bethlehem United Church of Christ (A), Church of Our Saviour (B), Church of the Three Crosses (C), Kingdom Hall of Jehovahs Witnesses Halsted Congregation (D), Lincoln Park Presbyterian Church (E), Near North Unitarian Universalist Fellowship (F), Pilgrim Missionary Baptist Church (G), Hermon Baptist Church (H), Saint Theresa Convent (I). Display/hide their locations on the map
Parks in zip code 60614 include: Noethling Park (1), Linne Monument (2), Lincoln Park Zoo (3), Lincoln Monument (4), Jonquil Park (5), Saint Vincents Circle (6), Wish Field (7), Adams Park (8), Grant Monument (9). Display/hide their locations on the map
Tourist attractions (not listed on the city page) : Chicago Park District - Parks & Playgrounds- Lincoln Park- Zoo (Cultural Attractions- Events- & Facilities; 2200 North Cannon Drive), Chicago International Children's Film Festival (Amusement & Theme Parks; 1517 West Fullerton Avenue), Atlanta Convention and Visitors Bureau (2435 North Sheffield Avenue), Road Less Traveled (Recreational Trips & Guides; 2331 North Elston Avenue), Anita Dee Yacht Charters (Tours & Charters; 2000 North Racine Avenue).
8,762 married couples with children.
1,039 single-parent households (393 men, 646 women).
83.7% of residents of 60614 zip code speak English at home.
4.4% of residents speak Spanish at home (73% very well, 15% well, 11% not well, 2% not at all).
7.3% of residents speak other Indo-European language at home (87% very well, 9% well, 4% not well, 1% not at all).
3.0% of residents speak Asian or Pacific Island language at home (80% very well, 12% well, 8% not well, 1% not at all).
1.0% of residents speak other language at home (93% very well, 6% well, 1% not at all).
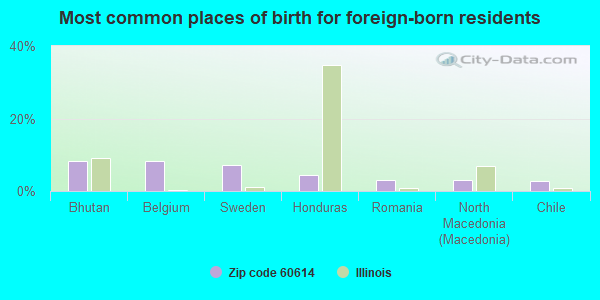
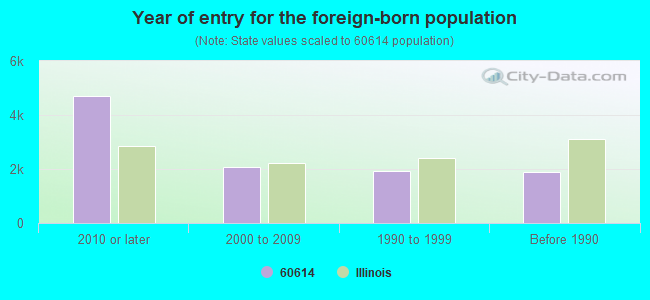
Foreign born population: 9,400 (13.3%) (48.0% of them are naturalized citizens)
Major facilities with environmental interests located in this zip code:
OZINGA CHICAGO RMC INC (2001 NORTH MENDELL STREET in CHICAGO, IL)
STATE MASTER (Illinois EPA Project) - AIR PROGRAM STATE MASTER (Illinois EPA Project) - SOLID WASTE PROGRAM, HAZARDOUS WASTE PROGRAM STATE MASTER (Illinois EPA Project) - National Pollutant Discharge Elimination System Permit AIR MINOR (AIRS/AFS) COMPLIANCE ACTIVITY (Tracking inspections of insecticide, fungicide, and rodenticide, and toxic substances) CRITERIA AND HAZARDOUS AIR POLLUTANT INVENTORY (Inventory of air pollution sources) National Pollutant Discharge Elimination System NON-MAJOR (Tracking pollutant discharge elimination systems) - permit HAZARDOUS WASTE BIENNIAL REPORTER (Resource Conservation and Recovery Act (tracking hazardous waste)) Large Quantity Generators, more that 1000 kg of hazardous waste/month (Resource Conservation and Recovery Act (tracking hazardous waste)) - notification TRI REPORTER (Tracking of toxic chemicals releasing facilities) Business SIC classification: READY-MIXED CONCRETE Business NAICS classification: READY-MIX CONCRETE MANUFACTURING. Organizations: OZINGA REDI-MIX PLANT (CONTACT/OPERATOR)
, OZINGA BROS., INC. (CONTACT/OWNER)
, OZINGA BROS, INC (CONTACT/OWNER)
Alternative names: OZINGA BROS., INC., OZINGA CHICAGO RMC - MENDELL, OZINGA CHICAGO RMG MENDELL, OZINGA REDI-MIX PALNT YARD 9, OZINGA REDIMIX PLANT YARD 9
ALCOTT (2625 N ORCHARD ST in CHICAGO, IL)
STATE MASTER (Illinois EPA Project) - HAZARDOUS WASTE PROGRAM (National Center for Education Statistics) - STATE ID-1501629902053 (Resource Conservation and Recovery Act (tracking hazardous waste)) Organizations: CITY OF CHICAGO SCHOOL DIST 299 (SCHOOL DISTRICT)
Alternative names: ALCOTT SCHOOL
HORWEEN LEATHER CO (2015 N. ELSTON AVE. in CHICAGO, IL)
STATE MASTER (Illinois EPA Project) - SOLID WASTE PROGRAM, HAZARDOUS WASTE PROGRAM, AIR PROGRAM AIR MAJOR (AIRS/AFS) CRITERIA AND HAZARDOUS AIR POLLUTANT INVENTORY (Inventory of air pollution sources) HAZARDOUS WASTE BIENNIAL REPORTER (Resource Conservation and Recovery Act (tracking hazardous waste)) Large Quantity Generators, more that 1000 kg of hazardous waste/month (Resource Conservation and Recovery Act (tracking hazardous waste)) TRANSPORTER (Resource Conservation and Recovery Act (tracking hazardous waste)) - notification TRI REPORTER (Tracking of toxic chemicals releasing facilities) Business SIC classification: LEATHER TANNING AND FINISHING Business NAICS classification: LEATHER AND HIDE TANNING AND FINISHING. Organizations: HORWEEN LEATHER CO INC (CONTACT/OPERATOR)
LINCOLN PARK HIGH SCHOOL (2001 N ORCHARD ST in CHICAGO, IL)
STATE MASTER (Illinois EPA Project) - SOLID WASTE PROGRAM, HAZARDOUS WASTE PROGRAM (Geographic Names Information System) (National Center for Education Statistics) - STATE ID-1501629900047 Conditionally Exempt Small Quantity Generators, less than 100 kg/month of hazardous waste (Resource Conservation and Recovery Act (tracking hazardous waste)) - notification Organizations: CHGO PUBLIC SCHOOLS (CONTACT/OWNER)
, CITY OF CHICAGO SCHOOL DIST 299 (SCHOOL DISTRICT)
LIBRA INDUSTRIES INC (1823 W WEBSTER AVE in CHICAGO, IL)
STATE MASTER (Illinois EPA Project) - SOLID WASTE PROGRAM, HAZARDOUS WASTE PROGRAM, AIR PROGRAM AIR MAJOR (AIRS/AFS) CRITERIA AND HAZARDOUS AIR POLLUTANT INVENTORY (Inventory of air pollution sources) HAZARDOUS WASTE BIENNIAL REPORTER (Resource Conservation and Recovery Act (tracking hazardous waste)) Large Quantity Generators, more that 1000 kg of hazardous waste/month (Resource Conservation and Recovery Act (tracking hazardous waste)) - notification Business SIC classification: DRYCLEANING PLANTS, EXCEPT RUG CLEANING Business NAICS classification: DRYCLEANING AND LAUNDRY SERVICES (EXCEPT COIN-OPERATED).
REICHHOLD CHEMICALS INC (2120 N ELSTON in CHICAGO, IL)
STATE MASTER (Illinois EPA Project) - AIR PROGRAM, HAZARDOUS WASTE PROGRAM, SOLID WASTE PROGRAM AIR MINOR (AIRS/AFS) Large Quantity Generators, more that 1000 kg of hazardous waste/month (Resource Conservation and Recovery Act (tracking hazardous waste)) TRI REPORTER (Tracking of toxic chemicals releasing facilities) Business SIC classification: PLASTICS MATERIALS, SYNTHETIC RESINS, AND NONVULCANIZABLE ELASTOMERS Organizations: EI DUPONT (CONTACT/OPERATOR)
Alternative names: FORMER REICHHOLD CHEMICALS INC
LASALLE (1734 N ORLEANS in CHICAGO, IL)
STATE MASTER (Illinois EPA Project) - HAZARDOUS WASTE PROGRAM (National Center for Education Statistics) - STATE ID-1501629902306 Small Quantity Generators, between 100 kg and 1000 kg of hazardous waste/month (Resource Conservation and Recovery Act (tracking hazardous waste)) - notification Organizations: CHICAGO PUBLIC SCHOOLS (CONTACT/OWNER)
, CITY OF CHICAGO SCHOOL DIST 299 (SCHOOL DISTRICT)
Alternative names: LASALLE LANGUAGE ACADEMY
CLYBOURN METAL FINISHING CO (2240 NORTH CLYBOURN AVENUE in CHICAGO, IL)
STATE MASTER (Illinois EPA Project) - AIR PROGRAM AIR SYNTHETIC MINOR (AIRS/AFS) CRITERIA AND HAZARDOUS AIR POLLUTANT INVENTORY (Inventory of air pollution sources) HAZARDOUS WASTE BIENNIAL REPORTER (Resource Conservation and Recovery Act (tracking hazardous waste)) Large Quantity Generators, more that 1000 kg of hazardous waste/month (Resource Conservation and Recovery Act (tracking hazardous waste)) - notification TRI REPORTER (Tracking of toxic chemicals releasing facilities) Business SIC and NAICS classification: ELECTROPLATING, PLATING, POLISHING, ANODIZING, AND COLORING Alternative names: GILBERTSON CLYBOURN INC
CHEMICAL SYSTEMS INC (1735 W FULLERTON AVE in CHICAGO, IL)
STATE MASTER (Illinois EPA Project) - AIR PROGRAM, HAZARDOUS WASTE PROGRAM AIR MINOR (AIRS/AFS) COMPLIANCE ACTIVITY (Tracking inspections of insecticide, fungicide, and rodenticide, and toxic substances) Large Quantity Generators, more that 1000 kg of hazardous waste/month (Resource Conservation and Recovery Act (tracking hazardous waste)) - notification TRI REPORTER (Tracking of toxic chemicals releasing facilities) Business SIC classification: SPECIALTY CLEANING, POLISHING, AND SANITATION PREPARATIONS; SURFACE ACTIVE AGENTS, FINISHING AGENTS, SULFONATED OILS, AND ASSISTANTS Organizations: CHEMICAL PROPERTIES INC (CONTACT/OWNER)
Alternative names: CHEMICAL PROPERTIES INC
GRIFFIN PLATING CO (2020 N. HOLLY AVENUE in CHICAGO, IL)
STATE MASTER (Illinois EPA Project) - SOLID WASTE PROGRAM, AIR PROGRAM, HAZARDOUS WASTE PROGRAM AIR MINOR (AIRS/AFS) CRITERIA AND HAZARDOUS AIR POLLUTANT INVENTORY (Inventory of air pollution sources) Large Quantity Generators, more that 1000 kg of hazardous waste/month (Resource Conservation and Recovery Act (tracking hazardous waste)) - notification Business SIC classification: ELECTROPLATING, PLATING, POLISHING, ANODIZING, AND COLORING Organizations: FRANCIS GRIFFIN (CONTACT/OWNER)
DE PAUL UNIVERSITY (2335 N CLIFTON in CHICAGO, IL)
STATE MASTER (Illinois EPA Project) - SOLID WASTE PROGRAM, HAZARDOUS WASTE PROGRAM Small Quantity Generators, between 100 kg and 1000 kg of hazardous waste/month (Resource Conservation and Recovery Act (tracking hazardous waste)) - notification - ICIS-, ENFORCEMENT/COMPLIANCE ACTIVITY
HOMACO INC (1875 W. FULLERTON AVE. in CHICAGO, IL)
STATE MASTER (Illinois EPA Project) - SOLID WASTE PROGRAM, HAZARDOUS WASTE PROGRAM, AIR PROGRAM AIR MINOR (AIRS/AFS) CRITERIA AND HAZARDOUS AIR POLLUTANT INVENTORY (Inventory of air pollution sources) Small Quantity Generators, between 100 kg and 1000 kg of hazardous waste/month (Resource Conservation and Recovery Act (tracking hazardous waste)) - notification TRI REPORTER (Tracking of toxic chemicals releasing facilities) Business SIC classification: FABRICATED METAL PRODUCTS; TELEPHONE AND TELEGRAPH APPARATUS Organizations: WILLIAM HOLCOMB (CONTACT/OWNER)
OSCAR F MAYER ELEMENTARY SCH (2250 N CLIFTON in CHICAGO, IL)
STATE MASTER (Illinois EPA Project) - SOLID WASTE PROGRAM (National Center for Education Statistics) - STATE ID-1501629902337 Organizations: CITY OF CHICAGO SCHOOL DIST 299 (SCHOOL DISTRICT)
Housing units lacking complete plumbing facilities: 0.9% Housing units lacking complete kitchen facilities: 0.9%
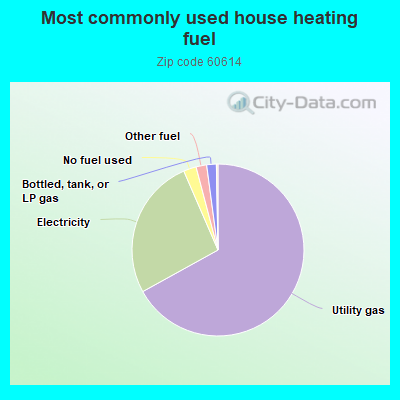
66.9%Utility gas
26.5%Electricity
2.4%No fuel used
2.0%Other fuel
1.8%Bottled, tank, or LP gas
Population in 1990: 61,350. Population change in the 1990s: +4,124 (+6.7%).
Place of birth for U.S.-born residents:
This state: 32,001
Northeast: 5,306
Midwest: 13,931
South: 5,288
West: 4,275
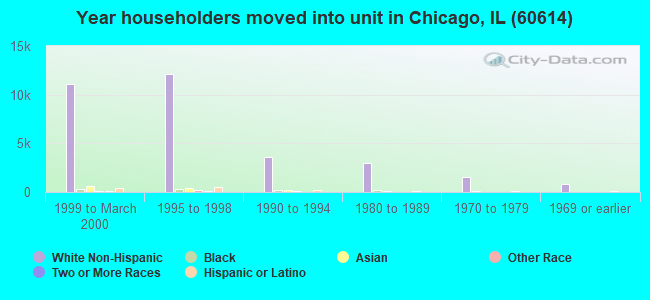
33% of the 60614 zip code residents lived in the same house 5 years ago. Out of people who lived in different houses, 51% lived in this county. Out of people who lived in different counties, 50% lived in Illinois.
77% of the 60614 zip code residents lived in the same house 1 year ago. Out of people who lived in different houses, 67% moved from this county. Out of people who lived in different houses, 5% moved from different county within same state. Out of people who lived in different houses, 22% moved from different state. Out of people who lived in different houses, 3% moved from abroad.
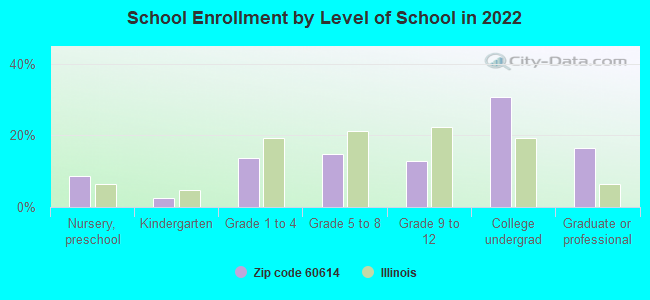
Private vs. public school enrollment:
Students in private schools in grades 1 to 8 (elementary and middle school): 2,657
Here:
57.9%
Illinois:
13.3%
Students in private schools in grades 9 to 12 (high school): 1,055
Here:
52.5%
Illinois:
9.9%
Students in private undergraduate colleges: 3,564
Here:
74.7%
Illinois:
27.4%
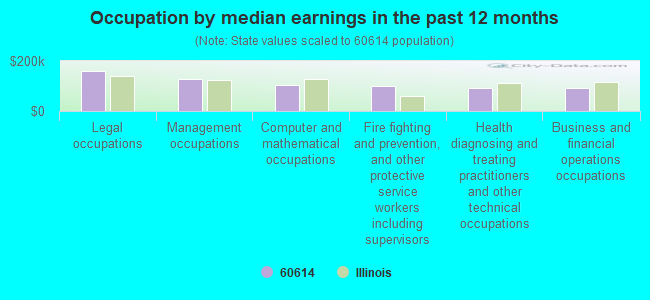
Occupation by median earnings in the past 12 months ($)
161,092Legal occupations
126,087Management occupations
104,896Computer and mathematical occupations
99,906Fire fighting and prevention, and other protective service workers including supervisors
93,556Health diagnosing and treating practitioners and other technical occupations
93,394Business and financial operations occupations
Companies with federal contracts located in this zip code (CHICAGO, IL):
A FINKL & SONS CO (2011 N SOUTHPORT AVE; small business) : $2,667,968 in 18 contractsfrom 2003 to 2006
Contracts for Guns, over 150 mm through 200 mm, Miscellaneous Weapons, Guns, 75 mm through 125 mm, Taps, Dies, and Collets; Hand and Machine, and moreby Army Signed by year:2000: $0; 2001: $0; 2002: $0; 2003: $721,062; 2004: $773,530; 2005: $1,150,581; 2006: $22,795.
Biggest contracts:
$649,250 with Army for Guns, over 150 mm through 200 mm. Signed on 2004-06-08. Completion date: 2004-10-16.
$643,125, same as above.Signed on 2005-05-19. Completion date: 2005-12-31.
$425,414, same as above.Signed on 2003-09-11. Completion date: 2004-04-23.
$285,520 with Army for Miscellaneous Weapons. Signed on 2005-03-22. Completion date: 2005-07-19.
COSMED USA INC (2211 N ELSTON RD STE 305; small business) : $837,752 in 20 contractsfrom 2001 to 2006
Contracts for Medical and Surgical Instruments, Equipment, and Supplies, Other Defense -- Applied Research and Exploratory Development (R&D), Laboratory Equipment and Supplies, Maintenance, Repair and Rebuilding of Equipment -- Miscellaneous, and moreby Department of Veterans Affairs, Army, Centers for Disease Control and Prevention Signed by year:2000: $0; 2001: $75,880; 2002: $251,000; 2003: $221,476; 2004: $72,140; 2005: $136,456; 2006: $80,800.
Biggest contracts:
$104,000 with Department of Veterans Affairs for Medical and Surgical Instruments, Equipment, and Supplies. Signed on 2002-09-15. Completion date: 2002-12-15.
$79,150 with Army for Other Defense -- Applied Research and Exploratory Development (R&D). Signed on 2005-09-23. Completion date: 2005-11-07.
$77,200 with Army for Laboratory Equipment and Supplies. Signed on 2003-08-14. Completion date: 2003-09-08.
$75,880, same as above.Signed on 2001-05-21. Completion date: 2001-06-25.
ADCOMMUNITY CO (2770 N LINCOLN SUITE B; small business) : $77,250 in 4 contractsin 2005
$38,050 with Army for Signs, Advertising Displays, and Identification Plates. Signed on 2005-09-22. Completion date: 2005-09-23.
$19,550 with Army for Advertising Services. Signed on 2005-01-18. Completion date: 2005-01-29.
$15,000, same as above.Signed on 2005-08-23. Completion date: 2006-08-31.
$4,650 with Army for Advertising Services. Taking place in MI. Signed on 2005-12-01. Completion date: 2006-02-01.
CRESCENZO COMMUNICATIONS (2739 N HAMPDEN CT # 2S) : $25,875 in 2 contractsin 2005
$20,000 with Army for Public Relations Services(includes writing services, event planning and management, media relations, radio and television analysis, and press services). Signed on 2005-02-03. Completion date: 2005-02-25.
$5,875 with NATIONAL ARCHIVES AND RECORDS ADMINISTRATION for ADP Software, Equipment, and Telecommunications Training. Taking place in CA. Signed on 2005-01-20. Completion date: 2005-01-30.
CHICAGO INTERFACE GROUP INC (858 WEST ARMITAGE # 286; small business) : $22,308 in 2 contractsin 2005
$12,208 with Defense Information Systems Agency for Other ADP and Telecommunications Services (includes data storage on tapes, compact disks, etc.). Taking place in PA. Signed on 2005-10-01. Completion date: 2006-09-30.
$10,100 with Department of Defense for ADP Facility Operation and Maintenance Services. Signed on 2005-02-03. Completion date: 2005-09-30.
PLIBRICO COMPANY (1800 N KINGSBURYST)
$10,200 with Navy for Maintenance, Repair or Alteration of Real Property -- Other Administrative Facilities and Service Buildings. Taking place in NE. Signed on 1999-11-19. Completion date: 1999-12-20.
CHICAGO PRVNCE OF THE SOC JSUS (2050 N CLARK ST; small business) : $8,099 in 8 contractsfrom 2002 to 2006
Contracts for Chaplain Services by Army Signed by year:2000: $0; 2001: $0; 2002: $1,499; 2003: $2,400; 2004: $1,200; 2005: $0; 2006: $3,000.
Biggest contracts:
$3,000 with Army for Chaplain Services. Taking place in WI. Signed on 2006-01-11. Completion date: 2006-09-30.
$1,499, same as above.Signed on 2002-12-01. Completion date: 2003-04-30.
$1,100, same as above.Signed on 2003-07-01. Completion date: 2003-09-30.
$900, same as above.Signed on 2003-10-01. Completion date: 2004-02-29.
STUART BRAINERD (612 W DEMING PL; small business)
$3,128 with Navy for ADP Software. Signed on 2004-08-20. Completion date: 2004-08-27.
MID AMERICA HOTEL CORP (644 W DIVERSEY PKWY; small business)
$633 with Army for Lodging - Hotel/Motel. Signed on 2006-05-17. Completion date: 2006-05-06.
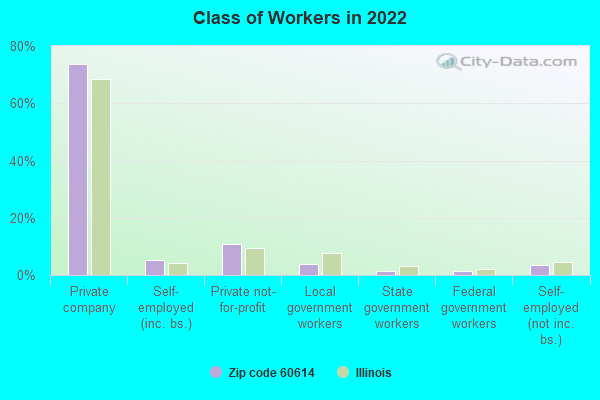
Top industries in this zip code by the number of employees in 2005:
Administrative and Support and Waste Management and Remediation Services: Office Administrative Services (500-999: 1, 5-9: 1, 1-4: 6)
Health Care and Social Assistance: Offices of Physicians (except Mental Health Specialists) (100-249: 1, 50-99: 1, 20-49: 3, 10-19: 6, 5-9: 14, 1-4: 50)
Health Care and Social Assistance: Nursing Care Facilities (100-249: 3, 50-99: 1, 20-49: 1, 1-4: 2)
People in group quarters in 2010:
2,714 people in college/university student housing
511 people in nursing facilities/skilled-nursing facilities
235 people in residential treatment centers for adults
126 people in other noninstitutional facilities
35 people in emergency and transitional shelters (with sleeping facilities) for people experiencing homelessness
12 people in workers' group living quarters and job corps centers
People in group quarters in 2000:
2,060 people in college dormitories (includes college quarters off campus)
671 people in nursing homes
252 people in other nonhousehold living situations
174 people in other noninstitutional group quarters
92 people in religious group quarters
61 people in other group homes
20 people in homes for the mentally ill
18 people in agriculture workers' dormitories on farms
11 people in mental (psychiatric) hospitals or wards
3 people in homes or halfway houses for drug/alcohol abuse
2 people in hospitals/wards and hospices for chronically ill
2 people in other hospitals or wards for chronically ill
Fatal accident statistics in 2014:
Fatal accident count: 1
Vehicles involved in fatal accidents: 3
Fatal accidents caused by drunken drivers: 1
Fatalities: 2
Persons involved in fatal accidents: 7
Pedestrians involved in fatal accidents: 0
Fatal accident statistics in 2013:
Fatal accident count: 1
Vehicles involved in fatal accidents: 4
Fatal accidents caused by drunken drivers: 0
Fatalities: 1
Persons involved in fatal accidents: 2
Pedestrians involved in fatal accidents: 0
Home Mortgage Disclosure Act Aggregated Statistics For Year 2009 (Based on 20 full and 12 partial tracts)
A) FHA, FSA/RHS & VA Home Purchase Loans
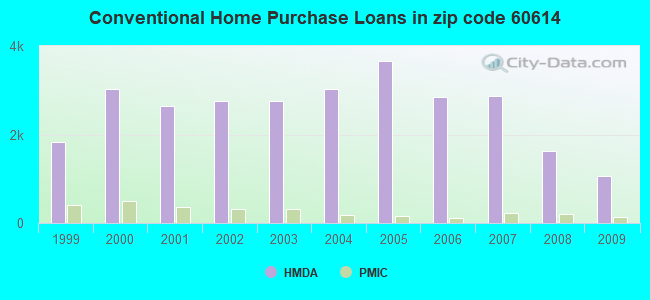
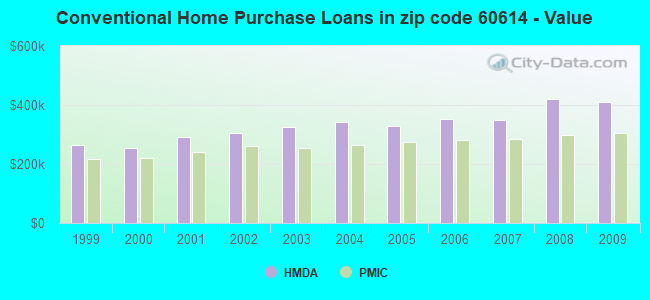
B) Conventional Home Purchase Loans
C) Refinancings
D) Home Improvement Loans
E) Loans on Dwellings For 5+ Families
F) Non-occupant Loans on < 5 Family Dwellings (A B C & D)
G) Loans On Manufactured Home Dwelling (A B C & D)
Number
Average Value
Number
Average Value
Number
Average Value
Number
Average Value
Number
Average Value
Number
Average Value
Number
Average Value
LOANS ORIGINATED
116
$283,298
1,069
$411,559
4,162
$360,497
33
$210,747
41
$1,022,330
401
$311,259
13
$368,116
APPLICATIONS APPROVED, NOT ACCEPTED
7
$290,059
97
$429,049
374
$381,421
2
$24,000
1
$574,000
27
$320,195
0
$0
APPLICATIONS DENIED
15
$345,171
147
$529,902
891
$450,784
12
$236,427
2
$679,320
129
$288,020
0
$0
APPLICATIONS WITHDRAWN
9
$323,880
83
$409,893
431
$354,359
8
$50,745
0
$0
42
$328,022
0
$0
FILES CLOSED FOR INCOMPLETENESS
4
$414,248
13
$612,738
161
$373,759
0
$0
0
$0
7
$280,706
0
$0
Aggregated Statistics For Year 2008 (Based on 20 full and 12 partial tracts)
A) FHA, FSA/RHS & VA Home Purchase Loans
B) Conventional Home Purchase Loans
C) Refinancings
D) Home Improvement Loans
E) Loans on Dwellings For 5+ Families
F) Non-occupant Loans on < 5 Family Dwellings (A B C & D)
G) Loans On Manufactured Home Dwelling (A B C & D)
Number
Average Value
Number
Average Value
Number
Average Value
Number
Average Value
Number
Average Value
Number
Average Value
Number
Average Value
LOANS ORIGINATED
41
$300,371
1,632
$421,283
2,677
$403,481
41
$255,403
72
$2,404,248
429
$359,409
0
$0
APPLICATIONS APPROVED, NOT ACCEPTED
4
$338,422
204
$484,071
321
$408,825
12
$284,907
8
$794,878
47
$282,384
0
$0
APPLICATIONS DENIED
4
$333,040
198
$533,996
492
$491,665
47
$125,982
3
$448,000
102
$343,085
0
$0
APPLICATIONS WITHDRAWN
8
$297,404
115
$511,661
280
$377,692
6
$239,437
3
$1,589,667
31
$291,369
1
$103,000
FILES CLOSED FOR INCOMPLETENESS
3
$212,993
32
$512,686
112
$429,912
5
$203,018
0
$0
19
$382,476
0
$0
Aggregated Statistics For Year 2007 (Based on 20 full and 12 partial tracts)
A) FHA, FSA/RHS & VA Home Purchase Loans
B) Conventional Home Purchase Loans
C) Refinancings
D) Home Improvement Loans
E) Loans on Dwellings For 5+ Families
F) Non-occupant Loans on < 5 Family Dwellings (A B C & D)
Number
Average Value
Number
Average Value
Number
Average Value
Number
Average Value
Number
Average Value
Number
Average Value
LOANS ORIGINATED
0
$0
2,870
$348,280
1,944
$438,607
109
$415,867
83
$2,171,662
594
$365,848
APPLICATIONS APPROVED, NOT ACCEPTED
0
$0
360
$367,753
276
$416,487
23
$208,612
2
$4,100,000
67
$371,558
APPLICATIONS DENIED
0
$0
301
$380,631
521
$446,043
52
$253,019
0
$0
120
$423,383
APPLICATIONS WITHDRAWN
2
$171,440
208
$373,626
190
$452,338
11
$165,327
0
$0
49
$353,429
FILES CLOSED FOR INCOMPLETENESS
0
$0
66
$414,507
74
$348,996
7
$258,714
0
$0
17
$397,399
Aggregated Statistics For Year 2006 (Based on 20 full and 12 partial tracts)
A) FHA, FSA/RHS & VA Home Purchase Loans
B) Conventional Home Purchase Loans
C) Refinancings
D) Home Improvement Loans
E) Loans on Dwellings For 5+ Families
F) Non-occupant Loans on < 5 Family Dwellings (A B C & D)
G) Loans On Manufactured Home Dwelling (A B C & D)
Number
Average Value
Number
Average Value
Number
Average Value
Number
Average Value
Number
Average Value
Number
Average Value
Number
Average Value
LOANS ORIGINATED
0
$0
2,855
$350,887
1,627
$419,289
124
$395,940
70
$2,144,786
578
$358,672
2
$25,000
APPLICATIONS APPROVED, NOT ACCEPTED
0
$0
331
$330,175
255
$419,689
17
$192,321
1
$2,100,000
68
$442,672
0
$0
APPLICATIONS DENIED
0
$0
380
$353,950
478
$440,194
30
$94,297
2
$869,750
114
$452,568
0
$0
APPLICATIONS WITHDRAWN
1
$417,000
260
$333,973
249
$406,363
11
$279,720
11
$904,108
85
$447,522
1
$250,000
FILES CLOSED FOR INCOMPLETENESS
0
$0
57
$283,754
98
$412,888
5
$82,862
0
$0
20
$366,432
0
$0
Aggregated Statistics For Year 2005 (Based on 20 full and 12 partial tracts)
A) FHA, FSA/RHS & VA Home Purchase Loans
B) Conventional Home Purchase Loans
C) Refinancings
D) Home Improvement Loans
E) Loans on Dwellings For 5+ Families
F) Non-occupant Loans on < 5 Family Dwellings (A B C & D)
G) Loans On Manufactured Home Dwelling (A B C & D)
Number
Average Value
Number
Average Value
Number
Average Value
Number
Average Value
Number
Average Value
Number
Average Value
Number
Average Value
LOANS ORIGINATED
7
$203,949
3,667
$329,086
1,847
$407,282
111
$295,022
87
$2,610,952
797
$319,687
2
$62,875
APPLICATIONS APPROVED, NOT ACCEPTED
1
$34,000
341
$368,087
221
$402,303
20
$331,454
4
$1,459,200
88
$345,954
0
$0
APPLICATIONS DENIED
0
$0
408
$327,695
507
$383,431
59
$170,992
2
$558,380
137
$285,363
1
$7,000
APPLICATIONS WITHDRAWN
2
$257,610
304
$377,862
280
$353,233
9
$460,920
2
$418,150
73
$279,622
0
$0
FILES CLOSED FOR INCOMPLETENESS
0
$0
87
$360,697
90
$446,537
11
$87,268
0
$0
12
$349,561
0
$0
Aggregated Statistics For Year 2004 (Based on 20 full and 12 partial tracts)
A) FHA, FSA/RHS & VA Home Purchase Loans
B) Conventional Home Purchase Loans
C) Refinancings
D) Home Improvement Loans
E) Loans on Dwellings For 5+ Families
F) Non-occupant Loans on < 5 Family Dwellings (A B C & D)
G) Loans On Manufactured Home Dwelling (A B C & D)
Number
Average Value
Number
Average Value
Number
Average Value
Number
Average Value
Number
Average Value
Number
Average Value
Number
Average Value
LOANS ORIGINATED
1
$217,360
3,033
$340,891
3,064
$374,637
99
$236,142
81
$1,827,408
684
$294,402
0
$0
APPLICATIONS APPROVED, NOT ACCEPTED
0
$0
299
$402,529
263
$338,173
29
$121,236
4
$1,331,795
54
$313,593
0
$0
APPLICATIONS DENIED
1
$223,910
305
$368,890
434
$366,130
73
$148,082
3
$666,667
107
$322,982
1
$136,000
APPLICATIONS WITHDRAWN
2
$182,000
240
$372,334
292
$424,035
18
$131,994
4
$738,248
43
$306,007
1
$26,000
FILES CLOSED FOR INCOMPLETENESS
0
$0
73
$346,546
137
$368,683
8
$74,178
0
$0
11
$265,452
0
$0
Aggregated Statistics For Year 2003 (Based on 20 full and 12 partial tracts)
A) FHA, FSA/RHS & VA Home Purchase Loans
B) Conventional Home Purchase Loans
C) Refinancings
D) Home Improvement Loans
E) Loans on Dwellings For 5+ Families
F) Non-occupant Loans on < 5 Family Dwellings (A B C & D)
Number
Average Value
Number
Average Value
Number
Average Value
Number
Average Value
Number
Average Value
Number
Average Value
LOANS ORIGINATED
2
$196,765
2,760
$325,835
8,159
$315,383
86
$116,627
155
$2,100,868
931
$261,985
APPLICATIONS APPROVED, NOT ACCEPTED
0
$0
170
$309,488
630
$307,357
15
$61,126
1
$443,890
67
$225,207
APPLICATIONS DENIED
0
$0
256
$310,752
838
$343,276
57
$102,277
0
$0
128
$265,661
APPLICATIONS WITHDRAWN
8
$191,775
195
$328,923
525
$300,829
21
$144,011
7
$692,714
58
$238,820
FILES CLOSED FOR INCOMPLETENESS
0
$0
74
$399,657
243
$342,765
6
$40,818
2
$267,990
36
$212,043
Aggregated Statistics For Year 2002 (Based on 20 full and 12 partial tracts)
A) FHA, FSA/RHS & VA Home Purchase Loans
B) Conventional Home Purchase Loans
C) Refinancings
D) Home Improvement Loans
E) Loans on Dwellings For 5+ Families
F) Non-occupant Loans on < 5 Family Dwellings (A B C & D)
Number
Average Value
Number
Average Value
Number
Average Value
Number
Average Value
Number
Average Value
Number
Average Value
LOANS ORIGINATED
14
$168,051
2,767
$306,486
6,994
$316,998
113
$86,983
134
$1,016,739
607
$262,985
APPLICATIONS APPROVED, NOT ACCEPTED
0
$0
216
$333,890
615
$310,548
27
$162,126
4
$787,400
61
$306,379
APPLICATIONS DENIED
0
$0
154
$288,825
483
$324,459
35
$101,293
5
$1,640,660
72
$190,406
APPLICATIONS WITHDRAWN
6
$157,873
171
$311,083
413
$311,774
21
$92,611
7
$1,003,680
58
$270,127
FILES CLOSED FOR INCOMPLETENESS
2
$63,765
64
$324,550
231
$329,211
2
$72,915
0
$0
33
$252,450
Aggregated Statistics For Year 2001 (Based on 20 full and 12 partial tracts)
A) FHA, FSA/RHS & VA Home Purchase Loans
B) Conventional Home Purchase Loans
C) Refinancings
D) Home Improvement Loans
E) Loans on Dwellings For 5+ Families
F) Non-occupant Loans on < 5 Family Dwellings (A B C & D)
Number
Average Value
Number
Average Value
Number
Average Value
Number
Average Value
Number
Average Value
Number
Average Value
LOANS ORIGINATED
16
$149,334
2,634
$291,175
5,131
$294,525
146
$83,523
96
$1,179,325
499
$266,136
APPLICATIONS APPROVED, NOT ACCEPTED
4
$124,910
184
$320,562
353
$260,373
40
$43,141
3
$580,113
42
$222,087
APPLICATIONS DENIED
6
$154,725
147
$303,540
454
$308,633
65
$67,361
9
$861,541
62
$152,597
APPLICATIONS WITHDRAWN
5
$212,786
162
$294,228
298
$271,652
25
$46,618
5
$4,318,016
39
$201,282
FILES CLOSED FOR INCOMPLETENESS
0
$0
53
$318,685
168
$300,740
14
$32,016
0
$0
11
$294,833
Aggregated Statistics For Year 2000 (Based on 20 full and 12 partial tracts)
A) FHA, FSA/RHS & VA Home Purchase Loans
B) Conventional Home Purchase Loans
C) Refinancings
D) Home Improvement Loans
E) Loans on Dwellings For 5+ Families
F) Non-occupant Loans on < 5 Family Dwellings (A B C & D)
Number
Average Value
Number
Average Value
Number
Average Value
Number
Average Value
Number
Average Value
Number
Average Value
LOANS ORIGINATED
22
$187,886
3,021
$255,581
993
$269,029
181
$68,353
69
$915,268
254
$217,274
APPLICATIONS APPROVED, NOT ACCEPTED
2
$78,610
229
$268,165
116
$290,811
63
$48,628
2
$600,000
30
$199,635
APPLICATIONS DENIED
3
$126,127
256
$254,787
244
$239,542
82
$59,063
3
$333,367
61
$225,981
APPLICATIONS WITHDRAWN
6
$70,002
191
$286,242
152
$211,195
40
$60,878
11
$2,991,708
24
$202,570
FILES CLOSED FOR INCOMPLETENESS
0
$0
49
$353,246
49
$283,895
10
$37,298
0
$0
11
$109,985
Aggregated Statistics For Year 1999 (Based on 15 full and 7 partial tracts)
A) FHA, FSA/RHS & VA Home Purchase Loans
B) Conventional Home Purchase Loans
C) Refinancings
D) Home Improvement Loans
E) Loans on Dwellings For 5+ Families
F) Non-occupant Loans on < 5 Family Dwellings (A B C & D)
2002 - 2018 National Fire Incident Reporting System (NFIRS) incidents
According to the data from the years 2002 - 2018 the average number of fires per year is 146. The highest number of fires - 238 took place in 2010, and the least - 0 in 2005. The data has a declining trend.
When looking into fire subcategories, the most incidents belonged to: Structure Fires (51.4%), and Outside Fires (22.2%).
Fire incident types reported to NFIRS in Zip Code 60614


 Nearest zip codes: 60657, 60642, 60610, 60654, 60613, 60622.
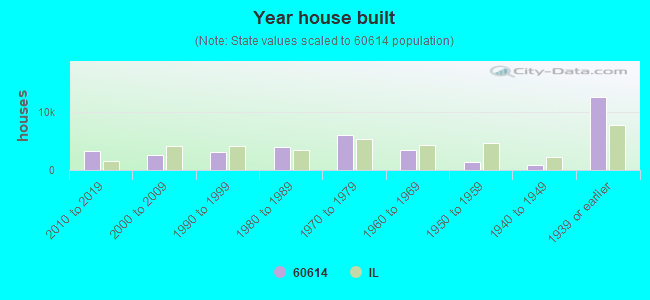


 According to the data from the years 2002 - 2018 the average number of fires per year is 146. The highest number of fires - 238 took place in 2010, and the least - 0 in 2005. The data has a declining trend.
 When looking into fire subcategories, the most incidents belonged to: Structure Fires (51.4%), and Outside Fires (22.2%).