Estimated zip code population in 2022: 49,444 Zip code population in 2010: 50,139 Zip code population in 2000: 59,251
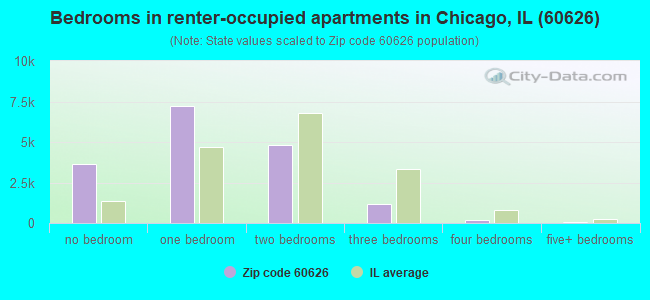
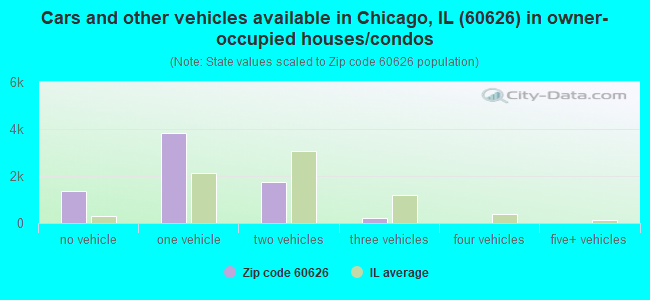
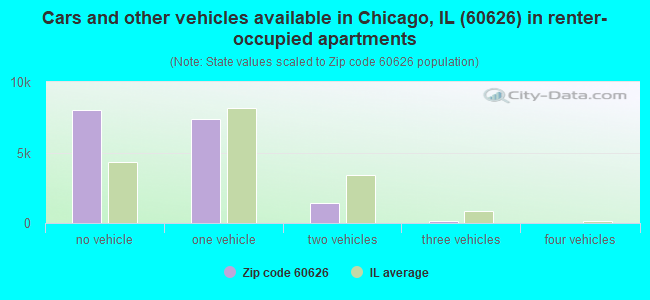
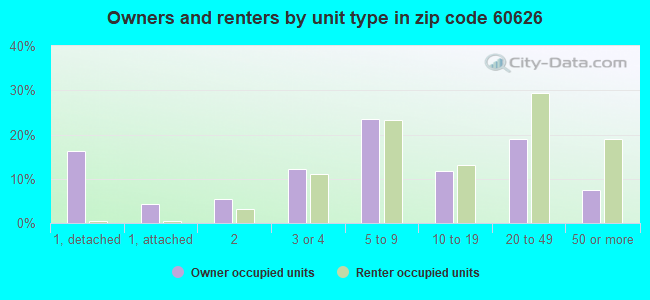
Houses and condos: 26,414 Renter-occupied apartments: 16,718
% of renters here:
71%
State:
33%
March 2022 cost of living index in zip code 60626: 102.3 (near average, U.S. average is 100)
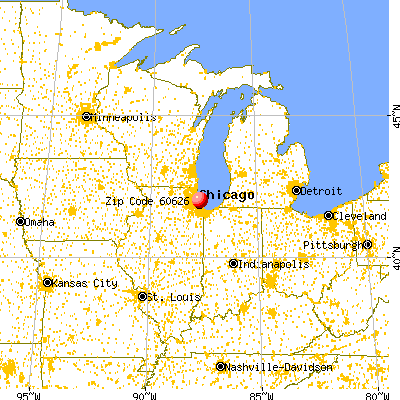
Land area: 1.7 sq. mi. Water area: 0.5 sq. mi.
Population density: 28,994 people per square mile
(very high).
OSM Map
General Map
Google Map
MSN Map
OSM Map
General Map
Google Map
MSN Map
OSM Map
General Map
Google Map
MSN Map
OSM Map
General Map
Google Map
MSN Map
Please wait while loading the map...
Real estate property taxes paid for housing units in 2022:
This zip code:
1.3% ($3,615)
Illinois:
2.0% ($4,912)
Median real estate property taxes paid for housing units with mortgages in 2022: $3,468 (1.3%) Median real estate property taxes paid for housing units with no mortgage in 2022: $4,618 (1.4%)
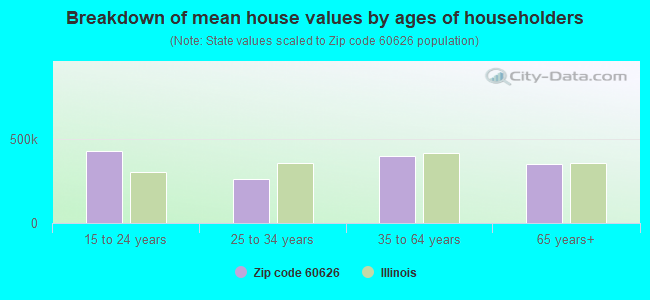
Estimated median house/condo value in 2022: $282,537
60626:
$282,537
Illinois:
$251,600
According to our research of Illinois and other state lists, there were 28 registered sex offenders living in 60626 zip code as of April 27, 2024. The ratio of all residents to sex offenders in zip code 60626 is 1,815 to 1. The ratio of registered sex offenders to all residents in this zip code is lower than the state average.
Median resident age:
This zip code:
36.1 years
Illinois median age:
39.1 years
Average household size:
This zip code:
1.9 people
Illinois:
2.4 people
Averages for the 2020 tax year for zip code 60626, filed in 2021:
Average Adjusted Gross Income (AGI) in 2020: $51,629 (Individual Income Tax Returns)
Here:
$51,629
State:
$82,626
Salary/wage: $47,920 (reported on 85.5% of returns)
Here:
$47,920
State:
$66,640
(% of AGI for various income ranges: 1136.2% for AGIs below $25k, 3791.9% for AGIs $25k-50k, 6987.6% for AGIs $50k-75k, 10561.1% for AGIs $75k-100k, 18351.6% for AGIs $100k-200k, 65448.9% for AGIs over 200k)
Taxable interest for individuals: $818 (reported on 17.9% of returns)
This zip code:
$818
Illinois:
$2,376
(% of AGI for various income ranges: 5.5% for AGIs below $25k, 7.9% for AGIs $25k-50k, 15.3% for AGIs $50k-75k, 23.6% for AGIs $75k-100k, 101.4% for AGIs $100k-200k, 377.2% for AGIs over 200k)
Ordinary dividends: $4,533 (reported on 14.1% of returns)
Here:
$4,533
State:
$9,061
(% of AGI for various income ranges: 14.0% for AGIs below $25k, 20.3% for AGIs $25k-50k, 51.6% for AGIs $50k-75k, 98.4% for AGIs $75k-100k, 259.6% for AGIs $100k-200k, 3814.4% for AGIs over 200k)
Net capital gain/loss in AGI: +$12,287 (reported on 13.3% of returns)
Here:
+$12,287
State:
+$31,684
(% of AGI for various income ranges: 11.9% for AGIs below $25k, 26.3% for AGIs $25k-50k, 72.1% for AGIs $50k-75k, 123.2% for AGIs $75k-100k, 377.9% for AGIs $100k-200k, 14926.7% for AGIs over 200k)
Profit/loss from business: +$8,092 (reported on 22.8% of returns)
Here:
+$8,092
State:
+$12,175
(% of AGI for various income ranges: 201.7% for AGIs below $25k, 151.9% for AGIs $25k-50k, 164.7% for AGIs $50k-75k, 323.4% for AGIs $75k-100k, 579.7% for AGIs $100k-200k, 3599.4% for AGIs over 200k)
Taxable individual retirement arrangement distribution: $16,549 (reported on 3.8% of returns)
60626:
$16,549
Illinois:
$21,613
(% of AGI for various income ranges: 22.0% for AGIs below $25k, 26.7% for AGIs $25k-50k, 72.9% for AGIs $50k-75k, 159.0% for AGIs $75k-100k, 357.7% for AGIs $100k-200k, 1802.8% for AGIs over 200k)
Self-employed (Keogh) retirement plans: $19,225 (reported on 0.4% of returns)
60626:
$19,225
Illinois:
$30,962
(% of AGI for various income ranges: 4.0% for AGIs $25k-50k, 28.9% for AGIs $100k-200k, 544.4% for AGIs over 200k)
Total itemized deductions: $26,128 (reported on 6.5% of returns)
Here:
$26,128
State:
$34,948
(% of AGI for various income ranges: 37.6% for AGIs below $25k, 84.5% for AGIs $25k-50k, 234.9% for AGIs $50k-75k, 428.1% for AGIs $75k-100k, 1011.8% for AGIs $100k-200k, 4419.4% for AGIs over 200k)
Charity contributions: $7,130 (reported on 5.1% of returns)
Here:
$7,130
State:
$13,122
(% of AGI for various income ranges: 2.8% for AGIs below $25k, 10.7% for AGIs $25k-50k, 40.9% for AGIs $50k-75k, 76.4% for AGIs $75k-100k, 215.8% for AGIs $100k-200k, 1652.2% for AGIs over 200k)
Taxes paid: $7,381 (reported on 6.5% of returns)
60626:
$7,381
State:
$8,563
(% of AGI for various income ranges: 6.6% for AGIs below $25k, 14.8% for AGIs $25k-50k, 63.7% for AGIs $50k-75k, 155.9% for AGIs $75k-100k, 338.7% for AGIs $100k-200k, 1119.4% for AGIs over 200k)
Earned income credit: $1,852 (reported on 16.1% of returns)
Here:
$1,852
State:
$2,311
(% of AGI for various income ranges: 75.4% for AGIs below $25k, 42.1% for AGIs $25k-50k, 0.4% for AGIs $50k-75k)
Percentage of individuals using paid preparers for their 2020 taxes: 92.3%
Here:
92%
State:
93%
(% for various income ranges: 90.3% for AGIs below $25k, 93.4% for AGIs $25k-50k, 93.0% for AGIs $50k-75k, 93.2% for AGIs $75k-100k, 93.8% for AGIs $100k-200k, 94.0% for AGIs over 200k)
Averages for the 2012 tax year for zip code 60626, filed in 2013:
Average Adjusted Gross Income (AGI) in 2012: $40,875 (Individual Income Tax Returns)
Here:
$40,875
State:
$68,058
Salary/wage: $39,378 (reported on 88.5% of returns)
Here:
$39,378
State:
$55,396
(% of AGI for various income ranges: 82.7% for AGIs below $25k, 91.0% for AGIs $25k-50k, 90.2% for AGIs $50k-75k, 87.7% for AGIs $75k-100k, 82.9% for AGIs $100k-200k, 65.4% for AGIs over 200k)
Taxable interest for individuals: $666 (reported on 19.6% of returns)
This zip code:
$666
Illinois:
$1,969
(% of AGI for various income ranges: 0.4% for AGIs below $25k, 0.2% for AGIs $25k-50k, 0.2% for AGIs $50k-75k, 0.4% for AGIs $75k-100k, 0.4% for AGIs $100k-200k, 0.3% for AGIs over 200k)
Ordinary dividends: $3,037 (reported on 12.2% of returns)
Here:
$3,037
State:
$7,786
(% of AGI for various income ranges: 0.7% for AGIs below $25k, 0.5% for AGIs $25k-50k, 0.7% for AGIs $50k-75k, 0.8% for AGIs $75k-100k, 1.2% for AGIs $100k-200k, 2.3% for AGIs over 200k)
Net capital gain/loss in AGI: +$3,910 (reported on 9.1% of returns)
Here:
+$3,910
State:
+$22,183
(% of AGI for various income ranges: 0.2% for AGIs $50k-75k, 0.3% for AGIs $75k-100k, 1.2% for AGIs $100k-200k, 5.7% for AGIs over 200k)
Profit/loss from business: +$8,917 (reported on 19.1% of returns)
Here:
+$8,917
State:
+$12,903
(% of AGI for various income ranges: 11.5% for AGIs below $25k, 3.3% for AGIs $25k-50k, 2.5% for AGIs $50k-75k, 2.3% for AGIs $75k-100k, 3.2% for AGIs $100k-200k, 3.4% for AGIs over 200k)
Taxable individual retirement arrangement distribution: $13,702 (reported on 4.2% of returns)
60626:
$13,702
Illinois:
$17,929
(% of AGI for various income ranges: 1.0% for AGIs below $25k, 1.1% for AGIs $25k-50k, 1.2% for AGIs $50k-75k, 1.7% for AGIs $75k-100k, 1.9% for AGIs $100k-200k, 1.8% for AGIs over 200k)
Self-employment retirement plans: $12,860 (reported on 0.4% of returns)
60626:
$12,860
Illinois:
$24,666
(% of AGI for various income ranges: 0.1% for AGIs $25k-50k, 0.3% for AGIs $100k-200k, 0.5% for AGIs over 200k)
Total itemized deductions: $18,966 (22% of AGI, reported on 21.8% of returns)
Here:
$18,966
State:
$26,433
Here:
21.7% of AGI
State:
19.2% of AGI
(% of AGI for various income ranges: 3.9% for AGIs below $25k, 6.4% for AGIs $25k-50k, 11.2% for AGIs $50k-75k, 13.6% for AGIs $75k-100k, 14.9% for AGIs $100k-200k, 12.4% for AGIs over 200k)
Charity contributions: $2,729 (reported on 16.7% of returns)
Here:
$2,729
State:
$4,525
(% of AGI for various income ranges: 0.2% for AGIs below $25k, 0.6% for AGIs $25k-50k, 1.1% for AGIs $50k-75k, 1.3% for AGIs $75k-100k, 1.7% for AGIs $100k-200k, 2.3% for AGIs over 200k)
Taxes paid: $7,331 (reported on 21.5% of returns)
60626:
$7,331
State:
$11,968
(% of AGI for various income ranges: 0.9% for AGIs below $25k, 2.2% for AGIs $25k-50k, 3.8% for AGIs $50k-75k, 5.1% for AGIs $75k-100k, 6.3% for AGIs $100k-200k, 6.1% for AGIs over 200k)
Earned income credit: $2,017 (reported on 21.2% of returns)
Here:
$2,017
State:
$2,349
(% of AGI for various income ranges: 6.0% for AGIs below $25k, 0.7% for AGIs $25k-50k)
Percentage of individuals using paid preparers for their 2012 taxes: 49.3%
Here:
49%
State:
57%
(% for various income ranges: 51.6% for AGIs below $25k, 47.5% for AGIs $25k-50k, 44.1% for AGIs $50k-75k, 47.1% for AGIs $75k-100k, 49.7% for AGIs $100k-200k, 65.4% for AGIs over 200k)
Averages for the 2004 tax year for zip code 60626, filed in 2005:
Average Adjusted Gross Income (AGI) in 2004: $34,090 (Individual Income Tax Returns)
Here:
$34,090
State:
$54,625
Salary/wage: $33,259 (reported on 89.4% of returns)
Here:
$33,259
State:
$46,811
(% of AGI for various income ranges: 110.5% for AGIs below $10k, 87.8% for AGIs $10k-25k, 93.1% for AGIs $25k-50k, 91.8% for AGIs $50k-75k, 87.5% for AGIs $75k-100k, 70.8% for AGIs over 100k)
Taxable interest for individuals: $1,054 (reported on 29.1% of returns)
This zip code:
$1,054
Illinois:
$2,101
(% of AGI for various income ranges: 3.2% for AGIs below $10k, 0.8% for AGIs $10k-25k, 0.7% for AGIs $25k-50k, 0.6% for AGIs $50k-75k, 0.7% for AGIs $75k-100k, 1.5% for AGIs over 100k)
Taxable dividends: $1,879 (reported on 13.9% of returns)
Here:
$1,879
State:
$4,306
(% of AGI for various income ranges: 2.3% for AGIs below $10k, 0.6% for AGIs $10k-25k, 0.5% for AGIs $25k-50k, 0.5% for AGIs $50k-75k, 1.0% for AGIs $75k-100k, 1.3% for AGIs over 100k)
Net capital gain/loss: +$6,849 (reported on 10.4% of returns)
Here:
+$6,849
State:
+$17,321
(% of AGI for various income ranges: -2.0% for AGIs below $10k, 0.2% for AGIs $10k-25k, 0.2% for AGIs $25k-50k, 0.4% for AGIs $50k-75k, 1.3% for AGIs $75k-100k, 8.9% for AGIs over 100k)
Profit/loss from business: +$7,611 (reported on 17.3% of returns)
Here:
+$7,611
State:
+$11,771
(% of AGI for various income ranges: 25.9% for AGIs below $10k, 6.9% for AGIs $10k-25k, 1.9% for AGIs $25k-50k, 2.4% for AGIs $50k-75k, 3.4% for AGIs $75k-100k, 3.8% for AGIs over 100k)
IRA payment deduction: $2,499 (reported on 2.2% of returns)
60626:
$2,499
Illinois:
$3,087
(% of AGI for various income ranges: 0.2% for AGIs below $10k, 0.2% for AGIs $10k-25k, 0.2% for AGIs $25k-50k, 0.1% for AGIs $50k-75k, 0.1% for AGIs $75k-100k, 0.1% for AGIs over 100k)
Self-employed pension: $7,318 (reported on 0.7% of returns)
Here:
$7,318
Illinois:
$16,965
(% of AGI for various income ranges: 0.0% for AGIs $10k-25k, 0.0% for AGIs $25k-50k, 0.1% for AGIs $50k-75k, 0.2% for AGIs $75k-100k, 0.4% for AGIs over 100k)
Total itemized deductions: $15,711 (23% of AGI, reported on 22.5% of returns)
Here:
$15,711
State:
$20,239
Here:
23.0% of AGI
State:
19.5% of AGI
(% of AGI for various income ranges: 8.8% for AGIs below $10k, 4.9% for AGIs $10k-25k, 9.3% for AGIs $25k-50k, 12.8% for AGIs $50k-75k, 13.3% for AGIs $75k-100k, 12.6% for AGIs over 100k)
Charity contributions deductions: $2,477 (3% of AGI, reported on 18.6% of returns)
Here:
$2,477
State:
$3,719
Here:
3.4% of AGI
State:
3.4% of AGI
(% of AGI for various income ranges: 0.4% for AGIs below $10k, 0.5% for AGIs $10k-25k, 1.1% for AGIs $25k-50k, 1.6% for AGIs $50k-75k, 1.6% for AGIs $75k-100k, 2.2% for AGIs over 100k)
Total tax: $5,128 (reported on 71.0% of returns)
60626:
$5,128
State:
$9,882
(% of AGI for various income ranges: 5.4% for AGIs below $10k, 4.1% for AGIs $10k-25k, 7.6% for AGIs $25k-50k, 11.6% for AGIs $50k-75k, 13.3% for AGIs $75k-100k, 18.5% for AGIs over 100k)
Earned income credit: $1,773 (reported on 24.2% of returns)
Here:
$1,773
State:
$1,788
Percentage of individuals using paid preparers for their 2004 taxes: 57.9%
Here:
58%
State:
61%
(% for various income ranges: 59.6% for AGIs below $10k, 64.9% for AGIs $10k-25k, 53.6% for AGIs $25k-50k, 49.1% for AGIs $50k-75k, 50.2% for AGIs $75k-100k, 60.9% for AGIs over 100k)
Likely homosexual households (counted as self-reported same-sex unmarried-partner households)
Lesbian couples: 0.4% of all households
Gay men: 1.2% of all households
Household received Food Stamps/SNAP in the past 12 months: 4,364 Household did not receive Food Stamps/SNAP in the past 12 months: 19,621
Women who had a birth in the past 12 months: 628 (555 now married, 71 unmarried) Women who did not have a birth in the past 12 months: 14,923 (3,664 now married, 11,340 unmarried)
Housing units in zip code 60626 with a mortgage: 5,230 (263 second mortgage, 196 both second mortgage and home equity loan) Houses without a mortgage: 131
Median monthly owner costs for units with a mortgage: $1,779 Median monthly owner costs for units without a mortgage: $804
Residents with income below the poverty level in 2022:
This zip code:
19.7%
Whole state:
11.9%
Residents with income below 50% of the poverty level in 2022:
This zip code:
11.1%
Whole state:
5.7%
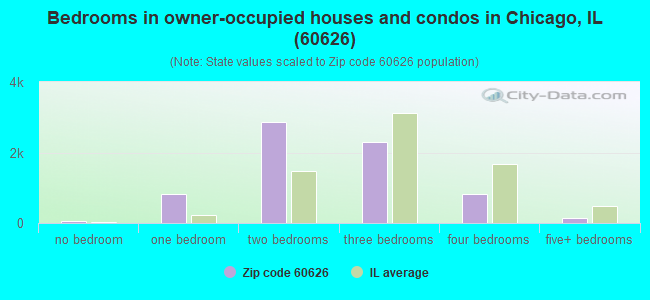
Median number of rooms in houses and condos:
Here:
5.3
State:
6.4
Median number of rooms in apartments:
Here:
3.4
State:
4.1
Notable locations in this zip code not listed on our city pages
Notable locations in zip code 60626: Chicago Fire Department District 2 Station 102 (A), Stebler Hall (B), Wisdom Bridge Theatre (C), Campion Hall (D), Chamberlain Hall (E), Dumbach Hall (F), Elizabeth Cudahy Memorial Library (G), Cudahy Memorial Library (H), Kirchbaum Building (I), Mertz Hall (J), Michael Cudahy Science (K), Chicago Engine Company 102 (L), Saint Ignatius Auditorium (M). Display/hide their locations on the map
Churches in zip code 60626 include: Assyrian Pentecostal Church (A), Cornerstone Bible Church (B), Korean United Presbyterian Church (C), Madonna della Strada Chapel (D), Rogers Park Lutheran Church (E), Rogers Park Presbyterian Church (F), Saint Ignatius Roman Catholic Church (G), Saint Jerome Roman Catholic Church (H), Saint Pauls Church by the Lake (I). Display/hide their locations on the map
Parks in zip code 60626 include: Paschen Park (1), Leone Park (2), Pottawattomie Park (3), Rogers Park (4), Schreiber Park (5), Lazarus Park (6), Langdon Park (7), Goldberg Park (8), Jarvis Beach Park (9). Display/hide their locations on the map
Tourist attraction (not listed on the city page) : Airport Express Shuttle (Tours & Charters; 7301 N Sheridan Road Suite 903).
4,480 married couples with children.
2,425 single-parent households (837 men, 1,588 women).
65.9% of residents of 60626 zip code speak English at home.
16.3% of residents speak Spanish at home (54% very well, 23% well, 17% not well, 6% not at all).
8.9% of residents speak other Indo-European language at home (64% very well, 25% well, 9% not well, 2% not at all).
2.2% of residents speak Asian or Pacific Island language at home (58% very well, 23% well, 17% not well, 2% not at all).
6.7% of residents speak other language at home (72% very well, 19% well, 4% not well, 5% not at all).
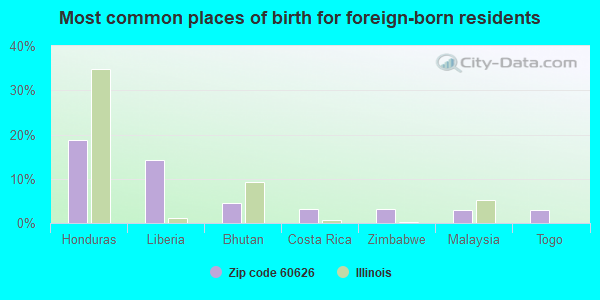
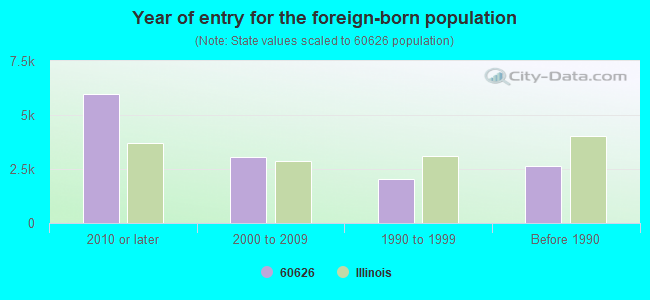
Foreign born population: 12,109 (24.5%) (42.1% of them are naturalized citizens)
Major facilities with environmental interests located in this zip code:
KIM S CLEANERS (7630 N ROGERS in CHICAGO, IL)
STATE MASTER (Illinois EPA Project) - AIR PROGRAM, HAZARDOUS WASTE PROGRAM STATE MASTER (Illinois EPA Project) - AIR PROGRAM AIR MINOR (AIRS/AFS) Business SIC classification: DRYCLEANING PLANTS, EXCEPT RUG CLEANING Alternative names: KIM'S CLEANERS
ORGANICS LLC (1724 GREENLEAF AVE in CHICAGO, IL)
STATE MASTER (Illinois EPA Project) - SOLID WASTE PROGRAM, HAZARDOUS WASTE PROGRAM, AIR PROGRAM AIR MINOR (AIRS/AFS) CRITERIA AND HAZARDOUS AIR POLLUTANT INVENTORY (Inventory of air pollution sources) HAZARDOUS WASTE BIENNIAL REPORTER (Resource Conservation and Recovery Act (tracking hazardous waste)) Large Quantity Generators, more that 1000 kg of hazardous waste/month (Resource Conservation and Recovery Act (tracking hazardous waste)) TRI REPORTER (Tracking of toxic chemicals releasing facilities) Business SIC classification: PHARMACEUTICAL PREPARATIONS Business NAICS classification: PHARMACEUTICAL PREPARATION MANUFACTURING.; PHARMACEUTICAL PREPARATION MANUFACTURING. Alternative names: ORGANICS INC, ORGANICS/LAGRANGE INC.
S & C ELECTRIC CO (6601 N. RIDGE BLVD. in CHICAGO, IL)
STATE MASTER (Illinois EPA Project) - AIR PROGRAM, HAZARDOUS WASTE PROGRAM, SOLID WASTE PROGRAM AIR MAJOR (AIRS/AFS) COMPLIANCE ACTIVITY (Tracking inspections of insecticide, fungicide, and rodenticide, and toxic substances) CRITERIA AND HAZARDOUS AIR POLLUTANT INVENTORY (Inventory of air pollution sources) HAZARDOUS WASTE BIENNIAL REPORTER (Resource Conservation and Recovery Act (tracking hazardous waste)) Large Quantity Generators, more that 1000 kg of hazardous waste/month (Resource Conservation and Recovery Act (tracking hazardous waste)) - notification TRI REPORTER (Tracking of toxic chemicals releasing facilities) Business SIC and NAICS classification: SWITCHGEAR AND SWITCHBOARD APPARATUS
KILMER (6700 N GREENVIEW in CHICAGO, IL)
STATE MASTER (Illinois EPA Project) - HAZARDOUS WASTE PROGRAM (National Center for Education Statistics) - STATE ID-1501629902296 Conditionally Exempt Small Quantity Generators, less than 100 kg/month of hazardous waste (Resource Conservation and Recovery Act (tracking hazardous waste)) - notification TRANSPORTER (Resource Conservation and Recovery Act (tracking hazardous waste)) - notification Organizations: CHICAGO PUBLIC SCHOOLS (CONTACT/OWNER)
, CITY OF CHICAGO SCHOOL DIST 299 (SCHOOL DISTRICT)
Alternative names: KILMER JOYCE SCHOOL
LOYOLA UNIVERSITY CHICAGO (6525 NORTH SHERIDAN ROAD in CHICAGO, IL)
STATE MASTER (Illinois EPA Project) - SOLID WASTE PROGRAM, HAZARDOUS WASTE PROGRAM, AIR PROGRAM AIR MINOR (AIRS/AFS) COMPLIANCE ACTIVITY (Tracking inspections of insecticide, fungicide, and rodenticide, and toxic substances) CRITERIA AND HAZARDOUS AIR POLLUTANT INVENTORY (Inventory of air pollution sources) HAZARDOUS WASTE BIENNIAL REPORTER (Resource Conservation and Recovery Act (tracking hazardous waste)) Small Quantity Generators, between 100 kg and 1000 kg of hazardous waste/month (Resource Conservation and Recovery Act (tracking hazardous waste)) Business SIC classification: COLLEGES, UNIVERSITIES, AND PROFESSIONAL SCHOOLS; LIBRARIES Business NAICS classification: COLLEGES, UNIVERSITIES, AND PROFESSIONAL SCHOOLS. Organizations: LOYOLA UNIVERSITY OF CHICAGO (CONTACT/OWNER)
Alternative names: LOYOLA UNIV. CHGO-LAKE SH0RE CAMPUS, LOYOLA UNIVERSITY CHICAGO LAKE SHORE CAM, LOYOLA UNIVERSITY CHICAGO LAKE SHORE CAMPUS, LOYOLA UNIVERSITY, LAKE SHORE CAMPUS, LOYOLA UNIVERSITY OF CHICAGO
DA DOR INC (1529 W HOWARD in CHICAGO, IL)
STATE MASTER (Illinois EPA Project) - SOLID WASTE PROGRAM, AIR PROGRAM, HAZARDOUS WASTE PROGRAM AIR SYNTHETIC MINOR (AIRS/AFS) CRITERIA AND HAZARDOUS AIR POLLUTANT INVENTORY (Inventory of air pollution sources) Small Quantity Generators, between 100 kg and 1000 kg of hazardous waste/month (Resource Conservation and Recovery Act (tracking hazardous waste)) Business SIC classification: DRYCLEANING PLANTS, EXCEPT RUG CLEANING Business NAICS classification: DRYCLEANING AND LAUNDRY SERVICES (EXCEPT COIN-OPERATED). Organizations: DADOR INC (CONTACT/OWNER)
Alternative names: DADOR INC, NORTOWN CLEANERS
CHICAGO PARK DIST (1222 E TOUHY in CHICAGO, IL)
STATE MASTER (Illinois EPA Project) - HAZARDOUS WASTE PROGRAM Large Quantity Generators, more that 1000 kg of hazardous waste/month (Resource Conservation and Recovery Act (tracking hazardous waste)) - notification Organizations: CHICAGO PARK DISTRICT (CONTACT/OWNER)
Alternative names: CHICAGO PARK DIST LEONE PK
CHICAGO TRANSIT AUTHORITY (7750 N HASKINS in CHICAGO, IL)
STATE MASTER (Illinois EPA Project) - SOLID WASTE PROGRAM, HAZARDOUS WASTE PROGRAM Large Quantity Generators, more that 1000 kg of hazardous waste/month (Resource Conservation and Recovery Act (tracking hazardous waste)) - notification
LAWNDALE DAY CARE CENTER (2929 W 19TH ST in CHICAGO, IL)
STATE MASTER (Illinois EPA Project) - AIR PROGRAM AIR MINOR (AIRS/AFS) CRITERIA AND HAZARDOUS AIR POLLUTANT INVENTORY (Inventory of air pollution sources) Business SIC classification: RETAIL NURSERIES, LAWN AND GARDEN SUPPLY STORES
LERNER NEWSPAPERS INC (7519 N ASHLAND AVE in CHICAGO, IL)
STATE MASTER (Illinois EPA Project) - HAZARDOUS WASTE PROGRAM Large Quantity Generators, more that 1000 kg of hazardous waste/month (Resource Conservation and Recovery Act (tracking hazardous waste)) - notification Organizations: LERNER NEWSPAPER INC (CONTACT/OWNER)
CHRISTIANA IND CORP (6500 N CLARK ST in CHICAGO, IL)
STATE MASTER (Illinois EPA Project) - SOLID WASTE PROGRAM, HAZARDOUS WASTE PROGRAM (Resource Conservation and Recovery Act (tracking hazardous waste))
AMERICAN CRUSHING CO (1755-71 W. HOWARD ST. in CHICAGO, IL)
STATE MASTER (Illinois EPA Project) - AIR PROGRAM AIR MINOR (AIRS/AFS) Business SIC classification: NONCLASSIFIABLE ESTABLISHMENTS
MEAD REALTY INC - APARTMENT BUILDING (1205 W SHERWIN AVE in CHICAGO, IL)
STATE MASTER (Illinois EPA Project) - AIR PROGRAM AIR MINOR (AIRS/AFS) Business SIC classification: NATIONAL COMMERCIAL BANKS
Housing units lacking complete plumbing facilities: 0.3% Housing units lacking complete kitchen facilities: 0.9%
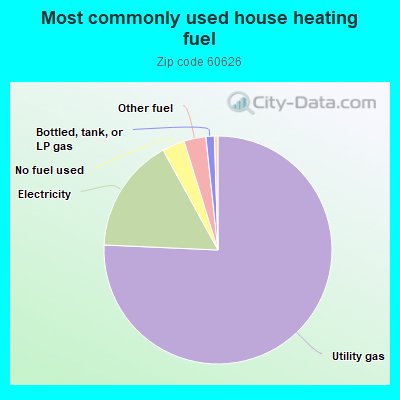
75.7%Utility gas
16.3%Electricity
3.2%No fuel used
3.1%Other fuel
1.2%Bottled, tank, or LP gas
Population in 1990: 57,320. Population change in the 1990s: +1,931 (+3.4%).
Place of birth for U.S.-born residents:
This state: 23,074
Northeast: 2,149
Midwest: 5,573
South: 3,304
West: 2,325
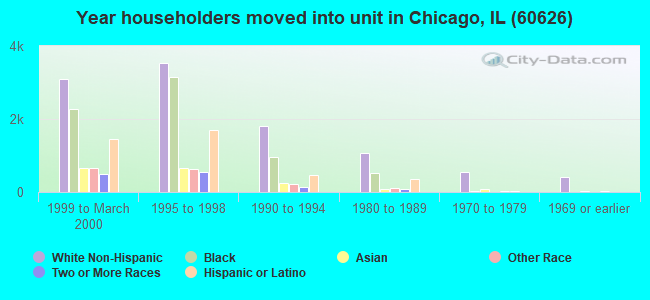
41% of the 60626 zip code residents lived in the same house 5 years ago. Out of people who lived in different houses, 78% lived in this county. Out of people who lived in different counties, 50% lived in Illinois.
82% of the 60626 zip code residents lived in the same house 1 year ago. Out of people who lived in different houses, 71% moved from this county. Out of people who lived in different houses, 6% moved from different county within same state. Out of people who lived in different houses, 17% moved from different state. Out of people who lived in different houses, 3% moved from abroad.
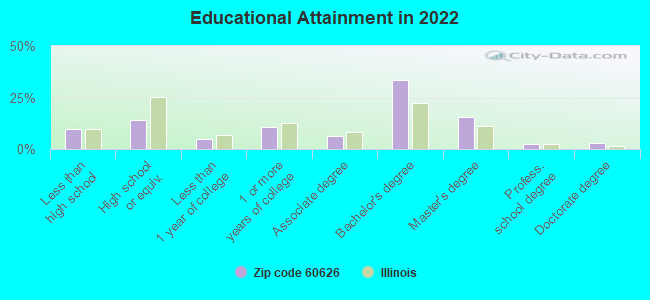
Private vs. public school enrollment:
Students in private schools in grades 1 to 8 (elementary and middle school): 265
Here:
9.2%
Illinois:
13.3%
Students in private schools in grades 9 to 12 (high school): 111
Here:
6.7%
Illinois:
9.9%
Students in private undergraduate colleges: 3,363
Here:
73.1%
Illinois:
27.4%
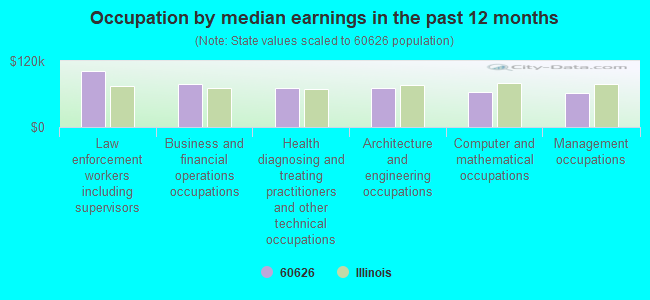
Occupation by median earnings in the past 12 months ($)
101,395Law enforcement workers including supervisors
78,729Business and financial operations occupations
71,354Health diagnosing and treating practitioners and other technical occupations
70,260Architecture and engineering occupations
64,182Computer and mathematical occupations
61,367Management occupations
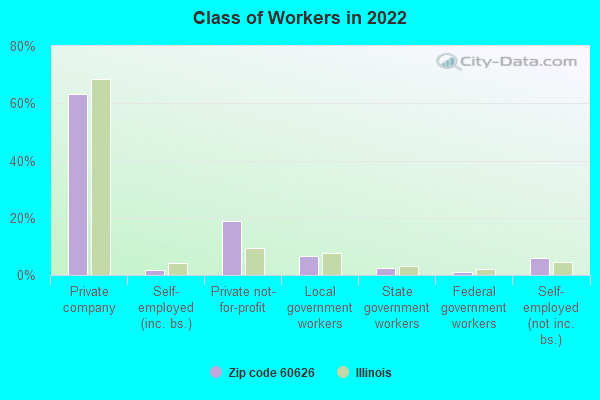
Top industries in this zip code by the number of employees in 2005:
Educational Services: Colleges, Universities, and Professional Schools (over 1000 employees: 1 establishment)
Health Care and Social Assistance: Nursing Care Facilities (100-249: 3, 50-99: 5)
Health Care and Social Assistance: Services for the Elderly and Persons with Disabilities (500-999: 1, 50-99: 1, 1-4: 1)
2002 - 2018 National Fire Incident Reporting System (NFIRS) incidents
According to the data from the years 2002 - 2018 the average number of fires per year is 127. The highest number of fires - 197 took place in 2010, and the least - 0 in 2005. The data has a rising trend.
When looking into fire subcategories, the most incidents belonged to: Structure Fires (55.6%), and Outside Fires (20.0%).
Fire incident types reported to NFIRS in Zip Code 60626


 Nearest zip codes: 60660, 60202, 60645, 60640, 60659, 60625.


 According to the data from the years 2002 - 2018 the average number of fires per year is 127. The highest number of fires - 197 took place in 2010, and the least - 0 in 2005. The data has a rising trend.
 When looking into fire subcategories, the most incidents belonged to: Structure Fires (55.6%), and Outside Fires (20.0%).