Estimated zip code population in 2022: 75,556 Zip code population in 2010: 92,108 Zip code population in 2000: 108,144
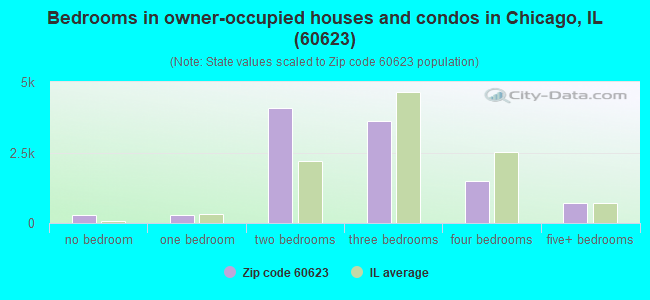
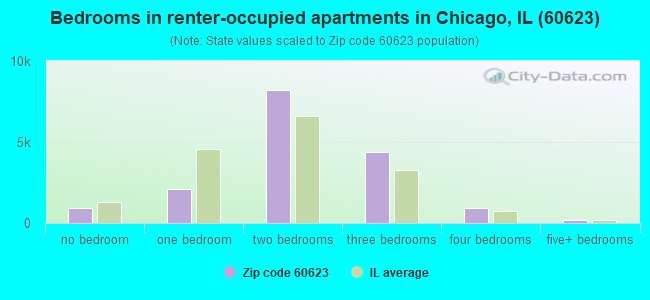
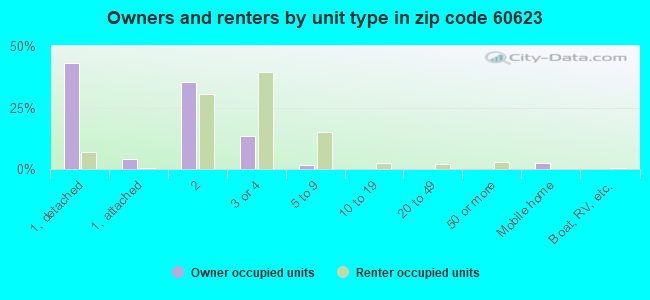
Houses and condos: 31,061 Renter-occupied apartments: 16,867
% of renters here:
62%
State:
33%
March 2022 cost of living index in zip code 60623: 102.3 (near average, U.S. average is 100)
Land area: 5.4 sq. mi. Water area: 0.1 sq. mi.
Population density: 14,106 people per square mile
(very high).
OSM Map
General Map
Google Map
MSN Map
OSM Map
General Map
Google Map
MSN Map
OSM Map
General Map
Google Map
MSN Map
OSM Map
General Map
Google Map
MSN Map
Please wait while loading the map...
Real estate property taxes paid for housing units in 2022:
This zip code:
1.2% ($2,660)
Illinois:
2.0% ($4,912)
Median real estate property taxes paid for housing units with mortgages in 2022: $2,908 (1.3%) Median real estate property taxes paid for housing units with no mortgage in 2022: $2,515 (1.2%)
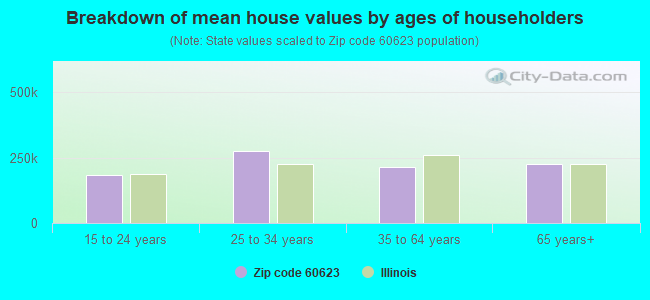
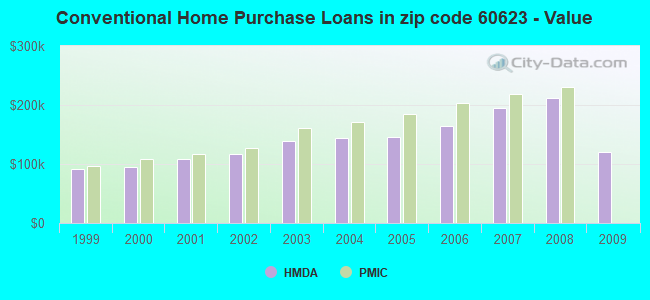
Estimated median house/condo value in 2022: $214,034
60623:
$214,034
Illinois:
$251,600
According to our research of Illinois and other state lists, there were 110 registered sex offenders living in 60623 zip code as of April 27, 2024. The ratio of all residents to sex offenders in zip code 60623 is 813 to 1. The ratio of registered sex offenders to all residents in this zip code is near the state average.
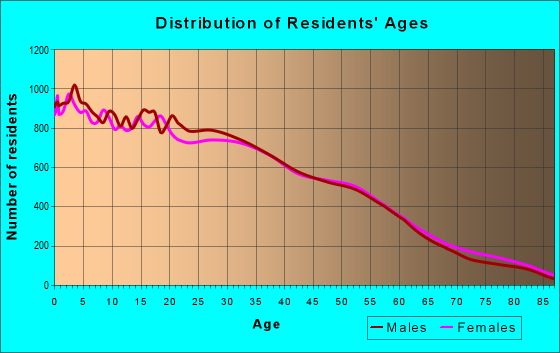
Median resident age:
This zip code:
34.8 years
Illinois median age:
39.1 years
Average household size:
This zip code:
2.7 people
Illinois:
2.4 people
Averages for the 2020 tax year for zip code 60623, filed in 2021:
Average Adjusted Gross Income (AGI) in 2020: $32,082 (Individual Income Tax Returns)
Here:
$32,082
State:
$82,626
Salary/wage: $31,836 (reported on 86.9% of returns)
Here:
$31,836
State:
$66,640
(% of AGI for various income ranges: 1199.5% for AGIs below $25k, 3704.1% for AGIs $25k-50k, 6690.4% for AGIs $50k-75k, 10360.3% for AGIs $75k-100k, 16075.3% for AGIs $100k-200k, 72590.0% for AGIs over 200k)
Taxable interest for individuals: $354 (reported on 7.9% of returns)
This zip code:
$354
Illinois:
$2,376
(% of AGI for various income ranges: 2.2% for AGIs below $25k, 2.4% for AGIs $25k-50k, 6.9% for AGIs $50k-75k, 11.4% for AGIs $75k-100k, 19.5% for AGIs $100k-200k, 65.0% for AGIs over 200k)
Ordinary dividends: $1,758 (reported on 2.3% of returns)
Here:
$1,758
State:
$9,061
(% of AGI for various income ranges: 1.4% for AGIs below $25k, 4.0% for AGIs $25k-50k, 10.4% for AGIs $50k-75k, 11.6% for AGIs $75k-100k, 64.2% for AGIs $100k-200k, 185.0% for AGIs over 200k)
Net capital gain/loss in AGI: +$3,899 (reported on 2.2% of returns)
Here:
+$3,899
State:
+$31,684
(% of AGI for various income ranges: 0.9% for AGIs below $25k, 4.0% for AGIs $25k-50k, 9.3% for AGIs $50k-75k, 43.0% for AGIs $75k-100k, 132.1% for AGIs $100k-200k, 5305.0% for AGIs over 200k)
Profit/loss from business: +$5,553 (reported on 16.6% of returns)
Here:
+$5,553
State:
+$12,175
(% of AGI for various income ranges: 159.3% for AGIs below $25k, 44.3% for AGIs $25k-50k, 90.9% for AGIs $50k-75k, 158.5% for AGIs $75k-100k, 422.3% for AGIs $100k-200k)
Taxable individual retirement arrangement distribution: $9,911 (reported on 1.1% of returns)
60623:
$9,911
Illinois:
$21,613
(% of AGI for various income ranges: 6.3% for AGIs below $25k, 6.1% for AGIs $25k-50k, 34.6% for AGIs $50k-75k, 74.3% for AGIs $75k-100k, 113.5% for AGIs $100k-200k)
Total itemized deductions: $23,806 (reported on 2.0% of returns)
Here:
$23,806
State:
$34,948
(% of AGI for various income ranges: 7.9% for AGIs below $25k, 37.5% for AGIs $25k-50k, 118.2% for AGIs $50k-75k, 272.7% for AGIs $75k-100k, 736.5% for AGIs $100k-200k, 6010.0% for AGIs over 200k)
Charity contributions: $9,672 (reported on 1.5% of returns)
Here:
$9,672
State:
$13,122
(% of AGI for various income ranges: 0.8% for AGIs below $25k, 9.5% for AGIs $25k-50k, 33.4% for AGIs $50k-75k, 93.5% for AGIs $75k-100k, 302.1% for AGIs $100k-200k, 2265.0% for AGIs over 200k)
Taxes paid: $5,646 (reported on 1.9% of returns)
60623:
$5,646
State:
$8,563
(% of AGI for various income ranges: 1.5% for AGIs below $25k, 7.2% for AGIs $25k-50k, 27.3% for AGIs $50k-75k, 69.9% for AGIs $75k-100k, 210.2% for AGIs $100k-200k, 1360.0% for AGIs over 200k)
Earned income credit: $2,779 (reported on 31.8% of returns)
Here:
$2,779
State:
$2,311
(% of AGI for various income ranges: 164.0% for AGIs below $25k, 83.2% for AGIs $25k-50k, 0.9% for AGIs $50k-75k)
Percentage of individuals using paid preparers for their 2020 taxes: 90.6%
Here:
91%
State:
93%
(% for various income ranges: 90.2% for AGIs below $25k, 90.7% for AGIs $25k-50k, 91.7% for AGIs $50k-75k, 89.9% for AGIs $75k-100k, 90.8% for AGIs $100k-200k, 100.0% for AGIs over 200k)
Averages for the 2012 tax year for zip code 60623, filed in 2013:
Average Adjusted Gross Income (AGI) in 2012: $24,914 (Individual Income Tax Returns)
Here:
$24,914
State:
$68,058
Salary/wage: $24,986 (reported on 87.2% of returns)
Here:
$24,986
State:
$55,396
(% of AGI for various income ranges: 80.1% for AGIs below $25k, 94.4% for AGIs $25k-50k, 91.7% for AGIs $50k-75k, 87.9% for AGIs $75k-100k, 82.9% for AGIs $100k-200k, 44.2% for AGIs over 200k)
Taxable interest for individuals: $308 (reported on 8.6% of returns)
This zip code:
$308
Illinois:
$1,969
(% of AGI for various income ranges: 0.1% for AGIs below $25k, 0.2% for AGIs $50k-75k, 0.2% for AGIs $75k-100k, 0.2% for AGIs $100k-200k)
Ordinary dividends: $1,753 (reported on 1.8% of returns)
Here:
$1,753
State:
$7,786
(% of AGI for various income ranges: 0.1% for AGIs below $25k, 0.2% for AGIs $50k-75k, 0.2% for AGIs $75k-100k, 0.3% for AGIs $100k-200k)
Net capital gain/loss in AGI: +$232 (reported on 0.9% of returns)
Here:
+$232
State:
+$22,183
(% of AGI for various income ranges: 0.2% for AGIs $75k-100k)
Profit/loss from business: +$8,147 (reported on 16.3% of returns)
Here:
+$8,147
State:
+$12,903
(% of AGI for various income ranges: 13.9% for AGIs below $25k, 0.9% for AGIs $25k-50k, 0.8% for AGIs $50k-75k, 0.9% for AGIs $75k-100k, 0.9% for AGIs $100k-200k)
Taxable individual retirement arrangement distribution: $10,073 (reported on 1.4% of returns)
60623:
$10,073
Illinois:
$17,929
(% of AGI for various income ranges: 0.3% for AGIs below $25k, 0.4% for AGIs $25k-50k, 0.7% for AGIs $50k-75k, 1.5% for AGIs $75k-100k, 2.5% for AGIs $100k-200k)
Total itemized deductions: $16,162 (29% of AGI, reported on 7.9% of returns)
Here:
$16,162
State:
$26,433
Here:
29.4% of AGI
State:
19.2% of AGI
(% of AGI for various income ranges: 2.0% for AGIs below $25k, 4.3% for AGIs $25k-50k, 8.9% for AGIs $50k-75k, 10.6% for AGIs $75k-100k, 13.1% for AGIs $100k-200k, 11.8% for AGIs over 200k)
Charity contributions: $3,748 (reported on 5.5% of returns)
Here:
$3,748
State:
$4,525
(% of AGI for various income ranges: 0.2% for AGIs below $25k, 0.6% for AGIs $25k-50k, 1.5% for AGIs $50k-75k, 2.5% for AGIs $75k-100k, 2.9% for AGIs $100k-200k, 3.5% for AGIs over 200k)
Taxes paid: $4,881 (reported on 7.8% of returns)
60623:
$4,881
State:
$11,968
(% of AGI for various income ranges: 0.6% for AGIs below $25k, 1.2% for AGIs $25k-50k, 2.7% for AGIs $50k-75k, 3.3% for AGIs $75k-100k, 4.7% for AGIs $100k-200k, 5.5% for AGIs over 200k)
Earned income credit: $2,930 (reported on 40.0% of returns)
Here:
$2,930
State:
$2,349
(% of AGI for various income ranges: 11.7% for AGIs below $25k, 1.8% for AGIs $25k-50k)
Percentage of individuals using paid preparers for their 2012 taxes: 61.5%
Here:
62%
State:
57%
(% for various income ranges: 58.7% for AGIs below $25k, 66.5% for AGIs $25k-50k, 67.3% for AGIs $50k-75k, 64.4% for AGIs $75k-100k, 60.7% for AGIs $100k-200k, 66.7% for AGIs over 200k)
Averages for the 2004 tax year for zip code 60623, filed in 2005:
Average Adjusted Gross Income (AGI) in 2004: $23,087 (Individual Income Tax Returns)
Here:
$23,087
State:
$54,625
Salary/wage: $23,407 (reported on 90.1% of returns)
Here:
$23,407
State:
$46,811
(% of AGI for various income ranges: 83.1% for AGIs below $10k, 89.6% for AGIs $10k-25k, 96.7% for AGIs $25k-50k, 91.9% for AGIs $50k-75k, 84.4% for AGIs $75k-100k, 57.9% for AGIs over 100k)
Taxable interest for individuals: $520 (reported on 17.9% of returns)
This zip code:
$520
Illinois:
$2,101
(% of AGI for various income ranges: 0.9% for AGIs below $10k, 0.3% for AGIs $10k-25k, 0.3% for AGIs $25k-50k, 0.5% for AGIs $50k-75k, 0.5% for AGIs $75k-100k, 1.6% for AGIs over 100k)
Taxable dividends: $1,335 (reported on 2.7% of returns)
Here:
$1,335
State:
$4,306
(% of AGI for various income ranges: 0.2% for AGIs below $10k, 0.1% for AGIs $10k-25k, 0.1% for AGIs $25k-50k, 0.3% for AGIs $50k-75k, 0.3% for AGIs $75k-100k, 1.0% for AGIs over 100k)
Net capital gain/loss: +$11,098 (reported on 1.6% of returns)
Here:
+$11,098
State:
+$17,321
(% of AGI for various income ranges: -0.1% for AGIs below $10k, 0.1% for AGIs $10k-25k, 0.1% for AGIs $25k-50k, 0.9% for AGIs $50k-75k, 4.7% for AGIs $75k-100k, 11.1% for AGIs over 100k)
Profit/loss from business: +$7,002 (reported on 11.9% of returns)
Here:
+$7,002
State:
+$11,771
(% of AGI for various income ranges: 17.8% for AGIs below $10k, 6.7% for AGIs $10k-25k, 1.0% for AGIs $25k-50k, 0.6% for AGIs $50k-75k, 1.2% for AGIs $75k-100k, 1.2% for AGIs over 100k)
IRA payment deduction: $2,043 (reported on 0.3% of returns)
60623:
$2,043
Illinois:
$3,087
Total itemized deductions: $14,159 (33% of AGI, reported on 10.9% of returns)
Here:
$14,159
State:
$20,239
Here:
33.3% of AGI
State:
19.5% of AGI
(% of AGI for various income ranges: 4.1% for AGIs below $10k, 3.3% for AGIs $10k-25k, 7.6% for AGIs $25k-50k, 10.1% for AGIs $50k-75k, 10.3% for AGIs $75k-100k, 11.9% for AGIs over 100k)
Charity contributions deductions: $2,845 (6% of AGI, reported on 8.8% of returns)
Here:
$2,845
State:
$3,719
Here:
6.3% of AGI
State:
3.4% of AGI
(% of AGI for various income ranges: 0.3% for AGIs below $10k, 0.3% for AGIs $10k-25k, 1.1% for AGIs $25k-50k, 2.0% for AGIs $50k-75k, 2.2% for AGIs $75k-100k, 3.4% for AGIs over 100k)
Total tax: $2,178 (reported on 48.8% of returns)
60623:
$2,178
State:
$9,882
(% of AGI for various income ranges: 3.2% for AGIs below $10k, 2.4% for AGIs $10k-25k, 4.0% for AGIs $25k-50k, 7.3% for AGIs $50k-75k, 10.5% for AGIs $75k-100k, 17.1% for AGIs over 100k)
Earned income credit: $2,249 (reported on 43.2% of returns)
Here:
$2,249
State:
$1,788
Percentage of individuals using paid preparers for their 2004 taxes: 73.2%
Here:
73%
State:
61%
(% for various income ranges: 70.4% for AGIs below $10k, 75.9% for AGIs $10k-25k, 71.9% for AGIs $25k-50k, 71.0% for AGIs $50k-75k, 67.0% for AGIs $75k-100k, 70.1% for AGIs over 100k)
Likely homosexual households (counted as self-reported same-sex unmarried-partner households)
Lesbian couples: 0.1% of all households
Gay men: 0.0% of all households
Household received Food Stamps/SNAP in the past 12 months: 8,556 Household did not receive Food Stamps/SNAP in the past 12 months: 19,461
Women who had a birth in the past 12 months: 932 (484 now married, 449 unmarried) Women who did not have a birth in the past 12 months: 18,569 (4,913 now married, 13,743 unmarried)
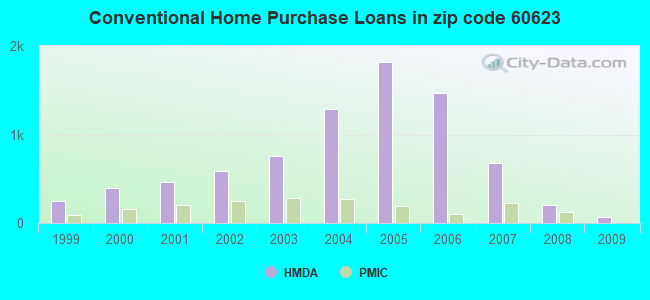
Housing units in zip code 60623 with a mortgage: 5,058 (377 second mortgage, 283 both second mortgage and home equity loan) Houses without a mortgage: 377
Median monthly owner costs for units with a mortgage: $1,666 Median monthly owner costs for units without a mortgage: $653
Residents with income below the poverty level in 2022:
This zip code:
27.3%
Whole state:
11.9%
Residents with income below 50% of the poverty level in 2022:
This zip code:
14.0%
Whole state:
5.7%
Median number of rooms in houses and condos:
Here:
5.5
State:
6.4
Median number of rooms in apartments:
Here:
4.5
State:
4.1
Notable locations in this zip code not listed on our city pages
Notable locations in zip code 60623: John Toman Library (A), Chicago Fire Department District 4 Station 38 (B), Chicago Fire Department District 4 Station 99 (C), Chicago Fire Department District 4 Station 109 (D), Crawford Generating Station (E), Chicago Engine Company 99 (F), Chicago Engine Company 109 (G), Chicago Engine Company 38 (H), Shedd Park Field House (I). Display/hide their locations on the map
Churches in zip code 60623 include: All Nations Church of God (A), All Nations Church of God and Christ (B), All Souls Church of God in Christ (C), Antioch Apostolic Faith Church (D), Apostolic Church of Jesus Christ (E), Assumption Roman Catholic Church (F), Devine Temple Holiness Church (G), Drain Temple (H), Ebenezer Lutheran Church (I). Display/hide their locations on the map
Parks in zip code 60623 include: Jacques Marquette Monument (1), Shedd Park (2), Independence Square Fountain (3), Douglas Park (4), Franklin Park (5), Independence Square (6), Lawndale Park (7), Roswell B Mason Playground (8), Piotrowski Park (9). Display/hide their locations on the map
Tourist attraction (not listed on the city page) : Blackhole (Amusement & Theme Parks; 2728 South Komensky Avenue).
7,293 married couples with children.
7,343 single-parent households (1,578 men, 5,765 women).
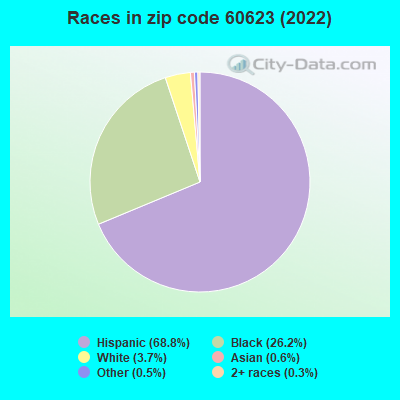
36.0% of residents of 60623 zip code speak English at home.
63.5% of residents speak Spanish at home (47% very well, 25% well, 20% not well, 8% not at all).
0.4% of residents speak other Indo-European language at home (67% very well, 32% well, 1% not well).
0.5% of residents speak Asian or Pacific Island language at home (67% very well, 33% well).
0.6% of residents speak other language at home (88% very well, 9% well, 3% not well).
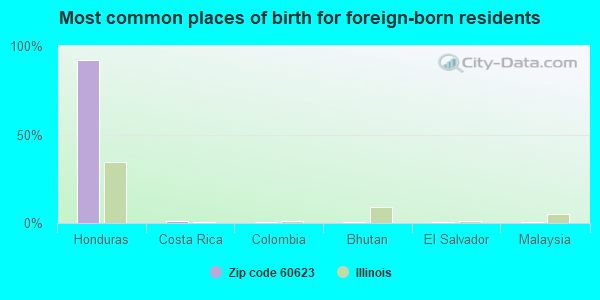
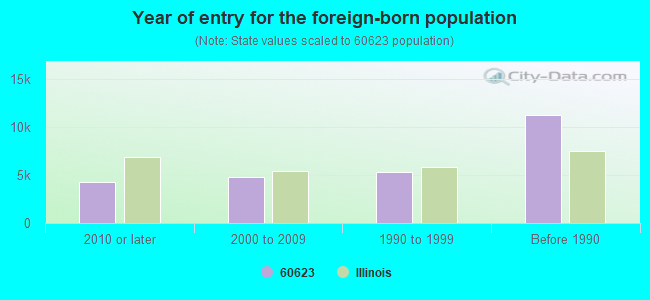
Foreign born population: 24,268 (32.1%) (37.0% of them are naturalized citizens)
Major facilities with environmental interests located in this zip code:
MIDWEST GENERATION,LLC-CRAWFORD (3501 SOUTH PULASKI ROAD in CHICAGO, IL)
STATE MASTER (Illinois EPA Project) - HAZARDOUS WASTE PROGRAM, AIR PROGRAM, SOLID WASTE PROGRAM STATE MASTER (Illinois EPA Project) - National Pollutant Discharge Elimination System Permit AIR MAJOR (AIRS/AFS) AIR PROGRAM (Clean Air Markets Division Business System) (Integrated Compliance Information System) - ICIS-05-1980-0065, FORMAL ENFORCEMENT ACTION CRITERIA AND HAZARDOUS AIR POLLUTANT INVENTORY (Inventory of air pollution sources) National Pollutant Discharge Elimination System MAJOR (Tracking pollutant discharge elimination systems) - permit Small Quantity Generators, between 100 kg and 1000 kg of hazardous waste/month (Resource Conservation and Recovery Act (tracking hazardous waste)) TRI REPORTER (Tracking of toxic chemicals releasing facilities) Business SIC classification: ELECTRIC SERVICES Organizations: MIDWEST GENERATION LLC (CONTACT/OPERATOR)
, COMMONWEALTH EDISON COMPANY (CONTACT/OWNER)
, MIDWEST GENERATION EME, LLC (OWNER/OPERATOR)
Alternative names: COM ED - CRAWFORD STATION, CRAWFORD GENERATING STATION, MIDWEST GENERATION CRAWFORD, MIDWEST GENERATION LLC, MIDWEST GENERATION,LLC-CRAWFRD, MIDWEST GENERATING STATION CRAWFORD
R LAVIN AND SONS INC (3426 SOUTH KEDZIE in CHICAGO, IL)
STATE MASTER (Illinois EPA Project) - HAZARDOUS WASTE PROGRAM, AIR PROGRAM, SOLID WASTE PROGRAM AIR MINOR (AIRS/AFS) (Integrated Compliance Information System) - ICIS-05-1991-0055, FORMAL ENFORCEMENT ACTION Conditionally Exempt Small Quantity Generators, less than 100 kg/month of hazardous waste (Resource Conservation and Recovery Act (tracking hazardous waste)) - notification (Resource Conservation and Recovery Act (tracking hazardous waste)) TRI REPORTER (Tracking of toxic chemicals releasing facilities) Business SIC classification: SECONDARY SMELTING AND REFINING OF NONFERROUS METALS Organizations: LAVIN R AND SONS INC (CONTACT/OWNER)
Alternative names: LAVIN R & SONS INC, LAVIN R AND SONS INS
ROHM & HAAS CHEMICALS LLC (1645 S. KILBOURN AVE. in CHICAGO, IL)
STATE MASTER (Illinois EPA Project) - SOLID WASTE PROGRAM, AIR PROGRAM, HAZARDOUS WASTE PROGRAM AIR SYNTHETIC MINOR (AIRS/AFS) (Integrated Compliance Information System) - ICIS-05-2003-0046, FORMAL ENFORCEMENT ACTION COMPLIANCE ACTIVITY (Tracking inspections of insecticide, fungicide, and rodenticide, and toxic substances) CRITERIA AND HAZARDOUS AIR POLLUTANT INVENTORY (Inventory of air pollution sources) HAZARDOUS WASTE BIENNIAL REPORTER (Resource Conservation and Recovery Act (tracking hazardous waste)) Large Quantity Generators, more that 1000 kg of hazardous waste/month (Resource Conservation and Recovery Act (tracking hazardous waste)) - notification TSD (Resource Conservation and Recovery Act (tracking hazardous waste)) TRI REPORTER (Tracking of toxic chemicals releasing facilities) Business SIC classification: PESTICIDES AND AGRICULTURAL CHEMICALS; CUSTOM COMPOUNDING OF PURCHASED PLASTICS RESINS Business NAICS classification: PESTICIDE AND OTHER AGRICULTURAL CHEMICAL MANUFACTURING.; CUSTOM COMPOUNDING OF PURCHASED RESINS. Alternative names: MORTON INTERNATIONAL, MORTON INTERNATIONAL C/O ROHM AND HAAS, MORTON ITERNAIONAL C/O ROHM & HAAS, MORTON SALT CO.
MEYER STEEL DRUM INC (2000 SOUTH KILBOURN AVENUE in CHICAGO, IL)
STATE MASTER (Illinois EPA Project) - SOLID WASTE PROGRAM, AIR PROGRAM, HAZARDOUS WASTE PROGRAM AIR MAJOR (AIRS/AFS) (Integrated Compliance Information System) - ICIS-05-1992-0150, FORMAL ENFORCEMENT ACTION CRITERIA AND HAZARDOUS AIR POLLUTANT INVENTORY (Inventory of air pollution sources) HAZARDOUS WASTE BIENNIAL REPORTER (Resource Conservation and Recovery Act (tracking hazardous waste)) Large Quantity Generators, more that 1000 kg of hazardous waste/month (Resource Conservation and Recovery Act (tracking hazardous waste)) TRI REPORTER (Tracking of toxic chemicals releasing facilities) Business SIC classification: METAL SHIPPING BARRELS, DRUMS, KEGS, AND PAILS Business NAICS classification: OTHER METAL CONTAINER MANUFACTURING. Alternative names: MEYER STEEL DRUM INC.
MEYER STEEL DRUM INC (3201 SOUTH MILLARD AVENUE in CHICAGO, IL)
STATE MASTER (Illinois EPA Project) - AIR PROGRAM, HAZARDOUS WASTE PROGRAM, SOLID WASTE PROGRAM AIR MAJOR (AIRS/AFS) (Integrated Compliance Information System) - ICIS-05-1991-0238, FORMAL ENFORCEMENT ACTION, ICIS-05-1992-0149, CRITERIA AND HAZARDOUS AIR POLLUTANT INVENTORY (Inventory of air pollution sources) HAZARDOUS WASTE BIENNIAL REPORTER (Resource Conservation and Recovery Act (tracking hazardous waste)) Large Quantity Generators, more that 1000 kg of hazardous waste/month (Resource Conservation and Recovery Act (tracking hazardous waste)) - notification TRI REPORTER (Tracking of toxic chemicals releasing facilities) Business SIC classification: METAL SHIPPING BARRELS, DRUMS, KEGS, AND PAILS; INDUSTRIAL SUPPLIES; REPAIR SHOPS AND RELATED SERVICES Business NAICS classification: OTHER METAL CONTAINER MANUFACTURING.
RELIABLE ASPHALT CORPORATION (3741 S PULASKI AVENUE in CHICAGO, IL)
STATE MASTER (Illinois EPA Project) - SOLID WASTE PROGRAM, AIR PROGRAM STATE MASTER (Illinois EPA Project) - National Pollutant Discharge Elimination System Permit AIR MINOR (AIRS/AFS) CRITERIA AND HAZARDOUS AIR POLLUTANT INVENTORY (Inventory of air pollution sources) National Pollutant Discharge Elimination System NON-MAJOR (Tracking pollutant discharge elimination systems) - permit Business SIC classification: ASPHALT PAVING MIXTURES AND BLOCKS Business NAICS classification: ASPHALT PAVING MIXTURE AND BLOCK MANUFACTURING.
NORTHWESTERN PLATING WORKS INC (3114 S. KOLIN AVE. in CHICAGO, IL)
STATE MASTER (Illinois EPA Project) - SOLID WASTE PROGRAM, AIR PROGRAM, HAZARDOUS WASTE PROGRAM AIR MINOR (AIRS/AFS) SUPERFUND (Superfund database) CRITERIA AND HAZARDOUS AIR POLLUTANT INVENTORY (Inventory of air pollution sources) HAZARDOUS WASTE BIENNIAL REPORTER (Resource Conservation and Recovery Act (tracking hazardous waste)) Large Quantity Generators, more that 1000 kg of hazardous waste/month (Resource Conservation and Recovery Act (tracking hazardous waste)) - notification TRI REPORTER (Tracking of toxic chemicals releasing facilities) Business SIC and NAICS classification: ELECTROPLATING, PLATING, POLISHING, ANODIZING, AND COLORING
LINARES LAUNDRY (3844 WEST 26TH STREET FLOOR 1 in CHICAGO, IL)
STATE MASTER (Illinois EPA Project) - AIR PROGRAM STATE MASTER (Illinois EPA Project) - HAZARDOUS WASTE PROGRAM AIR MINOR (AIRS/AFS) Small Quantity Generators, between 100 kg and 1000 kg of hazardous waste/month (Resource Conservation and Recovery Act (tracking hazardous waste)) - notification Business SIC classification: DRYCLEANING PLANTS, EXCEPT RUG CLEANING Organizations: LINARES LAUNDRY MAT (CONTACT/OWNER)
Alternative names: LAVANDERIA LINARES INC, LINARES LAUNDRY MAT
ABC RAIL CORP (4544 WEST 26TH STREET in CHICAGO, IL)
STATE MASTER (Illinois EPA Project) - HAZARDOUS WASTE PROGRAM, AIR PROGRAM, SOLID WASTE PROGRAM AIR MINOR (AIRS/AFS) Conditionally Exempt Small Quantity Generators, less than 100 kg/month of hazardous waste (Resource Conservation and Recovery Act (tracking hazardous waste)) - notification TRI REPORTER (Tracking of toxic chemicals releasing facilities) Business SIC classification: STRUCTURAL STEEL ERECTION; GRAY AND DUCTILE IRON FOUNDRIES; RAILROAD EQUIPMENT Organizations: BAYNE DICK (CONTACT/OWNER)
Alternative names: ABC RAIL PRODS. CORP., ANCHOR BRAKE SHOE LLC
COLLINS HIGH SCHOOL (1313 S SACRAMENTO in CHICAGO, IL)
STATE MASTER (Illinois EPA Project) - HAZARDOUS WASTE PROGRAM (Geographic Names Information System) (National Center for Education Statistics) - STATE ID-1501629900765 Small Quantity Generators, between 100 kg and 1000 kg of hazardous waste/month (Resource Conservation and Recovery Act (tracking hazardous waste)) - notification Organizations: CHICAGO PUBLIC SCHOOLS (CONTACT/OWNER)
, CITY OF CHICAGO SCHOOL DIST 299 (SCHOOL DISTRICT)
CHILO MANUFACTURING & PLATING COMPANY (2106 S. KEDZIE AVE. in CHICAGO, IL)
STATE MASTER (Illinois EPA Project) - SOLID WASTE PROGRAM, HAZARDOUS WASTE PROGRAM, AIR PROGRAM AIR MINOR (AIRS/AFS) CRITERIA AND HAZARDOUS AIR POLLUTANT INVENTORY (Inventory of air pollution sources) HAZARDOUS WASTE BIENNIAL REPORTER (Resource Conservation and Recovery Act (tracking hazardous waste)) Large Quantity Generators, more that 1000 kg of hazardous waste/month (Resource Conservation and Recovery Act (tracking hazardous waste)) - notification TRI REPORTER (Tracking of toxic chemicals releasing facilities) Business SIC classification: ELECTROPLATING, PLATING, POLISHING, ANODIZING, AND COLORING; MISCELLANEOUS FABRICATED WIRE PRODUCTS Business NAICS classification: ELECTROPLATING, PLATING, POLISHING, ANODIZING, AND COLORING.
CROWN CORK AND SEAL (3501 W 31ST STREET in CHICAGO, IL)
STATE MASTER (Illinois EPA Project) - HAZARDOUS WASTE PROGRAM, AIR PROGRAM, SOLID WASTE PROGRAM AIR MINOR (AIRS/AFS) Large Quantity Generators, more that 1000 kg of hazardous waste/month (Resource Conservation and Recovery Act (tracking hazardous waste)) - notification TRI REPORTER (Tracking of toxic chemicals releasing facilities) Business SIC classification: METAL CANS Business NAICS classification: METAL CAN MANUFACTURING. Organizations: CROWN CORK & SEAL COMPANY INCORPORATED (CONTACT/OWNER)
DAVID GF FARRAGUT CAREER ACAD (2345 S CHRISTIANA in CHICAGO, IL)
STATE MASTER (Illinois EPA Project) - HAZARDOUS WASTE PROGRAM (National Center for Education Statistics) - STATE ID-1501629900011 Small Quantity Generators, between 100 kg and 1000 kg of hazardous waste/month (Resource Conservation and Recovery Act (tracking hazardous waste)) - notification Organizations: CHICAGO PUBLIC SCHOOLS (CONTACT/OWNER)
, CITY OF CHICAGO SCHOOL DIST 299 (SCHOOL DISTRICT)
Housing units lacking complete plumbing facilities: 3.0% Housing units lacking complete kitchen facilities: 5.2%
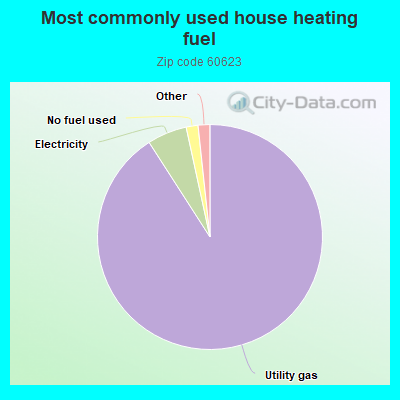
91.0%Utility gas
5.7%Electricity
1.7%No fuel used
1.0%Bottled, tank, or LP gas
0.6%Other fuel
Population in 1990: 112,047.
Place of birth for U.S.-born residents:
This state: 43,643
Northeast: 541
Midwest: 1,004
South: 3,738
West: 696
66% of the 60623 zip code residents lived in the same house 5 years ago. Out of people who lived in different houses, 90% lived in this county. Out of people who lived in different counties, 50% lived in Illinois.
93% of the 60623 zip code residents lived in the same house 1 year ago. Out of people who lived in different houses, 81% moved from this county. Out of people who lived in different houses, 5% moved from different county within same state. Out of people who lived in different houses, 3% moved from different state. Out of people who lived in different houses, 7% moved from abroad.
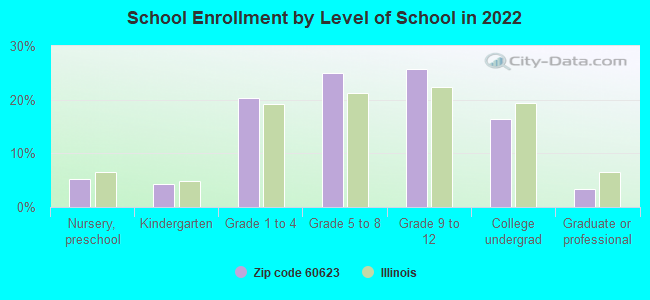
Private vs. public school enrollment:
Students in private schools in grades 1 to 8 (elementary and middle school): 788
Here:
9.1%
Illinois:
13.3%
Students in private schools in grades 9 to 12 (high school): 399
Here:
8.1%
Illinois:
9.9%
Students in private undergraduate colleges: 528
Here:
16.8%
Illinois:
27.4%
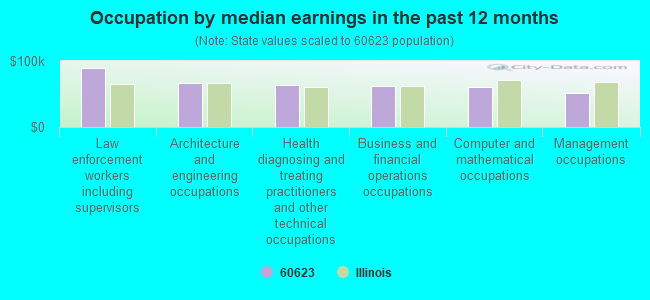
Occupation by median earnings in the past 12 months ($)
90,064Law enforcement workers including supervisors
66,857Architecture and engineering occupations
63,927Health diagnosing and treating practitioners and other technical occupations
61,439Business and financial operations occupations
61,257Computer and mathematical occupations
51,024Management occupations
Companies with federal contracts located in this zip code (CHICAGO, IL):
GREAT LAKES FORGE COMPANY (2141 S SPAULDING AVE; small business) : $1,329,064 in 18 contractsfrom 2000 to 2006
Contracts for Degaussing and Mine Sweeping Equipment, Guns, over 150 mm through 200 mm, Vehicular Brake, Steering, Axle, Wheel, and Track Components, Marine Hardware and Hull Items, and moreby Defense Logistics Agency, Army Signed by year:2000: $191,496; 2001: $67,328; 2002: $392,094; 2003: $169,742; 2004: $323,166; 2005: $52,370; 2006: $132,868.
Biggest contracts:
$314,084 with Defense Logistics Agency for Degaussing and Mine Sweeping Equipment. Signed on 2002-04-15. Completion date: 2002-04-15.
$240,606 with Army for Guns, over 150 mm through 200 mm. Signed on 2004-10-12. Completion date: 2005-04-30.
$143,900, same as above.Signed on 2003-10-28. Completion date: 2004-02-16.
$128,550 with Defense Logistics Agency for Degaussing and Mine Sweeping Equipment. Signed on 2000-01-14. Completion date: 2000-07-12.
NUTEMP INC (3348 S PULASKI RD) : $980,974 in 31 contractsfrom 2001 to 2006
Contracts for Services -- Basic Research (R&D), Lease or Rental of Equipment -- Water Purification and Sewage Treatment Equipment, Air Conditioning Equipment, Miscellaneous Items, and moreby Bureau of Engraving and Printing, U.S. Army Corps of Engineers - civil program financing only, Navy, Army, and others Signed by year:2000: $0; 2001: $271,606; 2002: $76,400; 2003: $195,815; 2004: $305,422; 2005: $128,056; 2006: $3,675.
Biggest contracts:
$159,250 with Bureau of Engraving and Printing for Services -- Basic Research (R&D). Taking place in DC. Signed on 2004-10-21. Completion date: 2005-09-30.
$116,726 with U.S. Army Corps of Engineers - civil program financing only for Lease or Rental of Equipment -- Water Purification and Sewage Treatment Equipment. Taking place in DC. Signed on 2001-08-31. Completion date: 2003-09-03.
$116,720 with Navy for Air Conditioning Equipment. Taking place in VA. Signed on 2001-08-24. Completion date: 2002-05-04.
$113,900 with Bureau of Engraving and Printing for Air Conditioning Equipment. Taking place in DE. Signed on 2003-11-06. Completion date: 2004-09-30.
ROCKWELL METAL PRODUCTS INC (3232 W CERMAK RD; small business) : $621,996 in 20 contractsfrom 2001 to 2006
Contracts for Draperies, Awnings, and Shades, Motor Vehicle Maintenance and Repair Shop Specialized Equipment, Vehicular Brake, Steering, Axle, Wheel, and Track Components, Sets, Kits, and Outfits of Hand Tools, and moreby Army, Defense Logistics Agency Signed by year:2000: $0; 2001: $107,925; 2002: $0; 2003: $397,660; 2004: $64,408; 2005: $39,832; 2006: $12,171.
Biggest contracts:
$61,869 with Army for Draperies, Awnings, and Shades. Signed on 2001-05-03. Completion date: 2004-09-01.
$61,254, same as above.Signed on 2003-01-15. Completion date: 2004-09-30.
$61,005 with Defense Logistics Agency for Motor Vehicle Maintenance and Repair Shop Specialized Equipment. Signed on 2003-10-15. Completion date: 2003-10-17.
$57,877 with Army for Draperies, Awnings, and Shades. Signed on 2003-08-26. Completion date: 2004-09-30.
MOLD SHIELDS INC (2136 S HOMAN AVE; small business) : $50,617 in 5 contractsfrom 2003 to 2006
Contracts for Hand Tools, Nonedged, Nonpowered by Defense Logistics Agency, Army Signed by year:2000: $0; 2001: $0; 2002: $0; 2003: $14,438; 2004: $0; 2005: $10,284; 2006: $25,895.
Biggest contracts:
$17,635 with Defense Logistics Agency for Hand Tools, Nonedged, Nonpowered. Signed on 2006-02-17. Completion date: 2006-06-12.
$10,284, same as above.Signed on 2005-11-25. Completion date: 2006-03-25.
$9,625 with Army for Hand Tools, Nonedged, Nonpowered. Signed on 2003-11-14. Completion date: 2004-02-20.
$8,260 with Defense Logistics Agency for Hand Tools, Nonedged, Nonpowered. Signed on 2006-05-16. Completion date: 2006-08-14.
Top industries in this zip code by the number of employees in 2005:
Administrative and Support and Waste Management and Remediation Services: Temporary Help Services (500-999 employees: 1 establishment, 250-499 employees: 1 establishment, 100-249 employees: 2 establishments, 50-99 employees: 1 establishment, 1-4 employees: 1 establishment)
Health Care and Social Assistance: General Medical and Surgical Hospitals (500-999: 1)
Health Care and Social Assistance: All Other Outpatient Care Centers (250-499: 1, 50-99: 1, 20-49: 1, 10-19: 1, 1-4: 3)
2002 - 2018 National Fire Incident Reporting System (NFIRS) incidents
According to the data from the years 2002 - 2018 the average number of fires per year is 405. The highest number of fires - 806 took place in 2003, and the least - 0 in 2005. The data has a declining trend.
When looking into fire subcategories, the most incidents belonged to: Structure Fires (35.1%), and Outside Fires (27.0%).
Fire incident types reported to NFIRS in Zip Code 60623


 Nearest zip codes: 60624, 60632, 60612, 60804, 60608, 60644.


 According to the data from the years 2002 - 2018 the average number of fires per year is 405. The highest number of fires - 806 took place in 2003, and the least - 0 in 2005. The data has a declining trend.
 When looking into fire subcategories, the most incidents belonged to: Structure Fires (35.1%), and Outside Fires (27.0%).