Estimated zip code population in 2022: 33,984 Zip code population in 2010: 33,472 Zip code population in 2000: 37,990
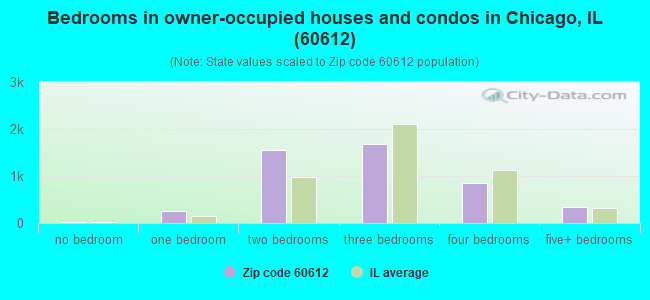
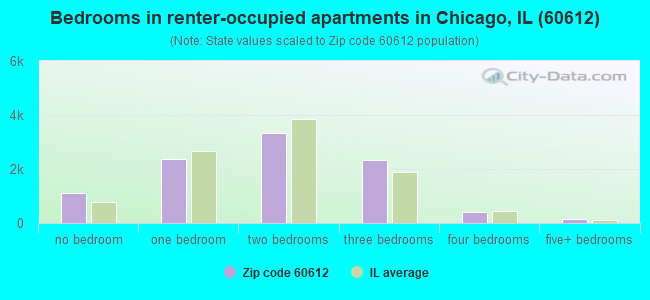
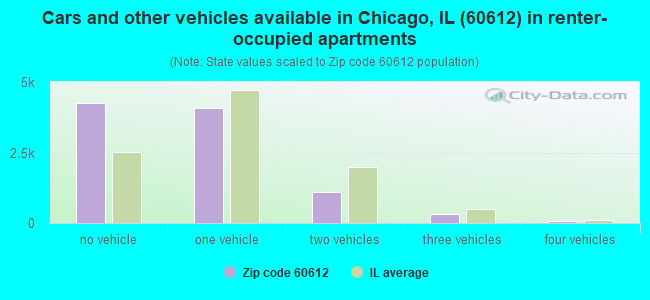
Houses and condos: 16,551 Renter-occupied apartments: 9,698
% of renters here:
67%
State:
33%
March 2022 cost of living index in zip code 60612: 103.7 (near average, U.S. average is 100)
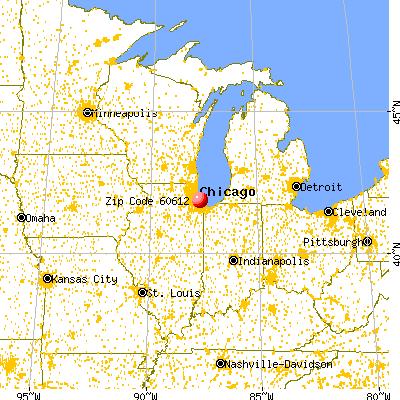
Land area: 3.7 sq. mi. Water area: 0.0 sq. mi.
Population density: 9,069 people per square mile
(high).
OSM Map
General Map
Google Map
MSN Map
OSM Map
General Map
Google Map
MSN Map
OSM Map
General Map
Google Map
MSN Map
OSM Map
General Map
Google Map
MSN Map
Please wait while loading the map...
Real estate property taxes paid for housing units in 2022:
This zip code:
1.5% ($5,288)
Illinois:
2.0% ($4,912)
Median real estate property taxes paid for housing units with mortgages in 2022: $5,187 (1.4%) Median real estate property taxes paid for housing units with no mortgage in 2022: $5,470 (1.6%)
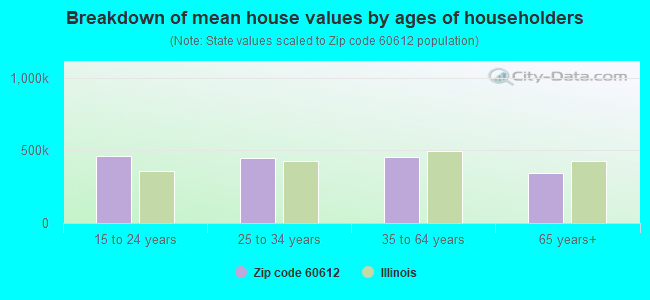
Estimated median house/condo value in 2022: $360,616
60612:
$360,616
Illinois:
$251,600
According to our research of Illinois and other state lists, there were 50 registered sex offenders living in 60612 zip code as of April 27, 2024. The ratio of all residents to sex offenders in zip code 60612 is 721 to 1. The ratio of registered sex offenders to all residents in this zip code is near the state average.
Median resident age:
This zip code:
34.6 years
Illinois median age:
39.1 years
Average household size:
This zip code:
2.2 people
Illinois:
2.4 people
Averages for the 2020 tax year for zip code 60612, filed in 2021:
Average Adjusted Gross Income (AGI) in 2020: $61,366 (Individual Income Tax Returns)
Here:
$61,366
State:
$82,626
Salary/wage: $56,895 (reported on 86.6% of returns)
Here:
$56,895
State:
$66,640
(% of AGI for various income ranges: 1108.2% for AGIs below $25k, 3594.6% for AGIs $25k-50k, 7035.9% for AGIs $50k-75k, 10140.4% for AGIs $75k-100k, 18590.1% for AGIs $100k-200k, 88354.3% for AGIs over 200k)
Taxable interest for individuals: $1,185 (reported on 15.9% of returns)
This zip code:
$1,185
Illinois:
$2,376
(% of AGI for various income ranges: 3.7% for AGIs below $25k, 5.6% for AGIs $25k-50k, 16.3% for AGIs $50k-75k, 21.8% for AGIs $75k-100k, 56.9% for AGIs $100k-200k, 674.3% for AGIs over 200k)
Ordinary dividends: $3,220 (reported on 12.3% of returns)
Here:
$3,220
State:
$9,061
(% of AGI for various income ranges: 5.2% for AGIs below $25k, 8.0% for AGIs $25k-50k, 39.0% for AGIs $50k-75k, 47.8% for AGIs $75k-100k, 169.1% for AGIs $100k-200k, 1271.9% for AGIs over 200k)
Net capital gain/loss in AGI: +$17,613 (reported on 12.0% of returns)
Here:
+$17,613
State:
+$31,684
(% of AGI for various income ranges: 5.2% for AGIs below $25k, 14.2% for AGIs $25k-50k, 30.8% for AGIs $50k-75k, 119.4% for AGIs $75k-100k, 479.5% for AGIs $100k-200k, 11317.6% for AGIs over 200k)
Profit/loss from business: +$7,409 (reported on 21.5% of returns)
Here:
+$7,409
State:
+$12,175
(% of AGI for various income ranges: 121.0% for AGIs below $25k, 34.9% for AGIs $25k-50k, 131.6% for AGIs $50k-75k, 306.7% for AGIs $75k-100k, 532.9% for AGIs $100k-200k, 3384.3% for AGIs over 200k)
Taxable individual retirement arrangement distribution: $16,285 (reported on 2.3% of returns)
60612:
$16,285
Illinois:
$21,613
(% of AGI for various income ranges: 9.3% for AGIs below $25k, 19.5% for AGIs $25k-50k, 42.2% for AGIs $50k-75k, 91.8% for AGIs $75k-100k, 161.6% for AGIs $100k-200k, 758.6% for AGIs over 200k)
Self-employed (Keogh) retirement plans: $32,767 (reported on 0.4% of returns)
60612:
$32,767
Illinois:
$30,962
(% of AGI for various income ranges: 7.1% for AGIs $25k-50k, 827.6% for AGIs over 200k)
Total itemized deductions: $26,648 (reported on 9.9% of returns)
Here:
$26,648
State:
$34,948
(% of AGI for various income ranges: 22.4% for AGIs below $25k, 94.3% for AGIs $25k-50k, 272.2% for AGIs $50k-75k, 658.4% for AGIs $75k-100k, 1208.8% for AGIs $100k-200k, 6495.7% for AGIs over 200k)
Charity contributions: $6,881 (reported on 7.6% of returns)
Here:
$6,881
State:
$13,122
(% of AGI for various income ranges: 2.1% for AGIs below $25k, 19.0% for AGIs $25k-50k, 61.6% for AGIs $50k-75k, 129.4% for AGIs $75k-100k, 203.2% for AGIs $100k-200k, 1445.7% for AGIs over 200k)
Taxes paid: $8,218 (reported on 9.8% of returns)
60612:
$8,218
State:
$8,563
(% of AGI for various income ranges: 6.1% for AGIs below $25k, 22.0% for AGIs $25k-50k, 79.7% for AGIs $50k-75k, 220.8% for AGIs $75k-100k, 439.1% for AGIs $100k-200k, 1787.1% for AGIs over 200k)
Earned income credit: $2,667 (reported on 28.0% of returns)
Here:
$2,667
State:
$2,311
(% of AGI for various income ranges: 175.1% for AGIs below $25k, 88.8% for AGIs $25k-50k)
Percentage of individuals using paid preparers for their 2020 taxes: 93.1%
Here:
93%
State:
93%
(% for various income ranges: 92.5% for AGIs below $25k, 93.7% for AGIs $25k-50k, 93.0% for AGIs $50k-75k, 89.7% for AGIs $75k-100k, 94.9% for AGIs $100k-200k, 95.3% for AGIs over 200k)
Averages for the 2012 tax year for zip code 60612, filed in 2013:
Average Adjusted Gross Income (AGI) in 2012: $40,921 (Individual Income Tax Returns)
Here:
$40,921
State:
$68,058
Salary/wage: $40,487 (reported on 85.1% of returns)
Here:
$40,487
State:
$55,396
(% of AGI for various income ranges: 73.7% for AGIs below $25k, 91.5% for AGIs $25k-50k, 90.1% for AGIs $50k-75k, 91.1% for AGIs $75k-100k, 86.2% for AGIs $100k-200k, 72.5% for AGIs over 200k)
Taxable interest for individuals: $737 (reported on 14.6% of returns)
This zip code:
$737
Illinois:
$1,969
(% of AGI for various income ranges: 0.2% for AGIs below $25k, 0.1% for AGIs $25k-50k, 0.3% for AGIs $50k-75k, 0.2% for AGIs $75k-100k, 0.2% for AGIs $100k-200k, 0.6% for AGIs over 200k)
Ordinary dividends: $2,367 (reported on 8.0% of returns)
Here:
$2,367
State:
$7,786
(% of AGI for various income ranges: 0.3% for AGIs below $25k, 0.3% for AGIs $25k-50k, 0.4% for AGIs $50k-75k, 0.6% for AGIs $75k-100k, 0.8% for AGIs $100k-200k, 0.6% for AGIs over 200k)
Net capital gain/loss in AGI: +$2,739 (reported on 6.1% of returns)
Here:
+$2,739
State:
+$22,183
(% of AGI for various income ranges: 0.2% for AGIs $25k-50k, 0.1% for AGIs $75k-100k, 0.8% for AGIs $100k-200k, 1.3% for AGIs over 200k)
Profit/loss from business: +$9,635 (reported on 22.6% of returns)
Here:
+$9,635
State:
+$12,903
(% of AGI for various income ranges: 18.8% for AGIs below $25k, 1.3% for AGIs $25k-50k, 2.2% for AGIs $50k-75k, 2.4% for AGIs $75k-100k, 3.7% for AGIs $100k-200k, 4.3% for AGIs over 200k)
Taxable individual retirement arrangement distribution: $14,734 (reported on 2.2% of returns)
60612:
$14,734
Illinois:
$17,929
(% of AGI for various income ranges: 0.4% for AGIs below $25k, 0.4% for AGIs $25k-50k, 0.9% for AGIs $50k-75k, 0.9% for AGIs $75k-100k, 1.1% for AGIs $100k-200k, 1.2% for AGIs over 200k)
Self-employment retirement plans: $18,400 (reported on 0.3% of returns)
60612:
$18,400
Illinois:
$24,666
Total itemized deductions: $21,903 (21% of AGI, reported on 19.6% of returns)
Here:
$21,903
State:
$26,433
Here:
21.3% of AGI
State:
19.2% of AGI
(% of AGI for various income ranges: 3.7% for AGIs below $25k, 7.1% for AGIs $25k-50k, 11.3% for AGIs $50k-75k, 13.7% for AGIs $75k-100k, 15.3% for AGIs $100k-200k, 13.1% for AGIs over 200k)
Charity contributions: $3,412 (reported on 15.2% of returns)
Here:
$3,412
State:
$4,525
(% of AGI for various income ranges: 0.3% for AGIs below $25k, 1.1% for AGIs $25k-50k, 1.6% for AGIs $50k-75k, 1.6% for AGIs $75k-100k, 1.5% for AGIs $100k-200k, 1.7% for AGIs over 200k)
Taxes paid: $8,539 (reported on 19.5% of returns)
60612:
$8,539
State:
$11,968
(% of AGI for various income ranges: 1.1% for AGIs below $25k, 1.9% for AGIs $25k-50k, 3.7% for AGIs $50k-75k, 5.0% for AGIs $75k-100k, 6.4% for AGIs $100k-200k, 6.9% for AGIs over 200k)
Earned income credit: $2,821 (reported on 38.2% of returns)
Here:
$2,821
State:
$2,349
(% of AGI for various income ranges: 14.5% for AGIs below $25k, 1.4% for AGIs $25k-50k)
Percentage of individuals using paid preparers for their 2012 taxes: 48.9%
Here:
49%
State:
57%
(% for various income ranges: 45.4% for AGIs below $25k, 49.0% for AGIs $25k-50k, 52.3% for AGIs $50k-75k, 55.0% for AGIs $75k-100k, 61.7% for AGIs $100k-200k, 70.4% for AGIs over 200k)
Averages for the 2004 tax year for zip code 60612, filed in 2005:
Average Adjusted Gross Income (AGI) in 2004: $31,803 (Individual Income Tax Returns)
Here:
$31,803
State:
$54,625
Salary/wage: $31,312 (reported on 87.6% of returns)
Here:
$31,312
State:
$46,811
(% of AGI for various income ranges: 86.8% for AGIs below $10k, 85.0% for AGIs $10k-25k, 94.6% for AGIs $25k-50k, 93.0% for AGIs $50k-75k, 89.9% for AGIs $75k-100k, 70.7% for AGIs over 100k)
Taxable interest for individuals: $708 (reported on 22.5% of returns)
This zip code:
$708
Illinois:
$2,101
(% of AGI for various income ranges: 1.3% for AGIs below $10k, 0.5% for AGIs $10k-25k, 0.4% for AGIs $25k-50k, 0.4% for AGIs $50k-75k, 0.3% for AGIs $75k-100k, 0.6% for AGIs over 100k)
Taxable dividends: $1,184 (reported on 8.3% of returns)
Here:
$1,184
State:
$4,306
(% of AGI for various income ranges: 0.5% for AGIs below $10k, 0.2% for AGIs $10k-25k, 0.2% for AGIs $25k-50k, 0.3% for AGIs $50k-75k, 0.2% for AGIs $75k-100k, 0.6% for AGIs over 100k)
Net capital gain/loss: +$12,896 (reported on 6.5% of returns)
Here:
+$12,896
State:
+$17,321
(% of AGI for various income ranges: 0.7% for AGIs below $10k, 0.0% for AGIs $10k-25k, 0.3% for AGIs $25k-50k, 0.6% for AGIs $50k-75k, 1.5% for AGIs $75k-100k, 9.6% for AGIs over 100k)
Profit/loss from business: +$8,337 (reported on 16.3% of returns)
Here:
+$8,337
State:
+$11,771
(% of AGI for various income ranges: 25.5% for AGIs below $10k, 8.8% for AGIs $10k-25k, 1.4% for AGIs $25k-50k, 0.8% for AGIs $50k-75k, 2.1% for AGIs $75k-100k, 4.7% for AGIs over 100k)
IRA payment deduction: $2,589 (reported on 1.2% of returns)
60612:
$2,589
Illinois:
$3,087
(% of AGI for various income ranges: 0.1% for AGIs $10k-25k, 0.1% for AGIs $25k-50k, 0.1% for AGIs $50k-75k, 0.1% for AGIs $75k-100k, 0.1% for AGIs over 100k)
Self-employed pension: $14,279 (reported on 0.4% of returns)
Here:
$14,279
Illinois:
$16,965
Total itemized deductions: $16,884 (24% of AGI, reported on 21.0% of returns)
Here:
$16,884
State:
$20,239
Here:
24.2% of AGI
State:
19.5% of AGI
(% of AGI for various income ranges: 7.9% for AGIs below $10k, 5.6% for AGIs $10k-25k, 9.3% for AGIs $25k-50k, 15.1% for AGIs $50k-75k, 15.5% for AGIs $75k-100k, 13.2% for AGIs over 100k)
Charity contributions deductions: $3,081 (4% of AGI, reported on 16.8% of returns)
Here:
$3,081
State:
$3,719
Here:
4.0% of AGI
State:
3.4% of AGI
(% of AGI for various income ranges: 0.3% for AGIs below $10k, 0.7% for AGIs $10k-25k, 1.6% for AGIs $25k-50k, 2.4% for AGIs $50k-75k, 2.0% for AGIs $75k-100k, 1.8% for AGIs over 100k)
Total tax: $5,271 (reported on 61.6% of returns)
60612:
$5,271
State:
$9,882
(% of AGI for various income ranges: 4.5% for AGIs below $10k, 3.4% for AGIs $10k-25k, 6.2% for AGIs $25k-50k, 10.4% for AGIs $50k-75k, 13.0% for AGIs $75k-100k, 19.4% for AGIs over 100k)
Earned income credit: $2,188 (reported on 39.1% of returns)
Here:
$2,188
State:
$1,788
Percentage of individuals using paid preparers for their 2004 taxes: 63.0%
Here:
63%
State:
61%
(% for various income ranges: 61.2% for AGIs below $10k, 68.1% for AGIs $10k-25k, 58.8% for AGIs $25k-50k, 59.4% for AGIs $50k-75k, 60.0% for AGIs $75k-100k, 69.1% for AGIs over 100k)
Likely homosexual households (counted as self-reported same-sex unmarried-partner households)
Lesbian couples: 0.2% of all households
Gay men: 0.2% of all households
Household received Food Stamps/SNAP in the past 12 months: 5,217 Household did not receive Food Stamps/SNAP in the past 12 months: 9,682
Women who had a birth in the past 12 months: 457 (118 now married, 340 unmarried) Women who did not have a birth in the past 12 months: 9,726 (2,335 now married, 7,446 unmarried)
Housing units in zip code 60612 with a mortgage: 3,400 (350 second mortgage, 3 home equity loan, 294 both second mortgage and home equity loan) Median monthly owner costs for units with a mortgage: $2,245 Median monthly owner costs for units without a mortgage: $1,108
Residents with income below the poverty level in 2022:
This zip code:
27.3%
Whole state:
11.9%
Residents with income below 50% of the poverty level in 2022:
This zip code:
11.4%
Whole state:
5.7%
Median number of rooms in houses and condos:
Here:
5.7
State:
6.4
Median number of rooms in apartments:
Here:
3.9
State:
4.1
Notable locations in this zip code not listed on our city pages
Notable locations in zip code 60612: Chicago Fire Department District 4 Station 107 (A), Chicago Fire Department District 1 Station 26 (B), Chicago Transit Authority-Ashland Avenue Station (C), Cathedral Shelter of Chicago Higgins House (D), Crossroads Adult Transition Center (E), Chicago Engine Company 26 (F), Chicago Engine Company 107 (G), Rush University Academic Facility (H). Display/hide their locations on the map
Churches in zip code 60612 include: Emanuel Church of God in Christ (A), Calvary Bible Church (B), Christ Temple Apostolic Faith Church (C), Faith Tabernacle Pentecostal Church (D), Garden of Prayer Pentecostal Church (E), Good Hope Freewill Baptist Church (F), Greater Bethlehem Baptist Church (G), Greater Holy Temple Church of God and Christ (H), Kingdom Hall of Jehovahs Witnesses (I). Display/hide their locations on the map
Parks in zip code 60612 include: Rockwell Park (1), Sacramento Square (2), Sain Park (3), Altgeld Park (4), Smith Park (5), Campbell Park (6), Horan Park (7), Superior Park (8), Claremont Park (9). Display/hide their locations on the map
Tourist attractions (not listed on the city page) : Avcoa Inc (Amusement & Theme Parks; 2350 West Fulton Street), Direct Express Tours Inc (Tours & Charters; 1926 West Harrison Street Suite 1).
2,078 married couples with children.
4,056 single-parent households (802 men, 3,254 women).
79.3% of residents of 60612 zip code speak English at home.
13.0% of residents speak Spanish at home (70% very well, 19% well, 10% not well, 1% not at all).
3.9% of residents speak other Indo-European language at home (81% very well, 18% well, 1% not well).
2.4% of residents speak Asian or Pacific Island language at home (85% very well, 11% well, 4% not well).
1.0% of residents speak other language at home (75% very well, 25% well).
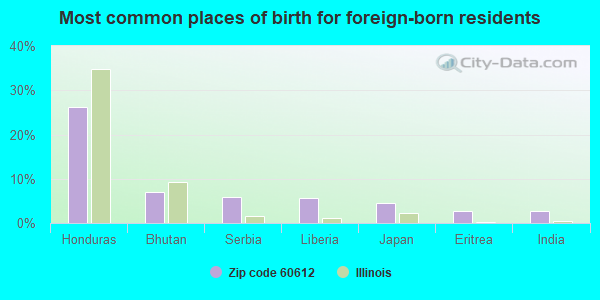
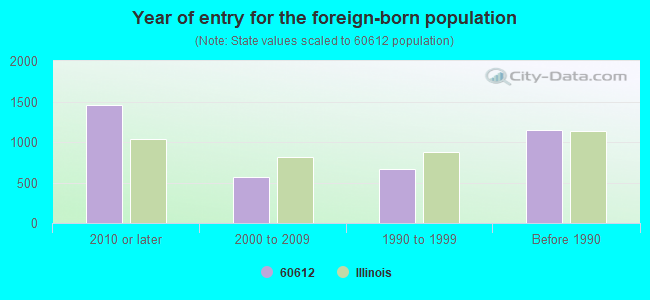
Foreign born population: 3,341 (9.8%) (46.2% of them are naturalized citizens)
Major facilities with environmental interests located in this zip code:
NATIONAL INTERCHEM CORP (2819 WEST LAKE STREET in CHICAGO, IL)
STATE MASTER (Illinois EPA Project) - AIR PROGRAM AIR MINOR (AIRS/AFS) (Integrated Compliance Information System) - ICIS-05-1996-0128, FORMAL ENFORCEMENT ACTION, ICIS-05-1996-0548, COMPLIANCE ACTIVITY (Tracking inspections of insecticide, fungicide, and rodenticide, and toxic substances) CRITERIA AND HAZARDOUS AIR POLLUTANT INVENTORY (Inventory of air pollution sources) TRI REPORTER (Tracking of toxic chemicals releasing facilities) Business SIC classification: SPECIALTY CLEANING, POLISHING, AND SANITATION PREPARATIONS Business NAICS classification: POLISH AND OTHER SANITATION GOOD MANUFACTURING. Alternative names: NATIONAL DETERGENTS, INC., NATIONAL STANDARD CORP
LAKE CHEMICAL CO (250 N WASHTENAW AVE in CHICAGO, IL)
STATE MASTER (Illinois EPA Project) - HAZARDOUS WASTE PROGRAM, AIR PROGRAM, SOLID WASTE PROGRAM STATE MASTER (Illinois EPA Project) - AIR PROGRAM AIR MINOR (AIRS/AFS) Small Quantity Generators, between 100 kg and 1000 kg of hazardous waste/month (Resource Conservation and Recovery Act (tracking hazardous waste)) - notification Business SIC classification: LEAD PENCILS, CRAYONS, AND ARTISTS' MATERIALS Alternative names: LA-CO INDUSTRIES
HUGH MANLEY SCHOOL-CHGO BD ED (2935 W POLK ST in CHICAGO, IL)
STATE MASTER (Illinois EPA Project) - SOLID WASTE PROGRAM, AIR PROGRAM, HAZARDOUS WASTE PROGRAM AIR MINOR (AIRS/AFS) (National Center for Education Statistics) - STATE ID-1501629900616 CRITERIA AND HAZARDOUS AIR POLLUTANT INVENTORY (Inventory of air pollution sources) Small Quantity Generators, between 100 kg and 1000 kg of hazardous waste/month (Resource Conservation and Recovery Act (tracking hazardous waste)) - notification Business SIC and NAICS classification: ELEMENTARY AND SECONDARY SCHOOLS Organizations: CHICAGO PUBLIC SCHOOLS (CONTACT/OWNER)
, CITY OF CHICAGO SCHOOL DIST 299 (SCHOOL DISTRICT)
Alternative names: CHICAGO BOARD OF EDUCATION, MANLEY CAREER ACADEMY HIGH SCHOOL, MANLEY HIGH SCHOOL
MOSCHIANO PLATING INC (2808 W. LAKE ST. in CHICAGO, IL)
STATE MASTER (Illinois EPA Project) - SOLID WASTE PROGRAM, AIR PROGRAM AIR MINOR (AIRS/AFS) SUPERFUND (Superfund database) (Integrated Compliance Information System) - ICIS-05-1999-0295, FORMAL ENFORCEMENT ACTION COMPLIANCE ACTIVITY (Tracking inspections of insecticide, fungicide, and rodenticide, and toxic substances) Small Quantity Generators, between 100 kg and 1000 kg of hazardous waste/month (Resource Conservation and Recovery Act (tracking hazardous waste)) - notification Business SIC classification: ELECTROPLATING, PLATING, POLISHING, ANODIZING, AND COLORING
REFRACTORY TECHNOLOGY INC (2017 W. HUBBARD ST. in CHICAGO, IL)
STATE MASTER (Illinois EPA Project) - SOLID WASTE PROGRAM, AIR PROGRAM STATE MASTER (Illinois EPA Project) - National Pollutant Discharge Elimination System Permit AIR MINOR (AIRS/AFS) National Pollutant Discharge Elimination System NON-MAJOR (Tracking pollutant discharge elimination systems) - permit Business SIC classification: NONCLASSIFIABLE ESTABLISHMENTS Organizations: REFRACTORY TECH. INC. (CONTACT/OWNER)
PRIDE INDUSTRIES (925 S CALIFORNIA AVE in CHICAGO, IL)
STATE MASTER (Illinois EPA Project) - HAZARDOUS WASTE PROGRAM SUPERFUND (Superfund database) (Integrated Compliance Information System) - ICIS-05-1987-0063, FORMAL ENFORCEMENT ACTION Large Quantity Generators, more that 1000 kg of hazardous waste/month (Resource Conservation and Recovery Act (tracking hazardous waste)) - notification Organizations: DORMEYER INDUSTRIES (CONTACT/OWNER)
RACHELS BUS CO (3014 W FILLMORE in CHICAGO, IL)
STATE MASTER (Illinois EPA Project) - HAZARDOUS WASTE PROGRAM STATE MASTER (Illinois EPA Project) - National Pollutant Discharge Elimination System Permit National Pollutant Discharge Elimination System NON-MAJOR (Tracking pollutant discharge elimination systems) - permit Small Quantity Generators, between 100 kg and 1000 kg of hazardous waste/month (Resource Conservation and Recovery Act (tracking hazardous waste)) - notification Organizations: RACHEL'S BUS COMPANY (CONTACT/OWNER)
PACE INDUSTRIES INC (2545 W POLK in CHICAGO, IL)
STATE MASTER (Illinois EPA Project) - AIR PROGRAM, HAZARDOUS WASTE PROGRAM AIR MAJOR (AIRS/AFS) (Integrated Compliance Information System) - ICIS-05-2000-0680, FORMAL ENFORCEMENT ACTION CRITERIA AND HAZARDOUS AIR POLLUTANT INVENTORY (Inventory of air pollution sources) Small Quantity Generators, between 100 kg and 1000 kg of hazardous waste/month (Resource Conservation and Recovery Act (tracking hazardous waste)) - notification Business SIC classification: WOOD KITCHEN CABINETS Business NAICS classification: WOOD KITCHEN CABINET AND COUNTERTOP MANUFACTURING. Organizations: PALKA JAMES (CONTACT/OWNER)
BOBCO ENTERPRISES INC. (737 NORTH ALBANY AVENUE in CHICAGO, IL)
STATE MASTER (Illinois EPA Project) - SOLID WASTE PROGRAM, HAZARDOUS WASTE PROGRAM, AIR PROGRAM AIR MINOR (AIRS/AFS) CRITERIA AND HAZARDOUS AIR POLLUTANT INVENTORY (Inventory of air pollution sources) HAZARDOUS WASTE BIENNIAL REPORTER (Resource Conservation and Recovery Act (tracking hazardous waste)) Large Quantity Generators, more that 1000 kg of hazardous waste/month (Resource Conservation and Recovery Act (tracking hazardous waste)) - notification TRI REPORTER (Tracking of toxic chemicals releasing facilities) Business SIC classification: ELECTROPLATING, PLATING, POLISHING, ANODIZING, AND COLORING; PRINTED CIRCUIT BOARDS Business NAICS classification: BARE PRINTED CIRCUIT BOARD MANUFACTURING.; BARE PRINTED CIRCUIT BOARD MANUFACTURING. Alternative names: BOBCO INC
LAKEWOOD ENGINEERING & MFG CO (501 N. SACRAMENTO BLVD. in CHICAGO, IL)
STATE MASTER (Illinois EPA Project) - HAZARDOUS WASTE PROGRAM, AIR PROGRAM, SOLID WASTE PROGRAM AIR MAJOR (AIRS/AFS) CRITERIA AND HAZARDOUS AIR POLLUTANT INVENTORY (Inventory of air pollution sources) HAZARDOUS WASTE BIENNIAL REPORTER (Resource Conservation and Recovery Act (tracking hazardous waste)) Large Quantity Generators, more that 1000 kg of hazardous waste/month (Resource Conservation and Recovery Act (tracking hazardous waste)) TRI REPORTER (Tracking of toxic chemicals releasing facilities) Business SIC classification: METAL STAMPINGS; INDUSTRIAL AND COMMERCIAL FANS AND BLOWERS AND AIR PURIFICATION EQUIPMENT; RESIDENTIAL ELECTRIC LIGHTING FIXTURES Business NAICS classification: METAL STAMPING.; ELECTRIC HOUSEWARES AND HOUSEHOLD FAN MANUFACTURING. Alternative names: LAKEWOOD ENG. & MFG. CO.
MARY MCLEOD BETHUNE ELEM SCH (3030 W ARTHINGTON in CHICAGO, IL)
STATE MASTER (Illinois EPA Project) - HAZARDOUS WASTE PROGRAM (National Center for Education Statistics) - STATE ID-1501629902084 Small Quantity Generators, between 100 kg and 1000 kg of hazardous waste/month (Resource Conservation and Recovery Act (tracking hazardous waste)) - notification Organizations: CHICAGO PUBLIC SCHOOLS (CONTACT/OWNER)
, CITY OF CHICAGO SCHOOL DIST 299 (SCHOOL DISTRICT)
ALUMETCO (2537 W TAYLOR ST in CHICAGO, IL)
STATE MASTER (Illinois EPA Project) - AIR PROGRAM, HAZARDOUS WASTE PROGRAM, SOLID WASTE PROGRAM AIR MINOR (AIRS/AFS) CRITERIA AND HAZARDOUS AIR POLLUTANT INVENTORY (Inventory of air pollution sources) Large Quantity Generators, more that 1000 kg of hazardous waste/month (Resource Conservation and Recovery Act (tracking hazardous waste)) - notification Business SIC classification: SECONDARY SMELTING AND REFINING OF NONFERROUS METALS
RESIDUE RECYCLING RESOURCES INC (317 N FRANCISCO in CHICAGO, IL)
STATE MASTER (Illinois EPA Project) - SOLID WASTE PROGRAM, HAZARDOUS WASTE PROGRAM, AIR PROGRAM AIR MINOR (AIRS/AFS) (Resource Conservation and Recovery Act (tracking hazardous waste)) TRI REPORTER (Tracking of toxic chemicals releasing facilities) Business SIC classification: PRIMARY PRODUCTION OF ALUMINUM; SECONDARY SMELTING AND REFINING OF NONFERROUS METALS
Housing units lacking complete plumbing facilities: 2.5% Housing units lacking complete kitchen facilities: 3.4%
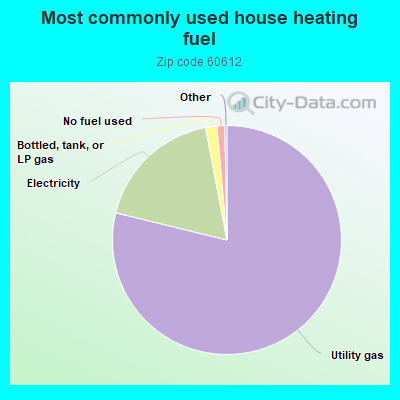
78.9%Utility gas
18.2%Electricity
1.6%Bottled, tank, or LP gas
1.1%No fuel used
Population in 1990: 44,363.
Place of birth for U.S.-born residents:
This state: 23,906
Northeast: 810
Midwest: 2,038
South: 2,606
West: 794
55% of the 60612 zip code residents lived in the same house 5 years ago. Out of people who lived in different houses, 78% lived in this county. Out of people who lived in different counties, 50% lived in Illinois.
85% of the 60612 zip code residents lived in the same house 1 year ago. Out of people who lived in different houses, 73% moved from this county. Out of people who lived in different houses, 6% moved from different county within same state. Out of people who lived in different houses, 12% moved from different state. Out of people who lived in different houses, 6% moved from abroad.
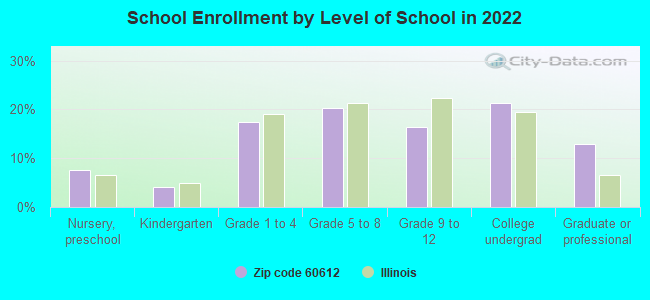
Private vs. public school enrollment:
Students in private schools in grades 1 to 8 (elementary and middle school): 602
Here:
17.5%
Illinois:
13.3%
Students in private schools in grades 9 to 12 (high school): 313
Here:
21.1%
Illinois:
9.9%
Students in private undergraduate colleges: 565
Here:
29.1%
Illinois:
27.4%
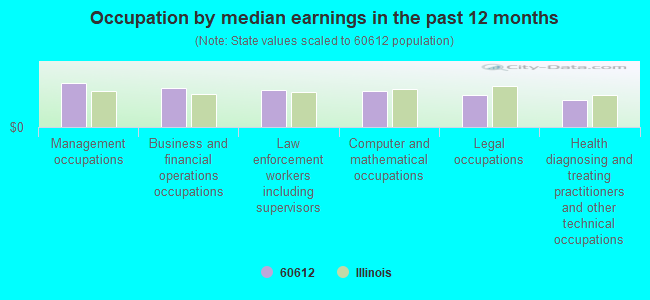
Occupation by median earnings in the past 12 months ($)
106,240Management occupations
93,401Business and financial operations occupations
89,548Law enforcement workers including supervisors
86,133Computer and mathematical occupations
78,257Legal occupations
66,227Health diagnosing and treating practitioners and other technical occupations
Companies with biggest federal contracts located in this zip code (CHICAGO, IL):
REVERE ELECTRIC SUPPLY CO (2501 W WASHINGTON BLVD; small business) : $8,245,893 in 335 contractsfrom 1999 to 2006
Contracts for Electrical Control Equipment, Converters, Electrical, Nonrotating, Coils and Transformers, Circuit Breakers, and moreby Defense Logistics Agency, Navy, Army, Air Force, and others Signed by year:2000: $936,276; 2001: $317,990; 2002: $1,145,331; 2003: $685,056; 2004: $2,408,378; 2005: $2,026,571; 2006: $593,361.
Biggest contracts:
$511,200 with Defense Logistics Agency for Electrical Control Equipment. Signed on 2004-06-24. Completion date: 2005-03-14.
$417,768 with Defense Logistics Agency for Converters, Electrical, Nonrotating. Signed on 2004-03-15. Completion date: 2004-07-03.
$417,768, same as above.Signed on 2004-04-09. Completion date: 2004-07-28.
$277,200 with Defense Logistics Agency for Coils and Transformers. Signed on 2000-09-28. Completion date: 2001-07-25.
RUSH UNIVERSITY MEDICAL CENTER (600 S PAULINA ST STE 440) : $1,738,346 in 54 contractsfrom 1999 to 2006
Contracts for Tuition, Registration, and Membership Fees, Educational Services by Army, Navy Signed by year:2000: $164,768; 2001: $210,550; 2002: $116,048; 2003: $181,999; 2004: $386,017; 2005: $382,200; 2006: $244,764.
Biggest contracts:
$144,660 with Army for Tuition, Registration, and Membership Fees. Signed on 2001-09-25. Completion date: 2001-09-30.
$87,280, same as above.Signed on 2000-01-05. Completion date: 2000-09-30.
$82,600 with Navy for Tuition, Registration, and Membership Fees. Signed on 2004-07-19. Completion date: 2004-12-12.
$81,900, same as above.Signed on 2004-12-06. Completion date: 2005-03-31.
UNIV OF ILLINOIS MEDICAL CENTER (840 S WOOD ST) : $454,936 in 2 contractsin 2004
$247,107 with Department of Veterans Affairs for Laboratory Testing Services. Signed on 2004-07-01. Completion date: 2005-06-30.
$207,829, same as above.Signed on 2004-10-01. Completion date: 2005-06-30.
REVERE ELECTRIC SUPPLY CO (2601 WEST WASHINGTON BLVD; small business) : $432,808 in 22 contractsfrom 2000 to 2005
Contracts for Relays and Solenoids, Electrical Control Equipment, Circuit Breakers, Packing and Gasket Materials, and moreby Defense Logistics Agency, Navy Signed by year:2000: $176,145; 2001: $27,495; 2002: $33,152; 2003: $38,088; 2004: $140,999; 2005: $16,929; 2006: $0.
Biggest contracts:
$67,564 with Defense Logistics Agency for Relays and Solenoids. Signed on 2000-02-29. Completion date: 2000-11-03.
$45,900 with Defense Logistics Agency for Electrical Control Equipment. Signed on 2000-03-24. Completion date: 2000-08-11.
$41,052 with Navy for Electrical Control Equipment. Signed on 2004-02-10. Completion date: 2004-06-09.
$38,088 with Navy for Circuit Breakers. Signed on 2003-10-31. Completion date: 2004-02-18.
ADVANCE ELECTRICAL SUPPLY CO, (263 N OAKLEY BLVD) : $429,591 in 74 contractsfrom 2004 to 2006
Contracts for Hardware, Commercial, Hazard-Detecting Instruments and Apparatus, Space and Water Heating Equipment, Liquid and Gas Flow, Liquid Level, and Mechanical Motion Measuring Instruments, and moreby Defense Logistics Agency Signed by year:2000: $0; 2001: $0; 2002: $0; 2003: $0; 2004: $178,372; 2005: $248,103; 2006: $3,116.
Biggest contracts:
$32,133 with Defense Logistics Agency for Hardware, Commercial. Signed on 2004-03-13. Completion date: 2004-06-11.
$18,023 with Defense Logistics Agency for Hazard-Detecting Instruments and Apparatus. Signed on 2005-07-20. Completion date: 2005-10-27.
$16,799 with Defense Logistics Agency for Space and Water Heating Equipment. Signed on 2005-01-26. Completion date: 2005-10-04.
$15,656 with Defense Logistics Agency for Liquid and Gas Flow, Liquid Level, and Mechanical Motion Measuring Instruments. Signed on 2005-06-15. Completion date: 2005-09-12.
APPLIED HYDRAULIC SERVICES (273 N CALIFORNIA AVE) : $400,246 in 4 contractsfrom 2002 to 2005
$155,874 with Army for Material Handling Equipment, Nonself-Propelled. Signed on 2005-05-19. Completion date: 2005-04-26.
$155,874 with U.S. Army Corps of Engineers - civil program financing only for Material Handling Equipment, Nonself-Propelled. Signed on 2005-05-19. Completion date: 2005-04-26.
$72,540 with U.S. Army Corps of Engineers - civil program financing only for Maintenance, Repair and Rebuilding of Equipment -- Ships, Small Craft, Pontoons, and Floating Docks. Signed on 2002-08-20. Completion date: 2002-09-30.
$15,958 with U.S. Army Corps of Engineers - civil program financing only for Miscellaneous Items. Signed on 2003-09-22. Completion date: 2003-09-25.
CHICAGO GEAR D O JAMES CORPORA (2823 W FULTON ST; small business) : $359,914 in 17 contractsfrom 2001 to 2006
Contracts for Gears, Pulleys, Sprockets, and Transmission Chain, Cranes and Crane-Shovels, Inspection Services (including commercial testing and lab services, except medical/dental) -- Prefabricated Structures and Scaffolding, Inspection Services (including commercial testing and lab services, except medical/dental) -- Special Industry Machinery, and moreby Defense Logistics Agency, U.S. Army Corps of Engineers - civil program financing only, Army Signed by year:2000: $0; 2001: $57,266; 2002: $4,345; 2003: $79,328; 2004: $54,660; 2005: $98,695; 2006: $65,620.
Biggest contracts:
$76,500 with Defense Logistics Agency for Gears, Pulleys, Sprockets, and Transmission Chain. Signed on 2005-04-09. Completion date: 2005-07-14.
$57,266 with U.S. Army Corps of Engineers - civil program financing only for Cranes and Crane-Shovels. Taking place in MT. Signed on 2001-01-22. Completion date: 2001-03-31.
$41,654 with Defense Logistics Agency for Gears, Pulleys, Sprockets, and Transmission Chain. Signed on 2003-12-23. Completion date: 2004-04-30.
$38,016, same as above.Signed on 2006-03-09. Completion date: 2006-05-14.
RI-DEL MANUFACTURING (1729 WALNUT ST; small business) : $355,158 in 15 contractsfrom 2000 to 2005
Contracts for Refrigeration and Air Conditioning Components, Vehicular Furniture and Accessories by Defense Logistics Agency Signed by year:2000: $94,372; 2001: $0; 2002: $0; 2003: $0; 2004: $72,091; 2005: $188,695; 2006: $0.
Biggest contracts:
$78,400 with Defense Logistics Agency for Refrigeration and Air Conditioning Components. Signed on 2005-02-10. Completion date: 2005-06-30.
$59,290, same as above.Signed on 2004-08-16. Completion date: 2004-11-14.
$55,332, same as above.Signed on 2000-10-06. Completion date: 2001-02-01.
$39,040 with Defense Logistics Agency for Vehicular Furniture and Accessories. Signed on 2000-12-22. Completion date: 2001-03-07.
SHAYDA TECHNOLOGIES INC (2201 W CAMPBELL PARK DRIVE; small business) : $134,226 in 2 contractsfrom 2000 to 2002
$69,301 with Air Force for Other Defense -- Management and Support (R&D). Signed on 2002-05-14. Completion date: 2002-11-21.
$64,925 with Army for Defense Missile and Space Systems -- Advanced Development (R&D). Signed on 2000-05-11. Completion date: 2000-11-11.
BELL & HOWELL DOCUMENT MNGM PR (6800 N MCCORMICK BLVD) : $125,502 in 14 contractsfrom 1999 to 2001
Contracts for Motor Vehicle Maintenance and Repair Shop Specialized Equipment, Maintenance, Repair and Rebuilding of Equipment -- Instruments and Laboratory Equipment, Automated Information System Design and Integration Services, Maintenance, Repair and Rebuilding of Equipment -- Weapons, and moreby Navy, National Oceanic and Atmospheric Administration/Under Secretary for Oceans and Atmosphere, Department of Defense, Army, and others Signed by year:2000: $139,806; 2001: -$73,386; 2002: $0; 2003: $0; 2004: $0; 2005: $0; 2006: $0.
Biggest contracts:
$56,567 with Navy for Motor Vehicle Maintenance and Repair Shop Specialized Equipment. Taking place in CA. Signed on 2000-09-18. Completion date: 2002-09-30.
$36,000 with National Oceanic and Atmospheric Administration/Under Secretary for Oceans and Atmosphere for Maintenance, Repair and Rebuilding of Equipment -- Instruments and Laboratory Equipment. Taking place in CA. Signed on 2001-07-15. Completion date: 2001-08-15.
$32,943 with Department of Defense for Automated Information System Design and Integration Services. Taking place in NC. Signed on 2001-08-27. Completion date: 2002-09-30.
$31,000 with National Oceanic and Atmospheric Administration/Under Secretary for Oceans and Atmosphere for Maintenance, Repair and Rebuilding of Equipment -- Instruments and Laboratory Equipment. Taking place in CA. Signed on 1999-10-15. Completion date: 1999-12-15.
Top industries in this zip code by the number of employees in 2005:
Health Care and Social Assistance: General Medical and Surgical Hospitals (over 1000 employees: 4 establishments)
Accommodation and Food Services: Food Service Contractors (500-999: 1, 20-49: 2, 10-19: 1, 5-9: 2, 1-4: 19)
Health Care and Social Assistance: Offices of Physicians (except Mental Health Specialists) (50-99: 2, 20-49: 7, 10-19: 5, 5-9: 12, 1-4: 23)
Professional, Scientific, and Technical Services: Research and Development in the Physical, Engineering, and Life Sciences (250-499: 1, 20-49: 2, 10-19: 2, 5-9: 1, 1-4: 6)
Administrative and Support and Waste Management and Remediation Services: Temporary Help Services (250-499: 1, 20-49: 1, 1-4: 1)
Administrative and Support and Waste Management and Remediation Services: Security Guards and Patrol Services (250-499: 1, 20-49: 1)
Wholesale Trade: Other Grocery and Related Products Merchant Wholesalers (100-249: 1, 20-49: 2, 10-19: 1, 5-9: 1)
2002 - 2018 National Fire Incident Reporting System (NFIRS) incidents
According to the data from the years 2002 - 2018 the average number of fires per year is 265. The highest number of fires - 542 took place in 2003, and the least - 0 in 2005. The data has a declining trend.
When looking into fire subcategories, the most incidents belonged to: Structure Fires (35.5%), and Outside Fires (31.1%).
Fire incident types reported to NFIRS in Zip Code 60612


 Nearest zip codes: 60622, 60642, 60607, 60624, 60608, 60647.


 According to the data from the years 2002 - 2018 the average number of fires per year is 265. The highest number of fires - 542 took place in 2003, and the least - 0 in 2005. The data has a declining trend.
 When looking into fire subcategories, the most incidents belonged to: Structure Fires (35.5%), and Outside Fires (31.1%).