Estimated zip code population in 2022: 42,191 Zip code population in 2010: 40,603 Zip code population in 2000: 45,096
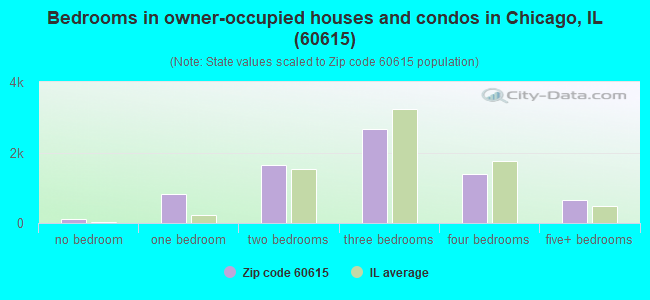
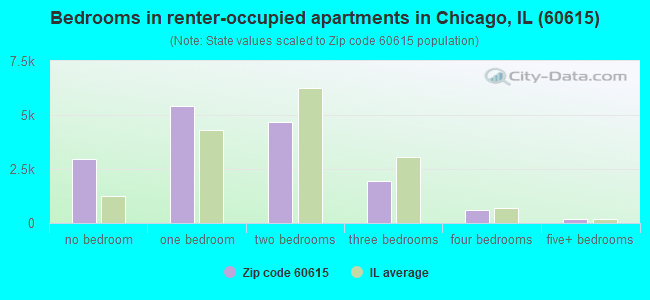
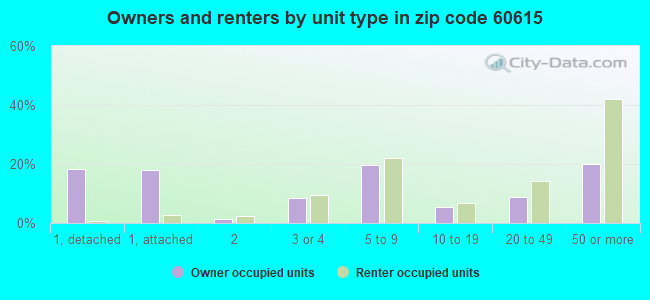
Houses and condos: 25,065 Renter-occupied apartments: 15,513
% of renters here:
68%
State:
33%
March 2022 cost of living index in zip code 60615: 103.7 (near average, U.S. average is 100)
Land area: 2.2 sq. mi. Water area: 0.6 sq. mi.
Population density: 19,069 people per square mile
(very high).
OSM Map
General Map
Google Map
MSN Map
OSM Map
General Map
Google Map
MSN Map
OSM Map
General Map
Google Map
MSN Map
OSM Map
General Map
Google Map
MSN Map
Please wait while loading the map...
Real estate property taxes paid for housing units in 2022:
This zip code:
1.4% ($4,637)
Illinois:
2.0% ($4,912)
Median real estate property taxes paid for housing units with mortgages in 2022: $4,441 (1.3%) Median real estate property taxes paid for housing units with no mortgage in 2022: $5,188 (1.9%)
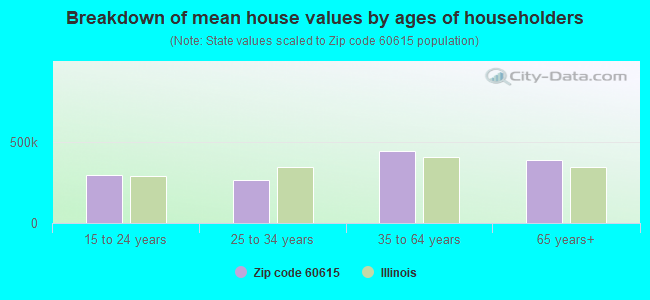
Estimated median house/condo value in 2022: $322,418
60615:
$322,418
Illinois:
$251,600
According to our research of Illinois and other state lists, there were 22 registered sex offenders living in 60615 zip code as of April 27, 2024. The ratio of all residents to sex offenders in zip code 60615 is 1,856 to 1. The ratio of registered sex offenders to all residents in this zip code is lower than the state average.
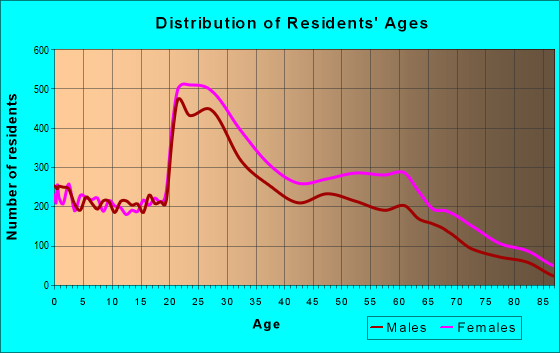
Median resident age:
This zip code:
35.1 years
Illinois median age:
39.1 years
Average household size:
This zip code:
1.8 people
Illinois:
2.4 people
Averages for the 2020 tax year for zip code 60615, filed in 2021:
Average Adjusted Gross Income (AGI) in 2020: $77,236 (Individual Income Tax Returns)
Here:
$77,236
State:
$82,626
Salary/wage: $64,370 (reported on 82.8% of returns)
Here:
$64,370
State:
$66,640
(% of AGI for various income ranges: 1165.8% for AGIs below $25k, 3740.9% for AGIs $25k-50k, 6855.8% for AGIs $50k-75k, 9798.4% for AGIs $75k-100k, 18154.2% for AGIs $100k-200k, 98145.3% for AGIs over 200k)
Taxable interest for individuals: $1,482 (reported on 23.2% of returns)
This zip code:
$1,482
Illinois:
$2,376
(% of AGI for various income ranges: 6.0% for AGIs below $25k, 11.8% for AGIs $25k-50k, 17.6% for AGIs $50k-75k, 42.9% for AGIs $75k-100k, 130.1% for AGIs $100k-200k, 971.8% for AGIs over 200k)
Ordinary dividends: $9,408 (reported on 18.5% of returns)
Here:
$9,408
State:
$9,061
(% of AGI for various income ranges: 15.6% for AGIs below $25k, 28.0% for AGIs $25k-50k, 66.3% for AGIs $50k-75k, 139.1% for AGIs $75k-100k, 493.4% for AGIs $100k-200k, 6423.8% for AGIs over 200k)
Net capital gain/loss in AGI: +$37,581 (reported on 16.5% of returns)
Here:
+$37,581
State:
+$31,684
(% of AGI for various income ranges: 14.3% for AGIs below $25k, 27.7% for AGIs $25k-50k, 76.5% for AGIs $50k-75k, 159.6% for AGIs $75k-100k, 659.5% for AGIs $100k-200k, 29673.2% for AGIs over 200k)
Profit/loss from business: +$9,752 (reported on 21.3% of returns)
Here:
+$9,752
State:
+$12,175
(% of AGI for various income ranges: 49.7% for AGIs below $25k, 7.8% for AGIs $25k-50k, 76.4% for AGIs $50k-75k, 97.9% for AGIs $75k-100k, 485.8% for AGIs $100k-200k, 8085.6% for AGIs over 200k)
Taxable individual retirement arrangement distribution: $22,503 (reported on 5.6% of returns)
60615:
$22,503
Illinois:
$21,613
(% of AGI for various income ranges: 18.7% for AGIs below $25k, 41.0% for AGIs $25k-50k, 102.2% for AGIs $50k-75k, 234.7% for AGIs $75k-100k, 653.7% for AGIs $100k-200k, 2639.4% for AGIs over 200k)
Self-employed (Keogh) retirement plans: $27,100 (reported on 0.8% of returns)
60615:
$27,100
Illinois:
$30,962
(% of AGI for various income ranges: 4.9% for AGIs $25k-50k, 18.9% for AGIs $100k-200k, 1078.2% for AGIs over 200k)
Total itemized deductions: $36,348 (reported on 10.7% of returns)
Here:
$36,348
State:
$34,948
(% of AGI for various income ranges: 25.8% for AGIs below $25k, 101.4% for AGIs $25k-50k, 322.4% for AGIs $50k-75k, 685.2% for AGIs $75k-100k, 1446.5% for AGIs $100k-200k, 10720.9% for AGIs over 200k)
Charity contributions: $17,609 (reported on 9.5% of returns)
Here:
$17,609
State:
$13,122
(% of AGI for various income ranges: 3.6% for AGIs below $25k, 22.9% for AGIs $25k-50k, 89.1% for AGIs $50k-75k, 200.2% for AGIs $75k-100k, 452.9% for AGIs $100k-200k, 6034.4% for AGIs over 200k)
Taxes paid: $7,724 (reported on 10.7% of returns)
60615:
$7,724
State:
$8,563
(% of AGI for various income ranges: 5.3% for AGIs below $25k, 17.9% for AGIs $25k-50k, 79.2% for AGIs $50k-75k, 193.4% for AGIs $75k-100k, 426.0% for AGIs $100k-200k, 1703.5% for AGIs over 200k)
Earned income credit: $2,233 (reported on 19.0% of returns)
Here:
$2,233
State:
$2,311
(% of AGI for various income ranges: 118.5% for AGIs below $25k, 56.3% for AGIs $25k-50k)
Percentage of individuals using paid preparers for their 2020 taxes: 91.0%
Here:
91%
State:
93%
(% for various income ranges: 91.0% for AGIs below $25k, 91.6% for AGIs $25k-50k, 90.6% for AGIs $50k-75k, 88.1% for AGIs $75k-100k, 91.6% for AGIs $100k-200k, 91.7% for AGIs over 200k)
Averages for the 2012 tax year for zip code 60615, filed in 2013:
Average Adjusted Gross Income (AGI) in 2012: $61,719 (Individual Income Tax Returns)
Here:
$61,719
State:
$68,058
Salary/wage: $51,526 (reported on 83.6% of returns)
Here:
$51,526
State:
$55,396
(% of AGI for various income ranges: 76.1% for AGIs below $25k, 86.5% for AGIs $25k-50k, 79.1% for AGIs $50k-75k, 77.9% for AGIs $75k-100k, 71.2% for AGIs $100k-200k, 54.1% for AGIs over 200k)
Taxable interest for individuals: $1,393 (reported on 24.2% of returns)
This zip code:
$1,393
Illinois:
$1,969
(% of AGI for various income ranges: 0.5% for AGIs below $25k, 0.3% for AGIs $25k-50k, 0.3% for AGIs $50k-75k, 0.4% for AGIs $75k-100k, 0.6% for AGIs $100k-200k, 0.8% for AGIs over 200k)
Ordinary dividends: $8,609 (reported on 16.2% of returns)
Here:
$8,609
State:
$7,786
(% of AGI for various income ranges: 0.8% for AGIs below $25k, 0.7% for AGIs $25k-50k, 0.8% for AGIs $50k-75k, 1.2% for AGIs $75k-100k, 2.2% for AGIs $100k-200k, 4.3% for AGIs over 200k)
Net capital gain/loss in AGI: +$30,627 (reported on 11.6% of returns)
Here:
+$30,627
State:
+$22,183
(% of AGI for various income ranges: 0.2% for AGIs below $25k, 0.2% for AGIs $25k-50k, 0.3% for AGIs $50k-75k, 0.4% for AGIs $75k-100k, 1.3% for AGIs $100k-200k, 15.8% for AGIs over 200k)
Profit/loss from business: +$10,256 (reported on 20.6% of returns)
Here:
+$10,256
State:
+$12,903
(% of AGI for various income ranges: 11.7% for AGIs below $25k, 0.4% for AGIs $25k-50k, 1.0% for AGIs $50k-75k, 0.9% for AGIs $75k-100k, 2.4% for AGIs $100k-200k, 5.0% for AGIs over 200k)
Taxable individual retirement arrangement distribution: $21,722 (reported on 6.5% of returns)
60615:
$21,722
Illinois:
$17,929
(% of AGI for various income ranges: 1.2% for AGIs below $25k, 1.1% for AGIs $25k-50k, 1.5% for AGIs $50k-75k, 2.1% for AGIs $75k-100k, 3.0% for AGIs $100k-200k, 3.0% for AGIs over 200k)
Self-employment retirement plans: $26,385 (reported on 0.7% of returns)
60615:
$26,385
Illinois:
$24,666
Total itemized deductions: $27,473 (19% of AGI, reported on 27.4% of returns)
Here:
$27,473
State:
$26,433
Here:
19.0% of AGI
State:
19.2% of AGI
(% of AGI for various income ranges: 4.9% for AGIs below $25k, 7.2% for AGIs $25k-50k, 11.8% for AGIs $50k-75k, 13.7% for AGIs $75k-100k, 15.7% for AGIs $100k-200k, 13.9% for AGIs over 200k)
Charity contributions: $7,116 (reported on 23.4% of returns)
Here:
$7,116
State:
$4,525
(% of AGI for various income ranges: 0.6% for AGIs below $25k, 1.2% for AGIs $25k-50k, 2.4% for AGIs $50k-75k, 2.7% for AGIs $75k-100k, 3.0% for AGIs $100k-200k, 3.8% for AGIs over 200k)
Taxes paid: $10,345 (reported on 27.3% of returns)
60615:
$10,345
State:
$11,968
(% of AGI for various income ranges: 1.2% for AGIs below $25k, 1.8% for AGIs $25k-50k, 3.4% for AGIs $50k-75k, 4.5% for AGIs $75k-100k, 5.9% for AGIs $100k-200k, 6.3% for AGIs over 200k)
Earned income credit: $2,428 (reported on 23.8% of returns)
Here:
$2,428
State:
$2,349
(% of AGI for various income ranges: 9.9% for AGIs below $25k, 0.8% for AGIs $25k-50k)
Percentage of individuals using paid preparers for their 2012 taxes: 44.3%
Here:
44%
State:
57%
(% for various income ranges: 40.0% for AGIs below $25k, 40.0% for AGIs $25k-50k, 47.4% for AGIs $50k-75k, 52.2% for AGIs $75k-100k, 54.6% for AGIs $100k-200k, 66.2% for AGIs over 200k)
Averages for the 2004 tax year for zip code 60615, filed in 2005:
Average Adjusted Gross Income (AGI) in 2004: $49,323 (Individual Income Tax Returns)
Here:
$49,323
State:
$54,625
Salary/wage: $42,642 (reported on 85.2% of returns)
Here:
$42,642
State:
$46,811
(% of AGI for various income ranges: 119.6% for AGIs below $10k, 81.2% for AGIs $10k-25k, 87.8% for AGIs $25k-50k, 82.2% for AGIs $50k-75k, 77.8% for AGIs $75k-100k, 61.5% for AGIs over 100k)
Taxable interest for individuals: $1,491 (reported on 34.8% of returns)
This zip code:
$1,491
Illinois:
$2,101
(% of AGI for various income ranges: 3.2% for AGIs below $10k, 0.8% for AGIs $10k-25k, 0.7% for AGIs $25k-50k, 1.0% for AGIs $50k-75k, 1.1% for AGIs $75k-100k, 1.2% for AGIs over 100k)
Taxable dividends: $5,949 (reported on 20.3% of returns)
Here:
$5,949
State:
$4,306
(% of AGI for various income ranges: 2.6% for AGIs below $10k, 0.8% for AGIs $10k-25k, 0.6% for AGIs $25k-50k, 1.2% for AGIs $50k-75k, 1.7% for AGIs $75k-100k, 4.1% for AGIs over 100k)
Net capital gain/loss: +$12,766 (reported on 15.5% of returns)
Here:
+$12,766
State:
+$17,321
(% of AGI for various income ranges: -0.5% for AGIs below $10k, 0.1% for AGIs $10k-25k, 0.4% for AGIs $25k-50k, 0.4% for AGIs $50k-75k, 1.3% for AGIs $75k-100k, 8.0% for AGIs over 100k)
Profit/loss from business: +$11,482 (reported on 16.0% of returns)
Here:
+$11,482
State:
+$11,771
(% of AGI for various income ranges: 14.4% for AGIs below $10k, 5.0% for AGIs $10k-25k, 1.0% for AGIs $25k-50k, 1.7% for AGIs $50k-75k, 2.3% for AGIs $75k-100k, 5.2% for AGIs over 100k)
Profit/loss from farming: +$5,400 (reported on 0.1% of returns)
Here:
+$5,400
State:
+$2,327
IRA payment deduction: $2,538 (reported on 1.8% of returns)
60615:
$2,538
Illinois:
$3,087
(% of AGI for various income ranges: 0.3% for AGIs below $10k, 0.1% for AGIs $10k-25k, 0.2% for AGIs $25k-50k, 0.1% for AGIs $50k-75k, 0.1% for AGIs $75k-100k, 0.0% for AGIs over 100k)
Self-employed pension: $19,602 (reported on 1.1% of returns)
Here:
$19,602
Illinois:
$16,965
(% of AGI for various income ranges: 0.0% for AGIs $25k-50k, 0.1% for AGIs $50k-75k, 0.2% for AGIs $75k-100k, 0.9% for AGIs over 100k)
Total itemized deductions: $21,123 (20% of AGI, reported on 30.7% of returns)
Here:
$21,123
State:
$20,239
Here:
20.2% of AGI
State:
19.5% of AGI
(% of AGI for various income ranges: 10.2% for AGIs below $10k, 6.3% for AGIs $10k-25k, 10.3% for AGIs $25k-50k, 15.6% for AGIs $50k-75k, 16.5% for AGIs $75k-100k, 14.2% for AGIs over 100k)
Charity contributions deductions: $6,495 (6% of AGI, reported on 25.9% of returns)
Here:
$6,495
State:
$3,719
Here:
5.6% of AGI
State:
3.4% of AGI
(% of AGI for various income ranges: 0.8% for AGIs below $10k, 1.1% for AGIs $10k-25k, 2.2% for AGIs $25k-50k, 3.4% for AGIs $50k-75k, 3.6% for AGIs $75k-100k, 4.4% for AGIs over 100k)
Total tax: $9,821 (reported on 72.2% of returns)
60615:
$9,821
State:
$9,882
(% of AGI for various income ranges: 4.4% for AGIs below $10k, 4.0% for AGIs $10k-25k, 7.4% for AGIs $25k-50k, 11.3% for AGIs $50k-75k, 13.0% for AGIs $75k-100k, 20.8% for AGIs over 100k)
Earned income credit: $1,919 (reported on 22.1% of returns)
Here:
$1,919
State:
$1,788
Percentage of individuals using paid preparers for their 2004 taxes: 50.0%
Here:
50%
State:
61%
(% for various income ranges: 42.1% for AGIs below $10k, 53.1% for AGIs $10k-25k, 48.5% for AGIs $25k-50k, 52.1% for AGIs $50k-75k, 50.6% for AGIs $75k-100k, 61.0% for AGIs over 100k)
Likely homosexual households (counted as self-reported same-sex unmarried-partner households)
Lesbian couples: 0.0% of all households
Gay men: 0.3% of all households
Household received Food Stamps/SNAP in the past 12 months: 4,425 Household did not receive Food Stamps/SNAP in the past 12 months: 18,599
Women who had a birth in the past 12 months: 426 (258 now married, 168 unmarried) Women who did not have a birth in the past 12 months: 12,146 (2,651 now married, 9,572 unmarried)
Housing units in zip code 60615 with a mortgage: 4,472 (241 second mortgage, 15 home equity loan, 123 both second mortgage and home equity loan) Houses without a mortgage: 8
Median monthly owner costs for units with a mortgage: $2,297 Median monthly owner costs for units without a mortgage: $1,177
Residents with income below the poverty level in 2022:
This zip code:
25.5%
Whole state:
11.9%
Residents with income below 50% of the poverty level in 2022:
This zip code:
8.8%
Whole state:
5.7%
Median number of rooms in houses and condos:
Here:
5.9
State:
6.4
Median number of rooms in apartments:
Here:
3.3
State:
4.1
Notable locations in this zip code not listed on our city pages
Notable locations in zip code 60615: Model Yacht Basin (A), Francis S Drexel Fountain (B), Washington Park Plaza (C), Oakland Station (D), Madison Park Station (E), Kenwood Station (F), Hyde Park Station (G), Chicago Fire Department District 5 Station 60 (H), Shoreland Hall (I), Harding Museum (J), Twim Towers (K), A C Buttolph House (L), Albert Wolf House (M), Alonzo M Fuller House (N), Atrium Houses (O), D F Bremner House (P), E D Kimball House (Q), E J Edwards House (R), East Park Towers (S), Edward C Potter House (T). Display/hide their locations on the map
Shopping Centers: Kimbark Plaza Shopping Center (1), Hyde Park Shopping Center (2), Harper Court Shopping Center (3), Dorchester Commons Shopping Center (4). Display/hide their locations on the map
Churches in zip code 60615 include: Ebenezer House of Prayer (A), Celestial Church of Christ (B), Chicago Sinai Congregation (C), Church of God in Christ (D), The Church of Jesus Christ of Latter Day Saints (E), Congregation Rodfei-Zedek (F), Corpus Christi Roman Catholic Church (G), Cosmopolitan Peoples Community Church (H), Isaiah Israel Temple (I). Display/hide their locations on the map
Parks in zip code 60615 include: Nichols Park (1), Drexel Square (2), Kenwood Park (3), Butternut Playlot (4), Jessie 'Ma' Houston Playlot Park (5), George Washington Memorial (6), Willow Park (7), Sycamore Playlot (8), Spruce Park (9). Display/hide their locations on the map
3,006 married couples with children.
2,949 single-parent households (715 men, 2,234 women).
81.2% of residents of 60615 zip code speak English at home.
5.2% of residents speak Spanish at home (67% very well, 30% well, 1% not well, 2% not at all).
5.4% of residents speak other Indo-European language at home (76% very well, 21% well, 2% not well).
5.8% of residents speak Asian or Pacific Island language at home (75% very well, 22% well, 2% not well, 1% not at all).
2.3% of residents speak other language at home (86% very well, 9% well, 4% not well).
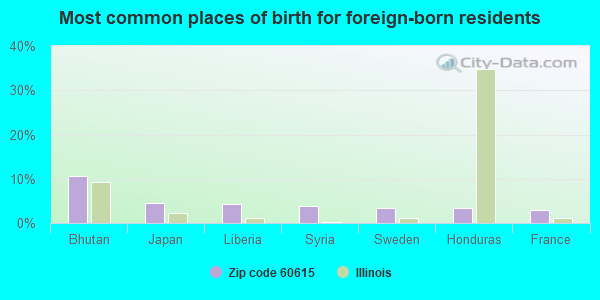
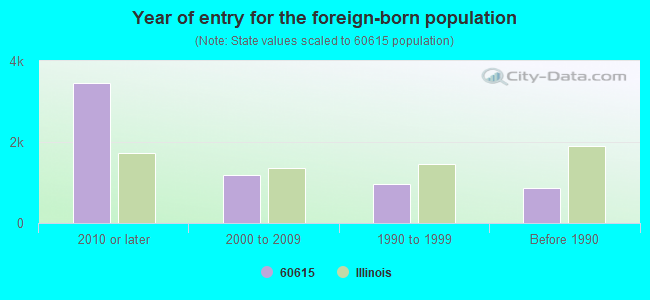
Foreign born population: 5,440 (12.9%) (31.9% of them are naturalized citizens)
Major facilities with environmental interests located in this zip code:
JEAN BAPTISTE DUSABLE H S (4934 S WABASH in CHICAGO, IL)
STATE MASTER (Illinois EPA Project) - HAZARDOUS WASTE PROGRAM (Geographic Names Information System) (National Center for Education Statistics) - STATE ID-1501629900009 Small Quantity Generators, between 100 kg and 1000 kg of hazardous waste/month (Resource Conservation and Recovery Act (tracking hazardous waste)) - notification Organizations: CHICAGO PUBLIC SCHOOLS (CONTACT/OWNER)
, CITY OF CHICAGO SCHOOL DIST 299 (SCHOOL DISTRICT)
Alternative names: DU SABLE
KENWOOD ACADEMY (5015 S BLACKSTONE AVE in CHICAGO, IL)
STATE MASTER (Illinois EPA Project) - SOLID WASTE PROGRAM, HAZARDOUS WASTE PROGRAM COMPLIANCE ACTIVITY (Tracking inspections of insecticide, fungicide, and rodenticide, and toxic substances) (National Center for Education Statistics) - STATE ID-1501629900025 Conditionally Exempt Small Quantity Generators, less than 100 kg/month of hazardous waste (Resource Conservation and Recovery Act (tracking hazardous waste)) - notification Organizations: CHICAGO PUBLIC SCHOOLS (CONTACT/OWNER)
, CITY OF CHICAGO SCHOOL DIST 299 (SCHOOL DISTRICT)
Alternative names: KENWOOD ACADEMY HS
REAVIS (834 E 50TH ST in CHICAGO, IL)
STATE MASTER (Illinois EPA Project) - HAZARDOUS WASTE PROGRAM (National Center for Education Statistics) - STATE ID-1501629902419 Small Quantity Generators, between 100 kg and 1000 kg of hazardous waste/month (Resource Conservation and Recovery Act (tracking hazardous waste)) - notification Organizations: CHICAGO PUBLIC SCHOOLS (CONTACT/OWNER)
, CITY OF CHICAGO SCHOOL DIST 299 (SCHOOL DISTRICT)
Alternative names: REAVIS SCHOOL
OVERTON (221 E 49TH ST in CHICAGO, IL)
STATE MASTER (Illinois EPA Project) - HAZARDOUS WASTE PROGRAM (National Center for Education Statistics) - STATE ID-1501629902388 Small Quantity Generators, between 100 kg and 1000 kg of hazardous waste/month (Resource Conservation and Recovery Act (tracking hazardous waste)) - notification Organizations: CHICAGO PUBLIC SCHOOLS 6WN (CONTACT/OWNER)
, CITY OF CHICAGO SCHOOL DIST 299 (SCHOOL DISTRICT)
Alternative names: OVERTON SCHOOL
MOBIL OIL CORPORATION - 05FME (1330 EAST 53RD ST. in CHICAGO, IL)
STATE MASTER (Illinois EPA Project) - SOLID WASTE PROGRAM, AIR PROGRAM, HAZARDOUS WASTE PROGRAM AIR MINOR (AIRS/AFS) CRITERIA AND HAZARDOUS AIR POLLUTANT INVENTORY (Inventory of air pollution sources) (Resource Conservation and Recovery Act (tracking hazardous waste)) Business SIC classification: GASOLINE SERVICE STATIONS Alternative names: MOBIL OIL CORP SS NO 05 FME
IL ARMY NTL GUARD FMS 14 (5200 COTTAGE GROVE in CHICAGO, IL)
STATE MASTER (Illinois EPA Project) - SOLID WASTE PROGRAM, AIR PROGRAM, HAZARDOUS WASTE PROGRAM AIR MINOR (AIRS/AFS) Large Quantity Generators, more that 1000 kg of hazardous waste/month (Resource Conservation and Recovery Act (tracking hazardous waste)) - notification Business SIC classification: NATIONAL SECURITY Organizations: STATE OF ILLINOIS (CONTACT/OWNER)
Alternative names: DEPT. OF MILITARY AFFAIRS, ILL STATE OF ARNG GEN JONES ARM OMS14&15, MILITARY & NAVAL DEPT
NEWPORT CONDOMINIUM ASSN (4800 S. CHICAGO BEACH DRIVE in CHICAGO, IL)
STATE MASTER (Illinois EPA Project) - AIR PROGRAM, HAZARDOUS WASTE PROGRAM AIR MINOR (AIRS/AFS) CRITERIA AND HAZARDOUS AIR POLLUTANT INVENTORY (Inventory of air pollution sources) Small Quantity Generators, between 100 kg and 1000 kg of hazardous waste/month (Resource Conservation and Recovery Act (tracking hazardous waste)) - notification Business SIC classification: OPERATORS OF APARTMENT BUILDINGS Business NAICS classification: LESSORS OF RESIDENTIAL BUILDINGS AND DWELLINGS. Organizations: NEWPORT CONDOMINIUM ASSOC (CONTACT/OWNER)
Alternative names: NEWPORT CONDO ASSOC
PROVIDENT HOSPITAL OF COOK COUNTY (500 E 51ST in CHICAGO, IL)
STATE MASTER (Illinois EPA Project) - SOLID WASTE PROGRAM, AIR PROGRAM, HAZARDOUS WASTE PROGRAM AIR MINOR (AIRS/AFS) CRITERIA AND HAZARDOUS AIR POLLUTANT INVENTORY (Inventory of air pollution sources) Small Quantity Generators, between 100 kg and 1000 kg of hazardous waste/month (Resource Conservation and Recovery Act (tracking hazardous waste)) - notification Business SIC and NAICS classification: GENERAL MEDICAL AND SURGICAL HOSPITALS Organizations: PROVIDENT MEDICAL CTR (CONTACT/OWNER)
Alternative names: PROVIDENT HOSPITAL COOK COUNTY GOVT, PROVIDENT MEDICAL CTR
CORNELL DRY CLEANERS (1610 E 53RD ST in CHICAGO, IL)
STATE MASTER (Illinois EPA Project) - AIR PROGRAM, HAZARDOUS WASTE PROGRAM AIR MINOR (AIRS/AFS) Small Quantity Generators, between 100 kg and 1000 kg of hazardous waste/month (Resource Conservation and Recovery Act (tracking hazardous waste)) - notification Business SIC classification: DRYCLEANING PLANTS, EXCEPT RUG CLEANING Organizations: RYOU KAP (CONTACT/OWNER)
Alternative names: CORNELL CLEANERS
CHICAGO BAKING CO (40 E GARFIELD BLVD in CHICAGO, IL)
STATE MASTER (Illinois EPA Project) - HAZARDOUS WASTE PROGRAM, AIR PROGRAM AIR MAJOR (AIRS/AFS) CRITERIA AND HAZARDOUS AIR POLLUTANT INVENTORY (Inventory of air pollution sources) Conditionally Exempt Small Quantity Generators, less than 100 kg/month of hazardous waste (Resource Conservation and Recovery Act (tracking hazardous waste)) - notification Business SIC classification: BREAD AND OTHER BAKERY PRODUCTS, EXCEPT COOKIES AND CRACKERS Business NAICS classification: COMMERCIAL BAKERIES. Organizations: INTERSTATE BRAND CORP (CONTACT/OWNER)
Alternative names: INTERSTATE BRAND CORP, LEWIS BAKING COMPANY
CHICAGO TRANSIT AUTHORITY (5201 S COTTAGE GROVE AVE in CHICAGO, IL)
STATE MASTER (Illinois EPA Project) - SOLID WASTE PROGRAM, HAZARDOUS WASTE PROGRAM Large Quantity Generators, more that 1000 kg of hazardous waste/month (Resource Conservation and Recovery Act (tracking hazardous waste)) - notification
4900 DREXEL COOPERATIVE APTS CORP (4914 SOUTH DREXEL in CHICAGO, IL)
STATE MASTER (Illinois EPA Project) - AIR PROGRAM AIR MINOR (AIRS/AFS) Business SIC classification: OPERATORS OF APARTMENT BUILDINGS
CHICAGO PARK DISTRICT (49TH & LAKE SHORE DR in CHICAGO, IL)
STATE MASTER (Illinois EPA Project) - HAZARDOUS WASTE PROGRAM Conditionally Exempt Small Quantity Generators, less than 100 kg/month of hazardous waste (Resource Conservation and Recovery Act (tracking hazardous waste))
Housing units lacking complete plumbing facilities: 0.9% Housing units lacking complete kitchen facilities: 1.7%
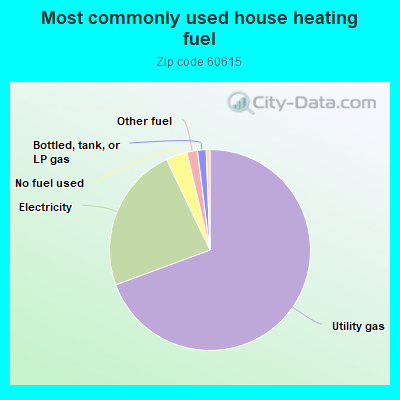
69.3%Utility gas
23.5%Electricity
3.4%No fuel used
1.7%Other fuel
1.4%Bottled, tank, or LP gas
Population in 1990: 44,137. Population change in the 1990s: +959 (+2.2%).
Place of birth for U.S.-born residents:
This state: 23,027
Northeast: 2,874
Midwest: 3,560
South: 4,789
West: 1,861
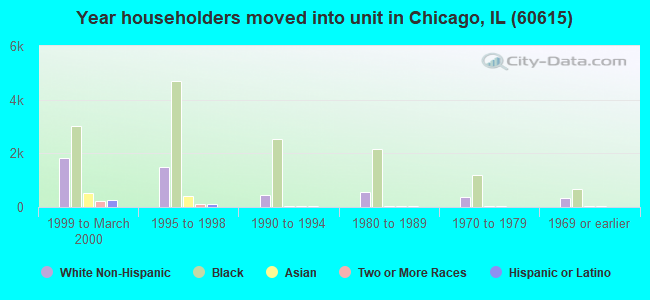
47% of the 60615 zip code residents lived in the same house 5 years ago. Out of people who lived in different houses, 70% lived in this county. Out of people who lived in different counties, 50% lived in Illinois.
83% of the 60615 zip code residents lived in the same house 1 year ago. Out of people who lived in different houses, 65% moved from this county. Out of people who lived in different houses, 3% moved from different county within same state. Out of people who lived in different houses, 22% moved from different state. Out of people who lived in different houses, 9% moved from abroad.
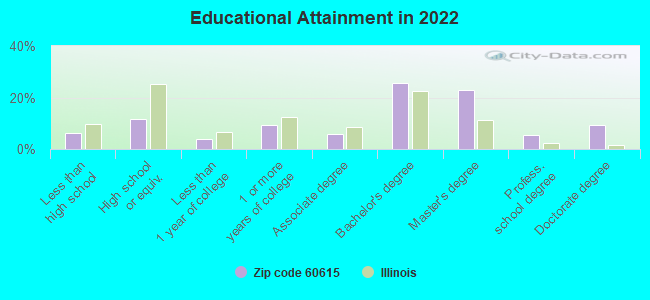
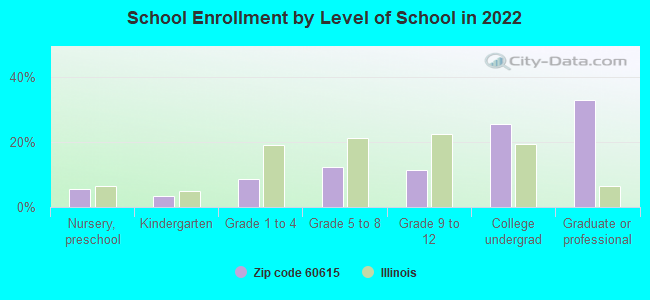
Private vs. public school enrollment:
Students in private schools in grades 1 to 8 (elementary and middle school): 878
Here:
32.4%
Illinois:
13.3%
Students in private schools in grades 9 to 12 (high school): 438
Here:
30.2%
Illinois:
9.9%
Students in private undergraduate colleges: 2,321
Here:
71.9%
Illinois:
27.4%
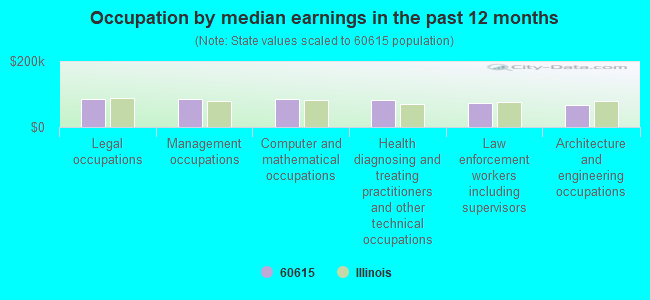
Occupation by median earnings in the past 12 months ($)
84,124Legal occupations
83,640Management occupations
83,486Computer and mathematical occupations
82,878Health diagnosing and treating practitioners and other technical occupations
73,750Law enforcement workers including supervisors
66,646Architecture and engineering occupations
Companies with federal contracts located in this zip code (CHICAGO, IL):
THINKADAPTIVE, INC (5463 S HYDE PARK BLVD APT; small business) : $474,000 in 2 contractsfrom 2004 to 2005
$375,000 with Army for Other Defense -- Applied Research and Exploratory Development (R&D). Signed on 2005-09-21. Completion date: 2007-12-31.
$99,000, same as above.Signed on 2004-04-19. Completion date: 2004-12-19.
CARLOTTA FIGLIULO (5402 EASTVIEW PARK) : $70,000 in 2 contractsfrom 2003 to 2004
$35,000 with Offices, Boards and Divisions (includes Attorney General, Deputy Attorney General, etc.) for Legal Services. Taking place in DC. Signed on 2004-05-27. Completion date: 2005-06-30.
$35,000, same as above.Signed on 2003-06-15. Completion date: 2004-05-15.
CHICAGO BAKING CO (40 E GARFIELD BLVD) : $69,715 in 20 contractsfrom 2004 to 2005
Contracts for Food Items For Resale, Food, Oils and Fats by Defense Commissary Agency, Bureau of Prisoners/Federal Prison System Signed by year:2000: $0; 2001: $0; 2002: $0; 2003: $0; 2004: $17,751; 2005: $51,964; 2006: $0.
Biggest contracts:
$19,762 with Defense Commissary Agency for Food Items For Resale. Signed on 2005-04-01. Completion date: 2005-08-31.
$12,799, same as above.Signed on 2004-10-01. Completion date: 2005-02-28.
$10,702, same as above.Signed on 2005-10-01. Completion date: 2005-12-31.
$4,204, same as above.Signed on 2004-10-01. Completion date: 2005-02-28.
KEIFER, KURT A (5415 S WOODLAWN AVE; small business) : $49,822 in 2 contractsin 2005
$24,976 with Army for ADP Software, Equipment, and Telecommunications Training. Signed on 2005-09-26. Completion date: 2006-09-30.
$24,846 with Army for Programming Services. Signed on 2005-05-18. Completion date: 2006-03-30.
NATHAN, HARVEY A (1350 E 49TH ST; small business) : $2,724 in 3 contractsin 2004
$2,724 with Army for Other Professional Services. Signed on 2004-03-29. Completion date: 2004-03-25.
$2,724 with Army for Legal Services. Signed on 2004-03-23. Completion date: 2004-02-26.
-$2,724, same as above.Signed on 2004-03-29. Completion date: 2004-02-26.
Top industries in this zip code by the number of employees in 2005:
Wholesale Trade: Other Grocery and Related Products Merchant Wholesalers (500-999 employees: 1 establishment)
Health Care and Social Assistance: General Medical and Surgical Hospitals (500-999: 1)
Other Services (except Public Administration): Other Similar Organizations (except Business, Professional, Labor, and Political Organizations) (20-49: 1, 10-19: 11, 5-9: 10, 1-4: 33)
2002 - 2018 National Fire Incident Reporting System (NFIRS) incidents
According to the data from the years 2002 - 2018 the average number of fires per year is 162. The highest number of fires - 299 took place in 2015, and the least - 0 in 2005. The data has a rising trend.
When looking into fire subcategories, the most incidents belonged to: Structure Fires (49.9%), and Outside Fires (20.7%).
Fire incident types reported to NFIRS in Zip Code 60615


 Nearest zip codes: 60637, 60653, 60649, 60621, 60616, 60619.
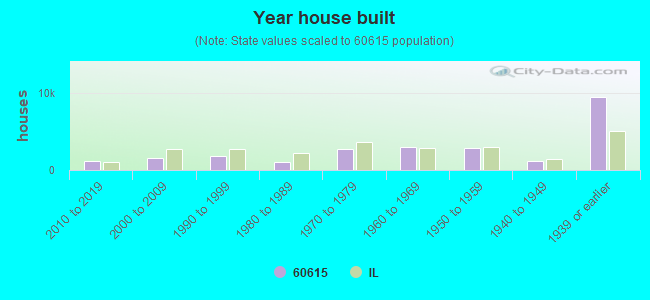


 According to the data from the years 2002 - 2018 the average number of fires per year is 162. The highest number of fires - 299 took place in 2015, and the least - 0 in 2005. The data has a rising trend.
 When looking into fire subcategories, the most incidents belonged to: Structure Fires (49.9%), and Outside Fires (20.7%).