Estimated zip code population in 2022: 49,452 Zip code population in 2010: 46,650 Zip code population in 2000: 54,823
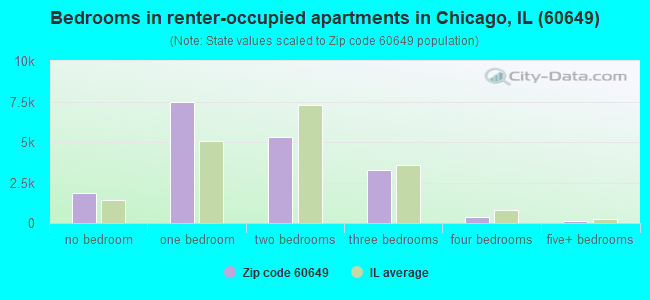
Houses and condos: 28,450 Renter-occupied apartments: 18,271
% of renters here:
75%
State:
33%
March 2022 cost of living index in zip code 60649: 101.7 (near average, U.S. average is 100)
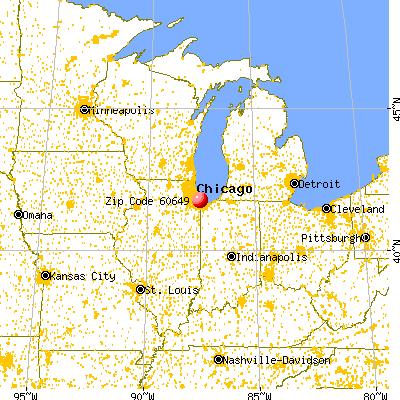
Land area: 2.9 sq. mi. Water area: 1.0 sq. mi.
Population density: 16,887 people per square mile
(very high).
OSM Map
General Map
Google Map
MSN Map
OSM Map
General Map
Google Map
MSN Map
OSM Map
General Map
Google Map
MSN Map
OSM Map
General Map
Google Map
MSN Map
Please wait while loading the map...
Real estate property taxes paid for housing units in 2022:
This zip code:
1.2% ($2,429)
Illinois:
2.0% ($4,912)
Median real estate property taxes paid for housing units with mortgages in 2022: $2,723 (1.1%) Median real estate property taxes paid for housing units with no mortgage in 2022: $2,217 (1.8%)
Averages for the 2020 tax year for zip code 60649, filed in 2021:
Average Adjusted Gross Income (AGI) in 2020: $39,346 (Individual Income Tax Returns)
Here:
$39,346
State:
$82,626
Salary/wage: $36,332 (reported on 82.4% of returns)
Here:
$36,332
State:
$66,640
(% of AGI for various income ranges: 1071.3% for AGIs below $25k, 3541.9% for AGIs $25k-50k, 6702.1% for AGIs $50k-75k, 9502.1% for AGIs $75k-100k, 17024.6% for AGIs $100k-200k, 67132.5% for AGIs over 200k)
Taxable interest for individuals: $571 (reported on 8.5% of returns)
This zip code:
$571
Illinois:
$2,376
(% of AGI for various income ranges: 2.2% for AGIs below $25k, 4.3% for AGIs $25k-50k, 6.2% for AGIs $50k-75k, 16.3% for AGIs $75k-100k, 39.6% for AGIs $100k-200k, 167.5% for AGIs over 200k)
Ordinary dividends: $3,117 (reported on 4.8% of returns)
Here:
$3,117
State:
$9,061
(% of AGI for various income ranges: 2.3% for AGIs below $25k, 7.6% for AGIs $25k-50k, 16.7% for AGIs $50k-75k, 26.4% for AGIs $75k-100k, 106.3% for AGIs $100k-200k, 1631.2% for AGIs over 200k)
Net capital gain/loss in AGI: +$6,491 (reported on 4.1% of returns)
Here:
+$6,491
State:
+$31,684
(% of AGI for various income ranges: 1.7% for AGIs below $25k, 6.9% for AGIs $25k-50k, 11.7% for AGIs $50k-75k, 103.4% for AGIs $75k-100k, 209.3% for AGIs $100k-200k, 3287.5% for AGIs over 200k)
Profit/loss from business: +$2,120 (reported on 21.5% of returns)
Here:
+$2,120
State:
+$12,175
(% of AGI for various income ranges: 55.6% for AGIs below $25k, 32.1% for AGIs $50k-75k, 79.7% for AGIs $75k-100k, 230.9% for AGIs $100k-200k, 4713.8% for AGIs over 200k)
Taxable individual retirement arrangement distribution: $15,087 (reported on 3.0% of returns)
60649:
$15,087
Illinois:
$21,613
(% of AGI for various income ranges: 12.6% for AGIs below $25k, 20.2% for AGIs $25k-50k, 81.0% for AGIs $50k-75k, 97.5% for AGIs $75k-100k, 504.1% for AGIs $100k-200k, 2698.8% for AGIs over 200k)
Self-employed (Keogh) retirement plans: $17,250 (reported on 0.1% of returns)
60649:
$17,250
Illinois:
$30,962
(% of AGI for various income ranges: 4.9% for AGIs below $25k)
Total itemized deductions: $27,470 (reported on 6.2% of returns)
Here:
$27,470
State:
$34,948
(% of AGI for various income ranges: 18.1% for AGIs below $25k, 101.1% for AGIs $25k-50k, 375.9% for AGIs $50k-75k, 816.1% for AGIs $75k-100k, 1756.5% for AGIs $100k-200k, 7306.2% for AGIs over 200k)
Charity contributions: $11,084 (reported on 5.4% of returns)
Here:
$11,084
State:
$13,122
(% of AGI for various income ranges: 3.6% for AGIs below $25k, 27.6% for AGIs $25k-50k, 113.1% for AGIs $50k-75k, 260.4% for AGIs $75k-100k, 701.3% for AGIs $100k-200k, 3251.3% for AGIs over 200k)
Taxes paid: $6,049 (reported on 6.1% of returns)
60649:
$6,049
State:
$8,563
(% of AGI for various income ranges: 2.9% for AGIs below $25k, 17.6% for AGIs $25k-50k, 74.5% for AGIs $50k-75k, 203.1% for AGIs $75k-100k, 455.4% for AGIs $100k-200k, 1407.5% for AGIs over 200k)
Earned income credit: $2,571 (reported on 35.2% of returns)
Here:
$2,571
State:
$2,311
(% of AGI for various income ranges: 172.5% for AGIs below $25k, 89.9% for AGIs $25k-50k)
Percentage of individuals using paid preparers for their 2020 taxes: 91.5%
Here:
91%
State:
93%
(% for various income ranges: 92.8% for AGIs below $25k, 92.1% for AGIs $25k-50k, 87.6% for AGIs $50k-75k, 88.0% for AGIs $75k-100k, 88.1% for AGIs $100k-200k, 90.5% for AGIs over 200k)
Averages for the 2012 tax year for zip code 60649, filed in 2013:
Average Adjusted Gross Income (AGI) in 2012: $33,469 (Individual Income Tax Returns)
Here:
$33,469
State:
$68,058
Salary/wage: $31,335 (reported on 80.4% of returns)
Here:
$31,335
State:
$55,396
(% of AGI for various income ranges: 71.3% for AGIs below $25k, 85.1% for AGIs $25k-50k, 77.1% for AGIs $50k-75k, 77.5% for AGIs $75k-100k, 69.5% for AGIs $100k-200k, 56.1% for AGIs over 200k)
Taxable interest for individuals: $557 (reported on 10.7% of returns)
This zip code:
$557
Illinois:
$1,969
(% of AGI for various income ranges: 0.1% for AGIs below $25k, 0.1% for AGIs $25k-50k, 0.2% for AGIs $50k-75k, 0.2% for AGIs $75k-100k, 0.3% for AGIs $100k-200k, 0.4% for AGIs over 200k)
Ordinary dividends: $1,960 (reported on 5.4% of returns)
Here:
$1,960
State:
$7,786
(% of AGI for various income ranges: 0.1% for AGIs below $25k, 0.2% for AGIs $25k-50k, 0.2% for AGIs $50k-75k, 0.3% for AGIs $75k-100k, 0.5% for AGIs $100k-200k, 1.4% for AGIs over 200k)
Net capital gain/loss in AGI: +$2,158 (reported on 3.2% of returns)
Here:
+$2,158
State:
+$22,183
(% of AGI for various income ranges: 0.2% for AGIs $75k-100k, 0.6% for AGIs $100k-200k, 1.4% for AGIs over 200k)
Profit/loss from business: +$6,691 (reported on 21.7% of returns)
Here:
+$6,691
State:
+$12,903
(% of AGI for various income ranges: 16.3% for AGIs below $25k, 0.2% for AGIs $50k-75k, 1.0% for AGIs $75k-100k, 1.6% for AGIs $100k-200k, 5.4% for AGIs over 200k)
Taxable individual retirement arrangement distribution: $13,510 (reported on 3.9% of returns)
60649:
$13,510
Illinois:
$17,929
(% of AGI for various income ranges: 0.8% for AGIs below $25k, 1.0% for AGIs $25k-50k, 1.9% for AGIs $50k-75k, 1.4% for AGIs $75k-100k, 3.2% for AGIs $100k-200k, 2.4% for AGIs over 200k)
Self-employment retirement plans: $28,100 (reported on 0.1% of returns)
60649:
$28,100
Illinois:
$24,666
Total itemized deductions: $19,492 (26% of AGI, reported on 18.4% of returns)
Here:
$19,492
State:
$26,433
Here:
25.5% of AGI
State:
19.2% of AGI
(% of AGI for various income ranges: 4.0% for AGIs below $25k, 8.5% for AGIs $25k-50k, 13.4% for AGIs $50k-75k, 15.7% for AGIs $75k-100k, 15.6% for AGIs $100k-200k, 15.5% for AGIs over 200k)
Charity contributions: $4,908 (reported on 15.5% of returns)
Here:
$4,908
State:
$4,525
(% of AGI for various income ranges: 0.5% for AGIs below $25k, 1.8% for AGIs $25k-50k, 3.2% for AGIs $50k-75k, 3.8% for AGIs $75k-100k, 3.5% for AGIs $100k-200k, 2.7% for AGIs over 200k)
Taxes paid: $5,488 (reported on 18.2% of returns)
60649:
$5,488
State:
$11,968
(% of AGI for various income ranges: 0.8% for AGIs below $25k, 1.9% for AGIs $25k-50k, 3.4% for AGIs $50k-75k, 4.6% for AGIs $75k-100k, 5.3% for AGIs $100k-200k, 5.6% for AGIs over 200k)
Earned income credit: $2,755 (reported on 41.1% of returns)
Here:
$2,755
State:
$2,349
(% of AGI for various income ranges: 14.1% for AGIs below $25k, 1.4% for AGIs $25k-50k)
Percentage of individuals using paid preparers for their 2012 taxes: 50.8%
Here:
51%
State:
57%
(% for various income ranges: 48.0% for AGIs below $25k, 50.3% for AGIs $25k-50k, 56.3% for AGIs $50k-75k, 61.7% for AGIs $75k-100k, 63.9% for AGIs $100k-200k, 75.0% for AGIs over 200k)
Averages for the 2004 tax year for zip code 60649, filed in 2005:
Average Adjusted Gross Income (AGI) in 2004: $29,609 (Individual Income Tax Returns)
Here:
$29,609
State:
$54,625
Salary/wage: $28,841 (reported on 86.2% of returns)
Here:
$28,841
State:
$46,811
(% of AGI for various income ranges: 100.7% for AGIs below $10k, 81.7% for AGIs $10k-25k, 89.1% for AGIs $25k-50k, 85.9% for AGIs $50k-75k, 78.6% for AGIs $75k-100k, 71.1% for AGIs over 100k)
Taxable interest for individuals: $842 (reported on 17.9% of returns)
This zip code:
$842
Illinois:
$2,101
(% of AGI for various income ranges: 1.2% for AGIs below $10k, 0.3% for AGIs $10k-25k, 0.3% for AGIs $25k-50k, 0.6% for AGIs $50k-75k, 0.4% for AGIs $75k-100k, 1.1% for AGIs over 100k)
Taxable dividends: $1,084 (reported on 7.0% of returns)
Here:
$1,084
State:
$4,306
(% of AGI for various income ranges: 0.3% for AGIs below $10k, 0.1% for AGIs $10k-25k, 0.1% for AGIs $25k-50k, 0.2% for AGIs $50k-75k, 0.3% for AGIs $75k-100k, 0.8% for AGIs over 100k)
Net capital gain/loss: +$7,119 (reported on 4.5% of returns)
Here:
+$7,119
State:
+$17,321
(% of AGI for various income ranges: -0.3% for AGIs below $10k, 0.1% for AGIs $10k-25k, 0.0% for AGIs $25k-50k, 0.4% for AGIs $50k-75k, 1.1% for AGIs $75k-100k, 6.2% for AGIs over 100k)
Profit/loss from business: +$4,888 (reported on 14.8% of returns)
Here:
+$4,888
State:
+$11,771
(% of AGI for various income ranges: 21.6% for AGIs below $10k, 7.1% for AGIs $10k-25k, 0.1% for AGIs $25k-50k, 0.3% for AGIs $50k-75k, 1.1% for AGIs $75k-100k, 1.8% for AGIs over 100k)
IRA payment deduction: $1,802 (reported on 1.0% of returns)
60649:
$1,802
Illinois:
$3,087
(% of AGI for various income ranges: 0.1% for AGIs below $10k, 0.1% for AGIs $10k-25k, 0.1% for AGIs $25k-50k, 0.1% for AGIs $50k-75k, 0.1% for AGIs $75k-100k)
Self-employed pension: $15,810 (reported on 0.1% of returns)
Here:
$15,810
Illinois:
$16,965
Total itemized deductions: $16,671 (28% of AGI, reported on 21.5% of returns)
Here:
$16,671
State:
$20,239
Here:
28.4% of AGI
State:
19.5% of AGI
(% of AGI for various income ranges: 6.6% for AGIs below $10k, 5.2% for AGIs $10k-25k, 12.1% for AGIs $25k-50k, 16.4% for AGIs $50k-75k, 17.2% for AGIs $75k-100k, 13.4% for AGIs over 100k)
Charity contributions deductions: $4,532 (8% of AGI, reported on 19.7% of returns)
Here:
$4,532
State:
$3,719
Here:
7.6% of AGI
State:
3.4% of AGI
(% of AGI for various income ranges: 0.7% for AGIs below $10k, 1.0% for AGIs $10k-25k, 2.8% for AGIs $25k-50k, 4.5% for AGIs $50k-75k, 4.6% for AGIs $75k-100k, 3.7% for AGIs over 100k)
Total tax: $4,132 (reported on 61.8% of returns)
60649:
$4,132
State:
$9,882
(% of AGI for various income ranges: 4.2% for AGIs below $10k, 3.1% for AGIs $10k-25k, 6.1% for AGIs $25k-50k, 10.3% for AGIs $50k-75k, 12.2% for AGIs $75k-100k, 18.7% for AGIs over 100k)
Earned income credit: $2,170 (reported on 40.4% of returns)
Here:
$2,170
State:
$1,788
Percentage of individuals using paid preparers for their 2004 taxes: 63.1%
Here:
63%
State:
61%
(% for various income ranges: 61.7% for AGIs below $10k, 68.2% for AGIs $10k-25k, 59.3% for AGIs $25k-50k, 60.4% for AGIs $50k-75k, 61.0% for AGIs $75k-100k, 66.5% for AGIs over 100k)
Likely homosexual households (counted as self-reported same-sex unmarried-partner households)
Lesbian couples: 0.3% of all households
Gay men: 0.2% of all households
Household received Food Stamps/SNAP in the past 12 months: 10,173 Household did not receive Food Stamps/SNAP in the past 12 months: 15,165
Women who had a birth in the past 12 months: 609 (184 now married, 428 unmarried) Women who did not have a birth in the past 12 months: 12,437 (2,007 now married, 10,535 unmarried)
Housing units in zip code 60649 with a mortgage: 3,590 (270 second mortgage, 30 home equity loan, 171 both second mortgage and home equity loan) Houses without a mortgage: 61
Median monthly owner costs for units with a mortgage: $1,712 Median monthly owner costs for units without a mortgage: $673
Residents with income below the poverty level in 2022:
This zip code:
31.0%
Whole state:
11.9%
Residents with income below 50% of the poverty level in 2022:
This zip code:
14.4%
Whole state:
5.7%
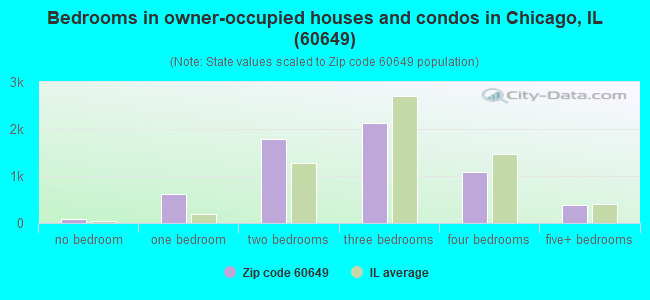
Median number of rooms in houses and condos:
Here:
5.9
State:
6.4
Median number of rooms in apartments:
Here:
4.0
State:
4.1
Notable locations in this zip code not listed on our city pages
Notable locations in zip code 60649: Jackson Park Yacht Club (A), Jackson Park Motor Boat Club (B), Beach and Tennis Club of Chicago (C), South Kenwood Station (D), South Shore Yacht Club (E), Parkside Station (F), South Water Purification Plant (G), South Shore Country Club (H), Chicago Fire Department District 5 Station 126 (I), South Shore Cultural Center (J), Allan Miller House (K), East Seventyfirst Street Building (L), New Regal Theatre (M), Chicago Engine Company 126 (N). Display/hide their locations on the map
Churches in zip code 60649 include: Bryn Mawr Community Church (A), Ivy Pentecostal Church of God in Christ (B), Miracle Temple Church (C), House of Prayer and Healing Apostolic Faith Church (D), Saint Brides Roman Catholic Church (E), Saint James Evangelical Community Church (F), Saint Joseph House of Candle Spiritual Church (G), Saint Luke Baptist Church (H), Saint Margarets Episcopal Church (I). Display/hide their locations on the map
Parks in zip code 60649 include: Rainbow Park (1), Jeffrey - Cyril Historic District (2), South Shore Park (3), Hodes Park (4), Woodhull Park (5), Rocky Ledge Park (6), Rosenblum Park (7). Display/hide their locations on the map
1,884 married couples with children.
6,993 single-parent households (1,082 men, 5,911 women).
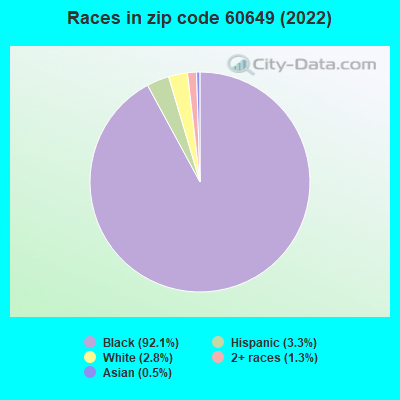
93.7% of residents of 60649 zip code speak English at home.
2.8% of residents speak Spanish at home (67% very well, 5% well, 15% not well, 13% not at all).
1.8% of residents speak other Indo-European language at home (40% very well, 49% well, 11% not well).
0.2% of residents speak Asian or Pacific Island language at home (68% very well, 32% well).
1.1% of residents speak other language at home (81% very well, 8% well, 11% not well).
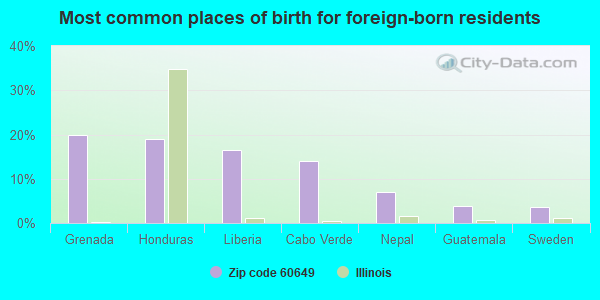
Foreign born population: 2,215 (4.5%) (50.1% of them are naturalized citizens)
Major facilities with environmental interests located in this zip code:
CHICAGO SOUTH WTP (3300 EAST CHELTENHAM PLACE in CHICAGO, IL)
STATE MASTER (Illinois EPA Project) - SOLID WASTE PROGRAM, AIR PROGRAM, HAZARDOUS WASTE PROGRAM STATE MASTER (Illinois EPA Project) - National Pollutant Discharge Elimination System Permit AIR MINOR (AIRS/AFS) CRITERIA AND HAZARDOUS AIR POLLUTANT INVENTORY (Inventory of air pollution sources) National Pollutant Discharge Elimination System NON-MAJOR (Tracking pollutant discharge elimination systems) - permit Business SIC and NAICS classification: WATER SUPPLY Alternative names: CHICAGO SOUTH WATER FILTRATION PLANT, CHICAGO SOUTH WTP, CITY OF, CITY OF CHICAGO-DEPT. OF WATER, SOUTH WATER PURIFICATION PLANT SWPP
PRAIRIE CLEANERS (1908 EAST 73RD STREET in CHICAGO, IL)
STATE MASTER (Illinois EPA Project) - AIR PROGRAM AIR MINOR (AIRS/AFS) CRITERIA AND HAZARDOUS AIR POLLUTANT INVENTORY (Inventory of air pollution sources) Business SIC classification: DRYCLEANING PLANTS, EXCEPT RUG CLEANING Business NAICS classification: DRYCLEANING AND LAUNDRY SERVICES (EXCEPT COIN-OPERATED).
LEE S DH CLEANERS (7857 SOUTH YATES AVENUE in CHICAGO, IL)
STATE MASTER (Illinois EPA Project) - AIR PROGRAM STATE MASTER (Illinois EPA Project) - SOLID WASTE PROGRAM, HAZARDOUS WASTE PROGRAM AIR MINOR (AIRS/AFS) Conditionally Exempt Small Quantity Generators, less than 100 kg/month of hazardous waste (Resource Conservation and Recovery Act (tracking hazardous waste)) Business SIC classification: DRYCLEANING PLANTS, EXCEPT RUG CLEANING Organizations: YOUNG KI CHUNG (CONTACT/OPERATOR)
Alternative names: DELANEY HEALD CLEANERS, LEES DH CLEANERS, LEES DRY CLEANERS
PARKSIDE (6938 S EAST END in CHICAGO, IL)
STATE MASTER (Illinois EPA Project) - HAZARDOUS WASTE PROGRAM (National Center for Education Statistics) - STATE ID-1501629902395 Small Quantity Generators, between 100 kg and 1000 kg of hazardous waste/month (Resource Conservation and Recovery Act (tracking hazardous waste)) - notification Organizations: CHICAGO PUBLIC SCHOOLS (CONTACT/OWNER)
, CITY OF CHICAGO SCHOOL DIST 299 (SCHOOL DISTRICT)
Alternative names: PARKSIDE SCHOOL
MYRA BRADWELL SCHOOL (7736 S BURNHAM in CHICAGO, IL)
STATE MASTER (Illinois EPA Project) - HAZARDOUS WASTE PROGRAM (National Center for Education Statistics) - STATE ID-1501629902090 Small Quantity Generators, between 100 kg and 1000 kg of hazardous waste/month (Resource Conservation and Recovery Act (tracking hazardous waste)) - notification Organizations: CHICAGO PUBLIC SCHOOLS (CONTACT/OWNER)
, CITY OF CHICAGO SCHOOL DIST 299 (SCHOOL DISTRICT)
O KEEFE SCHOOL (6940 S MERRILL in CHICAGO, IL)
STATE MASTER (Illinois EPA Project) - AIR PROGRAM, HAZARDOUS WASTE PROGRAM AIR MINOR (AIRS/AFS) CRITERIA AND HAZARDOUS AIR POLLUTANT INVENTORY (Inventory of air pollution sources) Small Quantity Generators, between 100 kg and 1000 kg of hazardous waste/month (Resource Conservation and Recovery Act (tracking hazardous waste)) - notification Business SIC and NAICS classification: ELEMENTARY AND SECONDARY SCHOOLS Organizations: CHICAGO PUBLIC SCHOOLS (CONTACT/OWNER)
Alternative names: CHICAGO BOARD OF EDUCATION, OKEEFE SCHOOL, OKEEFE SCHOOL CHGO BOARD ED
OAK CLEANERS INC (2708 EAST 75TH STREET in CHICAGO, IL)
STATE MASTER (Illinois EPA Project) - AIR PROGRAM, HAZARDOUS WASTE PROGRAM AIR MINOR (AIRS/AFS) Small Quantity Generators, between 100 kg and 1000 kg of hazardous waste/month (Resource Conservation and Recovery Act (tracking hazardous waste)) - notification Business SIC classification: DRYCLEANING PLANTS, EXCEPT RUG CLEANING Organizations: WRIGHT DALE (CONTACT/OWNER)
Alternative names: GORIL INCORPORATED D B A OAK CLEANERS
LA FRANCE CLEANERS (2149 E. 75TH ST. in CHICAGO, IL)
STATE MASTER (Illinois EPA Project) - AIR PROGRAM, HAZARDOUS WASTE PROGRAM AIR MINOR (AIRS/AFS) Small Quantity Generators, between 100 kg and 1000 kg of hazardous waste/month (Resource Conservation and Recovery Act (tracking hazardous waste)) - notification Business SIC classification: DRYCLEANING PLANTS, EXCEPT RUG CLEANING Organizations: BARTH MICHAEL (CONTACT/OWNER)
CITY CLEANERS (7159 S STONY ISLAND in CHICAGO, IL)
STATE MASTER (Illinois EPA Project) - AIR PROGRAM, HAZARDOUS WASTE PROGRAM AIR MINOR (AIRS/AFS) Small Quantity Generators, between 100 kg and 1000 kg of hazardous waste/month (Resource Conservation and Recovery Act (tracking hazardous waste)) - notification Business SIC classification: DRYCLEANING PLANTS, EXCEPT RUG CLEANING Organizations: CATLEDGE JAMES (CONTACT/OWNER)
ADA MCKINLEY COMMUNITY SVC (7222 S EXCHANGE AVE in CHICAGO, IL)
STATE MASTER (Illinois EPA Project) - SOLID WASTE PROGRAM (Resource Conservation and Recovery Act (tracking hazardous waste)) Organizations: MCKINLEY ADA COMMUNITY SVCS (CONTACT/OWNER)
Alternative names: MCKINLEY ADA COMMUNITY SVCS
MOBIL OIL CORP (6700 S JEFFERY AND 67TH ST in CHICAGO, IL)
STATE MASTER (Illinois EPA Project) - SOLID WASTE PROGRAM, AIR PROGRAM, HAZARDOUS WASTE PROGRAM AIR MAJOR (AIRS/AFS) CRITERIA AND HAZARDOUS AIR POLLUTANT INVENTORY (Inventory of air pollution sources) Small Quantity Generators, between 100 kg and 1000 kg of hazardous waste/month (Resource Conservation and Recovery Act (tracking hazardous waste)) - notification Business SIC classification: GASOLINE SERVICE STATIONS Organizations: MOBIL OIL CORPORATION (CONTACT/OWNER)
Alternative names: MOBIL OIL CORP SS BDR
AMERICAN DRY CLEANING CORP (6945 S STONEY ISLAND in CHICAGO, IL)
STATE MASTER (Illinois EPA Project) - HAZARDOUS WASTE PROGRAM (Resource Conservation and Recovery Act (tracking hazardous waste)) Organizations: LANGSTON LEONARD (CONTACT/OWNER)
DELANEY HEALD CO (7159 STONY ISLAND AVENUE in CHICAGO, IL)
STATE MASTER (Illinois EPA Project) - AIR PROGRAM AIR MINOR (AIRS/AFS) Business SIC classification: DRYCLEANING PLANTS, EXCEPT RUG CLEANING
Housing units lacking complete plumbing facilities: 1.9% Housing units lacking complete kitchen facilities: 2.7%
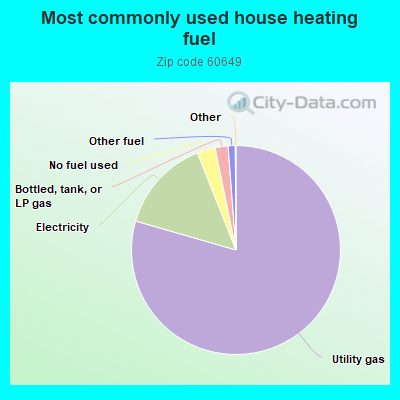
79.4%Utility gas
14.5%Electricity
2.8%No fuel used
2.0%Bottled, tank, or LP gas
1.1%Other fuel
Population in 1990: 54,795. Population change in the 1990s: +28 (+0.1%).
Place of birth for U.S.-born residents:
This state: 40,205
Northeast: 472
Midwest: 1,615
South: 4,111
West: 431
53% of the 60649 zip code residents lived in the same house 5 years ago. Out of people who lived in different houses, 91% lived in this county. Out of people who lived in different counties, 50% lived in Illinois.
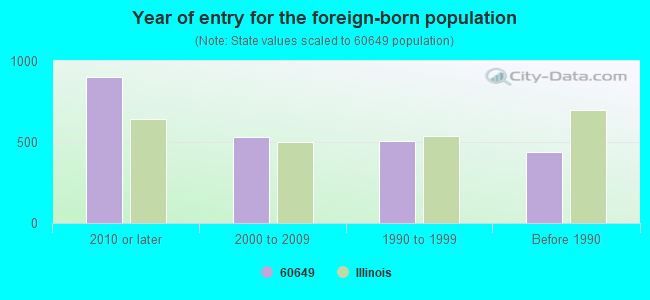
86% of the 60649 zip code residents lived in the same house 1 year ago. Out of people who lived in different houses, 83% moved from this county. Out of people who lived in different houses, 2% moved from different county within same state. Out of people who lived in different houses, 9% moved from different state. Out of people who lived in different houses, 2% moved from abroad.
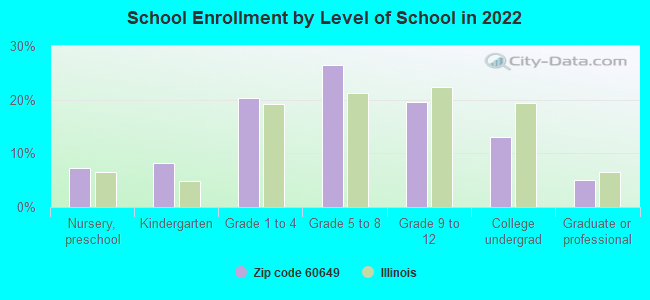
Private vs. public school enrollment:
Students in private schools in grades 1 to 8 (elementary and middle school): 556
Here:
11.8%
Illinois:
13.3%
Students in private schools in grades 9 to 12 (high school): 107
Here:
5.4%
Illinois:
9.9%
Students in private undergraduate colleges: 249
Here:
18.8%
Illinois:
27.4%
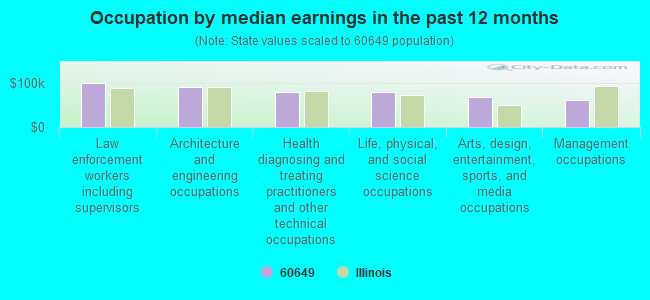
Occupation by median earnings in the past 12 months ($)
99,127Law enforcement workers including supervisors
89,606Architecture and engineering occupations
79,482Health diagnosing and treating practitioners and other technical occupations
77,736Life, physical, and social science occupations
67,773Arts, design, entertainment, sports, and media occupations
60,737Management occupations
Companies with federal contracts located in this zip code:
KGEE INC (6730 S SHORE DR STE 1201 in CHICAGO, IL; small business) : $45,320 in 10 contractsfrom 2005 to 2006
Contracts for Coils and Transformers, Refrigeration and Air Conditioning Components, Valves, Powered, Electrical and Electronic assemblies, Boards, Cards, and Associated Hardware, and moreby Defense Logistics Agency Signed by year:2000: $0; 2001: $0; 2002: $0; 2003: $0; 2004: $0; 2005: $15,764; 2006: $29,556.
Biggest contracts:
$7,961 with Defense Logistics Agency for Coils and Transformers. Signed on 2006-02-03. Completion date: 2006-03-12.
$6,800 with Defense Logistics Agency for Refrigeration and Air Conditioning Components. Signed on 2005-10-04. Completion date: 2005-11-04.
$5,775 with Defense Logistics Agency for Valves, Powered. Taking place in NY. Signed on 2006-02-22. Completion date: 2006-03-23.
$5,144 with Defense Logistics Agency for Electrical and Electronic assemblies, Boards, Cards, and Associated Hardware. Signed on 2006-05-19. Completion date: 2006-06-21.
Top industries in this zip code by the number of employees in 2005:
Health Care and Social Assistance: General Medical and Surgical Hospitals (500-999 employees: 1 establishment, 250-499 employees: 1 establishment)
Health Care and Social Assistance: Nursing Care Facilities (250-499: 1, 100-249: 3)
2002 - 2018 National Fire Incident Reporting System (NFIRS) incidents
Based on the data from the years 2002 - 2018 the average number of fires per year is 228. The highest number of fire incidents - 371 took place in 2016, and the least - 0 in 2005. The data has a decreasing trend.
When looking into fire subcategories, the most reports belonged to: Structure Fires (53.3%), and Outside Fires (21.0%).
Fire incident types reported to NFIRS in Zip Code 60649


 Nearest zip codes: 60637, 60619, 60617, 60615, 60653, 60621.
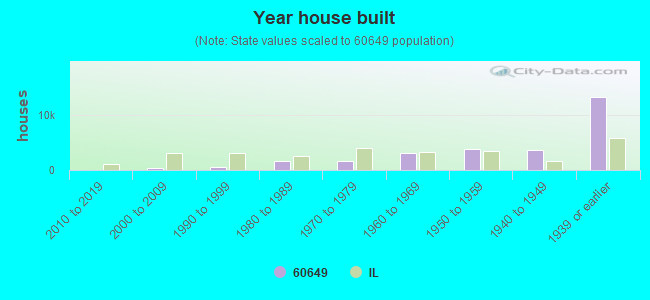


 Based on the data from the years 2002 - 2018 the average number of fires per year is 228. The highest number of fire incidents - 371 took place in 2016, and the least - 0 in 2005. The data has a decreasing trend.
 When looking into fire subcategories, the most reports belonged to: Structure Fires (53.3%), and Outside Fires (21.0%).