Estimated zip code population in 2022: 33,890 Zip code population in 2010: 29,908 Zip code population in 2000: 34,502
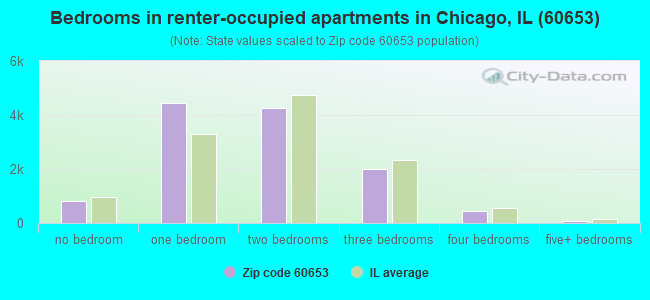
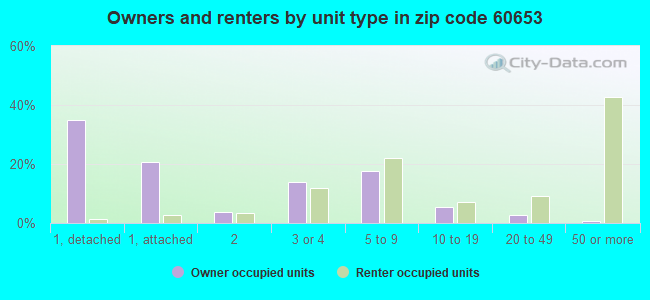
Houses and condos: 18,496 Renter-occupied apartments: 12,022
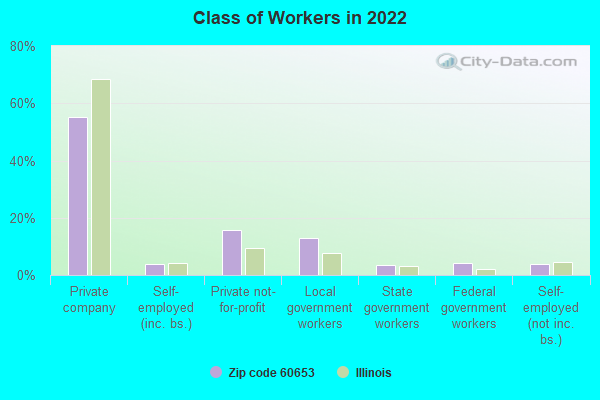
% of renters here:
70%
State:
33%
March 2022 cost of living index in zip code 60653: 107.2 (more than average, U.S. average is 100)
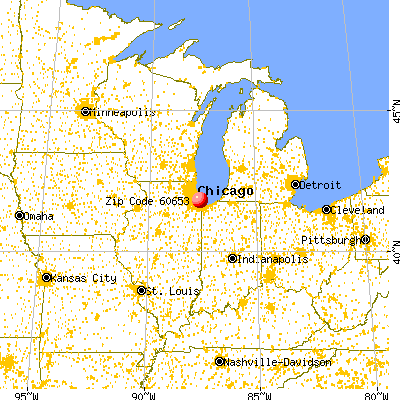
Land area: 2.3 sq. mi. Water area: 0.7 sq. mi.
Population density: 14,528 people per square mile
(very high).
OSM Map
General Map
Google Map
MSN Map
OSM Map
General Map
Google Map
MSN Map
OSM Map
General Map
Google Map
MSN Map
OSM Map
General Map
Google Map
MSN Map
Please wait while loading the map...
Real estate property taxes paid for housing units in 2022:
This zip code:
1.2% ($4,468)
Illinois:
2.0% ($4,912)
Median real estate property taxes paid for housing units with mortgages in 2022: $4,457 (1.3%) Median real estate property taxes paid for housing units with no mortgage in 2022: $3,897 (0.9%)
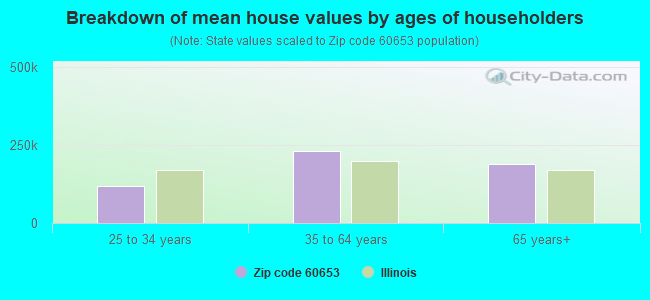
Estimated median house/condo value in 2022: $360,300
60653:
$360,300
Illinois:
$251,600
According to our research of Illinois and other state lists, there were 29 registered sex offenders living in 60653 zip code as of April 26, 2024. The ratio of all residents to sex offenders in zip code 60653 is 1,086 to 1. The ratio of registered sex offenders to all residents in this zip code is lower than the state average.
Median resident age:
This zip code:
36.9 years
Illinois median age:
39.1 years
Average household size:
This zip code:
1.9 people
Illinois:
2.4 people
Averages for the 2020 tax year for zip code 60653, filed in 2021:
Average Adjusted Gross Income (AGI) in 2020: $55,402 (Individual Income Tax Returns)
Here:
$55,402
State:
$82,626
Salary/wage: $53,745 (reported on 85.4% of returns)
Here:
$53,745
State:
$66,640
(% of AGI for various income ranges: 1136.9% for AGIs below $25k, 3412.3% for AGIs $25k-50k, 6844.7% for AGIs $50k-75k, 9998.4% for AGIs $75k-100k, 17958.8% for AGIs $100k-200k, 66836.8% for AGIs over 200k)
Taxable interest for individuals: $570 (reported on 11.8% of returns)
This zip code:
$570
Illinois:
$2,376
(% of AGI for various income ranges: 1.8% for AGIs below $25k, 1.9% for AGIs $25k-50k, 10.8% for AGIs $50k-75k, 14.3% for AGIs $75k-100k, 19.2% for AGIs $100k-200k, 173.2% for AGIs over 200k)
Ordinary dividends: $2,191 (reported on 7.9% of returns)
Here:
$2,191
State:
$9,061
(% of AGI for various income ranges: 1.3% for AGIs below $25k, 7.7% for AGIs $25k-50k, 34.3% for AGIs $50k-75k, 38.8% for AGIs $75k-100k, 42.8% for AGIs $100k-200k, 453.2% for AGIs over 200k)
Net capital gain/loss in AGI: +$9,248 (reported on 7.1% of returns)
Here:
+$9,248
State:
+$31,684
(% of AGI for various income ranges: 1.3% for AGIs below $25k, 11.3% for AGIs $25k-50k, 41.7% for AGIs $50k-75k, 84.5% for AGIs $75k-100k, 104.8% for AGIs $100k-200k, 3205.3% for AGIs over 200k)
Profit/loss from business: +$2,434 (reported on 23.8% of returns)
Here:
+$2,434
State:
+$12,175
(% of AGI for various income ranges: 21.8% for AGIs below $25k, 39.1% for AGIs $75k-100k, 411.6% for AGIs $100k-200k, 2322.1% for AGIs over 200k)
Taxable individual retirement arrangement distribution: $17,112 (reported on 2.5% of returns)
60653:
$17,112
Illinois:
$21,613
(% of AGI for various income ranges: 8.9% for AGIs below $25k, 12.3% for AGIs $25k-50k, 40.8% for AGIs $50k-75k, 87.5% for AGIs $75k-100k, 225.3% for AGIs $100k-200k, 910.0% for AGIs over 200k)
Self-employed (Keogh) retirement plans: $22,833 (reported on 0.2% of returns)
60653:
$22,833
Illinois:
$30,962
(% of AGI for various income ranges: 79.7% for AGIs $100k-200k)
Total itemized deductions: $27,374 (reported on 13.8% of returns)
Here:
$27,374
State:
$34,948
(% of AGI for various income ranges: 21.8% for AGIs below $25k, 120.0% for AGIs $25k-50k, 529.9% for AGIs $50k-75k, 1093.1% for AGIs $75k-100k, 2087.8% for AGIs $100k-200k, 6194.2% for AGIs over 200k)
Charity contributions: $8,592 (reported on 11.6% of returns)
Here:
$8,592
State:
$13,122
(% of AGI for various income ranges: 3.6% for AGIs below $25k, 30.4% for AGIs $25k-50k, 115.3% for AGIs $50k-75k, 249.7% for AGIs $75k-100k, 521.7% for AGIs $100k-200k, 2165.8% for AGIs over 200k)
Taxes paid: $7,867 (reported on 13.8% of returns)
60653:
$7,867
State:
$8,563
(% of AGI for various income ranges: 4.4% for AGIs below $25k, 25.1% for AGIs $25k-50k, 134.8% for AGIs $50k-75k, 347.0% for AGIs $75k-100k, 667.6% for AGIs $100k-200k, 1616.3% for AGIs over 200k)
Earned income credit: $2,732 (reported on 31.6% of returns)
Here:
$2,732
State:
$2,311
(% of AGI for various income ranges: 185.0% for AGIs below $25k, 107.7% for AGIs $25k-50k)
Percentage of individuals using paid preparers for their 2020 taxes: 93.2%
Here:
93%
State:
93%
(% for various income ranges: 93.6% for AGIs below $25k, 94.7% for AGIs $25k-50k, 91.3% for AGIs $50k-75k, 91.3% for AGIs $75k-100k, 90.8% for AGIs $100k-200k, 93.8% for AGIs over 200k)
Averages for the 2012 tax year for zip code 60653, filed in 2013:
Average Adjusted Gross Income (AGI) in 2012: $38,870 (Individual Income Tax Returns)
Here:
$38,870
State:
$68,058
Salary/wage: $39,280 (reported on 84.5% of returns)
Here:
$39,280
State:
$55,396
(% of AGI for various income ranges: 70.7% for AGIs below $25k, 88.7% for AGIs $25k-50k, 91.3% for AGIs $50k-75k, 90.5% for AGIs $75k-100k, 88.6% for AGIs $100k-200k, 79.4% for AGIs over 200k)
Taxable interest for individuals: $376 (reported on 10.9% of returns)
This zip code:
$376
Illinois:
$1,969
(% of AGI for various income ranges: 0.1% for AGIs below $25k, 0.1% for AGIs $25k-50k, 0.1% for AGIs $75k-100k, 0.2% for AGIs over 200k)
Ordinary dividends: $1,031 (reported on 5.6% of returns)
Here:
$1,031
State:
$7,786
(% of AGI for various income ranges: 0.1% for AGIs $25k-50k, 0.1% for AGIs $75k-100k, 0.2% for AGIs $100k-200k, 0.3% for AGIs over 200k)
Net capital gain/loss in AGI: +$698 (reported on 3.7% of returns)
Here:
+$698
State:
+$22,183
(% of AGI for various income ranges: 0.1% for AGIs $100k-200k, 0.5% for AGIs over 200k)
Profit/loss from business: +$6,013 (reported on 21.9% of returns)
Here:
+$6,013
State:
+$12,903
(% of AGI for various income ranges: 16.8% for AGIs below $25k, 0.4% for AGIs $50k-75k, 0.3% for AGIs $75k-100k, 1.9% for AGIs $100k-200k, 0.8% for AGIs over 200k)
Taxable individual retirement arrangement distribution: $11,729 (reported on 2.7% of returns)
60653:
$11,729
Illinois:
$17,929
(% of AGI for various income ranges: 0.5% for AGIs below $25k, 0.7% for AGIs $25k-50k, 0.7% for AGIs $50k-75k, 1.1% for AGIs $75k-100k, 1.5% for AGIs $100k-200k)
Self-employment retirement plans: $12,200 (reported on 0.2% of returns)
60653:
$12,200
Illinois:
$24,666
Total itemized deductions: $22,051 (25% of AGI, reported on 23.7% of returns)
Here:
$22,051
State:
$26,433
Here:
25.1% of AGI
State:
19.2% of AGI
(% of AGI for various income ranges: 3.7% for AGIs below $25k, 8.8% for AGIs $25k-50k, 16.1% for AGIs $50k-75k, 20.3% for AGIs $75k-100k, 18.6% for AGIs $100k-200k, 15.9% for AGIs over 200k)
Charity contributions: $4,595 (reported on 20.1% of returns)
Here:
$4,595
State:
$4,525
(% of AGI for various income ranges: 0.5% for AGIs below $25k, 1.8% for AGIs $25k-50k, 2.8% for AGIs $50k-75k, 3.4% for AGIs $75k-100k, 3.2% for AGIs $100k-200k, 3.1% for AGIs over 200k)
Taxes paid: $6,862 (reported on 23.6% of returns)
60653:
$6,862
State:
$11,968
(% of AGI for various income ranges: 0.7% for AGIs below $25k, 1.9% for AGIs $25k-50k, 4.6% for AGIs $50k-75k, 6.2% for AGIs $75k-100k, 6.5% for AGIs $100k-200k, 6.4% for AGIs over 200k)
Earned income credit: $2,864 (reported on 40.2% of returns)
Here:
$2,864
State:
$2,349
(% of AGI for various income ranges: 15.3% for AGIs below $25k, 1.6% for AGIs $25k-50k)
Percentage of individuals using paid preparers for their 2012 taxes: 47.4%
Here:
47%
State:
57%
(% for various income ranges: 43.9% for AGIs below $25k, 45.9% for AGIs $25k-50k, 53.0% for AGIs $50k-75k, 56.8% for AGIs $75k-100k, 59.7% for AGIs $100k-200k, 64.7% for AGIs over 200k)
Averages for the 2004 tax year for zip code 60653, filed in 2005:
Average Adjusted Gross Income (AGI) in 2004: $29,411 (Individual Income Tax Returns)
Here:
$29,411
State:
$54,625
Salary/wage: $29,648 (reported on 88.7% of returns)
Here:
$29,648
State:
$46,811
(% of AGI for various income ranges: 89.3% for AGIs below $10k, 82.9% for AGIs $10k-25k, 94.3% for AGIs $25k-50k, 93.0% for AGIs $50k-75k, 91.8% for AGIs $75k-100k, 83.7% for AGIs over 100k)
Taxable interest for individuals: $513 (reported on 17.3% of returns)
This zip code:
$513
Illinois:
$2,101
(% of AGI for various income ranges: 0.6% for AGIs below $10k, 0.2% for AGIs $10k-25k, 0.2% for AGIs $25k-50k, 0.7% for AGIs $50k-75k, 0.3% for AGIs $75k-100k, 0.2% for AGIs over 100k)
Taxable dividends: $516 (reported on 6.1% of returns)
Here:
$516
State:
$4,306
(% of AGI for various income ranges: 0.1% for AGIs below $10k, 0.0% for AGIs $10k-25k, 0.1% for AGIs $25k-50k, 0.1% for AGIs $50k-75k, 0.2% for AGIs $75k-100k, 0.2% for AGIs over 100k)
Net capital gain/loss: +$10,453 (reported on 4.5% of returns)
Here:
+$10,453
State:
+$17,321
(% of AGI for various income ranges: -0.3% for AGIs below $10k, 0.1% for AGIs $10k-25k, 0.3% for AGIs $25k-50k, 0.3% for AGIs $50k-75k, 1.9% for AGIs $75k-100k, 6.6% for AGIs over 100k)
Profit/loss from business: +$4,995 (reported on 16.0% of returns)
Here:
+$4,995
State:
+$11,771
(% of AGI for various income ranges: 17.7% for AGIs below $10k, 7.2% for AGIs $10k-25k, -0.4% for AGIs $25k-50k, -0.3% for AGIs $50k-75k, 2.7% for AGIs $75k-100k, 2.7% for AGIs over 100k)
IRA payment deduction: $1,888 (reported on 0.8% of returns)
60653:
$1,888
Illinois:
$3,087
Total itemized deductions: $19,522 (29% of AGI, reported on 21.2% of returns)
Here:
$19,522
State:
$20,239
Here:
29.2% of AGI
State:
19.5% of AGI
(% of AGI for various income ranges: 4.3% for AGIs below $10k, 3.8% for AGIs $10k-25k, 12.1% for AGIs $25k-50k, 22.2% for AGIs $50k-75k, 22.1% for AGIs $75k-100k, 18.1% for AGIs over 100k)
Charity contributions deductions: $4,439 (6% of AGI, reported on 19.0% of returns)
Here:
$4,439
State:
$3,719
Here:
6.4% of AGI
State:
3.4% of AGI
(% of AGI for various income ranges: 0.3% for AGIs below $10k, 0.7% for AGIs $10k-25k, 2.6% for AGIs $25k-50k, 4.2% for AGIs $50k-75k, 4.2% for AGIs $75k-100k, 4.2% for AGIs over 100k)
Total tax: $4,240 (reported on 57.6% of returns)
60653:
$4,240
State:
$9,882
(% of AGI for various income ranges: 3.6% for AGIs below $10k, 2.9% for AGIs $10k-25k, 5.3% for AGIs $25k-50k, 9.6% for AGIs $50k-75k, 12.0% for AGIs $75k-100k, 16.5% for AGIs over 100k)
Earned income credit: $2,268 (reported on 45.9% of returns)
Here:
$2,268
State:
$1,788
Percentage of individuals using paid preparers for their 2004 taxes: 65.4%
Here:
65%
State:
61%
(% for various income ranges: 65.8% for AGIs below $10k, 71.3% for AGIs $10k-25k, 59.8% for AGIs $25k-50k, 60.2% for AGIs $50k-75k, 60.6% for AGIs $75k-100k, 61.9% for AGIs over 100k)
Likely homosexual households (counted as self-reported same-sex unmarried-partner households)
Lesbian couples: 0.1% of all households
Gay men: 0.4% of all households
Household received Food Stamps/SNAP in the past 12 months: 7,688 Household did not receive Food Stamps/SNAP in the past 12 months: 10,233
Women who had a birth in the past 12 months: 418 (241 now married, 176 unmarried) Women who did not have a birth in the past 12 months: 8,942 (2,024 now married, 6,972 unmarried)
Housing units in zip code 60653 with a mortgage: 4,209 (413 second mortgage, 238 both second mortgage and home equity loan) Houses without a mortgage: 38
Median monthly owner costs for units with a mortgage: $2,318 Median monthly owner costs for units without a mortgage: $814
Residents with income below the poverty level in 2022:
This zip code:
32.0%
Whole state:
11.9%
Residents with income below 50% of the poverty level in 2022:
This zip code:
14.5%
Whole state:
5.7%
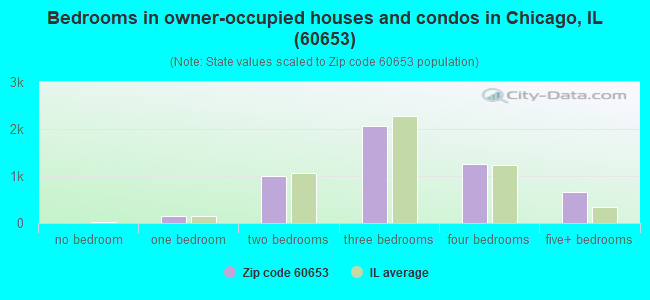
Median number of rooms in houses and condos:
Here:
6.1
State:
6.4
Median number of rooms in apartments:
Here:
3.8
State:
4.1
Notable locations in this zip code not listed on our city pages
Notable locations in zip code 60653: Douglas Station (A), Five Crossings (B), Victory (C), Chicago Fire Department District 5 Station 17 (D), Lake Park Plaza (E), Chicago Engine Company 45 (F). Display/hide their locations on the map
Churches in zip code 60653 include: Apostolic Faith Church (A), The Evangelical Mission (B), Bethel African Methodist Episcopal Church (C), Blackwell Memorial African Methodist Episcopal Zion Church (D), Bright Star Church of God in Christ (E), Church of the Living God (F), First Diocese Church of God in Christ (G), Grant Memorial African Methodist Episcopal Church (H), Metropolitan Community Church (I). Display/hide their locations on the map
2,334 married couples with children.
4,872 single-parent households (345 men, 4,527 women).
91.7% of residents of 60653 zip code speak English at home.
3.4% of residents speak Spanish at home (67% very well, 27% well, 5% not well, 1% not at all).
1.7% of residents speak other Indo-European language at home (63% very well, 30% well, 6% not well, 1% not at all).
0.8% of residents speak Asian or Pacific Island language at home (79% very well, 4% well, 2% not well, 15% not at all).
2.2% of residents speak other language at home (87% very well, 13% well).
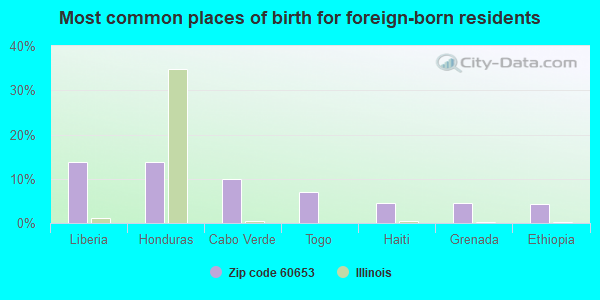
Foreign born population: 1,679 (5.0%) (58.7% of them are naturalized citizens)
Major facilities with environmental interests located in this zip code:
PHILLIPS ACADEMY (244 E PERSHING RD in CHICAGO, IL)
STATE MASTER (Illinois EPA Project) - HAZARDOUS WASTE PROGRAM (National Center for Education Statistics) - STATE ID-1501629900034 Small Quantity Generators, between 100 kg and 1000 kg of hazardous waste/month (Resource Conservation and Recovery Act (tracking hazardous waste)) - notification Organizations: CHICAGO PUBLIC SCHOOLS (CONTACT/OWNER)
, CITY OF CHICAGO SCHOOL DIST 299 (SCHOOL DISTRICT)
ILLINOIS BELL TELEPHONE CO (825 E 44TH ST in CHICAGO, IL)
STATE MASTER (Illinois EPA Project) - AIR PROGRAM, SOLID WASTE PROGRAM AIR MINOR (AIRS/AFS) (Resource Conservation and Recovery Act (tracking hazardous waste)) Business SIC classification: TELEPHONE COMMUNICATIONS, EXCEPT RADIOTELEPHONE Organizations: ILLIONOIS BELL TELEPHONE CO (CONTACT/OWNER)
Alternative names: ILLINOIS BELL - Q13750, ILL BELL TEL CO OAKLAND C O
HOWARD S POLY CLEAN CENTER (126 E 47TH ST in CHICAGO, IL)
STATE MASTER (Illinois EPA Project) - AIR PROGRAM, HAZARDOUS WASTE PROGRAM AIR MINOR (AIRS/AFS) CRITERIA AND HAZARDOUS AIR POLLUTANT INVENTORY (Inventory of air pollution sources) Small Quantity Generators, between 100 kg and 1000 kg of hazardous waste/month (Resource Conservation and Recovery Act (tracking hazardous waste)) - notification Business SIC classification: NONCLASSIFIABLE ESTABLISHMENTS Organizations: SMITH HOWARD (CONTACT/OWNER)
Alternative names: HOWARD POLY CLEAN CTR, HOWARDS POLY CLEAN CENTER
ROBINSON SCHOOL (4225 S LAKE PARK AVE in CHICAGO, IL)
STATE MASTER (Illinois EPA Project) - SOLID WASTE PROGRAM, AIR PROGRAM AIR MINOR (AIRS/AFS) CRITERIA AND HAZARDOUS AIR POLLUTANT INVENTORY (Inventory of air pollution sources) Conditionally Exempt Small Quantity Generators, less than 100 kg/month of hazardous waste (Resource Conservation and Recovery Act (tracking hazardous waste)) - notification Business SIC and NAICS classification: ELEMENTARY AND SECONDARY SCHOOLS Organizations: CHICAGO PUBLIC SCHOOLS (CONTACT/OWNER)
Alternative names: CHICAGO BOARD OF EDUCATION, ROBINSON ELEM SCHOOL, ROBINSON JACKIE SCHOOL, ROBINSON SCHOOL CHGO BOARD ED
RELIABLE BUS COMPANY (740 E. 41ST STREET in CHICAGO, IL)
STATE MASTER (Illinois EPA Project) - National Pollutant Discharge Elimination System Permit National Pollutant Discharge Elimination System NON-MAJOR (Tracking pollutant discharge elimination systems) - permit
CHICAGO DOT BRIDGES (3900 S LAKE SHORE DR in CHICAGO, IL)
STATE MASTER (Illinois EPA Project) - HAZARDOUS WASTE PROGRAM Large Quantity Generators, more that 1000 kg of hazardous waste/month (Resource Conservation and Recovery Act (tracking hazardous waste)) - notification
OLANDER HOMES IL-214 (3939 S. LAKE PARK AVENUE in CHICAGO, IL)
STATE MASTER (Illinois EPA Project) - SOLID WASTE PROGRAM, AIR PROGRAM AIR MINOR (AIRS/AFS) CRITERIA AND HAZARDOUS AIR POLLUTANT INVENTORY (Inventory of air pollution sources) Business SIC classification: OPERATORS OF APARTMENT BUILDINGS Business NAICS classification: LESSORS OF RESIDENTIAL BUILDINGS AND DWELLINGS. Alternative names: CHICAGO HOUSING AUTHORITY
DELMAR MARINE INC (CALUMET RIVER-MILE 327.8 in CHICAGO, IL)
STATE MASTER (Illinois EPA Project) - AIR PROGRAM AIR MINOR (AIRS/AFS) Business SIC classification: MARINE CARGO HANDLING
PRICE ELEMENTARY SCH (4351 S DREXEL BLVD in CHICAGO, IL)
(National Center for Education Statistics) - STATE ID-1501629902411 Small Quantity Generators, between 100 kg and 1000 kg of hazardous waste/month (Resource Conservation and Recovery Act (tracking hazardous waste)) - notification Organizations: CHICAGO PUBLIC SCHOOLS (CONTACT/OWNER)
, CITY OF CHICAGO SCHOOL DIST 299 (SCHOOL DISTRICT)
ARTS TRANSPORTATION (4100 WABASH in CHICAGO, IL)
STATE MASTER (Illinois EPA Project) - HAZARDOUS WASTE PROGRAM Small Quantity Generators, between 100 kg and 1000 kg of hazardous waste/month (Resource Conservation and Recovery Act (tracking hazardous waste))
MAYO ELEM SCHOOL (249 E 37TH ST in CHICAGO, IL)
(National Center for Education Statistics) - STATE ID-1501629902338 Conditionally Exempt Small Quantity Generators, less than 100 kg/month of hazardous waste (Resource Conservation and Recovery Act (tracking hazardous waste)) - notification Organizations: CHICAGO PUBLIC SCHOOLS 6WW (CONTACT/OWNER)
, CITY OF CHICAGO SCHOOL DIST 299 (SCHOOL DISTRICT)
Alternative names: MAYO SCHOOL
ROBINSON S VALET SERVICE (367 E 43RD ST in CHICAGO, IL)
STATE MASTER (Illinois EPA Project) - SOLID WASTE PROGRAM, AIR PROGRAM AIR MINOR (AIRS/AFS) Business SIC classification: DRYCLEANING PLANTS, EXCEPT RUG CLEANING Alternative names: ROBINSONS VALET SERVICE
CHICAGO HOUSING AUTHORITY (4227 S OAKENWALD in CHICAGO, IL)
STATE MASTER (Illinois EPA Project) - SOLID WASTE PROGRAM, AIR PROGRAM AIR MINOR (AIRS/AFS) Business SIC classification: OPERATORS OF APARTMENT BUILDINGS Alternative names: CHA - CHICAGO HOUSING AUTHORITY
Housing units lacking complete plumbing facilities: 1.3% Housing units lacking complete kitchen facilities: 1.8%
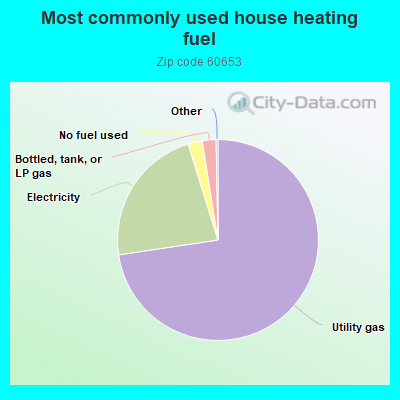
72.7%Utility gas
22.6%Electricity
2.3%No fuel used
2.2%Bottled, tank, or LP gas
Population in 1990: 40,091.
Place of birth for U.S.-born residents:
This state: 25,145
Northeast: 500
Midwest: 1,692
South: 3,870
West: 622
56% of the 60653 zip code residents lived in the same house 5 years ago. Out of people who lived in different houses, 91% lived in this county. Out of people who lived in different counties, 50% lived in Illinois.
89% of the 60653 zip code residents lived in the same house 1 year ago. Out of people who lived in different houses, 85% moved from this county. Out of people who lived in different houses, 2% moved from different county within same state. Out of people who lived in different houses, 6% moved from different state. Out of people who lived in different houses, 2% moved from abroad.
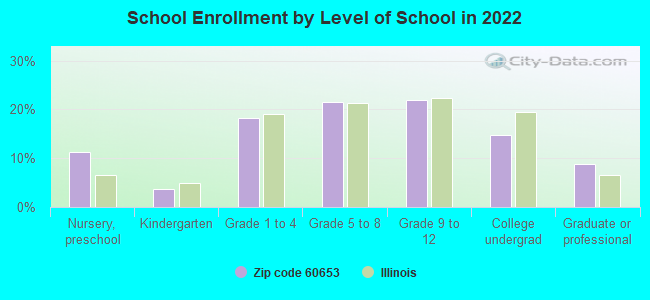
Private vs. public school enrollment:
Students in private schools in grades 1 to 8 (elementary and middle school): 421
Here:
12.3%
Illinois:
13.3%
Students in private schools in grades 9 to 12 (high school): 308
Here:
16.4%
Illinois:
9.9%
Students in private undergraduate colleges: 588
Here:
45.9%
Illinois:
27.4%
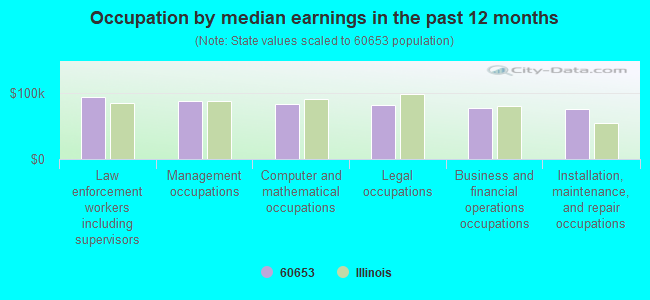
Occupation by median earnings in the past 12 months ($)
94,033Law enforcement workers including supervisors
88,787Management occupations
83,920Computer and mathematical occupations
81,653Legal occupations
77,150Business and financial operations occupations
76,691Installation, maintenance, and repair occupations
Top industries in this zip code by the number of employees in 2005:
Health Care and Social Assistance: Nursing Care Facilities (100-249 employees: 2 establishments, 50-99 employees: 1 establishment)
Health Care and Social Assistance: Child Day Care Services (20-49: 2, 10-19: 8, 5-9: 7, 1-4: 6)
Real Estate and Rental and Leasing: Residential Property Managers (50-99: 1, 20-49: 2, 10-19: 1, 5-9: 2, 1-4: 4)
2002 - 2018 National Fire Incident Reporting System (NFIRS) incidents
Based on the data from the years 2002 - 2018 the average number of fires per year is 201. The highest number of fire incidents - 381 took place in 2012, and the least - 0 in 2005. The data has a decreasing trend.
When looking into fire subcategories, the most reports belonged to: Structure Fires (43.4%), and Outside Fires (27.3%).
Fire incident types reported to NFIRS in Zip Code 60653


 Nearest zip codes: 60615, 60616, 60637, 60605, 60609, 60621.


 Based on the data from the years 2002 - 2018 the average number of fires per year is 201. The highest number of fire incidents - 381 took place in 2012, and the least - 0 in 2005. The data has a decreasing trend.
 When looking into fire subcategories, the most reports belonged to: Structure Fires (43.4%), and Outside Fires (27.3%).