Estimated zip code population in 2022: 51,981 Zip code population in 2010: 48,433 Zip code population in 2000: 47,073
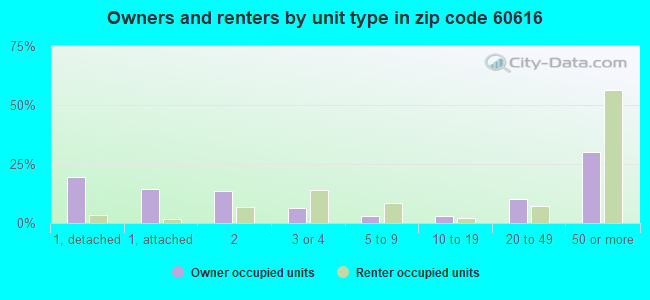
Houses and condos: 26,294 Renter-occupied apartments: 15,430
% of renters here:
62%
State:
33%
March 2022 cost of living index in zip code 60616: 103.2 (near average, U.S. average is 100)
Land area: 4.0 sq. mi. Water area: 0.6 sq. mi.
Population density: 12,836 people per square mile
(very high).
OSM Map
General Map
Google Map
MSN Map
OSM Map
General Map
Google Map
MSN Map
OSM Map
General Map
Google Map
MSN Map
OSM Map
General Map
Google Map
MSN Map
Please wait while loading the map...
Real estate property taxes paid for housing units in 2022:
This zip code:
1.5% ($6,072)
Illinois:
2.0% ($4,912)
Median real estate property taxes paid for housing units with mortgages in 2022: $6,333 (1.4%) Median real estate property taxes paid for housing units with no mortgage in 2022: $5,613 (1.5%)
Estimated median house/condo value in 2022: $411,546
60616:
$411,546
Illinois:
$251,600
According to our research of Illinois and other state lists, there were 21 registered sex offenders living in 60616 zip code as of April 27, 2024. The ratio of all residents to sex offenders in zip code 60616 is 2,540 to 1. The ratio of registered sex offenders to all residents in this zip code is much lower than the state average.
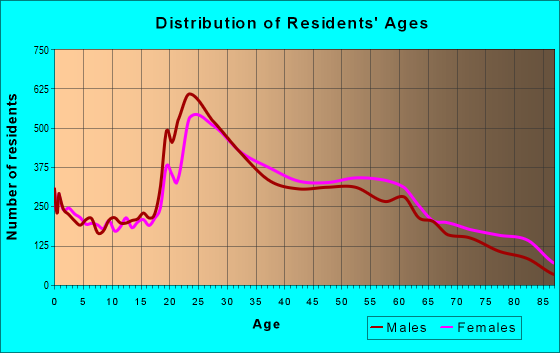
Median resident age:
This zip code:
38.0 years
Illinois median age:
39.1 years
Average household size:
This zip code:
2.0 people
Illinois:
2.4 people
Averages for the 2020 tax year for zip code 60616, filed in 2021:
Average Adjusted Gross Income (AGI) in 2020: $68,829 (Individual Income Tax Returns)
Here:
$68,829
State:
$82,626
Salary/wage: $63,273 (reported on 82.6% of returns)
Here:
$63,273
State:
$66,640
(% of AGI for various income ranges: 1060.9% for AGIs below $25k, 3464.5% for AGIs $25k-50k, 6876.0% for AGIs $50k-75k, 9928.5% for AGIs $75k-100k, 18554.4% for AGIs $100k-200k, 81502.4% for AGIs over 200k)
Taxable interest for individuals: $1,716 (reported on 24.2% of returns)
This zip code:
$1,716
Illinois:
$2,376
(% of AGI for various income ranges: 11.7% for AGIs below $25k, 16.5% for AGIs $25k-50k, 37.7% for AGIs $50k-75k, 42.6% for AGIs $75k-100k, 74.8% for AGIs $100k-200k, 1249.3% for AGIs over 200k)
Ordinary dividends: $3,646 (reported on 18.2% of returns)
Here:
$3,646
State:
$9,061
(% of AGI for various income ranges: 12.3% for AGIs below $25k, 18.7% for AGIs $25k-50k, 55.2% for AGIs $50k-75k, 64.3% for AGIs $75k-100k, 204.6% for AGIs $100k-200k, 1842.2% for AGIs over 200k)
Net capital gain/loss in AGI: +$22,182 (reported on 18.0% of returns)
Here:
+$22,182
State:
+$31,684
(% of AGI for various income ranges: 11.6% for AGIs below $25k, 34.1% for AGIs $25k-50k, 65.4% for AGIs $50k-75k, 161.2% for AGIs $75k-100k, 578.2% for AGIs $100k-200k, 17928.2% for AGIs over 200k)
Profit/loss from business: +$7,703 (reported on 21.8% of returns)
Here:
+$7,703
State:
+$12,175
(% of AGI for various income ranges: 171.7% for AGIs below $25k, 138.8% for AGIs $25k-50k, 113.3% for AGIs $50k-75k, 140.4% for AGIs $75k-100k, 376.5% for AGIs $100k-200k, 2572.2% for AGIs over 200k)
Taxable individual retirement arrangement distribution: $17,636 (reported on 4.2% of returns)
60616:
$17,636
Illinois:
$21,613
(% of AGI for various income ranges: 23.4% for AGIs below $25k, 40.5% for AGIs $25k-50k, 88.5% for AGIs $50k-75k, 122.4% for AGIs $75k-100k, 285.8% for AGIs $100k-200k, 1188.2% for AGIs over 200k)
Self-employed (Keogh) retirement plans: $25,310 (reported on 0.4% of returns)
60616:
$25,310
Illinois:
$30,962
(% of AGI for various income ranges: 22.6% for AGIs $100k-200k, 464.9% for AGIs over 200k)
Total itemized deductions: $26,920 (reported on 11.2% of returns)
Here:
$26,920
State:
$34,948
(% of AGI for various income ranges: 27.0% for AGIs below $25k, 94.2% for AGIs $25k-50k, 276.8% for AGIs $50k-75k, 588.7% for AGIs $75k-100k, 1300.0% for AGIs $100k-200k, 5870.4% for AGIs over 200k)
Charity contributions: $7,276 (reported on 8.6% of returns)
Here:
$7,276
State:
$13,122
(% of AGI for various income ranges: 1.7% for AGIs below $25k, 16.6% for AGIs $25k-50k, 53.5% for AGIs $50k-75k, 95.6% for AGIs $75k-100k, 245.1% for AGIs $100k-200k, 1545.6% for AGIs over 200k)
Taxes paid: $8,541 (reported on 11.2% of returns)
60616:
$8,541
State:
$8,563
(% of AGI for various income ranges: 8.3% for AGIs below $25k, 23.5% for AGIs $25k-50k, 89.6% for AGIs $50k-75k, 214.8% for AGIs $75k-100k, 478.0% for AGIs $100k-200k, 1540.2% for AGIs over 200k)
Earned income credit: $1,966 (reported on 21.6% of returns)
Here:
$1,966
State:
$2,311
(% of AGI for various income ranges: 107.9% for AGIs below $25k, 75.0% for AGIs $25k-50k, 0.4% for AGIs $50k-75k)
Percentage of individuals using paid preparers for their 2020 taxes: 92.7%
Here:
93%
State:
93%
(% for various income ranges: 92.0% for AGIs below $25k, 94.1% for AGIs $25k-50k, 91.7% for AGIs $50k-75k, 92.3% for AGIs $75k-100k, 92.8% for AGIs $100k-200k, 93.9% for AGIs over 200k)
Averages for the 2012 tax year for zip code 60616, filed in 2013:
Average Adjusted Gross Income (AGI) in 2012: $53,120 (Individual Income Tax Returns)
Here:
$53,120
State:
$68,058
Salary/wage: $50,468 (reported on 85.2% of returns)
Here:
$50,468
State:
$55,396
(% of AGI for various income ranges: 76.6% for AGIs below $25k, 85.8% for AGIs $25k-50k, 85.9% for AGIs $50k-75k, 84.3% for AGIs $75k-100k, 84.0% for AGIs $100k-200k, 69.8% for AGIs over 200k)
Taxable interest for individuals: $1,040 (reported on 26.1% of returns)
This zip code:
$1,040
Illinois:
$1,969
(% of AGI for various income ranges: 0.7% for AGIs below $25k, 0.4% for AGIs $25k-50k, 0.3% for AGIs $50k-75k, 0.3% for AGIs $75k-100k, 0.3% for AGIs $100k-200k, 1.0% for AGIs over 200k)
Ordinary dividends: $3,035 (reported on 14.7% of returns)
Here:
$3,035
State:
$7,786
(% of AGI for various income ranges: 0.7% for AGIs below $25k, 0.5% for AGIs $25k-50k, 0.5% for AGIs $50k-75k, 0.5% for AGIs $75k-100k, 0.9% for AGIs $100k-200k, 1.6% for AGIs over 200k)
Net capital gain/loss in AGI: +$5,508 (reported on 11.2% of returns)
Here:
+$5,508
State:
+$22,183
(% of AGI for various income ranges: 0.1% for AGIs $50k-75k, 0.4% for AGIs $75k-100k, 1.0% for AGIs $100k-200k, 4.2% for AGIs over 200k)
Profit/loss from business: +$9,289 (reported on 17.5% of returns)
Here:
+$9,289
State:
+$12,903
(% of AGI for various income ranges: 12.9% for AGIs below $25k, 2.2% for AGIs $25k-50k, 1.2% for AGIs $50k-75k, 1.7% for AGIs $75k-100k, 2.3% for AGIs $100k-200k, 2.5% for AGIs over 200k)
Taxable individual retirement arrangement distribution: $13,958 (reported on 5.0% of returns)
60616:
$13,958
Illinois:
$17,929
(% of AGI for various income ranges: 1.6% for AGIs below $25k, 1.3% for AGIs $25k-50k, 1.2% for AGIs $50k-75k, 1.4% for AGIs $75k-100k, 1.4% for AGIs $100k-200k, 1.2% for AGIs over 200k)
Self-employment retirement plans: $20,811 (reported on 0.4% of returns)
60616:
$20,811
Illinois:
$24,666
(% of AGI for various income ranges: 0.1% for AGIs below $25k, 0.2% for AGIs $100k-200k, 0.5% for AGIs over 200k)
Total itemized deductions: $23,248 (20% of AGI, reported on 25.9% of returns)
Here:
$23,248
State:
$26,433
Here:
20.0% of AGI
State:
19.2% of AGI
(% of AGI for various income ranges: 4.8% for AGIs below $25k, 7.1% for AGIs $25k-50k, 10.6% for AGIs $50k-75k, 13.1% for AGIs $75k-100k, 14.7% for AGIs $100k-200k, 13.4% for AGIs over 200k)
Charity contributions: $3,877 (reported on 20.1% of returns)
Here:
$3,877
State:
$4,525
(% of AGI for various income ranges: 0.3% for AGIs below $25k, 0.9% for AGIs $25k-50k, 1.4% for AGIs $50k-75k, 1.7% for AGIs $75k-100k, 1.8% for AGIs $100k-200k, 2.0% for AGIs over 200k)
Taxes paid: $9,054 (reported on 25.8% of returns)
60616:
$9,054
State:
$11,968
(% of AGI for various income ranges: 1.3% for AGIs below $25k, 2.0% for AGIs $25k-50k, 3.4% for AGIs $50k-75k, 4.6% for AGIs $75k-100k, 6.1% for AGIs $100k-200k, 6.4% for AGIs over 200k)
Earned income credit: $2,166 (reported on 24.5% of returns)
Here:
$2,166
State:
$2,349
(% of AGI for various income ranges: 8.7% for AGIs below $25k, 1.1% for AGIs $25k-50k)
Percentage of individuals using paid preparers for their 2012 taxes: 55.7%
Here:
56%
State:
57%
(% for various income ranges: 57.9% for AGIs below $25k, 53.0% for AGIs $25k-50k, 51.0% for AGIs $50k-75k, 53.9% for AGIs $75k-100k, 58.3% for AGIs $100k-200k, 67.2% for AGIs over 200k)
Averages for the 2004 tax year for zip code 60616, filed in 2005:
Average Adjusted Gross Income (AGI) in 2004: $39,563 (Individual Income Tax Returns)
Here:
$39,563
State:
$54,625
Salary/wage: $37,227 (reported on 86.0% of returns)
Here:
$37,227
State:
$46,811
(% of AGI for various income ranges: 103.8% for AGIs below $10k, 81.3% for AGIs $10k-25k, 88.1% for AGIs $25k-50k, 86.9% for AGIs $50k-75k, 86.2% for AGIs $75k-100k, 67.7% for AGIs over 100k)
Taxable interest for individuals: $1,143 (reported on 40.5% of returns)
This zip code:
$1,143
Illinois:
$2,101
(% of AGI for various income ranges: 4.2% for AGIs below $10k, 1.4% for AGIs $10k-25k, 0.8% for AGIs $25k-50k, 0.9% for AGIs $50k-75k, 0.8% for AGIs $75k-100k, 1.4% for AGIs over 100k)
Taxable dividends: $1,543 (reported on 16.3% of returns)
Here:
$1,543
State:
$4,306
(% of AGI for various income ranges: 1.9% for AGIs below $10k, 0.6% for AGIs $10k-25k, 0.4% for AGIs $25k-50k, 0.5% for AGIs $50k-75k, 0.7% for AGIs $75k-100k, 0.8% for AGIs over 100k)
Net capital gain/loss: +$11,854 (reported on 12.8% of returns)
Here:
+$11,854
State:
+$17,321
(% of AGI for various income ranges: -0.6% for AGIs below $10k, -0.0% for AGIs $10k-25k, 0.2% for AGIs $25k-50k, 0.6% for AGIs $50k-75k, 1.6% for AGIs $75k-100k, 11.4% for AGIs over 100k)
Profit/loss from business: +$9,441 (reported on 13.9% of returns)
Here:
+$9,441
State:
+$11,771
(% of AGI for various income ranges: 15.0% for AGIs below $10k, 6.1% for AGIs $10k-25k, 1.6% for AGIs $25k-50k, 1.1% for AGIs $50k-75k, 1.2% for AGIs $75k-100k, 5.1% for AGIs over 100k)
IRA payment deduction: $2,979 (reported on 2.7% of returns)
60616:
$2,979
Illinois:
$3,087
(% of AGI for various income ranges: 0.2% for AGIs below $10k, 0.4% for AGIs $10k-25k, 0.3% for AGIs $25k-50k, 0.1% for AGIs $50k-75k, 0.1% for AGIs $75k-100k, 0.1% for AGIs over 100k)
Self-employed pension: $16,684 (reported on 0.4% of returns)
Here:
$16,684
Illinois:
$16,965
(% of AGI for various income ranges: 0.0% for AGIs $10k-25k, 0.1% for AGIs $50k-75k, 0.5% for AGIs over 100k)
Total itemized deductions: $17,594 (22% of AGI, reported on 25.8% of returns)
Here:
$17,594
State:
$20,239
Here:
22.0% of AGI
State:
19.5% of AGI
(% of AGI for various income ranges: 13.1% for AGIs below $10k, 4.8% for AGIs $10k-25k, 8.7% for AGIs $25k-50k, 13.3% for AGIs $50k-75k, 15.1% for AGIs $75k-100k, 13.4% for AGIs over 100k)
Charity contributions deductions: $3,741 (4% of AGI, reported on 20.6% of returns)
Here:
$3,741
State:
$3,719
Here:
4.2% of AGI
State:
3.4% of AGI
(% of AGI for various income ranges: 0.2% for AGIs below $10k, 0.5% for AGIs $10k-25k, 1.6% for AGIs $25k-50k, 2.3% for AGIs $50k-75k, 2.3% for AGIs $75k-100k, 2.6% for AGIs over 100k)
Total tax: $6,744 (reported on 70.6% of returns)
60616:
$6,744
State:
$9,882
(% of AGI for various income ranges: 3.6% for AGIs below $10k, 3.8% for AGIs $10k-25k, 7.6% for AGIs $25k-50k, 11.3% for AGIs $50k-75k, 13.0% for AGIs $75k-100k, 19.3% for AGIs over 100k)
Earned income credit: $1,800 (reported on 23.0% of returns)
Here:
$1,800
State:
$1,788
Percentage of individuals using paid preparers for their 2004 taxes: 59.4%
Here:
59%
State:
61%
(% for various income ranges: 57.3% for AGIs below $10k, 65.7% for AGIs $10k-25k, 55.2% for AGIs $25k-50k, 56.0% for AGIs $50k-75k, 61.7% for AGIs $75k-100k, 64.4% for AGIs over 100k)
Likely homosexual households (counted as self-reported same-sex unmarried-partner households)
Lesbian couples: 0.1% of all households
Gay men: 0.1% of all households
Household received Food Stamps/SNAP in the past 12 months: 4,788 Household did not receive Food Stamps/SNAP in the past 12 months: 20,533
Women who had a birth in the past 12 months: 338 (312 now married, 24 unmarried) Women who did not have a birth in the past 12 months: 13,201 (5,026 now married, 8,182 unmarried)
Housing units in zip code 60616 with a mortgage: 5,983 (304 second mortgage, 3 home equity loan, 233 both second mortgage and home equity loan) Houses without a mortgage: 244
Median monthly owner costs for units with a mortgage: $2,536 Median monthly owner costs for units without a mortgage: $954
Residents with income below the poverty level in 2022:
This zip code:
16.4%
Whole state:
11.9%
Residents with income below 50% of the poverty level in 2022:
This zip code:
7.0%
Whole state:
5.7%
Median number of rooms in houses and condos:
Here:
4.8
State:
6.4
Median number of rooms in apartments:
Here:
3.4
State:
4.1
Notable locations in this zip code not listed on our city pages
Notable locations in zip code 60616: Lake Meadows Tennis Club (A), Automobile Row (B), U S Cellular Field (C), Bumham Park Harbor Light (D), William W Kimball House (E), Henry B Clarke House (F), Glessner House (G), Coleman House (H), Chicago Fire Department District 1 Station 8 (I), Chicago Fire Department District 1 Station 19 (J), Alumni Memorial Hall (K), Armour Square Park Field House (L), Arthur S Keating Sports Center (M), Wishnick Hall (N), Carman Hall (O), Chicago Daily Defender Building (P), Chinatown City Hall (Q), Commons Building (R), Grover M Hermann Hall (S), Machinery Hall (T). Display/hide their locations on the map
Churches in zip code 60616 include: Allen Temple African Methodist Episcopal Church (A), Doremus Congregational Church (B), Chinese Christian Union Church (C), Providence of God Roman Catholic Church (D), Quinn Chapel African Methodist Episcopal Church (E), Saint Anthony of Padua Roman Catholic Church (F), Saint David Roman Catholic Church (G), Saint James Roman Catholic Church (H), Saint Jeromes Roman Catholic Church (I). Display/hide their locations on the map
Parks in zip code 60616 include: Jefferson Park (1), Prairie Avenue Historic District (2), Lake Meadows Park (3), Armour Square Park (4), Groveland Park (5), Douglas Monument Park (6), Hardin Square (7), Dunbar Park (8), Woodland Park (9). Display/hide their locations on the map
3,714 married couples with children.
2,280 single-parent households (304 men, 1,976 women).
56.4% of residents of 60616 zip code speak English at home.
5.1% of residents speak Spanish at home (77% very well, 15% well, 6% not well, 2% not at all).
6.9% of residents speak other Indo-European language at home (69% very well, 22% well, 8% not well, 1% not at all).
28.0% of residents speak Asian or Pacific Island language at home (36% very well, 23% well, 20% not well, 20% not at all).
3.0% of residents speak other language at home (89% very well, 10% well).
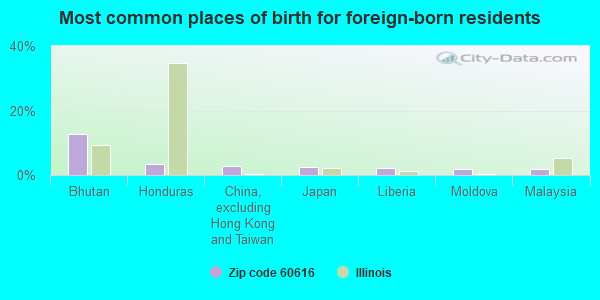
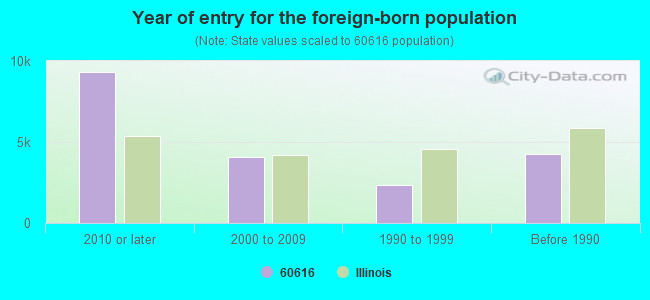
Foreign born population: 18,419 (35.4%) (47.7% of them are naturalized citizens)
Major facilities with environmental interests located in this zip code:
ALLIED METAL CO (2059 SOUTH CANAL STREET in CHICAGO, IL)
STATE MASTER (Illinois EPA Project) - AIR PROGRAM, HAZARDOUS WASTE PROGRAM, SOLID WASTE PROGRAM AIR MAJOR (AIRS/AFS) (Integrated Compliance Information System) - ICIS-05-1998-0555, FORMAL ENFORCEMENT ACTION, ICIS-05-1998-0711, COMPLIANCE ACTIVITY (Tracking inspections of insecticide, fungicide, and rodenticide, and toxic substances) CRITERIA AND HAZARDOUS AIR POLLUTANT INVENTORY (Inventory of air pollution sources) (Resource Conservation and Recovery Act (tracking hazardous waste)) TRI REPORTER (Tracking of toxic chemicals releasing facilities) Business SIC classification: SECONDARY SMELTING AND REFINING OF NONFERROUS METALS; ROLLING, DRAWING, AND EXTRUDING OF COPPER; ROLLING, DRAWING, AND EXTRUDING OF NONFERROUS METALS, EXCEPT COPPER AND ALUMINUM Business NAICS classification: COPPER ROLLING, DRAWING, AND EXTRUDING.
OZINGA CHICAGO RMC INC (2255 SOUTH LUMBER STREET in CHICAGO, IL)
STATE MASTER (Illinois EPA Project) - SOLID WASTE PROGRAM, HAZARDOUS WASTE PROGRAM, AIR PROGRAM AIR MINOR (AIRS/AFS) CRITERIA AND HAZARDOUS AIR POLLUTANT INVENTORY (Inventory of air pollution sources) National Pollutant Discharge Elimination System NON-MAJOR (Tracking pollutant discharge elimination systems) - permit (Resource Conservation and Recovery Act (tracking hazardous waste)) TRI REPORTER (Tracking of toxic chemicals releasing facilities) Business SIC classification: READY-MIXED CONCRETE Business NAICS classification: READY-MIX CONCRETE MANUFACTURING. Organizations: ILLINOIS OZINGA PLANTS (CONTACT/OWNER)
, OZINGA TRANSPROT (CONTACT/OWNER)
Alternative names: IL OZINGA PLANTS-CHICAGO, OZINGA BROTHERS INCORPORATED, OZINGA CHICAGO RMC - 22ND ST., OZINGA TRANSPORT
LAKE MEADOWS HOUSING DEVELOPMENT (500 E 33RD ST in CHICAGO, IL)
STATE MASTER (Illinois EPA Project) - AIR PROGRAM STATE MASTER (Illinois EPA Project) - SOLID WASTE PROGRAM, AIR PROGRAM AIR MINOR (AIRS/AFS) Business SIC classification: ELECTRICAL APPLIANCES, TELEVISION AND RADIO SETS; OPERATORS OF APARTMENT BUILDINGS Alternative names: LAKE MEADOWS ASSOCIATES
ACME REFINING (3357 S JUSTINE in CHICAGO, IL)
STATE MASTER (Illinois EPA Project) - SOLID WASTE PROGRAM, HAZARDOUS WASTE PROGRAM, AIR PROGRAM AIR MINOR (AIRS/AFS) National Pollutant Discharge Elimination System NON-MAJOR (Tracking pollutant discharge elimination systems) - permit Large Quantity Generators, more that 1000 kg of hazardous waste/month (Resource Conservation and Recovery Act (tracking hazardous waste)) - notification Business SIC classification: SCRAP AND WASTE MATERIALS; NONCLASSIFIABLE ESTABLISHMENTS Alternative names: ACME REFINING CO-CHICAGO
IL INSTITUTE OF TECHNOLOGY (3324 S FEDERAL ST in CHICAGO, IL)
STATE MASTER (Illinois EPA Project) - SOLID WASTE PROGRAM, HAZARDOUS WASTE PROGRAM (Integrated Compliance Information System) - ICIS-05-1998-0018, FORMAL ENFORCEMENT ACTION COMPLIANCE ACTIVITY (Tracking inspections of insecticide, fungicide, and rodenticide, and toxic substances) Small Quantity Generators, between 100 kg and 1000 kg of hazardous waste/month (Resource Conservation and Recovery Act (tracking hazardous waste)) - notification Business SIC classification: COLLEGES, UNIVERSITIES, AND PROFESSIONAL SCHOOLS Organizations: ILLINOIS INSTITUTE OF TECHNOLOGY (CONTACT/OWNER)
MICHAEL REESE HOSPITAL (2929 SOUTH ELLIS AVENUE in CHICAGO, IL)
STATE MASTER (Illinois EPA Project) - AIR PROGRAM AIR MINOR (AIRS/AFS) HAZARDOUS WASTE BIENNIAL REPORTER (Resource Conservation and Recovery Act (tracking hazardous waste)) Small Quantity Generators, between 100 kg and 1000 kg of hazardous waste/month (Resource Conservation and Recovery Act (tracking hazardous waste)) - notification Business SIC classification: GENERAL MEDICAL AND SURGICAL HOSPITALS Organizations: HUMANA HOSPITAL IL (CONTACT/OWNER)
Alternative names: COLUMBIA MICHAEL REESE HOSPITAL & MEDical center, MICHAEL REESE HOSPITAL AND MEDICAL CTR
AIRCO INDUSTRIAL GASES (1856 S LUMBER ST in CHICAGO, IL)
STATE MASTER (Illinois EPA Project) - SOLID WASTE PROGRAM STATE MASTER (Illinois EPA Project) - National Pollutant Discharge Elimination System Permit Small Quantity Generators, between 100 kg and 1000 kg of hazardous waste/month (Resource Conservation and Recovery Act (tracking hazardous waste)) - notification Organizations: AIRCO INCORPORATED (CONTACT/OWNER)
RAY GRAHAM TRAINING CENTER (2347 S WABASH in CHICAGO, IL)
STATE MASTER (Illinois EPA Project) - HAZARDOUS WASTE PROGRAM (National Center for Education Statistics) - STATE ID-1501629903715 Small Quantity Generators, between 100 kg and 1000 kg of hazardous waste/month (Resource Conservation and Recovery Act (tracking hazardous waste)) - notification Organizations: CHICAGO PUBLIC SCHOOLS (CONTACT/OWNER)
, CITY OF CHICAGO SCHOOL DIST 299 (SCHOOL DISTRICT)
Alternative names: GRAHAM RAY TRAINING CENTER
DANIEL HALE WILLIAMS ELEM SCH (2710 S DEARBORN ST in CHICAGO, IL)
STATE MASTER (Illinois EPA Project) - HAZARDOUS WASTE PROGRAM (National Center for Education Statistics) - STATE ID-1501629902518 Organizations: CITY OF CHICAGO SCHOOL DIST 299 (SCHOOL DISTRICT)
ILLINOIS INSTITUTE OF TECHNOLO (3105 S FEDERAL ST in CHICAGO, IL)
STATE MASTER (Illinois EPA Project) - SOLID WASTE PROGRAM, HAZARDOUS WASTE PROGRAM Small Quantity Generators, between 100 kg and 1000 kg of hazardous waste/month (Resource Conservation and Recovery Act (tracking hazardous waste)) - notification - ICIS-, ENFORCEMENT/COMPLIANCE ACTIVITY Organizations: ILLINOIS INSTITUTE OF TECHNOLOGY (CONTACT/OWNER)
Alternative names: ILLINOIS INSTITUTE OF TECHNOLOGY
20TH SUBSTATION CTA (2001 S DEARBORN in CHICAGO, IL)
STATE MASTER (Illinois EPA Project) - SOLID WASTE PROGRAM, HAZARDOUS WASTE PROGRAM COMPLIANCE ACTIVITY (Tracking inspections of insecticide, fungicide, and rodenticide, and toxic substances) HAZARDOUS WASTE BIENNIAL REPORTER (Resource Conservation and Recovery Act (tracking hazardous waste)) Large Quantity Generators, more that 1000 kg of hazardous waste/month (Resource Conservation and Recovery Act (tracking hazardous waste)) Business NAICS classification: MIXED MODE TRANSIT SYSTEMS. Organizations: CHICAGO TRANSIT AUTHORITY (CONTACT/OPERATOR)
Alternative names: CHICAGO TRANSIT AUTHORITY
MITSUBISHI LITHOGRAPHIC PRESSES (2301 SOUTH LAKE SHORE DRIVE in CHICAGO, IL)
STATE MASTER (Illinois EPA Project) - AIR PROGRAM, HAZARDOUS WASTE PROGRAM AIR MINOR (AIRS/AFS) Small Quantity Generators, between 100 kg and 1000 kg of hazardous waste/month (Resource Conservation and Recovery Act (tracking hazardous waste)) TRANSPORTER (Resource Conservation and Recovery Act (tracking hazardous waste)) - notification Business SIC classification: NONCLASSIFIABLE ESTABLISHMENTS Organizations: MITSUBISHI\ITHOGRAPHIC PRESSES (CONTACT/OPERATOR)
Alternative names: MITSUBISHI LITHOGRAPHIC PRESSESS
ARAMARK UNIFORM SERVICES INC (2334 S MICHIGAN AVE in CHICAGO, IL)
STATE MASTER (Illinois EPA Project) - SOLID WASTE PROGRAM, AIR PROGRAM AIR MINOR (AIRS/AFS) CRITERIA AND HAZARDOUS AIR POLLUTANT INVENTORY (Inventory of air pollution sources) Conditionally Exempt Small Quantity Generators, less than 100 kg/month of hazardous waste (Resource Conservation and Recovery Act (tracking hazardous waste)) - notification Business SIC classification: LINEN SUPPLY; INDUSTRIAL LAUNDERERS Business NAICS classification: INDUSTRIAL LAUNDERERS.
Housing units lacking complete plumbing facilities: 0.2% Housing units lacking complete kitchen facilities: 0.6%
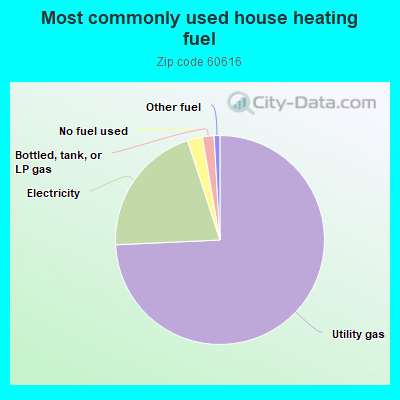
74.2%Utility gas
20.7%Electricity
2.3%No fuel used
1.8%Bottled, tank, or LP gas
0.9%Other fuel
Population in 1990: 45,750. Population change in the 1990s: +1,323 (+2.9%).
Place of birth for U.S.-born residents:
This state: 24,801
Northeast: 1,481
Midwest: 2,799
South: 2,848
West: 1,082
59% of the 60616 zip code residents lived in the same house 5 years ago. Out of people who lived in different houses, 81% lived in this county. Out of people who lived in different counties, 50% lived in Illinois.
85% of the 60616 zip code residents lived in the same house 1 year ago. Out of people who lived in different houses, 75% moved from this county. Out of people who lived in different houses, 3% moved from different county within same state. Out of people who lived in different houses, 10% moved from different state. Out of people who lived in different houses, 10% moved from abroad.
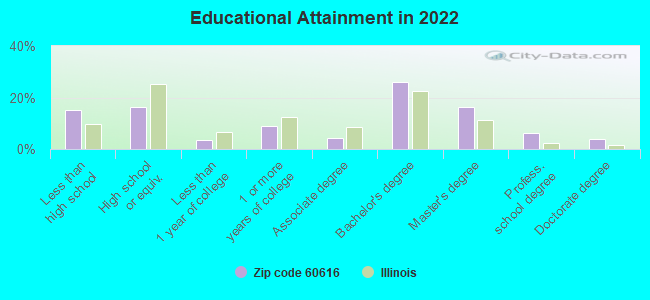
Private vs. public school enrollment:
Students in private schools in grades 1 to 8 (elementary and middle school): 734
Here:
23.8%
Illinois:
13.3%
Students in private schools in grades 9 to 12 (high school): 347
Here:
23.1%
Illinois:
9.9%
Students in private undergraduate colleges: 1,481
Here:
56.7%
Illinois:
27.4%
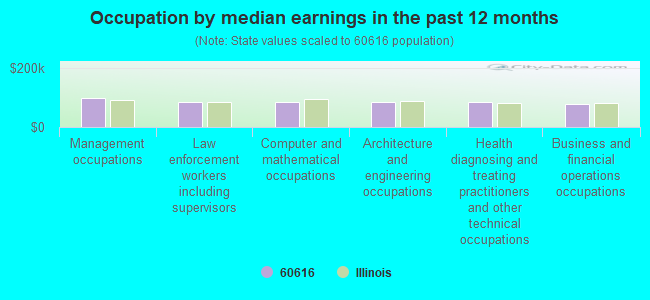
Occupation by median earnings in the past 12 months ($)
99,193Management occupations
85,912Law enforcement workers including supervisors
85,838Computer and mathematical occupations
85,388Architecture and engineering occupations
85,215Health diagnosing and treating practitioners and other technical occupations
79,449Business and financial operations occupations
Companies with biggest federal contracts located in this zip code (CHICAGO, IL):
IIT RESEARCH INSTITUTE (10 WEST 35TH STREET) : $685,313,186 in 2385 contractsfrom 1999 to 2006
Contracts for Services -- Advanced Development (R&D), Other Professional Services, Other Research and Development -- Basic Research (R&D), Engineering and Technical Services, and moreby Department of Defense, Federal Technology Service, Navy, Army, and others Signed by year:2000: $71,437,153; 2001: $113,546,078; 2002: $172,566,563; 2003: $109,608,782; 2004: $49,647,532; 2005: $104,123,013; 2006: $50,946,523.
Biggest contracts:
$15,595,171 with Department of Defense for Services -- Advanced Development (R&D). Taking place in MD. Signed on 2002-12-19. Completion date: 2002-12-19.
$7,565,377 with Federal Technology Service for Other Professional Services. Taking place in SC. Signed on 2004-12-30. Completion date: 2005-12-31.
$6,213,534 with Department of Defense for Other Research and Development -- Basic Research (R&D). Signed on 2002-03-01. Completion date: 2002-08-23.
$6,197,694 with Navy for Engineering and Technical Services. Taking place in VA. Signed on 2003-09-23. Completion date: 2006-07-01.
JAMES MCHUGH CONSTRUCTION CO (1737 SOUTH MICHIGAN AVENUE) : $83,935,590 in 23 contractsfrom 2001 to 2006
Contracts for Construction of Structures and Facilities -- Miscellaneous Buildings, Construction of Structures and Facilities -- Other Residential Buildings by Navy Signed by year:2000: $0; 2001: $26,767; 2002: $926,566; 2003: $163,898; 2004: $13,295,359; 2005: $69,503,718; 2006: $19,282.
Biggest contracts:
$66,000,000 with Navy for Construction of Structures and Facilities -- Miscellaneous Buildings. Signed on 2005-02-11. Completion date: 2007-02-07.
$13,235,000, same as above.Signed on 2004-04-21. Completion date: 2007-02-07.
$2,595,226, same as above.Signed on 2005-04-26. Completion date: 2007-02-07.
$596,636, same as above.Signed on 2005-11-30. Completion date: 2007-02-07.
MCHUGH ENTERPRISES, INC. (2222 S INDIANA AVE)
$30,800,000 with Navy for Construction of Structures and Facilities -- Miscellaneous Buildings. Signed on 2000-11-29. Completion date: 2002-07-22.
DILLON TELECOMMUNICATIONS INC (329 W 18TH ST #309; small business) : $5,607,805 in 22 contractsfrom 2000 to 2003
Contracts for Construction of Structures and Facilities -- Miscellaneous Buildings, Construction of Structures and Facilities -- Other Hospital Buildings, Maintenance, Repair or Alteration of Real Property -- Hospitals and Infirmaries, Maintenance, Repair or Alteration of Real Property -- Other Hospital Buildings, and moreby Navy, Department of Veterans Affairs Signed by year:2000: $1,875,000; 2001: $2,995,666; 2002: $250,965; 2003: $486,174; 2004: $0; 2005: $0; 2006: $0.
Biggest contracts:
$2,739,733 with Navy for Construction of Structures and Facilities -- Miscellaneous Buildings. Signed on 2001-03-27. Completion date: 2002-03-27.
$1,767,000 with Department of Veterans Affairs for Construction of Structures and Facilities -- Other Hospital Buildings. Signed on 2000-09-15. Completion date: 2001-09-15.
$296,175 with Department of Veterans Affairs for Maintenance, Repair or Alteration of Real Property -- Hospitals and Infirmaries. Signed on 2003-08-15. Completion date: 2003-05-15.
$202,000 with Department of Veterans Affairs for Maintenance, Repair or Alteration of Real Property -- Other Hospital Buildings. Signed on 2001-09-15. Completion date: 2002-03-15.
ALION-CATI CORPORATION (10 WEST 35TH STREET; small business) : $2,837,862 in 23 contractsfrom 2000 to 2005
Contracts for Defense Electronics and Communication Equipment -- Advanced Development (R&D), Services -- Basic Research (R&D), Services -- Applied Research and Exploratory Development (R&D), ADP Central Processing Unit (CPU, Computer), Analog, and moreby Navy, Army Signed by year:2000: $470,207; 2001: $180,000; 2002: $158,212; 2003: $283,458; 2004: $677,625; 2005: $1,068,360; 2006: $0.
Biggest contracts:
$583,255 with Navy for Defense Electronics and Communication Equipment -- Advanced Development (R&D). Signed on 2005-09-22. Completion date: 2006-06-30.
$350,000 with Navy for Services -- Basic Research (R&D). Taking place in CA. Signed on 2004-04-21. Completion date: 2005-09-26.
$250,000, same as above.Signed on 2003-09-25. Completion date: 2005-09-26.
$249,990, same as above.Signed on 2005-09-29. Completion date: 2005-09-26.
ILLINOIS COLLEGE OF OPTOMETRY (3241 S MICHIGAN AVE) : $1,445,613 in 52 contractsfrom 2000 to 2006
Contracts for Tuition, Registration, and Membership Fees, Educational Services, Certifications and Accreditations for Educational Institutions, Education Services by Navy, Army Signed by year:2000: $99,729; 2001: $37,290; 2002: $90,383; 2003: $78,255; 2004: $208,086; 2005: $684,429; 2006: $247,441.
Biggest contracts:
$155,300 with Navy for Tuition, Registration, and Membership Fees. Signed on 2005-11-17. Completion date: 2006-05-31.
$142,000, same as above.Signed on 2006-03-16. Completion date: 2006-08-31.
$98,500, same as above.Signed on 2005-06-15. Completion date: 2005-12-23.
$63,900, same as above.Signed on 2005-03-23. Completion date: 2005-08-31.
NEW LINK ACCESS CORPORATION (500 W CERMAK RD BOX 21; small business) : $996,135 in 43 contractsfrom 1999 to 2006
Contracts for Other Administrative Support Services, Word Processing/Typing Services, Other Management Support Services by Federal Supply Service, Navy, Public Buildings Service Signed by year:2000: $104,000; 2001: $49,000; 2002: $72,958; 2003: $82,984; 2004: $252,154; 2005: $332,275; 2006: $52,764.
Biggest contracts:
$97,610 with Federal Supply Service for Other Administrative Support Services. Signed on 2004-06-02. Completion date: 2004-07-05.
$59,998 with Navy for Word Processing/Typing Services. Taking place in IN. Signed on 2004-07-19. Completion date: 2005-09-30.
$57,612, same as above.Signed on 2005-09-16. Completion date: 2006-09-30.
$55,624, same as above.Signed on 2005-09-24. Completion date: 2006-09-30.
TECHDRIVE INC (3255 S DEARBORN ST, SUITE; small business) : $918,639 in 6 contractsfrom 2000 to 2004
Contracts for Other Defense -- Management and Support (R&D), Manufacturing Technology -- Management and Support (R&D) by Army Signed by year:2000: $70,000; 2001: $49,680; 2002: $407,331; 2003: $321,639; 2004: $69,989; 2005: $0; 2006: $0.
Biggest contracts:
$360,032 with Army for Other Defense -- Management and Support (R&D). Signed on 2002-05-30. Completion date: 2003-06-03.
$321,639, same as above.Signed on 2003-01-09. Completion date: 2004-06-04.
$70,000, same as above.Signed on 2000-03-31. Completion date: 2001-01-25.
$69,989 with Army for Manufacturing Technology -- Management and Support (R&D). Signed on 2004-12-13. Completion date: 2005-10-08.
CLARK GASKET CO , INC (500 W 31ST STREET; small business) : $366,555 in 6 contractsfrom 2000 to 2004
Contracts for Packing and Gasket Materials by Defense Logistics Agency Signed by year:2000: $244,270; 2001: $49,520; 2002: $0; 2003: $0; 2004: $72,765; 2005: $0; 2006: $0.
Biggest contracts:
$91,620 with Defense Logistics Agency for Packing and Gasket Materials. Signed on 2000-04-10. Completion date: 2000-07-09.
$72,765, same as above.Signed on 2004-09-13. Completion date: 2004-12-30.
$61,000, same as above.Signed on 2000-05-18. Completion date: 2000-07-02.
$57,600, same as above.Signed on 2000-06-13. Completion date: 2000-08-23.
NUVANT SYSTEMS, INC (10 WEST 33RD STREET, SUIT; small business)
$100,000 with Army for Other Research and Development -- Basic Research (R&D). Signed on 2002-08-05. Completion date: 2003-03-02.
Top industries in this zip code by the number of employees in 2005:
Health Care and Social Assistance: General Medical and Surgical Hospitals (over 1000 employees: 2 establishments)
Educational Services: Colleges, Universities, and Professional Schools (over 1000: 1, 500-999: 1, 50-99: 1)
Accommodation and Food Services: Food Service Contractors (500-999: 1, 50-99: 2, 20-49: 2, 10-19: 3, 1-4: 2)
Health Care and Social Assistance: Child Day Care Services (250-499: 1, 50-99: 1, 20-49: 3, 10-19: 1, 5-9: 1, 1-4: 3)
Health Care and Social Assistance: Offices of Physicians (except Mental Health Specialists) (100-249: 1, 50-99: 1, 20-49: 1, 10-19: 7, 5-9: 10, 1-4: 34)
Construction: New Multifamily Housing Construction (except Operative Builders) (250-499: 1, 20-49: 2, 5-9: 1, 1-4: 1)
Health Care and Social Assistance: Services for the Elderly and Persons with Disabilities (250-499: 1, 20-49: 1, 10-19: 2, 1-4: 2)
Administrative and Support and Waste Management and Remediation Services: Temporary Help Services (250-499: 1, 20-49: 1, 10-19: 1)
People in group quarters in 2010:
1,661 people in college/university student housing
728 people in nursing facilities/skilled-nursing facilities
152 people in group homes intended for adults
86 people in other noninstitutional facilities
14 people in residential treatment centers for adults
2 people in workers' group living quarters and job corps centers
People in group quarters in 2000:
2,092 people in college dormitories (includes college quarters off campus)
749 people in nursing homes
19 people in religious group quarters
6 people in other noninstitutional group quarters
Fatal accident statistics in 2014:
Fatal accident count: 4
Vehicles involved in fatal accidents: 5
Fatal accidents caused by drunken drivers: 3
Fatalities: 4
Persons involved in fatal accidents: 9
Pedestrians involved in fatal accidents: 1
Fatal accident statistics in 2013:
Fatal accident count: 4
Vehicles involved in fatal accidents: 5
Fatal accidents caused by drunken drivers: 1
Fatalities: 4
Persons involved in fatal accidents: 6
Pedestrians involved in fatal accidents: 1
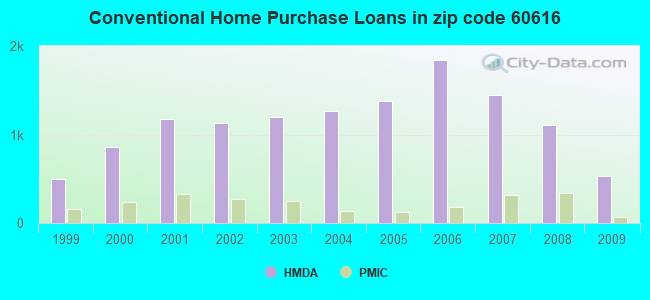
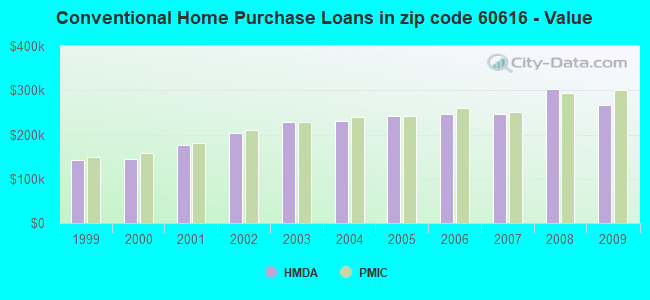
Home Mortgage Disclosure Act Aggregated Statistics For Year 2009 (Based on 32 full and 14 partial tracts)
A) FHA, FSA/RHS & VA Home Purchase Loans
B) Conventional Home Purchase Loans
C) Refinancings
D) Home Improvement Loans
E) Loans on Dwellings For 5+ Families
F) Non-occupant Loans on < 5 Family Dwellings (A B C & D)
G) Loans On Manufactured Home Dwelling (A B C & D)
Number
Average Value
Number
Average Value
Number
Average Value
Number
Average Value
Number
Average Value
Number
Average Value
Number
Average Value
LOANS ORIGINATED
111
$267,490
534
$266,593
1,398
$266,402
21
$134,811
14
$319,853
288
$253,551
2
$405,440
APPLICATIONS APPROVED, NOT ACCEPTED
10
$338,758
65
$274,912
124
$267,436
6
$149,462
2
$1,195,440
28
$265,974
1
$321,960
APPLICATIONS DENIED
31
$251,256
162
$303,195
465
$276,471
18
$82,573
1
$4,366,960
118
$254,819
1
$21,000
APPLICATIONS WITHDRAWN
13
$282,309
62
$288,127
223
$274,331
6
$145,825
1
$976,820
54
$242,347
0
$0
FILES CLOSED FOR INCOMPLETENESS
4
$248,898
23
$408,491
104
$263,775
0
$0
0
$0
14
$207,894
0
$0
Aggregated Statistics For Year 2008 (Based on 32 full and 14 partial tracts)
A) FHA, FSA/RHS & VA Home Purchase Loans
B) Conventional Home Purchase Loans
C) Refinancings
D) Home Improvement Loans
E) Loans on Dwellings For 5+ Families
F) Non-occupant Loans on < 5 Family Dwellings (A B C & D)
Number
Average Value
Number
Average Value
Number
Average Value
Number
Average Value
Number
Average Value
Number
Average Value
LOANS ORIGINATED
21
$234,005
1,110
$303,674
980
$271,740
51
$116,140
41
$1,033,298
424
$297,609
APPLICATIONS APPROVED, NOT ACCEPTED
4
$158,410
148
$367,285
121
$285,630
7
$105,696
2
$579,900
53
$300,247
APPLICATIONS DENIED
20
$264,184
319
$347,936
437
$278,723
49
$68,234
1
$350,000
150
$275,573
APPLICATIONS WITHDRAWN
3
$215,640
147
$304,483
151
$260,142
11
$292,060
0
$0
76
$259,756
FILES CLOSED FOR INCOMPLETENESS
6
$273,533
57
$335,373
70
$269,939
6
$100,770
0
$0
23
$350,387
Aggregated Statistics For Year 2007 (Based on 32 full and 16 partial tracts)
A) FHA, FSA/RHS & VA Home Purchase Loans
B) Conventional Home Purchase Loans
C) Refinancings
D) Home Improvement Loans
E) Loans on Dwellings For 5+ Families
F) Non-occupant Loans on < 5 Family Dwellings (A B C & D)
G) Loans On Manufactured Home Dwelling (A B C & D)
Number
Average Value
Number
Average Value
Number
Average Value
Number
Average Value
Number
Average Value
Number
Average Value
Number
Average Value
LOANS ORIGINATED
2
$262,000
1,450
$246,001
1,012
$264,432
102
$131,475
20
$362,829
445
$241,302
2
$90,965
APPLICATIONS APPROVED, NOT ACCEPTED
1
$147,100
225
$240,260
178
$260,380
19
$59,194
0
$0
69
$256,927
0
$0
APPLICATIONS DENIED
2
$131,355
333
$263,145
536
$282,349
81
$112,964
1
$500,000
139
$260,183
4
$24,768
APPLICATIONS WITHDRAWN
1
$187,000
153
$248,308
169
$302,598
25
$174,310
0
$0
60
$244,394
0
$0
FILES CLOSED FOR INCOMPLETENESS
1
$186,480
64
$285,349
101
$282,046
3
$109,333
0
$0
26
$203,912
0
$0
Aggregated Statistics For Year 2006 (Based on 32 full and 16 partial tracts)
A) FHA, FSA/RHS & VA Home Purchase Loans
B) Conventional Home Purchase Loans
C) Refinancings
D) Home Improvement Loans
E) Loans on Dwellings For 5+ Families
F) Non-occupant Loans on < 5 Family Dwellings (A B C & D)
G) Loans On Manufactured Home Dwelling (A B C & D)
Number
Average Value
Number
Average Value
Number
Average Value
Number
Average Value
Number
Average Value
Number
Average Value
Number
Average Value
LOANS ORIGINATED
8
$135,818
1,839
$246,401
951
$242,771
94
$560,902
27
$853,345
523
$352,747
3
$5,453
APPLICATIONS APPROVED, NOT ACCEPTED
0
$0
282
$228,910
171
$226,802
40
$125,259
0
$0
68
$264,022
1
$70,000
APPLICATIONS DENIED
5
$181,782
473
$236,294
510
$252,173
67
$94,230
2
$222,260
153
$242,044
1
$24,710
APPLICATIONS WITHDRAWN
1
$116,000
231
$245,165
234
$244,288
15
$169,108
3
$439,800
65
$209,189
0
$0
FILES CLOSED FOR INCOMPLETENESS
0
$0
77
$265,878
91
$261,345
5
$131,816
0
$0
23
$235,190
0
$0
Aggregated Statistics For Year 2005 (Based on 31 full and 16 partial tracts)
A) FHA, FSA/RHS & VA Home Purchase Loans
B) Conventional Home Purchase Loans
C) Refinancings
D) Home Improvement Loans
E) Loans on Dwellings For 5+ Families
F) Non-occupant Loans on < 5 Family Dwellings (A B C & D)
G) Loans On Manufactured Home Dwelling (A B C & D)
Number
Average Value
Number
Average Value
Number
Average Value
Number
Average Value
Number
Average Value
Number
Average Value
Number
Average Value
LOANS ORIGINATED
5
$152,600
1,381
$242,138
1,129
$239,965
101
$85,839
31
$388,138
349
$249,407
1
$62,630
APPLICATIONS APPROVED, NOT ACCEPTED
0
$0
173
$237,049
161
$220,549
24
$72,146
2
$997,055
47
$217,731
0
$0
APPLICATIONS DENIED
3
$241,000
307
$252,733
504
$229,327
65
$65,170
2
$52,940
80
$240,872
3
$146,707
APPLICATIONS WITHDRAWN
0
$0
215
$225,385
308
$231,239
29
$126,850
3
$604,650
65
$229,659
6
$66,073
FILES CLOSED FOR INCOMPLETENESS
1
$160,310
51
$268,964
91
$271,658
6
$51,140
0
$0
15
$324,823
0
$0
Aggregated Statistics For Year 2004 (Based on 30 full and 16 partial tracts)
A) FHA, FSA/RHS & VA Home Purchase Loans
B) Conventional Home Purchase Loans
C) Refinancings
D) Home Improvement Loans
E) Loans on Dwellings For 5+ Families
F) Non-occupant Loans on < 5 Family Dwellings (A B C & D)
G) Loans On Manufactured Home Dwelling (A B C & D)
Number
Average Value
Number
Average Value
Number
Average Value
Number
Average Value
Number
Average Value
Number
Average Value
Number
Average Value
LOANS ORIGINATED
14
$157,809
1,260
$230,194
1,297
$215,132
95
$79,280
55
$577,966
334
$200,844
4
$90,720
APPLICATIONS APPROVED, NOT ACCEPTED
0
$0
154
$248,745
206
$191,403
18
$94,494
0
$0
43
$223,424
0
$0
APPLICATIONS DENIED
2
$161,460
254
$226,647
529
$210,327
72
$104,055
3
$2,007,917
95
$206,732
5
$60,884
APPLICATIONS WITHDRAWN
7
$190,027
94
$227,565
223
$209,298
12
$89,192
3
$426,427
39
$246,684
1
$41,370
FILES CLOSED FOR INCOMPLETENESS
3
$163,333
41
$237,325
127
$210,973
12
$104,063
0
$0
16
$213,939
0
$0
Aggregated Statistics For Year 2003 (Based on 32 full and 16 partial tracts)
A) FHA, FSA/RHS & VA Home Purchase Loans
B) Conventional Home Purchase Loans
C) Refinancings
D) Home Improvement Loans
E) Loans on Dwellings For 5+ Families
F) Non-occupant Loans on < 5 Family Dwellings (A B C & D)
Number
Average Value
Number
Average Value
Number
Average Value
Number
Average Value
Number
Average Value
Number
Average Value
LOANS ORIGINATED
16
$163,442
1,202
$227,639
2,513
$190,602
80
$54,000
50
$1,064,112
337
$189,112
APPLICATIONS APPROVED, NOT ACCEPTED
3
$211,000
153
$238,338
310
$179,688
14
$60,965
3
$757,493
50
$200,325
APPLICATIONS DENIED
8
$167,235
193
$223,995
599
$195,461
63
$59,031
2
$645,000
79
$166,788
APPLICATIONS WITHDRAWN
12
$179,139
110
$219,091
273
$194,866
11
$51,021
1
$1,000,000
24
$147,274
FILES CLOSED FOR INCOMPLETENESS
1
$129,000
47
$248,991
101
$198,496
4
$41,470
0
$0
17
$215,062
Aggregated Statistics For Year 2002 (Based on 32 full and 16 partial tracts)
A) FHA, FSA/RHS & VA Home Purchase Loans
B) Conventional Home Purchase Loans
C) Refinancings
D) Home Improvement Loans
E) Loans on Dwellings For 5+ Families
F) Non-occupant Loans on < 5 Family Dwellings (A B C & D)
Number
Average Value
Number
Average Value
Number
Average Value
Number
Average Value
Number
Average Value
Number
Average Value
LOANS ORIGINATED
35
$125,330
1,129
$202,990
1,621
$192,326
92
$46,790
25
$1,082,544
282
$180,412
APPLICATIONS APPROVED, NOT ACCEPTED
8
$144,610
146
$213,134
222
$181,342
27
$39,836
0
$0
35
$155,360
APPLICATIONS DENIED
11
$143,225
164
$177,400
380
$157,069
47
$32,588
0
$0
55
$123,295
APPLICATIONS WITHDRAWN
10
$134,094
122
$196,811
205
$176,920
14
$55,046
1
$2,000,000
41
$128,499
FILES CLOSED FOR INCOMPLETENESS
2
$179,955
49
$188,090
132
$167,638
6
$44,415
0
$0
12
$139,663
Aggregated Statistics For Year 2001 (Based on 32 full and 16 partial tracts)
A) FHA, FSA/RHS & VA Home Purchase Loans
B) Conventional Home Purchase Loans
C) Refinancings
D) Home Improvement Loans
E) Loans on Dwellings For 5+ Families
F) Non-occupant Loans on < 5 Family Dwellings (A B C & D)
Number
Average Value
Number
Average Value
Number
Average Value
Number
Average Value
Number
Average Value
Number
Average Value
LOANS ORIGINATED
94
$117,364
1,171
$177,148
1,262
$175,766
107
$43,532
40
$294,996
225
$149,231
APPLICATIONS APPROVED, NOT ACCEPTED
2
$104,500
119
$171,131
165
$151,047
15
$53,591
5
$240,464
21
$129,090
APPLICATIONS DENIED
11
$116,953
175
$164,190
295
$150,657
68
$23,429
1
$425,000
36
$154,428
APPLICATIONS WITHDRAWN
17
$141,177
115
$192,373
178
$150,902
20
$34,408
1
$366,760
26
$128,160
FILES CLOSED FOR INCOMPLETENESS
3
$123,667
34
$205,144
58
$192,203
5
$50,230
0
$0
8
$157,846
Aggregated Statistics For Year 2000 (Based on 29 full and 16 partial tracts)
A) FHA, FSA/RHS & VA Home Purchase Loans
B) Conventional Home Purchase Loans
C) Refinancings
D) Home Improvement Loans
E) Loans on Dwellings For 5+ Families
F) Non-occupant Loans on < 5 Family Dwellings (A B C & D)
Number
Average Value
Number
Average Value
Number
Average Value
Number
Average Value
Number
Average Value
Number
Average Value
LOANS ORIGINATED
101
$102,207
858
$144,730
317
$143,579
112
$38,027
31
$2,375,578
149
$122,943
APPLICATIONS APPROVED, NOT ACCEPTED
8
$109,208
115
$165,769
70
$133,470
29
$28,013
2
$382,565
17
$97,548
APPLICATIONS DENIED
21
$124,665
214
$130,217
209
$121,943
61
$36,976
2
$19,925
45
$83,070
APPLICATIONS WITHDRAWN
12
$88,334
117
$133,163
111
$123,890
16
$20,908
5
$1,709,190
25
$94,648
FILES CLOSED FOR INCOMPLETENESS
4
$111,755
47
$163,176
40
$143,249
1
$2,870
2
$693,700
2
$164,000
Aggregated Statistics For Year 1999 (Based on 22 full and 8 partial tracts)
A) FHA, FSA/RHS & VA Home Purchase Loans
B) Conventional Home Purchase Loans
C) Refinancings
D) Home Improvement Loans
E) Loans on Dwellings For 5+ Families
F) Non-occupant Loans on < 5 Family Dwellings (A B C & D)
2002 - 2018 National Fire Incident Reporting System (NFIRS) incidents
According to the data from the years 2002 - 2018 the average number of fires per year is 234. The highest number of fires - 449 took place in 2009, and the least - 0 in 2005. The data has a declining trend.
When looking into fire subcategories, the most incidents belonged to: Structure Fires (43.7%), and Outside Fires (23.9%).
Fire incident types reported to NFIRS in Zip Code 60616


 Nearest zip codes: 60605, 60653, 60604, 60603, 60602, 60606.


 According to the data from the years 2002 - 2018 the average number of fires per year is 234. The highest number of fires - 449 took place in 2009, and the least - 0 in 2005. The data has a declining trend.
 When looking into fire subcategories, the most incidents belonged to: Structure Fires (43.7%), and Outside Fires (23.9%).