Estimated zip code population in 2022: 26,625 Zip code population in 2010: 35,912 Zip code population in 2000: 47,514
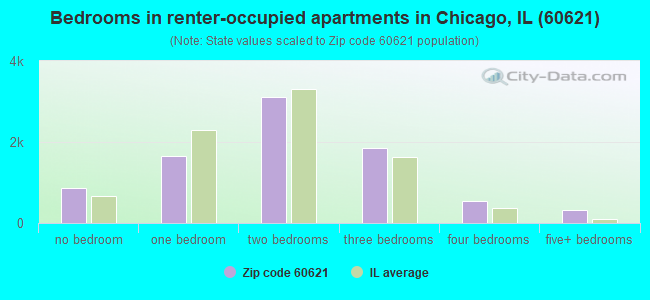
Houses and condos: 15,563 Renter-occupied apartments: 8,347
% of renters here:
74%
State:
33%
March 2022 cost of living index in zip code 60621: 100.7 (near average, U.S. average is 100)
Land area: 3.7 sq. mi. Water area: 0.0 sq. mi.
Population density: 7,142 people per square mile
(high).
OSM Map
General Map
Google Map
MSN Map
OSM Map
General Map
Google Map
MSN Map
OSM Map
General Map
Google Map
MSN Map
OSM Map
General Map
Google Map
MSN Map
Please wait while loading the map...
Real estate property taxes paid for housing units in 2022:
This zip code:
1.4% ($1,819)
Illinois:
2.0% ($4,912)
Median real estate property taxes paid for housing units with mortgages in 2022: $1,808 (1.5%) Median real estate property taxes paid for housing units with no mortgage in 2022: $1,840 (1.3%)
Business Search- 14 Million verified businesses
Males: 13,110
(49.2%)
Females: 13,515
(50.8%)
For population 25 years and over in 60621:
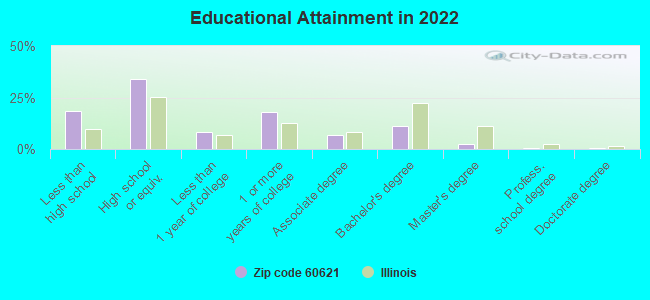
High school or higher: 80.0%
Bachelor's degree or higher: 14.3%
Graduate or professional degree: 3.4%
Unemployed: 15.5%
Mean travel time to work (commute): 38.2 minutes
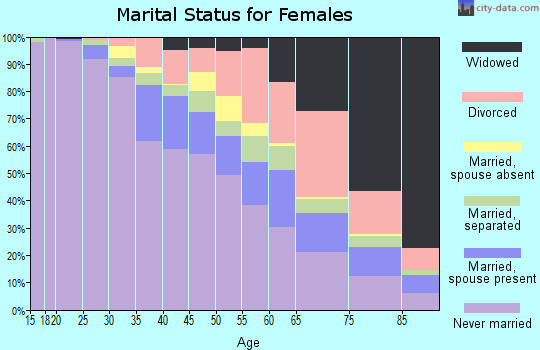
For population 15 years and over in 60621:
Never married: 59.0%
Now married: 19.5%
Separated: 3.6%
Widowed: 7.6%
Divorced: 10.3%
Zip code 60621 compared to state average:
Median household income significantly below state average.
Median house value below state average.
Unemployed percentage significantly above state average.
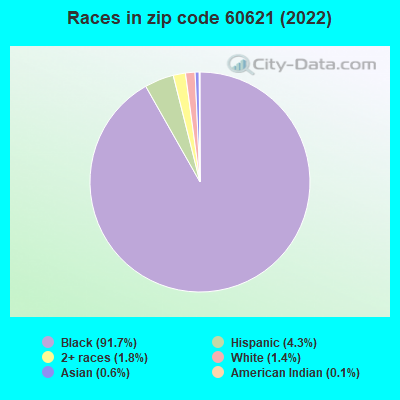
Black race population percentage significantly above state average.
Hispanic race population percentage significantly below state average.
Foreign-born population percentage significantly below state average.
Renting percentage above state average.
Length of stay since moving in significantly above state average.
House age above state average.
Percentage of population with a bachelor's degree or higher significantly below state average.
Averages for the 2020 tax year for zip code 60621, filed in 2021:
Average Adjusted Gross Income (AGI) in 2020: $26,974 (Individual Income Tax Returns)
Here:
$26,974
State:
$82,626
Salary/wage: $26,033 (reported on 83.1% of returns)
Here:
$26,033
State:
$66,640
(% of AGI for various income ranges: 1064.6% for AGIs below $25k, 3376.3% for AGIs $25k-50k, 6578.5% for AGIs $50k-75k, 9513.7% for AGIs $75k-100k, 14702.0% for AGIs $100k-200k)
Taxable interest for individuals: $275 (reported on 5.0% of returns)
This zip code:
$275
Illinois:
$2,376
(% of AGI for various income ranges: 1.4% for AGIs below $25k, 0.9% for AGIs $25k-50k, 3.4% for AGIs $50k-75k, 5.3% for AGIs $75k-100k, 10.0% for AGIs $100k-200k)
Ordinary dividends: $1,895 (reported on 1.8% of returns)
Here:
$1,895
State:
$9,061
(% of AGI for various income ranges: 0.5% for AGIs below $25k, 5.5% for AGIs $25k-50k, 22.1% for AGIs $50k-75k, 17.4% for AGIs $75k-100k)
Net capital gain/loss in AGI: +$1,229 (reported on 1.3% of returns)
Here:
+$1,229
State:
+$31,684
(% of AGI for various income ranges: 1.1% for AGIs $25k-50k, 11.8% for AGIs $50k-75k, 37.9% for AGIs $75k-100k)
Profit/loss from business: +$1,772 (reported on 22.1% of returns)
Here:
+$1,772
State:
+$12,175
(% of AGI for various income ranges: 105.1% for AGIs below $25k, 297.4% for AGIs $75k-100k)
Taxable individual retirement arrangement distribution: $8,600 (reported on 1.5% of returns)
60621:
$8,600
Illinois:
$21,613
(% of AGI for various income ranges: 5.3% for AGIs below $25k, 11.0% for AGIs $25k-50k, 421.1% for AGIs $75k-100k)
Total itemized deductions: $23,561 (reported on 2.7% of returns)
Here:
$23,561
State:
$34,948
(% of AGI for various income ranges: 8.4% for AGIs below $25k, 78.4% for AGIs $25k-50k, 260.9% for AGIs $50k-75k, 572.1% for AGIs $75k-100k, 1160.0% for AGIs $100k-200k)
Charity contributions: $8,862 (reported on 2.3% of returns)
Here:
$8,862
State:
$13,122
(% of AGI for various income ranges: 28.4% for AGIs $25k-50k, 72.5% for AGIs $50k-75k, 205.3% for AGIs $75k-100k, 472.0% for AGIs $100k-200k)
Taxes paid: $4,439 (reported on 2.7% of returns)
60621:
$4,439
State:
$8,563
(% of AGI for various income ranges: 1.1% for AGIs below $25k, 11.7% for AGIs $25k-50k, 56.3% for AGIs $50k-75k, 116.8% for AGIs $75k-100k, 263.0% for AGIs $100k-200k)
Earned income credit: $2,931 (reported on 48.6% of returns)
Here:
$2,931
State:
$2,311
(% of AGI for various income ranges: 217.0% for AGIs below $25k, 124.8% for AGIs $25k-50k)
Percentage of individuals using paid preparers for their 2020 taxes: 92.5%
Here:
93%
State:
93%
(% for various income ranges: 92.6% for AGIs below $25k, 93.1% for AGIs $25k-50k, 90.7% for AGIs $50k-75k, 89.3% for AGIs $75k-100k, 92.9% for AGIs $100k-200k)
Averages for the 2012 tax year for zip code 60621, filed in 2013:
Average Adjusted Gross Income (AGI) in 2012: $21,793 (Individual Income Tax Returns)
Here:
$21,793
State:
$68,058
Salary/wage: $21,740 (reported on 77.9% of returns)
Here:
$21,740
State:
$55,396
(% of AGI for various income ranges: 67.0% for AGIs below $25k, 87.8% for AGIs $25k-50k, 87.6% for AGIs $50k-75k, 87.8% for AGIs $75k-100k, 63.2% for AGIs $100k-200k)
Taxable interest for individuals: $386 (reported on 5.6% of returns)
This zip code:
$386
Illinois:
$1,969
(% of AGI for various income ranges: 0.2% for AGIs $25k-50k)
Ordinary dividends: $996 (reported on 1.9% of returns)
Here:
$996
State:
$7,786
(% of AGI for various income ranges: 0.2% for AGIs below $25k)
Net capital gain/loss in AGI: +$143 (reported on 0.6% of returns)
Here:
+$143
State:
+$22,183
(% of AGI for various income ranges: )
Profit/loss from business: +$8,229 (reported on 27.2% of returns)
Here:
+$8,229
State:
+$12,903
(% of AGI for various income ranges: 24.8% for AGIs below $25k, 1.2% for AGIs $75k-100k)
Taxable individual retirement arrangement distribution: $7,055 (reported on 1.6% of returns)
60621:
$7,055
Illinois:
$17,929
(% of AGI for various income ranges: 0.3% for AGIs below $25k, 0.6% for AGIs $25k-50k, 0.7% for AGIs $50k-75k, 1.4% for AGIs $75k-100k)
Total itemized deductions: $15,807 (31% of AGI, reported on 9.3% of returns)
Here:
$15,807
State:
$26,433
Here:
30.8% of AGI
State:
19.2% of AGI
(% of AGI for various income ranges: 2.2% for AGIs below $25k, 7.6% for AGIs $25k-50k, 12.3% for AGIs $50k-75k, 14.7% for AGIs $75k-100k, 11.4% for AGIs $100k-200k)
Charity contributions: $4,430 (reported on 7.6% of returns)
Here:
$4,430
State:
$4,525
(% of AGI for various income ranges: 0.4% for AGIs below $25k, 1.7% for AGIs $25k-50k, 3.0% for AGIs $50k-75k, 3.8% for AGIs $75k-100k, 3.0% for AGIs $100k-200k)
Taxes paid: $3,861 (reported on 9.2% of returns)
60621:
$3,861
State:
$11,968
(% of AGI for various income ranges: 0.4% for AGIs below $25k, 1.7% for AGIs $25k-50k, 3.0% for AGIs $50k-75k, 4.5% for AGIs $75k-100k, 3.6% for AGIs $100k-200k)
Earned income credit: $3,164 (reported on 59.7% of returns)
Here:
$3,164
State:
$2,349
(% of AGI for various income ranges: 19.1% for AGIs below $25k, 2.2% for AGIs $25k-50k)
Percentage of individuals using paid preparers for their 2012 taxes: 47.1%
Here:
47%
State:
57%
(% for various income ranges: 44.7% for AGIs below $25k, 50.8% for AGIs $25k-50k, 57.4% for AGIs $50k-75k, 65.2% for AGIs $75k-100k, 60.0% for AGIs $100k-200k)
Averages for the 2004 tax year for zip code 60621, filed in 2005:
Average Adjusted Gross Income (AGI) in 2004: $20,267 (Individual Income Tax Returns)
Here:
$20,267
State:
$54,625
Salary/wage: $20,286 (reported on 85.8% of returns)
Here:
$20,286
State:
$46,811
(% of AGI for various income ranges: 72.3% for AGIs below $10k, 81.8% for AGIs $10k-25k, 92.2% for AGIs $25k-50k, 90.6% for AGIs $50k-75k, 87.3% for AGIs $75k-100k, 60.5% for AGIs over 100k)
Taxable interest for individuals: $503 (reported on 10.5% of returns)
This zip code:
$503
Illinois:
$2,101
(% of AGI for various income ranges: 0.3% for AGIs below $10k, 0.2% for AGIs $10k-25k, 0.3% for AGIs $25k-50k, 0.2% for AGIs $50k-75k, 0.2% for AGIs $75k-100k, 0.3% for AGIs over 100k)
Taxable dividends: $438 (reported on 2.5% of returns)
Here:
$438
State:
$4,306
(% of AGI for various income ranges: 0.1% for AGIs below $10k, 0.0% for AGIs $10k-25k, 0.1% for AGIs $25k-50k, 0.0% for AGIs $50k-75k, 0.1% for AGIs $75k-100k, 0.2% for AGIs over 100k)
Net capital gain/loss: +$4,714 (reported on 1.4% of returns)
Here:
+$4,714
State:
+$17,321
(% of AGI for various income ranges: -0.0% for AGIs below $10k, 0.0% for AGIs $10k-25k, 0.1% for AGIs $25k-50k, 0.1% for AGIs $50k-75k, 11.5% for AGIs over 100k)
Profit/loss from business: +$6,257 (reported on 16.9% of returns)
Here:
+$6,257
State:
+$11,771
(% of AGI for various income ranges: 24.5% for AGIs below $10k, 9.6% for AGIs $10k-25k, -0.2% for AGIs $25k-50k, 0.1% for AGIs $50k-75k, 0.2% for AGIs $75k-100k)
IRA payment deduction: $1,840 (reported on 0.6% of returns)
60621:
$1,840
Illinois:
$3,087
Total itemized deductions: $14,563 (34% of AGI, reported on 11.4% of returns)
Here:
$14,563
State:
$20,239
Here:
34.3% of AGI
State:
19.5% of AGI
(% of AGI for various income ranges: 2.2% for AGIs below $10k, 3.6% for AGIs $10k-25k, 10.1% for AGIs $25k-50k, 13.6% for AGIs $50k-75k, 17.7% for AGIs $75k-100k, 13.1% for AGIs over 100k)
Charity contributions deductions: $4,027 (9% of AGI, reported on 10.3% of returns)
Here:
$4,027
State:
$3,719
Here:
9.2% of AGI
State:
3.4% of AGI
(% of AGI for various income ranges: 0.2% for AGIs below $10k, 0.7% for AGIs $10k-25k, 2.4% for AGIs $25k-50k, 3.8% for AGIs $50k-75k, 5.3% for AGIs $75k-100k, 5.7% for AGIs over 100k)
Total tax: $2,106 (reported on 49.5% of returns)
60621:
$2,106
State:
$9,882
(% of AGI for various income ranges: 3.9% for AGIs below $10k, 2.8% for AGIs $10k-25k, 4.6% for AGIs $25k-50k, 9.2% for AGIs $50k-75k, 11.6% for AGIs $75k-100k, 16.0% for AGIs over 100k)
Earned income credit: $2,386 (reported on 59.5% of returns)
Here:
$2,386
State:
$1,788
Percentage of individuals using paid preparers for their 2004 taxes: 69.3%
Here:
69%
State:
61%
(% for various income ranges: 69.7% for AGIs below $10k, 73.3% for AGIs $10k-25k, 62.4% for AGIs $25k-50k, 64.7% for AGIs $50k-75k, 66.4% for AGIs $75k-100k, 63.0% for AGIs over 100k)
Likely homosexual households (counted as self-reported same-sex unmarried-partner households)
Lesbian couples: 0.1% of all households
Gay men: 0.0% of all households
Household received Food Stamps/SNAP in the past 12 months: 6,423 Household did not receive Food Stamps/SNAP in the past 12 months: 5,512
Women who had a birth in the past 12 months: 305 (83 now married, 223 unmarried) Women who did not have a birth in the past 12 months: 5,916 (855 now married, 5,115 unmarried)
Housing units in zip code 60621 with a mortgage: 1,342 (214 second mortgage, 147 both second mortgage and home equity loan) Median monthly owner costs for units with a mortgage: $1,414 Median monthly owner costs for units without a mortgage: $645
Residents with income below the poverty level in 2022:
This zip code:
34.5%
Whole state:
11.9%
Residents with income below 50% of the poverty level in 2022:
This zip code:
14.0%
Whole state:
5.7%
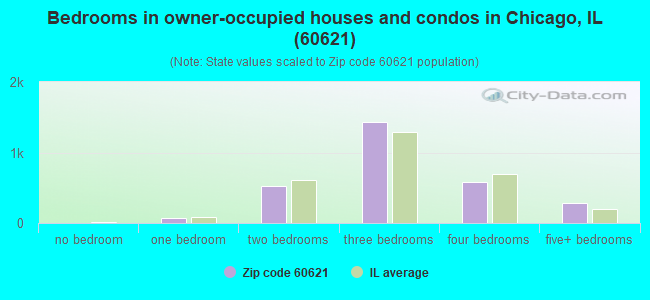
Median number of rooms in houses and condos:
Here:
6.3
State:
6.4
Median number of rooms in apartments:
Here:
4.4
State:
4.1
Notable locations in this zip code not listed on our city pages
Notable locations in zip code 60621: Chicago Junction (A), Chicago Fire Department District 5 Station 84 (B), Chicago Fire Department District 5 Station 54 (C), Chicago Engine Company 84 (D), Chicago Engine Company 54 (E), Sacred Heart Church Hall (F), Saint Carthage Convent (G). Display/hide their locations on the map
Churches in zip code 60621 include: All Nation Pentecost Assembly Church (A), Englewood Apostolic Faith Church] (B), Englewood Church of God (C), Englwood Mennonite Church (D), Englewood United Methodist Church (E), Bethel Apostolic Church of Christ (F), Bethel Lutheran Church of Englewood (G), Bishop G B Pickens Memorial Temple Church of God in Christ (H), Calvary Light Pentecostal Church (I). Display/hide their locations on the map
Parks in zip code 60621 include: Memorial Park (1), Sherwood Park (2), Shewbridge Field (3), Hamilton Park (4), Lily Gardens Park (5), Hope Park (6), Moran Park (7). Display/hide their locations on the map
1,238 married couples with children.
3,502 single-parent households (424 men, 3,078 women).
91.8% of residents of 60621 zip code speak English at home.
5.1% of residents speak Spanish at home (39% very well, 50% well, 9% not well, 3% not at all).
0.6% of residents speak other Indo-European language at home (81% very well, 11% well, 8% not well).
0.6% of residents speak Asian or Pacific Island language at home (99% very well, 1% well).
1.5% of residents speak other language at home (89% very well, 11% well).
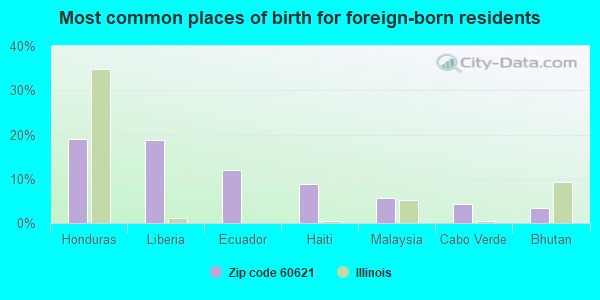
Foreign born population: 1,250 (4.7%) (59.1% of them are naturalized citizens)
Major facilities with environmental interests located in this zip code:
NATIONAL LACQUER & PAINT CO (7415 S GREEN ST in CHICAGO, IL)
STATE MASTER (Illinois EPA Project) - AIR PROGRAM, HAZARDOUS WASTE PROGRAM, SOLID WASTE PROGRAM AIR MINOR (AIRS/AFS) SUPERFUND (Superfund database) - ICIS-05-2003-0434, FORMAL ENFORCEMENT ACTION, ICIS-05-2003-0443, TRANSPORTER (Resource Conservation and Recovery Act (tracking hazardous waste)) - notification Business SIC classification: PAINTS, VARNISHES, LACQUERS, ENAMELS, AND ALLIED PRODUCTS Organizations: NATIONAL LACQUER & PAINT COMPANY (CONTACT/OWNER)
KERSHAW (6450 S LOWE in CHICAGO, IL)
STATE MASTER (Illinois EPA Project) - HAZARDOUS WASTE PROGRAM (National Center for Education Statistics) - STATE ID-1501629902294 Conditionally Exempt Small Quantity Generators, less than 100 kg/month of hazardous waste (Resource Conservation and Recovery Act (tracking hazardous waste)) - notification TRANSPORTER (Resource Conservation and Recovery Act (tracking hazardous waste)) - notification Organizations: CHICAGO PUBLIC SCHOOLS (CONTACT/OWNER)
, CITY OF CHICAGO SCHOOL DIST 299 (SCHOOL DISTRICT)
Alternative names: KERSHAW SCHOOL
PAUL ROBESON SCHOOL (6835 S NORMAL BLVD in CHICAGO, IL)
STATE MASTER (Illinois EPA Project) - SOLID WASTE PROGRAM, HAZARDOUS WASTE PROGRAM (Geographic Names Information System) (National Center for Education Statistics) - STATE ID-1501629900766 Conditionally Exempt Small Quantity Generators, less than 100 kg/month of hazardous waste (Resource Conservation and Recovery Act (tracking hazardous waste)) - notification Organizations: CHICAGO PUBLIC SCHOOLS (CONTACT/OWNER)
, CITY OF CHICAGO SCHOOL DIST 299 (SCHOOL DISTRICT)
Alternative names: ROBESON PAUL HIGH SCHOOL
PEOPLES GAS LIGHT & COKE CO (38 W 64TH ST in CHICAGO, IL)
STATE MASTER (Illinois EPA Project) - AIR PROGRAM, HAZARDOUS WASTE PROGRAM, SOLID WASTE PROGRAM AIR MINOR (AIRS/AFS) CRITERIA AND HAZARDOUS AIR POLLUTANT INVENTORY (Inventory of air pollution sources) HAZARDOUS WASTE BIENNIAL REPORTER (Resource Conservation and Recovery Act (tracking hazardous waste)) Large Quantity Generators, more that 1000 kg of hazardous waste/month (Resource Conservation and Recovery Act (tracking hazardous waste)) Business SIC classification: NATURAL GAS TRANSMISSION AND DISTRIBUTION; NATURAL GAS DISTRIBUTION Organizations: PEOPLE'S GAS LIGHT & COKE CO (CONTACT/OPERATOR)
Alternative names: PEOPLESS GAS LIGHT & COKE COMPANY
HOPE COLLEGE PREPARATORY HS (5515 S LOWE AV in CHICAGO, IL)
(National Center for Education Statistics) - STATE ID-1501629902827 (National Center for Education Statistics) - STATE ID-1501629900799 Organizations: CITY OF CHICAGO SCHOOL DIST 299 (SCHOOL DISTRICT)
CHICAGO DEPT OF ENVIRONMENT (939 W 69TH ST in CHICAGO, IL)
STATE MASTER (Illinois EPA Project) - HAZARDOUS WASTE PROGRAM, SOLID WASTE PROGRAM (Resource Conservation and Recovery Act (tracking hazardous waste)) Organizations: CITY OF CHICAGO (CONTACT/OPERATOR)
S&R METAL-FIRST KING CHURCH (5845 S MAY in CHICAGO, IL)
STATE MASTER (Illinois EPA Project) - SOLID WASTE PROGRAM (Resource Conservation and Recovery Act (tracking hazardous waste)) Organizations: FIRST KING BAPTIST CHURCH (CONTACT/OWNER)
Alternative names: S AND R METAL CO FIRST KING CHURCH
LOOP TRANSFER-64TH ST (16 W 64TH ST in CHICAGO, IL)
STATE MASTER (Illinois EPA Project) - SOLID WASTE PROGRAM, SCRAP TIRE MANAGEMENT Large Quantity Generators, more that 1000 kg of hazardous waste/month (Resource Conservation and Recovery Act (tracking hazardous waste)) Organizations: ALLIED WASTE (CONTACT/OPERATOR)
Alternative names: LOOP TRANSFER 64
61ST & LASALLE ST BUILDING CORP (6130 S. LASALLE STREET in CHICAGO, IL)
STATE MASTER (Illinois EPA Project) - AIR PROGRAM AIR MINOR (AIRS/AFS) CRITERIA AND HAZARDOUS AIR POLLUTANT INVENTORY (Inventory of air pollution sources) Business SIC classification: OPERATORS OF NONRESIDENTIAL BUILDINGS
COSMOPOLITAN TEXTILE RENTAL SERVICE (5758 S HALSTED ST in CHICAGO, IL)
STATE MASTER (Illinois EPA Project) - AIR PROGRAM AIR MINOR (AIRS/AFS) CRITERIA AND HAZARDOUS AIR POLLUTANT INVENTORY (Inventory of air pollution sources) Business SIC classification: POWER LAUNDRIES, FAMILY AND COMMERCIAL Business NAICS classification: DRYCLEANING AND LAUNDRY SERVICES (EXCEPT COIN-OPERATED). Alternative names: SAM STAURAKAS
PERKINS BASS ELEM SCHOOL-CHGO BD ED (6554 S. MAY STREET in CHICAGO, IL)
STATE MASTER (Illinois EPA Project) - AIR PROGRAM AIR MINOR (AIRS/AFS) Business SIC classification: ELEMENTARY AND SECONDARY SCHOOLS Alternative names: CHICAGO BOARD OF EDUCATION
HINTON ELEM SCHOOL (644 W 71ST ST in CHICAGO, IL)
(National Center for Education Statistics) - STATE ID-1501629902267 Conditionally Exempt Small Quantity Generators, less than 100 kg/month of hazardous waste (Resource Conservation and Recovery Act (tracking hazardous waste)) - notification TRANSPORTER (Resource Conservation and Recovery Act (tracking hazardous waste)) - notification Organizations: CHICAGO PUBLIC SCHOOLS (CONTACT/OWNER)
, CITY OF CHICAGO SCHOOL DIST 299 (SCHOOL DISTRICT)
Alternative names: HINTON WM ELEMENTARY
CHICAGO, CITY OF (44 W 64TH ST in CHICAGO, IL)
STATE MASTER (Illinois EPA Project) - HAZARDOUS WASTE PROGRAM Small Quantity Generators, between 100 kg and 1000 kg of hazardous waste/month (Resource Conservation and Recovery Act (tracking hazardous waste)) - notification Organizations: CHICAGO CITY OF (CONTACT/OWNER)
Alternative names: CHICAGO CITY OF FLEET ADMIN
Housing units lacking complete plumbing facilities: 10.6% Housing units lacking complete kitchen facilities: 11.4%
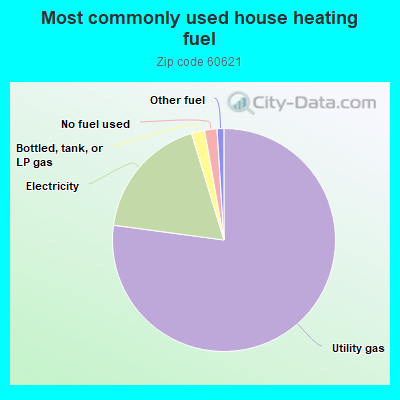
77.2%Utility gas
18.2%Electricity
1.9%Bottled, tank, or LP gas
1.8%No fuel used
1.0%Other fuel
Population in 1990: 56,458.
Place of birth for U.S.-born residents:
This state: 21,249
Northeast: 151
Midwest: 622
South: 3,015
West: 51
61% of the 60621 zip code residents lived in the same house 5 years ago. Out of people who lived in different houses, 91% lived in this county. Out of people who lived in different counties, 50% lived in Illinois.
90% of the 60621 zip code residents lived in the same house 1 year ago. Out of people who lived in different houses, 88% moved from this county. Out of people who lived in different houses, 4% moved from different county within same state. Out of people who lived in different houses, 2% moved from different state. Out of people who lived in different houses, 1% moved from abroad.
Private vs. public school enrollment:
Students in private schools in grades 1 to 8 (elementary and middle school): 289
Here:
10.6%
Illinois:
13.3%
Students in private schools in grades 9 to 12 (high school): 88
Here:
6.9%
Illinois:
9.9%
Students in private undergraduate colleges: 132
Here:
14.1%
Illinois:
27.4%
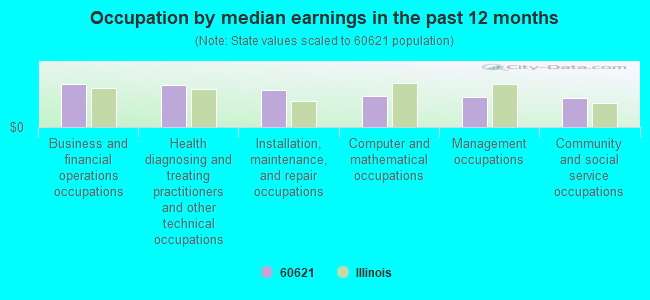
Occupation by median earnings in the past 12 months ($)
65,844Business and financial operations occupations
63,955Health diagnosing and treating practitioners and other technical occupations
55,809Installation, maintenance, and repair occupations
47,034Computer and mathematical occupations
45,216Management occupations
44,419Community and social service occupations
Top industries in this zip code by the number of employees in 2005:
Health Care and Social Assistance: General Medical and Surgical Hospitals (500-999 employees: 1 establishment)
Utilities: Natural Gas Distribution (250-499: 1)
Health Care and Social Assistance: Nursing Care Facilities (100-249: 2)
2002 - 2018 National Fire Incident Reporting System (NFIRS) incidents
According to the data from the years 2002 - 2018 the average number of fires per year is 324. The highest number of fires - 575 took place in 2010, and the least - 0 in 2005. The data has a declining trend.
When looking into fire subcategories, the most incidents belonged to: Structure Fires (41.0%), and Outside Fires (25.9%).
Fire incident types reported to NFIRS in Zip Code 60621


 Nearest zip codes: 60636, 60620, 60637, 60609, 60619, 60615.
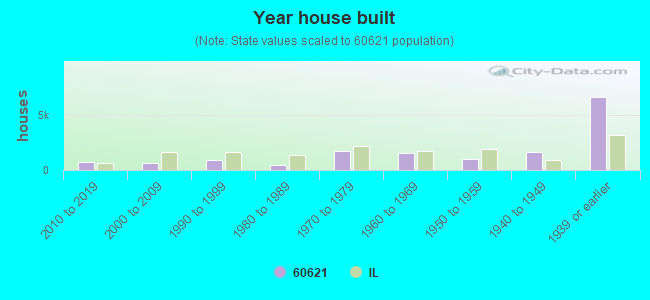


 According to the data from the years 2002 - 2018 the average number of fires per year is 324. The highest number of fires - 575 took place in 2010, and the least - 0 in 2005. The data has a declining trend.
 When looking into fire subcategories, the most incidents belonged to: Structure Fires (41.0%), and Outside Fires (25.9%).