Estimated zip code population in 2022: 34,761 Zip code population in 2010: 28,718 Zip code population in 2000: 26,522
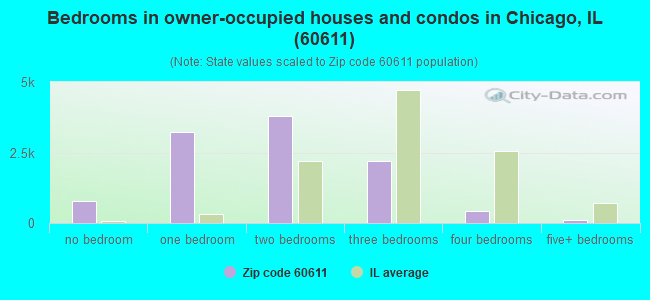
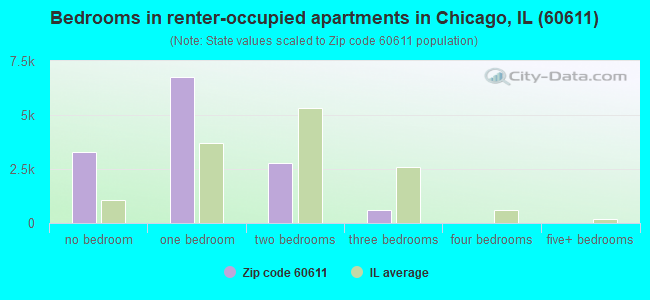
Houses and condos: 28,150 Renter-occupied apartments: 13,101
% of renters here:
56%
State:
33%
March 2022 cost of living index in zip code 60611: 106.9 (more than average, U.S. average is 100)
Land area: 0.8 sq. mi. Water area: 0.6 sq. mi.
Population density: 42,109 people per square mile
(very high).
OSM Map
General Map
Google Map
MSN Map
OSM Map
General Map
Google Map
MSN Map
OSM Map
General Map
Google Map
MSN Map
OSM Map
General Map
Google Map
MSN Map
Please wait while loading the map...
Real estate property taxes paid for housing units in 2022:
This zip code:
1.4% ($9,718)
Illinois:
2.0% ($4,912)
Median real estate property taxes paid for housing units with mortgages in 2022: $9,569 (1.5%) Median real estate property taxes paid for housing units with no mortgage in 2022: $9,944 (1.3%)
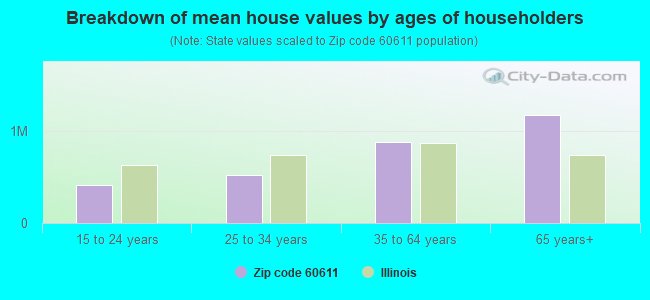
Estimated median house/condo value in 2022: $689,769
60611:
$689,769
Illinois:
$251,600
According to our research of Illinois and other state lists, there were 6 registered sex offenders living in 60611 zip code as of April 27, 2024. The ratio of all residents to sex offenders in zip code 60611 is 5,336 to 1. The ratio of registered sex offenders to all residents in this zip code is much lower than the state average.
Median resident age:
This zip code:
38.7 years
Illinois median age:
39.1 years
Average household size:
This zip code:
1.5 people
Illinois:
2.4 people
Averages for the 2020 tax year for zip code 60611, filed in 2021:
Average Adjusted Gross Income (AGI) in 2020: $314,114 (Individual Income Tax Returns)
Here:
$314,114
State:
$82,626
Salary/wage: $198,099 (reported on 79.4% of returns)
Here:
$198,099
State:
$66,640
(% of AGI for various income ranges: 1207.4% for AGIs below $25k, 3710.1% for AGIs $25k-50k, 7136.9% for AGIs $50k-75k, 10888.5% for AGIs $75k-100k, 20124.9% for AGIs $100k-200k, 190129.9% for AGIs over 200k)
Taxable interest for individuals: $12,558 (reported on 50.8% of returns)
This zip code:
$12,558
Illinois:
$2,376
(% of AGI for various income ranges: 63.2% for AGIs below $25k, 75.3% for AGIs $25k-50k, 60.9% for AGIs $50k-75k, 108.8% for AGIs $75k-100k, 304.0% for AGIs $100k-200k, 9701.4% for AGIs over 200k)
Ordinary dividends: $44,152 (reported on 51.2% of returns)
Here:
$44,152
State:
$9,061
(% of AGI for various income ranges: 160.6% for AGIs below $25k, 244.1% for AGIs $25k-50k, 247.2% for AGIs $50k-75k, 424.7% for AGIs $75k-100k, 1335.5% for AGIs $100k-200k, 33848.3% for AGIs over 200k)
Net capital gain/loss in AGI: +$163,184 (reported on 48.7% of returns)
Here:
+$163,184
State:
+$31,684
(% of AGI for various income ranges: 58.8% for AGIs below $25k, 166.7% for AGIs $25k-50k, 162.9% for AGIs $50k-75k, 351.3% for AGIs $75k-100k, 1787.1% for AGIs $100k-200k, 129333.2% for AGIs over 200k)
Profit/loss from business: +$44,850 (reported on 16.6% of returns)
Here:
+$44,850
State:
+$12,175
(% of AGI for various income ranges: 143.2% for AGIs below $25k, 282.6% for AGIs $25k-50k, 196.2% for AGIs $50k-75k, 316.6% for AGIs $75k-100k, 794.8% for AGIs $100k-200k, 9556.3% for AGIs over 200k)
Taxable individual retirement arrangement distribution: $58,215 (reported on 11.7% of returns)
60611:
$58,215
Illinois:
$21,613
(% of AGI for various income ranges: 105.2% for AGIs below $25k, 156.2% for AGIs $25k-50k, 189.7% for AGIs $50k-75k, 360.4% for AGIs $75k-100k, 1145.1% for AGIs $100k-200k, 8023.7% for AGIs over 200k)
Self-employed (Keogh) retirement plans: $39,636 (reported on 2.7% of returns)
60611:
$39,636
Illinois:
$30,962
(% of AGI for various income ranges: 19.6% for AGIs $50k-75k, 24.7% for AGIs $75k-100k, 66.9% for AGIs $100k-200k, 1624.9% for AGIs over 200k)
Total itemized deductions: $83,687 (reported on 24.4% of returns)
Here:
$83,687
State:
$34,948
(% of AGI for various income ranges: 214.1% for AGIs below $25k, 286.4% for AGIs $25k-50k, 425.5% for AGIs $50k-75k, 594.1% for AGIs $75k-100k, 1679.9% for AGIs $100k-200k, 28809.0% for AGIs over 200k)
Charity contributions: $61,634 (reported on 20.8% of returns)
Here:
$61,634
State:
$13,122
(% of AGI for various income ranges: 19.5% for AGIs below $25k, 31.9% for AGIs $25k-50k, 59.4% for AGIs $50k-75k, 97.7% for AGIs $75k-100k, 347.7% for AGIs $100k-200k, 20651.5% for AGIs over 200k)
Taxes paid: $9,374 (reported on 24.3% of returns)
60611:
$9,374
State:
$8,563
(% of AGI for various income ranges: 61.0% for AGIs below $25k, 81.0% for AGIs $25k-50k, 115.2% for AGIs $50k-75k, 192.8% for AGIs $75k-100k, 496.2% for AGIs $100k-200k, 2184.8% for AGIs over 200k)
Earned income credit: $918 (reported on 2.6% of returns)
Here:
$918
State:
$2,311
(% of AGI for various income ranges: 23.6% for AGIs below $25k, 6.2% for AGIs $25k-50k)
Percentage of individuals using paid preparers for their 2020 taxes: 93.0%
Here:
93%
State:
93%
(% for various income ranges: 90.4% for AGIs below $25k, 91.7% for AGIs $25k-50k, 94.1% for AGIs $50k-75k, 94.0% for AGIs $75k-100k, 92.9% for AGIs $100k-200k, 94.0% for AGIs over 200k)
Averages for the 2012 tax year for zip code 60611, filed in 2013:
Average Adjusted Gross Income (AGI) in 2012: $350,909 (Individual Income Tax Returns)
Here:
$350,909
State:
$68,058
Salary/wage: $179,953 (reported on 79.4% of returns)
Here:
$179,953
State:
$55,396
(% of AGI for various income ranges: 70.7% for AGIs below $25k, 80.8% for AGIs $25k-50k, 82.7% for AGIs $50k-75k, 78.5% for AGIs $75k-100k, 70.4% for AGIs $100k-200k, 34.2% for AGIs over 200k)
Taxable interest for individuals: $16,372 (reported on 55.8% of returns)
This zip code:
$16,372
Illinois:
$1,969
(% of AGI for various income ranges: 3.9% for AGIs below $25k, 1.7% for AGIs $25k-50k, 1.2% for AGIs $50k-75k, 1.2% for AGIs $75k-100k, 1.9% for AGIs $100k-200k, 2.8% for AGIs over 200k)
Ordinary dividends: $48,019 (reported on 48.3% of returns)
Here:
$48,019
State:
$7,786
(% of AGI for various income ranges: 9.0% for AGIs below $25k, 4.2% for AGIs $25k-50k, 3.1% for AGIs $50k-75k, 3.4% for AGIs $75k-100k, 5.4% for AGIs $100k-200k, 7.0% for AGIs over 200k)
Net capital gain/loss in AGI: +$200,579 (reported on 43.2% of returns)
Here:
+$200,579
State:
+$22,183
(% of AGI for various income ranges: 1.1% for AGIs below $25k, 1.2% for AGIs $25k-50k, 1.0% for AGIs $50k-75k, 1.3% for AGIs $75k-100k, 3.5% for AGIs $100k-200k, 28.9% for AGIs over 200k)
Profit/loss from business: +$51,092 (reported on 17.7% of returns)
Here:
+$51,092
State:
+$12,903
(% of AGI for various income ranges: 8.7% for AGIs below $25k, 5.5% for AGIs $25k-50k, 3.4% for AGIs $50k-75k, 3.5% for AGIs $75k-100k, 4.2% for AGIs $100k-200k, 2.3% for AGIs over 200k)
Taxable individual retirement arrangement distribution: $64,734 (reported on 14.6% of returns)
60611:
$64,734
Illinois:
$17,929
(% of AGI for various income ranges: 5.5% for AGIs below $25k, 2.8% for AGIs $25k-50k, 2.6% for AGIs $50k-75k, 3.7% for AGIs $75k-100k, 5.4% for AGIs $100k-200k, 2.4% for AGIs over 200k)
Self-employment retirement plans: $35,092 (reported on 3.5% of returns)
60611:
$35,092
Illinois:
$24,666
(% of AGI for various income ranges: 0.4% for AGIs $25k-50k, 0.2% for AGIs $50k-75k, 0.2% for AGIs $75k-100k, 0.5% for AGIs $100k-200k, 0.3% for AGIs over 200k)
Total itemized deductions: $81,053 (13% of AGI, reported on 54.0% of returns)
Here:
$81,053
State:
$26,433
Here:
13.4% of AGI
State:
19.2% of AGI
(% of AGI for various income ranges: 28.2% for AGIs below $25k, 13.2% for AGIs $25k-50k, 11.4% for AGIs $50k-75k, 12.5% for AGIs $75k-100k, 15.4% for AGIs $100k-200k, 12.1% for AGIs over 200k)
Charity contributions: $26,307 (reported on 44.9% of returns)
Here:
$26,307
State:
$4,525
(% of AGI for various income ranges: 1.5% for AGIs below $25k, 1.3% for AGIs $25k-50k, 1.2% for AGIs $50k-75k, 1.4% for AGIs $75k-100k, 2.0% for AGIs $100k-200k, 3.7% for AGIs over 200k)
Taxes paid: $38,252 (reported on 53.8% of returns)
60611:
$38,252
State:
$11,968
(% of AGI for various income ranges: 7.1% for AGIs below $25k, 4.1% for AGIs $25k-50k, 4.0% for AGIs $50k-75k, 5.0% for AGIs $75k-100k, 7.0% for AGIs $100k-200k, 5.9% for AGIs over 200k)
Earned income credit: $862 (reported on 2.6% of returns)
Here:
$862
State:
$2,349
(% of AGI for various income ranges: 1.1% for AGIs below $25k)
Percentage of individuals using paid preparers for their 2012 taxes: 58.9%
Here:
59%
State:
57%
(% for various income ranges: 51.6% for AGIs below $25k, 48.3% for AGIs $25k-50k, 47.8% for AGIs $50k-75k, 52.7% for AGIs $75k-100k, 62.0% for AGIs $100k-200k, 82.0% for AGIs over 200k)
Averages for the 2004 tax year for zip code 60611, filed in 2005:
Average Adjusted Gross Income (AGI) in 2004: $227,318 (Individual Income Tax Returns)
Here:
$227,318
State:
$54,625
Salary/wage: $124,181 (reported on 77.5% of returns)
Here:
$124,181
State:
$46,811
(% of AGI for various income ranges: 76.7% for AGIs $10k-25k, 82.3% for AGIs $25k-50k, 78.8% for AGIs $50k-75k, 75.4% for AGIs $75k-100k, 35.7% for AGIs over 100k)
Taxable interest for individuals: $16,642 (reported on 66.5% of returns)
This zip code:
$16,642
Illinois:
$2,101
(% of AGI for various income ranges: 6.5% for AGIs $10k-25k, 3.1% for AGIs $25k-50k, 2.6% for AGIs $50k-75k, 3.2% for AGIs $75k-100k, 4.7% for AGIs over 100k)
Taxable dividends: $37,618 (reported on 52.1% of returns)
Here:
$37,618
State:
$4,306
(% of AGI for various income ranges: 6.8% for AGIs $10k-25k, 3.5% for AGIs $25k-50k, 4.1% for AGIs $50k-75k, 3.7% for AGIs $75k-100k, 8.8% for AGIs over 100k)
Net capital gain/loss: +$132,748 (reported on 46.7% of returns)
Here:
+$132,748
State:
+$17,321
(% of AGI for various income ranges: 0.8% for AGIs $10k-25k, 1.3% for AGIs $25k-50k, 1.3% for AGIs $50k-75k, 3.0% for AGIs $75k-100k, 28.9% for AGIs over 100k)
Profit/loss from business: +$35,541 (reported on 19.0% of returns)
Here:
+$35,541
State:
+$11,771
(% of AGI for various income ranges: 7.2% for AGIs $10k-25k, 3.9% for AGIs $25k-50k, 4.4% for AGIs $50k-75k, 4.4% for AGIs $75k-100k, 2.7% for AGIs over 100k)
IRA payment deduction: $3,289 (reported on 3.3% of returns)
60611:
$3,289
Illinois:
$3,087
(% of AGI for various income ranges: 0.4% for AGIs $10k-25k, 0.4% for AGIs $25k-50k, 0.2% for AGIs $50k-75k, 0.1% for AGIs $75k-100k, 0.0% for AGIs over 100k)
Self-employed pension: $27,984 (reported on 4.2% of returns)
Here:
$27,984
Illinois:
$16,965
(% of AGI for various income ranges: 0.3% for AGIs $10k-25k, 0.2% for AGIs $25k-50k, 0.3% for AGIs $50k-75k, 0.4% for AGIs $75k-100k, 0.5% for AGIs over 100k)
Total itemized deductions: $50,022 (13% of AGI, reported on 53.7% of returns)
Here:
$50,022
State:
$20,239
Here:
12.7% of AGI
State:
19.5% of AGI
(% of AGI for various income ranges: 24.8% for AGIs $10k-25k, 14.7% for AGIs $25k-50k, 15.1% for AGIs $50k-75k, 16.1% for AGIs $75k-100k, 10.8% for AGIs over 100k)
Charity contributions deductions: $17,875 (4% of AGI, reported on 47.3% of returns)
Here:
$17,875
State:
$3,719
Here:
4.1% of AGI
State:
3.4% of AGI
(% of AGI for various income ranges: 2.0% for AGIs $10k-25k, 1.6% for AGIs $25k-50k, 1.9% for AGIs $50k-75k, 1.9% for AGIs $75k-100k, 3.8% for AGIs over 100k)
Total tax: $57,230 (reported on 88.3% of returns)
60611:
$57,230
State:
$9,882
(% of AGI for various income ranges: 5.4% for AGIs $10k-25k, 9.8% for AGIs $25k-50k, 13.6% for AGIs $50k-75k, 15.0% for AGIs $75k-100k, 22.7% for AGIs over 100k)
Earned income credit: $763 (reported on 3.0% of returns)
Here:
$763
State:
$1,788
Percentage of individuals using paid preparers for their 2004 taxes: 61.9%
Here:
62%
State:
61%
(% for various income ranges: 57.6% for AGIs below $10k, 52.8% for AGIs $10k-25k, 50.6% for AGIs $25k-50k, 53.5% for AGIs $50k-75k, 62.1% for AGIs $75k-100k, 78.1% for AGIs over 100k)
Likely homosexual households (counted as self-reported same-sex unmarried-partner households)
Lesbian couples: 0.1% of all households
Gay men: 0.1% of all households
Household received Food Stamps/SNAP in the past 12 months: 344 Household did not receive Food Stamps/SNAP in the past 12 months: 22,726
Women who had a birth in the past 12 months: 246 (186 now married, 60 unmarried) Women who did not have a birth in the past 12 months: 9,180 (2,821 now married, 6,387 unmarried)
Housing units in zip code 60611 with a mortgage: 5,224 (269 second mortgage, 25 home equity loan, 230 both second mortgage and home equity loan) Houses without a mortgage: 167
Median monthly owner costs for units with a mortgage: $3,729 Median monthly owner costs for units without a mortgage: $1,519
Residents with income below the poverty level in 2022:
This zip code:
9.4%
Whole state:
11.9%
Residents with income below 50% of the poverty level in 2022:
This zip code:
2.4%
Whole state:
5.7%
Median number of rooms in houses and condos:
Here:
4.1
State:
6.4
Median number of rooms in apartments:
Here:
2.6
State:
4.1
Notable locations in this zip code not listed on our city pages
Notable locations in zip code 60611: Navy Pier (A), North Pier Terminal (B), Centennial Fountain (C), Pioneer Court (D), Chicago Avenue Pumping Station (E), James W Jardine Water Purification Plant (F), North Pier (G), South Pier (H), Wrigley Building (I), Worcester House (J), Tribune Tower (K), Chicago Fire Department District 1 Station 98 (L), Sun-Times Building (M), Tarry Medical Research and Education Building (N), Terra Museum (O), Time-Life Building (P), Water Tower Place (Q), Wieboldt Hall (R), Cadillac Building (S), The Chicagoan (T). Display/hide their locations on the map
Churches in zip code 60611 include: All Angels Deaf Congregation (A), Cathedral of Saint James (B), First Church of Religious Science (C), Fourth Presbyterian Church (D), Medinah Temple (E), North Loop Ministries (F), Holy Name Cathedral (G), Saint James Cathedral-Episcopal Church Center (H). Display/hide their locations on the map
Parks in zip code 60611 include: Lake Shore Playground (1), Seneca Park (2), Lake Shore Park (3), Cityfront Plaza (4), Navy Pier Park (5), Olive Park (6). Display/hide their locations on the map
Tourist attractions (not listed on the city page) : Chicago Children's Museum - Navy Pier (700 East Grand Avenue Suite 127), Museum of Contemporary Art (Art Museums; 220 East Chicago Avenue), Egyptian Tourist Authority (645 North Michigan Avenue Suite 829), Caravan Tours Inc (401 North Michigan Avenue), Austrian Trade Commission (500 North Michigan Avenue Suite 1950), Amazing Chicago's Funhouse Maze (Arcades & Amusements; 401 E. Illinois Suite 425), Chicago from the Lake (Arcades & Amusements; 435 E Illinois), Travel Travel Travel Limited (Recreational Trips & Guides; 400 South LaSalle Street), Architectural and Historical Tours (Tours & Charters; 455 East Illinois Street).
In group quarters: 53 (-1 institutionalized population)
Size of family households: 5,704 2-persons, 851 3-persons, 535 4-persons, 88 5-persons
Size of nonfamily households: 14,212 1-person, 2,260 2-persons, 198 3-persons
1,661 married couples with children.
156 single-parent households (52 men, 104 women).
72.0% of residents of 60611 zip code speak English at home.
4.4% of residents speak Spanish at home (87% very well, 13% well).
11.7% of residents speak other Indo-European language at home (85% very well, 14% well, 1% not well).
10.5% of residents speak Asian or Pacific Island language at home (62% very well, 34% well, 4% not well).
2.0% of residents speak other language at home (95% very well, 5% well).
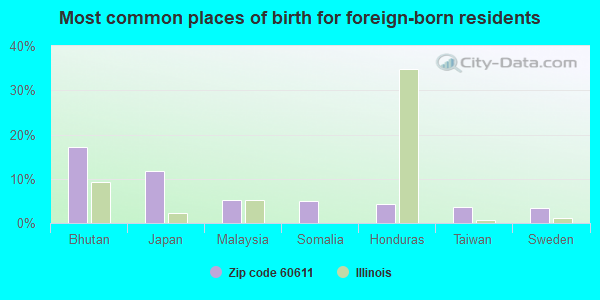
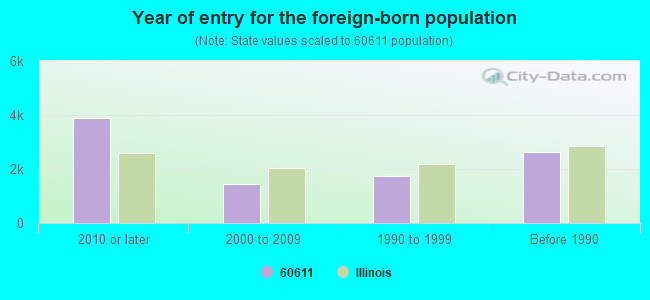
Foreign born population: 9,109 (26.2%) (54.6% of them are naturalized citizens)
Major facilities with environmental interests located in this zip code:
CHICAGO DEPARTMENT OF WATER (1000 EAST OHIO STREET in CHICAGO, IL)
STATE MASTER (Illinois EPA Project) - AIR PROGRAM, HAZARDOUS WASTE PROGRAM, SOLID WASTE PROGRAM AIR MINOR (AIRS/AFS) ENFORCEMENT/COMPLIANCE ACTIVITY (Integrated Compliance Information System) - ICIS-05-1999-0356, FORMAL ENFORCEMENT ACTION (Integrated Compliance Information System) - ICIS-05-1999-0356, FORMAL ENFORCEMENT ACTION COMPLIANCE ACTIVITY (Tracking inspections of insecticide, fungicide, and rodenticide, and toxic substances) CRITERIA AND HAZARDOUS AIR POLLUTANT INVENTORY (Inventory of air pollution sources) Small Quantity Generators, between 100 kg and 1000 kg of hazardous waste/month (Resource Conservation and Recovery Act (tracking hazardous waste)) - notification Business SIC classification: WATER SUPPLY; AIR AND WATER RESOURCE AND SOLID WASTE MANAGEMENT; REGULATION AND ADMINISTRATION OF COMMUNICATIONS, ELECTRIC, GAS, AND OTHER UTILITIES Business NAICS classification: ADMINISTRATION OF AIR AND WATER RESOURCE AND SOLID WASTE MANAGEMENT PROGRAMS. Organizations: CHICAGO, CITY OF (CONTACT/OWNER)
Alternative names: CHICAGO CITY OF DEPT WATER PURIFICATION, JAMES W JARDINE WATER PURIFICATION PLANT, JARDINE FILTRATION PLT
NORTHWESTERN UNIVERSITY CHICAGO CAMPUS (303 E CHICAGO in CHICAGO, IL)
STATE MASTER (Illinois EPA Project) - SOLID WASTE PROGRAM, HAZARDOUS WASTE PROGRAM, AIR PROGRAM AIR MINOR (AIRS/AFS) HAZARDOUS WASTE BIENNIAL REPORTER (Resource Conservation and Recovery Act (tracking hazardous waste)) - ICIS-, ENFORCEMENT/COMPLIANCE ACTIVITY, Large Quantity Generators, more that 1000 kg of hazardous waste/month (Resource Conservation and Recovery Act (tracking hazardous waste)) - ICIS-, ENFORCEMENT/COMPLIANCE ACTIVITY, Business SIC classification: COLLEGES, UNIVERSITIES, AND PROFESSIONAL SCHOOLS
CHICAGO SUN TIMES BUILDING (401 N. WABASH AVENUE in CHICAGO, IL)
STATE MASTER (Illinois EPA Project) - HAZARDOUS WASTE PROGRAM, AIR PROGRAM, SOLID WASTE PROGRAM STATE MASTER (Illinois EPA Project) - National Pollutant Discharge Elimination System Permit AIR MAJOR (AIRS/AFS) CRITERIA AND HAZARDOUS AIR POLLUTANT INVENTORY (Inventory of air pollution sources) Large Quantity Generators, more that 1000 kg of hazardous waste/month (Resource Conservation and Recovery Act (tracking hazardous waste)) Business SIC classification: NEWSPAPERS: PUBLISHING, OR PUBLISHING AND PRINTING Organizations: 401 N WABASH LLC (CONTACT/OPERATOR)
500 N MICHIGAN (500 N MICHIGAN AVE-B in CHICAGO, IL)
STATE MASTER (Illinois EPA Project) - SOLID WASTE PROGRAM, HAZARDOUS WASTE PROGRAM (Integrated Compliance Information System) - ICIS-05-1989-0121, FORMAL ENFORCEMENT ACTION Conditionally Exempt Small Quantity Generators, less than 100 kg/month of hazardous waste (Resource Conservation and Recovery Act (tracking hazardous waste)) - notification Business SIC classification: OPERATORS OF NONRESIDENTIAL BUILDINGS Organizations: UNION BANK OF SWITZERLAND (CONTACT/OWNER)
Alternative names: 500 N MICHIGAN AVE LP
NORTHWESTERN MEMORIAL HOSPITAL (216 E SUPERIOR STE 300 in CHICAGO, IL)
STATE MASTER (Illinois EPA Project) - SOLID WASTE PROGRAM, HAZARDOUS WASTE PROGRAM HAZARDOUS WASTE BIENNIAL REPORTER (Resource Conservation and Recovery Act (tracking hazardous waste)) Large Quantity Generators, more that 1000 kg of hazardous waste/month (Resource Conservation and Recovery Act (tracking hazardous waste)) - notification
KIEFFER-NOLDE INC (160 E ILLINOIS in CHICAGO, IL)
STATE MASTER (Illinois EPA Project) - SOLID WASTE PROGRAM, HAZARDOUS WASTE PROGRAM (Resource Conservation and Recovery Act (tracking hazardous waste)) Small Quantity Generators, between 100 kg and 1000 kg of hazardous waste/month (Resource Conservation and Recovery Act (tracking hazardous waste)) - notification Organizations: DONALD KIEFFER (CONTACT/OWNER)
Alternative names: KIEFFER-NOLDE ENGRAVING CO
METROPOLITAN PIER & EXPOSITION AUTHORITY (600 E. GRAND AVENUE in CHICAGO, IL)
STATE MASTER (Illinois EPA Project) - AIR PROGRAM, HAZARDOUS WASTE PROGRAM AIR MINOR (AIRS/AFS) COMPLIANCE ACTIVITY (Tracking inspections of insecticide, fungicide, and rodenticide, and toxic substances) CRITERIA AND HAZARDOUS AIR POLLUTANT INVENTORY (Inventory of air pollution sources) Conditionally Exempt Small Quantity Generators, less than 100 kg/month of hazardous waste (Resource Conservation and Recovery Act (tracking hazardous waste)) - notification Business SIC classification: NONCLASSIFIABLE ESTABLISHMENTS Organizations: METRO PIER AND EXPO AUTHORITY (CONTACT/OWNER)
Alternative names: METRO PIER AND EXPO AUTHORITY, NAVY PIER (METROPOLITAN EXPOSITION AUTH)
LINDSAY LIGHT II (316 EAST ILLINOIS in CHICAGO, IL)
LAKESHORE ONTARIO ASSOCIATES (401 E ONTARIO in CHICAGO, IL)
STATE MASTER (Illinois EPA Project) - SOLID WASTE PROGRAM (Resource Conservation and Recovery Act (tracking hazardous waste))
747 N WABASH PARTNERS LLC (747 N WABASH AVE in CHICAGO, IL)
STATE MASTER (Illinois EPA Project) - SOLID WASTE PROGRAM, HAZARDOUS WASTE PROGRAM (Resource Conservation and Recovery Act (tracking hazardous waste)) Alternative names: VACANT
CHICAGO WATER TOWER, CITY OF (800 N MICHIGAN AVE-B in CHICAGO, IL)
STATE MASTER (Illinois EPA Project) - HAZARDOUS WASTE PROGRAM (Resource Conservation and Recovery Act (tracking hazardous waste)) Organizations: CITY OF CHICAGO (CONTACT/OWNER)
Alternative names: CITY OF CHICAGO WATER TOWER
RITZ CARLTON HOTEL (160 E PEARSON in CHICAGO, IL)
STATE MASTER (Illinois EPA Project) - AIR PROGRAM, HAZARDOUS WASTE PROGRAM AIR MINOR (AIRS/AFS) Conditionally Exempt Small Quantity Generators, less than 100 kg/month of hazardous waste (Resource Conservation and Recovery Act (tracking hazardous waste)) - notification Business SIC classification: HOTELS AND MOTELS Organizations: MOORE WILLIAM (CONTACT/OWNER)
HIFFMAN SHAFFER ANDERSON INC (630 N RUSH ST in CHICAGO, IL)
STATE MASTER (Illinois EPA Project) - HAZARDOUS WASTE PROGRAM (Resource Conservation and Recovery Act (tracking hazardous waste)) Organizations: BENENSON CAPITAL CORP (CONTACT/OWNER)
Housing units lacking complete plumbing facilities: 0.1% Housing units lacking complete kitchen facilities: 0.2%
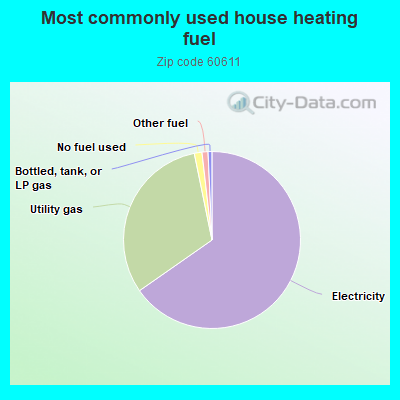
65.1%Electricity
31.4%Utility gas
1.4%No fuel used
1.1%Other fuel
0.7%Bottled, tank, or LP gas
Population in 1990: 22,264. Population change in the 1990s: +4,258 (+19.1%).
Place of birth for U.S.-born residents:
This state: 12,690
Northeast: 3,039
Midwest: 5,521
South: 2,288
West: 2,104
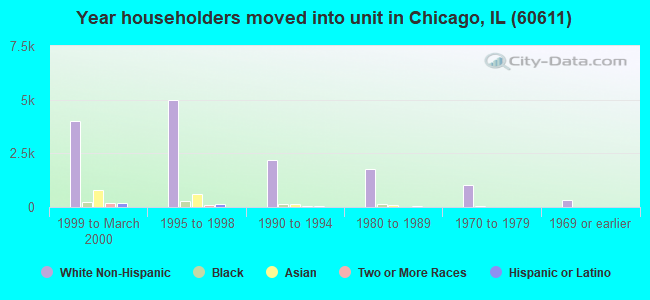
41% of the 60611 zip code residents lived in the same house 5 years ago. Out of people who lived in different houses, 52% lived in this county. Out of people who lived in different counties, 50% lived in Illinois.
76% of the 60611 zip code residents lived in the same house 1 year ago. Out of people who lived in different houses, 47% moved from this county. Out of people who lived in different houses, 8% moved from different county within same state. Out of people who lived in different houses, 38% moved from different state. Out of people who lived in different houses, 11% moved from abroad.
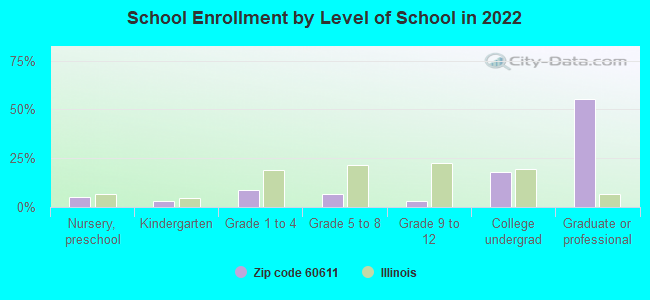
Private vs. public school enrollment:
Students in private schools in grades 1 to 8 (elementary and middle school): 476
Here:
67.3%
Illinois:
13.3%
Students in private schools in grades 9 to 12 (high school): 111
Here:
88.3%
Illinois:
9.9%
Students in private undergraduate colleges: 442
Here:
55.9%
Illinois:
27.4%
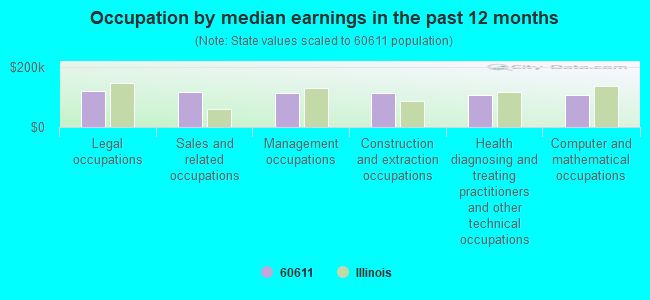
Occupation by median earnings in the past 12 months ($)
119,257Legal occupations
114,948Sales and related occupations
113,288Management occupations
112,295Construction and extraction occupations
106,847Health diagnosing and treating practitioners and other technical occupations
106,054Computer and mathematical occupations
Companies with biggest federal contracts located in this zip code (CHICAGO, IL):
WM WRIGLEY JR COMPANY (410 NORTH MICHIGAN AVENUE) : $15,294,870 in 29 contractsfrom 1999 to 2006
Contracts for Food Items For Resale by Defense Commissary Agency, Department of Defense Signed by year:2000: $151,228; 2001: $93,226; 2002: $616,406; 2003: $271,221; 2004: $2,318,177; 2005: $7,690,605; 2006: $4,063,427.
Biggest contracts:
$4,063,427 with Defense Commissary Agency for Food Items For Resale. Signed on 2006-01-01. Completion date: 2006-03-31.
$2,657,896, same as above.Signed on 2005-10-01. Completion date: 2005-12-31.
$2,020,090, same as above.Signed on 2004-10-01. Completion date: 2005-02-28.
$1,760,121, same as above.Signed on 2005-04-01. Completion date: 2005-08-31.
LOYOLA UNIVERSITY OF CHICAGO I (820 N MICHIGAN AVE FL 1) : $6,786,716 in 47 contractsfrom 2000 to 2006
Contracts for Other Medical Services, Anesthesiology Services, Tuition, Registration, and Membership Fees, ADP Software, and moreby Department of Veterans Affairs, Navy, Army, Patent and Trademark Office/Under Secretary for Intellectual Property, and others Signed by year:2000: $538,205; 2001: $600,458; 2002: $934,841; 2003: $2,571,781; 2004: $720,724; 2005: $1,346,278; 2006: $74,429.
Biggest contracts:
$1,900,000 with Department of Veterans Affairs for Other Medical Services. Signed on 2003-10-01. Completion date: 2004-09-30.
$450,000 with Department of Veterans Affairs for Anesthesiology Services. Signed on 2005-04-01. Completion date: 2005-06-30.
$373,000, same as above.Signed on 2005-10-01. Completion date: 2005-12-31.
$289,799 with Navy for Tuition, Registration, and Membership Fees. Signed on 2002-11-16. Completion date: 2003-06-15.
INNOVATIVE GOVERNMENT TELECOM (401 N MICHIGAN AVE STE1200; small business) : $5,859,469 in 37 contractsfrom 2005 to 2006
Contracts for ADP Telecommunications and Transmission Services by Defense Information Systems Agency, Department of Defense Signed by year:2000: $0; 2001: $0; 2002: $0; 2003: $0; 2004: $0; 2005: $3,590,577; 2006: $2,268,892.
Biggest contracts:
$696,530 with Defense Information Systems Agency for ADP Telecommunications and Transmission Services. Signed on 2006-06-30. Completion date: 2009-06-02.
$599,160, same as above.Signed on 2006-04-30. Completion date: 2011-02-24.
$585,795 with Department of Defense for ADP Telecommunications and Transmission Services. Signed on 2005-09-30. Completion date: 2010-09-22.
$435,120 with Defense Information Systems Agency for ADP Telecommunications and Transmission Services. Signed on 2005-10-31. Completion date: 2010-09-28.
NORTHWESTERN UNIVERSITY (0) : $5,417,233 in 10 contractsfrom 2000 to 2004
Contracts for Biomedical -- Applied Research and Exploratory Development (R&D), Biomedical -- Basic Research (R&D) by National Institutes of Health Signed by year:2000: $71,000; 2001: $1,040,000; 2002: $1,568,000; 2003: $1,360,664; 2004: $1,377,569; 2005: $0; 2006: $0.
Biggest contracts:
$1,381,000 with National Institutes of Health for Biomedical -- Applied Research and Exploratory Development (R&D). Signed on 2002-08-15. Completion date: 2005-09-15.
$1,377,569 with National Institutes of Health for Biomedical -- Basic Research (R&D). Signed on 2004-08-20. Completion date: 2008-09-30.
$844,273 with National Institutes of Health for Biomedical -- Applied Research and Exploratory Development (R&D). Signed on 2003-05-15. Completion date: 2005-09-15.
$689,000 with National Institutes of Health for Biomedical -- Basic Research (R&D). Signed on 2001-01-15. Completion date: 2003-11-15.
AMERICAN COLLEGE OF SURGEONS (633 N SAINT CLAIR ST) : $1,238,155 in 56 contractsfrom 2002 to 2006
Contracts for Scientific Data Studies, Services -- Management and Support (R&D), Other Professional Services, Mathematical/Statistical Analyses, and moreby National Institutes of Health, Health Resources and Services Administration, Centers for Disease Control and Prevention, Army, and others Signed by year:2000: $0; 2001: $0; 2002: $12,700; 2003: $214,622; 2004: $407,038; 2005: $340,117; 2006: $263,678.
Biggest contracts:
$137,236 with National Institutes of Health for Scientific Data Studies. Signed on 2006-04-28. Effective on 2006-05-01. Completion date: 2006-08-31.
$99,900 with Health Resources and Services Administration for Services -- Management and Support (R&D). Taking place in MD. Signed on 2004-09-22. Completion date: 2006-02-28.
$99,698, same as above.Signed on 2003-09-15. Completion date: 2005-09-15.
$99,518 with Centers for Disease Control and Prevention for Other Professional Services. Taking place in GA. Signed on 2004-08-31. Completion date: 2005-08-01.
LAMBDAVISION, INC (237 E DELAWARE PLACE, #10; small business) : $953,000 in 2 contractsfrom 2003 to 2004
$576,000 with Navy for Other Defense -- Applied Research and Exploratory Development (R&D). Signed on 2004-02-02. Completion date: 2004-12-31.
$377,000 with Navy for Physical Sciences -- Applied Research and Exploratory Development (R&D). Signed on 2003-12-10. Completion date: 2004-12-31.
TRIBUNE MEDIA SERVICES, INC (435 N MICHIGAN AVE SUITE 1) : $530,153 in 16 contractsfrom 2000 to 2006
Contracts for ADP Software, Automated News Services, Data Services, or Other Information Services. Buying data, the electronic equivalent of books, periodicals, newspapers, etc., Other Photographic, Mapping, Printing, and Publication Services, Aerial Photographic Services, and moreby American Forces Information Service, EXECUTIVE OFFICE OF THE PRESIDENT, U.S. Special Operations Command, Department of Defense, and others Signed by year:2000: $83,000; 2001: $58,000; 2002: $48,485; 2003: $63,848; 2004: $78,120; 2005: $144,520; 2006: $54,180.
Biggest contracts:
$92,520 with American Forces Information Service for ADP Software. Signed on 2005-01-27. Completion date: 2006-03-31.
$58,000 with EXECUTIVE OFFICE OF THE PRESIDENT for Automated News Services, Data Services, or Other Information Services. Buying data, the electronic equivalent of books, periodicals, newspapers, etc.. Taking place in DC. Signed on 2001-12-15. Completion date: 2002-09-15.
$56,000, same as above.Signed on 2000-10-15. Completion date: 2001-09-15.
$49,440 with U.S. Special Operations Command for Other Photographic, Mapping, Printing, and Publication Services. Signed on 2006-02-24. Completion date: 2007-02-28.
JONES LUNDIN BEALS, INC (500 NORTH MICHIGAN AVENUE; small business) : $496,485 in 5 contractsfrom 2000 to 2006
Contracts for Advertising Services, Program Management/Support Services, Other Professional Services by Army Signed by year:2000: $91,150; 2001: $0; 2002: $0; 2003: $156,050; 2004: $66,950; 2005: $133,013; 2006: $49,322.
Biggest contracts:
$156,050 with Army for Advertising Services. Taking place in DC. Signed on 2003-06-16. Completion date: 2004-05-27.
$133,013 with Army for Program Management/Support Services. Signed on 2005-09-29. Effective on 2005-07-01. Completion date: 2006-06-30.
$91,150 with Army for Other Professional Services. Signed on 2000-09-30. Completion date: 2001-09-29.
$66,950 with Army for Advertising Services. Signed on 2004-06-30. Completion date: 2004-05-27.
MARRIOTT INTERNATIONAL, INC (540 N MICHIGAN AVE) : $431,880 in 12 contractsfrom 2005 to 2006
Contracts for Lodging - Hotel/Motel, Lease or Rental of Facilities -- Conference Space and Facilities by Army, Internal Revenue Service, Department of State, EPA, and others Signed by year:2000: $0; 2001: $0; 2002: $0; 2003: $0; 2004: $0; 2005: $278,587; 2006: $153,293.
Biggest contracts:
$206,340 with Army for Lodging - Hotel/Motel. Signed on 2005-06-24. Completion date: 2005-08-12.
$144,000, same as above.Signed on 2006-03-08. Completion date: 2006-03-31.
$40,428 with Internal Revenue Service for Lease or Rental of Facilities -- Conference Space and Facilities. Signed on 2005-04-06. Effective on 2005-04-05. Completion date: 2005-08-12.
$8,550 with Army for Lodging - Hotel/Motel. Signed on 2005-07-21. Completion date: 2005-08-12.
SURVEY CENTER, L L C (455 E ILLINOIS STREET) : $398,047 in 39 contractsfrom 2001 to 2005
Contracts for Other Professional Services, Other Architect and Engineering Services by U.S. Army Corps of Engineers - civil program financing only, Army Signed by year:2000: $0; 2001: $198,883; 2002: $140,915; 2003: $52,267; 2004: -$7,376; 2005: $13,358; 2006: $0.
Biggest contracts:
$95,000 with U.S. Army Corps of Engineers - civil program financing only for Other Professional Services. Signed on 2002-09-04. Completion date: 2003-07-23.
$46,220, same as above.Signed on 2001-08-08. Completion date: 2001-09-27.
$46,000, same as above.Signed on 2003-09-11. Completion date: 2003-10-03.
$40,800, same as above.Signed on 2001-07-03. Completion date: 2001-08-31.
Top industries in this zip code by the number of employees in 2005:
Management of Companies and Enterprises: Corporate, Subsidiary, and Regional Managing Offices (500-999: 1, 250-499: 1, 100-249: 4, 50-99: 4, 20-49: 6, 10-19: 5, 5-9: 7, 1-4: 6)
Health Care and Social Assistance: Offices of Physicians (except Mental Health Specialists) (500-999: 1, 50-99: 5, 20-49: 14, 10-19: 13, 5-9: 25, 1-4: 94)
Other Services (except Public Administration): Parking Lots and Garages (100-249: 1, 20-49: 31, 10-19: 37, 5-9: 27, 1-4: 27)
2002 - 2018 National Fire Incident Reporting System (NFIRS) incidents
According to the data from the years 2002 - 2018 the average number of fires per year is 73. The highest number of fires - 145 took place in 2010, and the least - 1 in 2005. The data has a rising trend.
When looking into fire subcategories, the most incidents belonged to: Structure Fires (61.0%), and Outside Fires (16.7%).
Fire incident types reported to NFIRS in Zip Code 60611


 Nearest zip codes: 60601, 60603, 60602, 60610, 60604, 60654.


 According to the data from the years 2002 - 2018 the average number of fires per year is 73. The highest number of fires - 145 took place in 2010, and the least - 1 in 2005. The data has a rising trend.
 When looking into fire subcategories, the most incidents belonged to: Structure Fires (61.0%), and Outside Fires (16.7%).