Both New York, NY, in the northeastern U.S., and Chicago, IL, in the Midwest, are among the largest and most influential cities in the country, each touted for their unique cultural landscapes and vast opportunities. However, these two cities also have distinct differences in various aspects, including crime and safety, weather, cost of living, education, economy, and more. This guide aims to provide a comprehensive comparison to aid those planning to visit or relocate to either city.
Distance between
New York, NY and
Chicago, IL : 718.1 miles
New York's population is larger by 214%. Its population has grown by 459,235 people (5.7%) since 2000. The population of Chicago has decreased by 199,461 people (6.9%) during that time.
New York City has seen a decline in its crime rate over the past few decades, earning it the title of one of the safest big cities in the country. However, certain neighborhoods continue to struggle with crime, similar to any large city. On the other hand, Chicago has a high crime rate, particularly in specific neighborhoods, causing citywide averages to soar. But, much of the city is safe and welcoming to both residents and tourists.
City-data.com crime index counts serious crimes and violent crime more heavily. It adjusts for the number of visitors and daily workers commuting into cities. (higher means more crime, U.S. average = 301.1)
City-data.com crime index counts serious crimes and violent crime more heavily. It adjusts for the number of visitors and daily workers commuting into cities. (higher means more crime, U.S. average = 301.1)
Sex Offenders
According to our data, there are 4,554 registered sex offenders living in New York and 3,389 registered sex offenders living in . The ratio of residents to sex offenders in New York is 1,875 to 1; the ratio in Chicago is 798 to 1. The number of registered sex offenders compared to the number of residents is a smaller in New York than in Chicago.
Cost of Living
The cost of living is generally higher in New York City than in Chicago. The most significant contributing factor is the cost of housing, which is renowned for being exceptionally high, particularly in Manhattan. However, both cities have costly utilities, groceries, and transportation compared to the national average.
Income Tax
New York State has graduated income tax rates ranging from 4% to 8.82%, and New York City adds an additional tax on top. Illinois has a flat state income tax rate of 4.95%. Thus, high earners may pay more income tax in New York.
Property Tax
Property taxes in Illinois are among the highest in the U.S., which can significantly impact homeowners in Chicago. New York City has lower property tax rates, but the high property values might result in large tax bills.
Sales Tax
New York City has a sales tax rate of 8.875%, while Chicago has one of the highest in the country at 10.25%. These rates can affect the cost of goods and services in each city.
Income
Type
New York
Chicago
Estimated median household income
$67,997
$66,576
Estimated per capita income
$42,406
$43,217
Cost of living index (U.S. average is 100)
160.2
104.8
If you make $50,000 in Chicago, you will have to make $76,431 in New York to maintain the same standard of living.
Geographical Conditions
New York City is a coastal city, with the Atlantic Ocean to its southeast. It's largely built on three islands — Manhattan, Staten, and Long Island. Chicago is nestled alongside Lake Michigan, with several beaches and a river running through the city.
Both cities boast of a selection of excellent public and private schools, as well as respected universities. New York is home to the prestigious Columbia University and New York University, among others. Chicago hosts the University of Chicago and Northwestern University. Education opportunities are myriad in both cities.
New York's economy, one of the largest in the world, is robust and diverse, dominated by sectors such as finance, media, art, fashion, research, and more. Conversely, Chicago's economy is anchored in industries like manufacturing, printing, publishing, and food processing. Both cities offer abundant employment opportunities, albeit in different sectors.
Biggest Employers
In New York, the largest employers include JP Morgan Chase, Citigroup, Verizon, IBM, and New York City Health & Hospitals. In Chicago, among the biggest employers are Advocate Health Care, University of Chicago, and JP Morgan Chase.
In New York (New York County), 83.9% voted for Democrats and 14.9% for Republicans in 2012 Presidential Election. In Chicago (Cook County), 74.0% voted for Democrats and 24.6% for Republicans.
Elections
Type
Democrats
Republicans
Other
Year
New York
Chicago
New York
Chicago
New York
Chicago
2020
86.5%
74.6%
12.2%
24.1%
1.2%
1.3%
2016
86.7%
74.4%
9.7%
20.9%
3.6%
4.7%
2012
83.9%
74.0%
14.9%
24.6%
1.2%
1.4%
2008
86.1%
76.4%
13.5%
22.9%
0.3%
0.7%
2004
82.3%
70.3%
16.8%
29.2%
0.9%
0.6%
2000
80.0%
69.0%
14.5%
28.8%
5.5%
2.3%
1996
80.0%
66.8%
13.8%
26.7%
6.3%
6.5%
Breakdown of population affiliated with a religious congregation
Type
Adherents
Congregations
Religion
New York
Chicago
New York
Chicago
CATHOLIC CHURCH
20.4%
37.5%
12.6%
11.1%
MUSLIM ESTIMATE
2.7%
3.9%
2.4%
1.8%
EPISCOPAL CHURCH
1.7%
0.4%
5.3%
1.8%
AMERICAN BAPTIST CHURCHES IN THE USA
1.6%
0.4%
4.7%
1.6%
REFORMED CHURCH IN AMERICA
0.6%
0.1%
1.2%
0.4%
PATRIAR PARISHE RUSSIAN ORTHODO CHURCH USA
0.4%
0.0%
0.2%
0.0%
EVANGELICAL LUTHERAN CHURCH IN AMERICA
0.3%
1.0%
2.0%
4.3%
SEVENTH DAY ADVENTIST CHURCH
0.3%
0.4%
2.4%
1.9%
SOUTHERN BAPTIST CONVENTION
0.2%
1.0%
2.9%
5.4%
LUTHERAN CHURCH
0.0%
0.9%
0.6%
3.6%
Weather
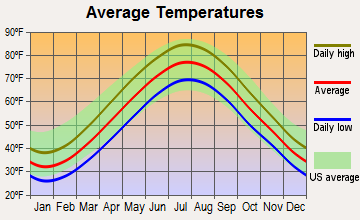
New York experiences a temperate climate with the four traditional seasons - spring, summer, fall, and winter. Summers can be humid and hot, while winters can be particularly harsh with heavy snowfall. Chicago, known as the 'Windy City', has a similar climate but with colder, windier winters, and typically less humid summers.
Weather and climate
Type
New York
Chicago
Temperature - Average
54.9°F
50.3°F
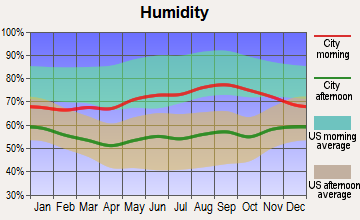
Humidity - Average morning or afternoon humidity
67.6%
75.6%
Humidity - Differences between morning and afternoon humidity
26.5%
31%
Humidity - Maximum monthly morning or afternoon humidity
75.9%
85%
Humidity - Minimum monthly morning or afternoon humidity
49.4%
54%
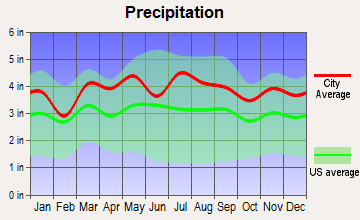
Precipitation - Yearly average
46.6 in
37.8 in
Snowfall - Yearly average
54.4 in
77.6 in
Clouds - Number of days clear of clouds
16.6%
14%
Sunshine amount - Average
60.2%
56.8%
Sunshine amount - Differences during a year
20%
33%
Sunshine amount - Maximum monthly
64%
68%
Sunshine amount - Minimum monthly
44%
35%
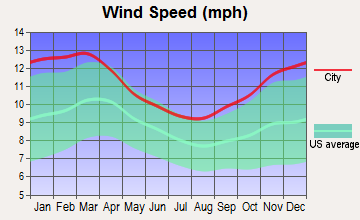
Wind speed - Average
10.4 mph
10.7 mph
Average climate in New York, New York
Average climate in Chicago, Illinois
Air pollution
Type
AQI
CO
NO2
OZONE
PB
PM10
PM25
SO2
Year
New York
Chicago
New York
Chicago
New York
Chicago
New York
Chicago
New York
Chicago
New York
Chicago
New York
Chicago
New York
Chicago
2018
93
97
0.28
0.26
15.7
14.3
24.2
26.2
N/A
N/A
N/A
23.6
7.1
9.3
0.5
1.7
2017
95
95
0.08
0.25
15.8
14.3
25.0
26.4
N/A
N/A
N/A
25.1
7.0
8.7
0.6
1.4
2016
93
95
0.27
0.21
16.6
14.9
25.3
26.5
N/A
N/A
N/A
17.3
7.1
9.1
0.7
0.8
2015
100
92
0.29
0.51
18.2
15.0
24.0
25.4
N/A
N/A
N/A
23.3
8.3
10.5
1.3
0.9
2014
95
101
0.32
0.45
18.0
18.0
23.5
25.1
N/A
N/A
N/A
28.9
8.2
10.7
1.5
1.3
2013
96
100
0.34
0.37
18.8
18.3
24.2
23.8
N/A
N/A
N/A
30.3
8.9
11.1
1.6
1.0
2012
98
112
0.37
0.36
18.4
18.8
24.8
25.7
N/A
N/A
N/A
31.3
9.2
12.1
2.5
1.7
2011
107
101
0.40
0.38
20.5
18.6
24.0
24.8
N/A
N/A
N/A
21.9
10.8
12.8
3.7
2.4
2010
112
103
0.45
0.37
20.2
20.4
24.6
25.4
N/A
N/A
N/A
22.2
10.2
12.9
4.1
1.4
2009
104
106
0.47
0.29
22.4
20.0
20.5
22.4
N/A
0.025
N/A
20.1
10.3
12.9
5.0
1.4
2008
109
108
0.48
0.32
23.5
22.8
20.9
22.8
0.013
0.026
N/A
22.7
11.7
12.5
5.4
1.8
2007
121
125
0.54
0.34
24.3
23.6
19.9
23.9
0.016
0.027
N/A
25.9
12.6
13.1
6.3
2.2
2006
116
95
0.47
0.31
24.9
23.0
19.9
21.1
0.018
0.029
N/A
22.0
12.9
N/A
6.9
2.6
2005
107
110
0.56
0.55
26.9
23.5
18.9
23.3
N/A
0.027
N/A
26.2
N/A
N/A
8.7
3.3
2004
106
85
0.58
0.83
26.7
23.9
17.7
20.3
0.030
0.032
N/A
23.4
N/A
N/A
8.2
4.1
2003
107
99
0.69
0.69
28.2
25.1
18.0
20.0
0.015
0.030
27.0
23.3
N/A
N/A
8.8
3.1
2002
122
114
0.62
0.83
28.3
26.5
19.1
20.8
0.008
0.029
25.8
24.4
N/A
N/A
8.3
3.3
2001
121
107
0.61
0.83
29.2
27.3
20.3
19.2
0.020
0.031
23.1
28.5
N/A
N/A
9.2
4.3
2000
115
104
0.63
0.88
29.0
24.8
18.2
17.6
0.022
0.046
22.2
N/A
N/A
N/A
8.8
4.2
Natural disasters
Type
New York
Chicago
Tornado activity compared to U.S. average
56.5%
145.8%
Earthquake activity compared to U.S. average
30.8%
136.9%
Natural disasters compared to U.S. average
18%
20%
Transportation
New York's public transit system, primarily the subway, is extensive and runs 24/7. Chicago's 'L' trains and bus system are reliable but not as widespread or frequently run. Both cities are also bicycle-friendly, particularly Chicago, with its miles of bike lanes.
Transport
Type
New York
Chicago
Amtrak stations
1
1
Amtrak stations nearby
3
3
FAA registered aircraft
753
1
FAA registered aircraft manufacturers and dealers
8
12
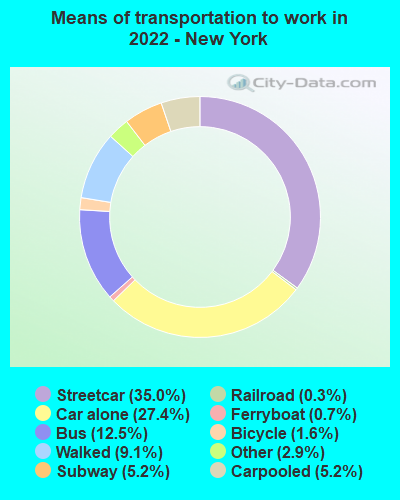
Means of transportation to work
Type
New York
Chicago
Bicycle
1.7%
1.6%
Bus
12.3%
8%
Carpooled
5.6%
8.3%
Car alone
30.5%
62.3%
Ferryboat
0.4%
0%
Railroad
0.3%
0.2%
Streetcar
32%
6.8%
Subway
4%
3.5%
Taxicab
1.7%
0.8%
Walked
10.1%
5.9%
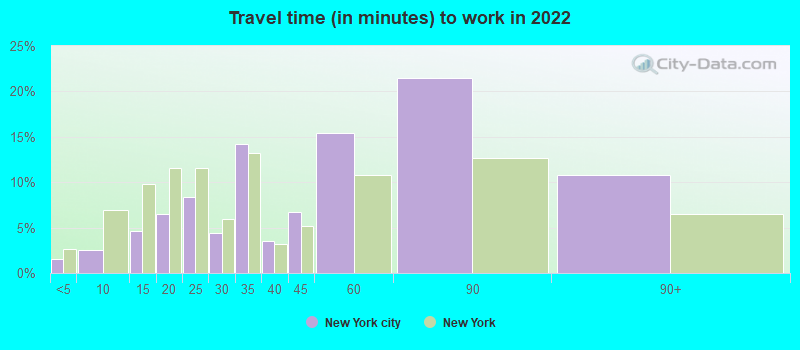
Average travel time to work
Type
New York
Chicago
Average
46.2 min
36.9 min
Other means
31.3 min
33.1 min
Public transportation
49.3 min
44.8 min
Private vehicle occupancy
Type
New York
Chicago
Average
1.3
1.2
Drove alone
83.3%
86.7%
In 2 person carpool
12.5%
9.3%
In 3 person carpool
1.8%
2.4%
In 4 person carpool
1%
0.9%
In 5-6 person carpool
0.8%
0.4%
In 7+ person carpool
0.6%
0.3%
How many people usually rode to work in the car, truck or van.
Real Estate
Real estate in New York is among the priciest in the country, with a premium for Manhattan's real estate. Chicago's real-estate market, while not cheap, is more affordable than New York's, offering a wider variety of housing options to suit varying budgets.
Neighborhoods
New York is known for its diverse boroughs from upscale Manhattan to hip Brooklyn. Chicago also boasts a mix of neighborhoods, from the luxe Gold Coast to the artsy Wicker Park. Both cities offer a range of neighborhoods that cater to different lifestyles and preferences.
Houses and residents
Type
New York
Chicago
Houses
3,641,931
1,272,191
Average household size (people)
2.6
2.5
Median year apartment built
1952
1955
Median year house/condo built
1952
1951
Length of stay in the house since moving in
15.6 years
14.7 years
Houses occupied
3,263,895 (89.6%)
1,139,537 (89.6%)
Houses occupied by owners
1,085,936 (33.3%)
530,977 (46.6%)
Houses occupied by renters
2,177,959 (66.7%)
608,560 (53.4%)
Median rent asked for vacant for-rent units
$2,362
$1,546
Median monthly housing costs
$1,632
$1,356
Median price asked for vacant for-sale houses and condos
$1,459,403
$355,671
Estimated median house or condo value
$685,700
$297,300
Median numbers of rooms
3.9
4.8
Median number of rooms in apartments
3.6
4
Median number of rooms in houses and condos
5.2
5.8
Median house price - detached houses
$878,380
$357,707
Median house price - in 2-unit structures
$579,409
$345,352
Median house price - in 3-to-4-unit structures
$841,459
$477,161
Median house price - in 5 or more unit structures
$977,752
$439,589
Median house price - mobile homes
$329,668
$472,017
Median house price - occupied boats, rvs, vans etc.
Over $1,000,000
$235,959
Median house price - Townhouses or other attached units
$989,845
$518,665
Median house price - All housing units
$971,396
$388,874
Median house age
70
70
Renting percentage
69%
55.1%
Housing density (houses/condos per square mile)
12,007
5,601.1
House value disparities
28.5%
35.6%
Household income disparities
48.8%
48.4%
Median household income for houses/condes with a mortgage
$120,618
$110,175
Median household income for apartments without a mortgage
$81,926
$72,495
Housing units without a mortgage
14,867 (2.4%)
6,624 (1.9%)
Housing units with both a second mortgage and home equity loan
43,914 (7.1%)
17,661 (5.1%)
Housing units with a mortgage
601,226 (97.6%)
339,523 (98.1%)
Housing units with a home equity loan
2,495 (0.4%)
808 (0.2%)
Housing units with a second mortgage
55,108 (8.9%)
25,416 (7.3%)
House/condo owner moved in on average (years ago)
15
12
House/condo renter moved in on average (years ago)
6
2
Housing units lacking complete kitchen facilities
1.3%
2.5%
Housing units lacking complete plumbing facilities
0.8%
1.8%
Housing units in structures
Housing units in structures
New York
Chicago
One, detached
9.6%
26.4%
One, attached
7.2%
3.5%
Two
11.9%
13.3%
3 or 4
8.9%
14.0%
5 to 9
6.8%
11.0%
10 to 19
6.4%
4.6%
20 to 49
15.7%
6.5%
50 or more
33.3%
20.6%
Mobile homes
0.1%
0.2%
Median real estate property taxes paid for housing units
Self-employed workers in own not incorporated business
231,322
67,964
State government workers
104,763
41,316
Unpaid family workers
8,965
4,164
Industries and Occupations
In New York, the dominant industries are finance, healthcare, professional and technical services. In contrast, Chicago leads in manufacturing, healthcare, and retail. Occupations in arts, design, entertainment, sports, media sectors are abundant in New York, while Chicago offers a higher concentration of jobs in the manufacturing sector.
Both cities have top-notch healthcare systems, with world-renowned hospitals. New York is home to New York-Presbyterian University Hospital of Columbia and Cornell and NYU Langone Medical Center. Chicago has the University of Chicago Medical Center and Rush University Medical Center.
Health (county statistics)
Type
New York
Chicago
General health status score of residents in this county from 1 (poor) to 5 (excellent)
Both cities boast of world-class infrastructure, with New York famed for its skyline dotted with iconic skyscrapers, and Chicago recognized for its architectural diversity. Both have extensive public transportation systems, but New York’s subway runs 24/7, unlike Chicago's 'L' train system.
Infrastructure
Type
New York
Chicago
Hospitals
58
86
TV stations
29
22
Arenas or stadiums
5
7
Bank branches located here
487
740
Bank institutions located here
87
99
Main business address for public companies
395
110
Drinking water stations with no reported violations in the past
5
22
Drinking water stations with reported violations in the past
HMDA - Conventional home purchase loans - Applications denied
Year
New York
Chicago
1999
11,926
7,501
2000
13,707
8,763
2001
10,631
7,090
2002
11,771
7,745
2003
14,863
10,485
2004
20,738
14,761
2005
29,499
24,041
2006
37,583
29,365
2007
30,997
17,767
2008
17,112
8,601
2009
8,288
3,506
Culture and Food
New York City is a cultural melting pot, renowned for its Broadway shows, museums, fine arts, and diverse food scene. Chicago, meanwhile, has a robust arts scene, known for its music (blues and jazz), theater, visual arts, and iconic foods (deep-dish pizza and Chicago-style hot dogs).
Sports Teams
Both cities are fervent sports towns. New York sports fans root for the Yankees (MLB), the Knicks (NBA), the Giants (NFL), and more. Chicago is home to the Cubs (MLB), the Bulls (NBA), and the Bears (NFL), among others.


 New York, NY
 Chicago, IL