New York County, New York (NY)
County owner-occupied free and clear houses and condos in 2010: 69,627
County owner-occupied houses and condos in 2000: 148,695
Renter-occupied apartments: 589,885 (it was 589,949 in 2000)
| % of renters here: | 80% |
| State: | 47% |
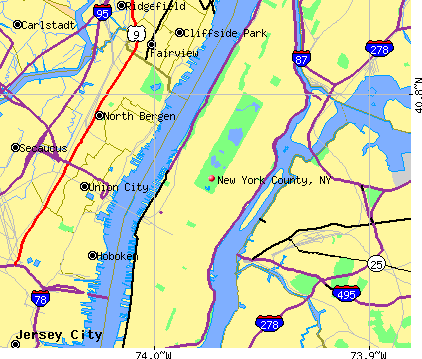
Land area: 23 sq. mi.
Water area: 10.8 sq. mi.
Population density: 69513 people per square mile (very high).
Industries providing employment: Educational, health and social services (24.2%), Professional, scientific, management, administrative, and waste management services (21.1%), Finance, insurance, real estate, and rental and leasing (15.9%).
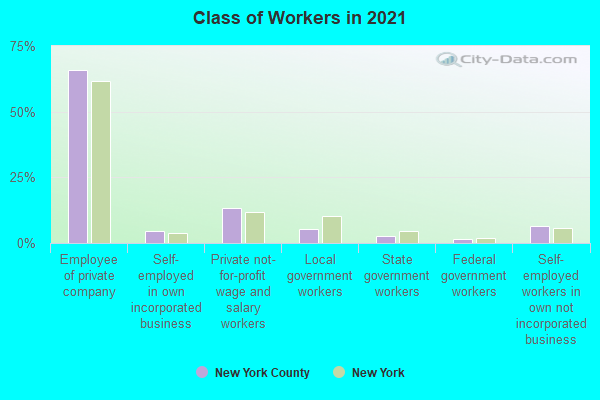
Type of workers:
- Private wage or salary: 84%
- Government: 9%
- Self-employed, not incorporated: 7%
- Unpaid family work: 0%
- OSM Map
- General Map
- Google Map
- MSN Map

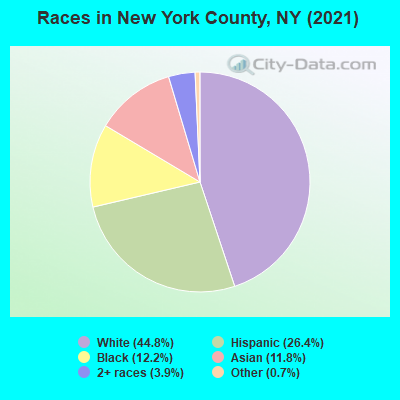
- 710,46044.5%White Non-Hispanic Alone
- 418,20826.2%Hispanic or Latino
- 197,70912.4%Asian alone
- 190,14611.9%Black Non-Hispanic Alone
- 64,9264.1%Two or more races
- 13,6470.9%Some other race alone
- 1,0510.07%American Indian and Alaska Native alone
- 1260.01%Native Hawaiian and Other
Pacific Islander alone
| Median resident age: | 39.1 years |
| New York median age: | 40.0 years |
| Males: 763,019 | |
| Females: 833,254 |


| New York County: | 1.0 people |
| New York: | 3 people |
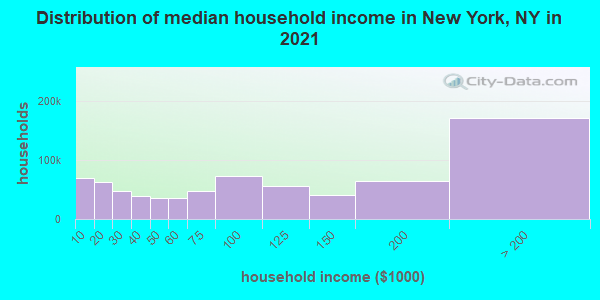
Estimated median household income in 2022: $95,866 ($47,030 in 1999)
| This county: | $95,866 |
| New York: | $79,557 |
Median contract rent in 2022 for apartments: $1,929 (lower quartile is $1,044, upper quartile is $3,216)
| This county: | $1929 |
| State: | $1354 |
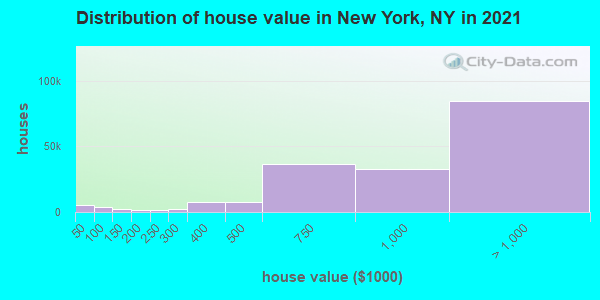
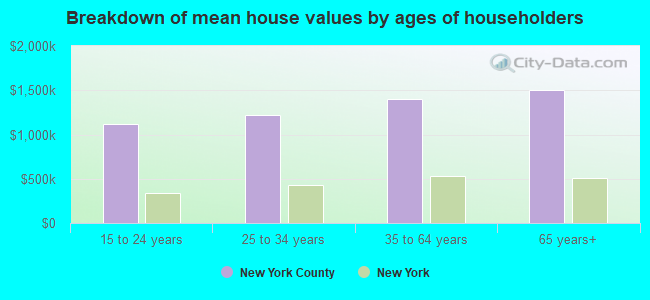
Estimated median house or condo value in 2022: $1,006,100 (it was $361,100 in 2000)
| New York: | $1,006,100 |
| New York: | $400,400 |
Mean price in 2022:
Median monthly housing costs for homes and condos with a mortgage: $3,969Detached houses: $1,241,395
Here: $1,241,395 State: $476,719 Townhouses or other attached units: $3,996,854
Here: $3,996,854 State: $699,270 In 2-unit structures: $1,977,507
Here: $1,977,507 State: $713,077 In 3-to-4-unit structures: $1,677,808
Here: $1,677,808 State: $764,568 In 5-or-more-unit structures: $1,616,683
Here: $1,616,683 State: $912,009 Mobile homes: $774,081
Here: $774,081 State: $88,925 Occupied boats, RVs, vans, etc.: $995,865
Here: $995,865 State: $480,795
Median monthly housing costs for units without a mortgage: $1,291
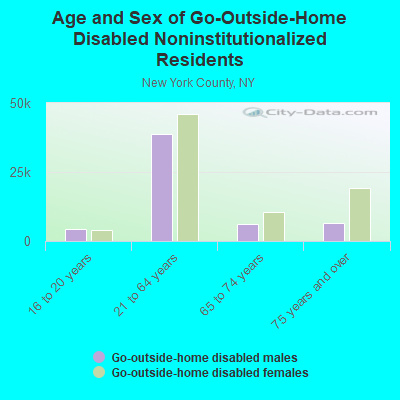
Institutionalized population: 12,081
Health of residents in New York County based on CDC Behavioral Risk Factor Surveillance System Survey Questionnaires from 2003 to 2012:
General health status score of residents in this county from 1 (poor) to 5 (excellent) is 3.6. This is better than average.79.0% of residents exercised in the past month. This is about average.
46.3% of residents smoked 100+ cigarettes in their lives. This is about average.
84.0% of adult residents drank alcohol in the past 30 days. This is more than average.
77.7% of residents visited a dentist within the past year. This is more than average.
Average weight of males is 180 pounds. This is less than average.
Average weight of females is 150 pounds. This is less than average.
1.6% of residents keep firearms around their homes. This is less than average.
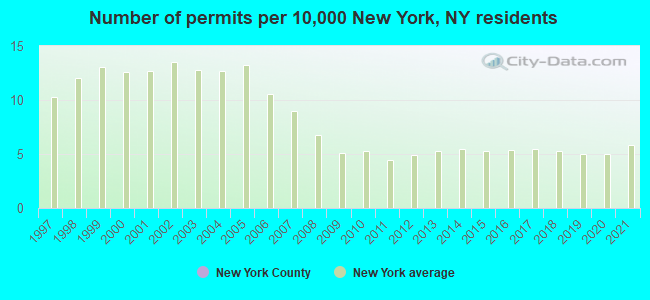
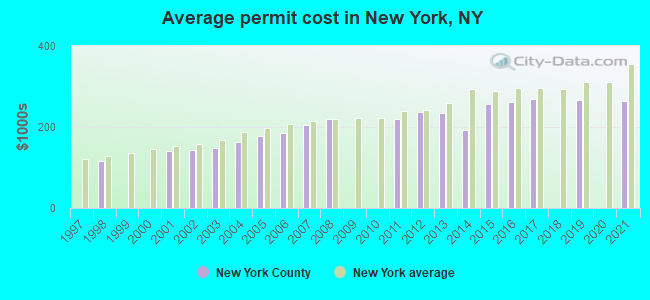
Single-family new house construction building permits:
- 2022: 0 buildings
- 2021: 1 building, cost: $262,500
- 2020: 0 buildings
- 2019: 1 building, cost: $266,000
- 2018: 0 buildings
- 2017: 4 buildings, average cost: $267,800
- 2016: 4 buildings, average cost: $261,800
- 2015: 4 buildings, average cost: $257,200
- 2014: 1 building, cost: $193,300
- 2013: 1 building, cost: $233,900
- 2012: 4 buildings, average cost: $236,600
- 2011: 1 building, cost: $220,300
- 2010: 0 buildings
- 2009: 0 buildings
- 2008: 3 buildings, average cost: $220,200
- 2007: 6 buildings, average cost: $203,800
- 2006: 2 buildings, average cost: $186,200
- 2005: 3 buildings, average cost: $177,500
- 2004: 1 building, cost: $163,600
- 2003: 1 building, cost: $147,500
- 2002: 3 buildings, average cost: $142,300
- 2001: 4 buildings, average cost: $139,700
- 2000: 0 buildings
- 1999: 0 buildings
- 1998: 1 building, cost: $117,000
- 1997: 0 buildings
Median real estate property taxes paid for housing units with mortgages in 2022: $10,001 (0.9%)
Median real estate property taxes paid for housing units with no mortgage in 2022: $10,001 (1.0%)

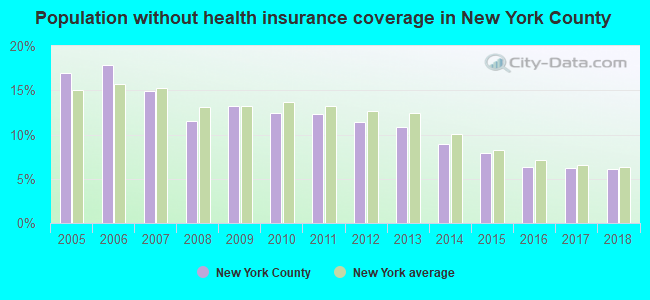
| New York County: | 17.3% |
| New York: | 14.3% |
Median age of residents in 2022: 39.1 years old
(Males: 38.2 years old, Females: 39.8 years old)
(Median age for: White residents: 39.8 years old, Black residents: 39.8 years old, American Indian residents: 30.3 years old, Asian residents: 39.5 years old, Hispanic or Latino residents: 37.9 years old, Other race residents: 39.3 years old)
Area name: New York-Monmouth-Ocean, NY-NJ HUD Metro FMR Area
Fair market rent in 2006 for a 1-bedroom apartment in New York County is $1003 a month.
Fair market rent for a 2-bedroom apartment is $1133 a month.
Fair market rent for a 3-bedroom apartment is $1406 a month.
2023 air pollution in New York County:
Carbon Monoxide: 0.282 ppm (standard limit: 9 ppm). Near U.S. average.
Ozone (1-hour): 0.029 ppm (standard limit: 0.12 ppm). Below U.S. average.
Particulate Matter (PM2.5) Annual: 9.9 µg/m3(standard limit: 15.0 µg/m3). Near U.S. average.
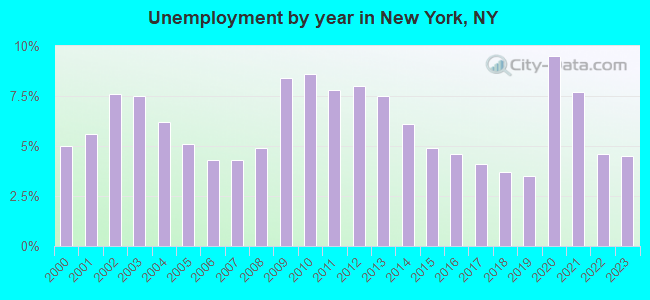
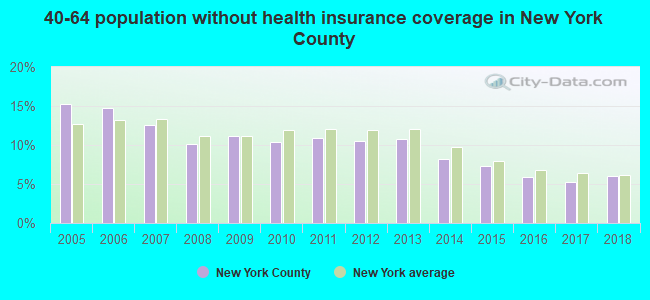
| Here: | 4.5% |
| New York: | 4.4% |
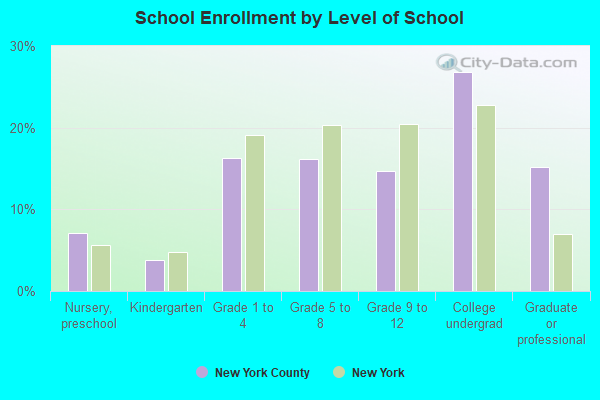
Current college students: 141,083
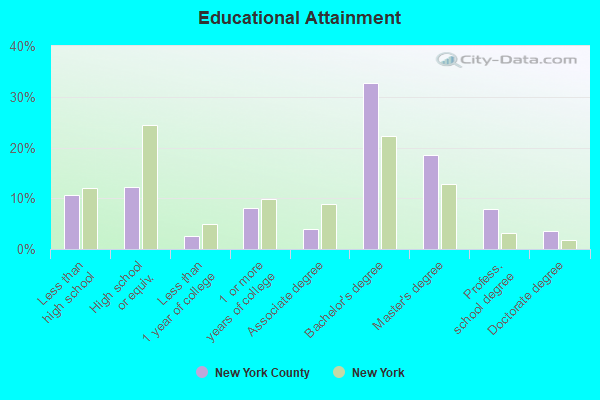
People 25 years of age or older with a high school degree or higher: 88.6%
People 25 years of age or older with a bachelor's degree or higher: 64.5%
Number of foreign born residents: 456,694 (54.5% naturalized citizens)
| New York County: | 28.6% |
| Whole state: | 22.7% |
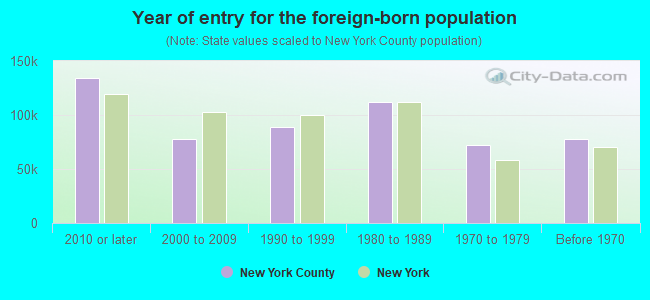
- Year of entry for the foreign-born population
- 146,4582010 or later
- 81,9742000 to 2009
- 86,2591990 to 1999
- 112,3021980 to 1989
- 72,1701970 to 1979
- 77,587Before 1970
Mean travel time to work (commute): minutes
Percentage of county residents living and working in this county: 97.8%
Housing units in structures:
- One, detached: 11,268
- One, attached: 5,699
- Two: 8,057
- 3 or 4: 18,823
- 5 to 9: 48,475
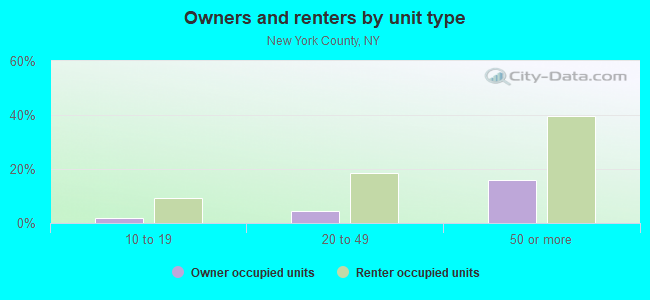
- 10 to 19: 98,154
- 20 to 49: 206,976
- 50 or more: 525,184
- Mobile homes: 438
- Boats, RVs, vans, etc.: 165
Housing units in New York County with a mortgage: 99,829 (6,821 second mortgage, 0 home equity loan, 5,378 both second mortgage and home equity loan)
Houses without a mortgage: 1,639
| Here: | 99.0% with mortgage |
| State: | 95.5% with mortgage |
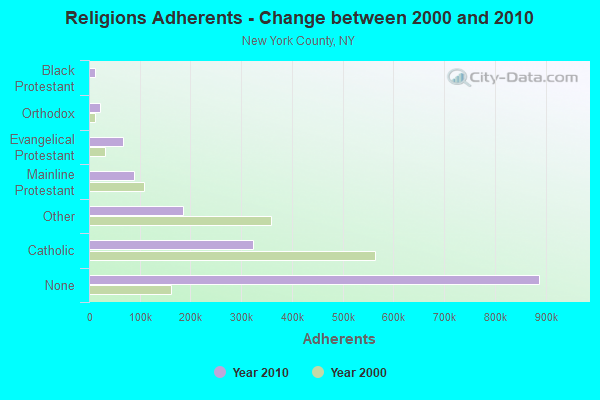
Religion statistics for New York County
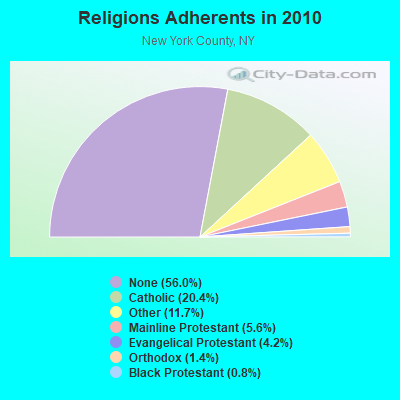
| Religion | Adherents | Congregations |
|---|---|---|
| Catholic | 323,325 | 109 |
| Other | 185,469 | 262 |
| Mainline Protestant | 88,742 | 193 |
| Evangelical Protestant | 66,211 | 215 |
| Orthodox | 21,910 | 34 |
| Black Protestant | 12,440 | 52 |
| None | 887,776 | - |
Source: Clifford Grammich, Kirk Hadaway, Richard Houseal, Dale E.Jones, Alexei Krindatch, Richie Stanley and Richard H.Taylor. 2012. 2010 U.S.Religion Census: Religious Congregations & Membership Study. Association of Statisticians of American Religious Bodies. Jones, Dale E., et al. 2002. Congregations and Membership in the United States 2000. Nashville, TN: Glenmary Research Center.
Food Environment Statistics:
| New York County: | 7.14 / 10,000 pop. |
| State: | 4.13 / 10,000 pop. |
| Here: | 0.01 / 10,000 pop. |
| New York: | 0.06 / 10,000 pop. |
| This county: | 0.61 / 10,000 pop. |
| New York: | 0.92 / 10,000 pop. |
| New York County: | 0.14 / 10,000 pop. |
| New York: | 1.68 / 10,000 pop. |
| This county: | 24.37 / 10,000 pop. |
| State: | 8.82 / 10,000 pop. |
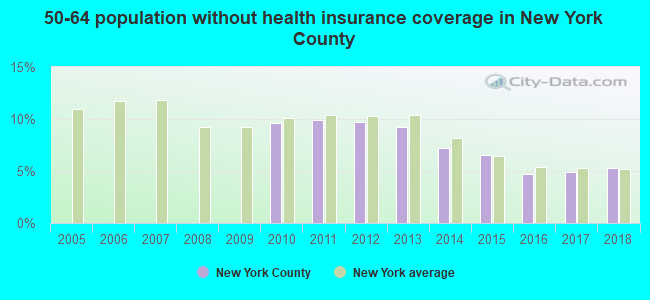
| New York County: | 5.6% |
| New York: | 8.2% |
| New York County: | 15.4% |
| State: | 23.8% |
| Here: | 13.4% |
| State: | 15.6% |
Agriculture in New York County:
Average size of farms: 1 acresAverage value of agricultural products sold per farm: $97,549
Average value of crops sold per acre for harvested cropland: $97549.00
The value of nursery, greenhouse, floriculture, and sod as a percentage of the total market value of agricultural products sold: 100.00%
The value of livestock, poultry, and their products as a percentage of the total market value of agricultural products sold: 0.00%
Average total farm production expenses per farm: $149,792
Harvested cropland as a percentage of land in farms: 100.00%
Irrigated harvested cropland as a percentage of land in farms: 100.00%
Average market value of all machinery and equipment per farm: $35,000
The percentage of farms operated by a family or individual: 0.00%
Average age of principal farm operators: 62 years
Earthquake activity:
New York County-area historical earthquake activity is significantly above New York state average. It is 69% smaller than the overall U.S. average.On 8/23/2011 at 17:51:04, a magnitude 5.8 (5.8 MW, Depth: 3.7 mi, Class: Moderate, Intensity: VI - VII) earthquake occurred 289.9 miles away from New York County center
On 10/7/1983 at 10:18:46, a magnitude 5.3 (5.1 MB, 5.3 LG, 5.1 ML) earthquake occurred 221.0 miles away from the county center
On 1/16/1994 at 01:49:16, a magnitude 4.6 (4.6 MB, 4.6 LG, Depth: 3.1 mi, Class: Light, Intensity: IV - V) earthquake occurred 112.6 miles away from the county center
On 4/20/2002 at 10:50:47, a magnitude 5.3 (5.3 ML, Depth: 3.0 mi) earthquake occurred 259.3 miles away from the county center
On 4/20/2002 at 10:50:47, a magnitude 5.2 (5.2 MB, 4.2 MS, 5.2 MW, 5.0 MW) earthquake occurred 257.4 miles away from New York County center
On 8/22/1992 at 12:20:32, a magnitude 4.8 (4.8 MB, 3.8 MS, 4.7 LG, Depth: 6.2 mi) earthquake occurred 225.4 miles away from the county center
Magnitude types: regional Lg-wave magnitude (LG), body-wave magnitude (MB), local magnitude (ML), surface-wave magnitude (MS), moment magnitude (MW)
Most recent natural disasters:
- New York Covid-19 Pandemic, Incident Period: January 20, 2020, Major Disaster (Presidential) Declared DR-4480-NY: March 20, 2020, FEMA Id: 4480, Natural disaster type: Other
- New York Hurricane Sandy, Incident Period: October 27, 2012 to November 09, 2012, Emergency Declared EM-3351: October 28, 2012, FEMA Id: 3351, Natural disaster type: Hurricane
- New York Hurricane Sandy, Incident Period: October 27, 2012 to November 09, 2012, Major Disaster (Presidential) Declared DR-4085: October 30, 2012, FEMA Id: 4085, Natural disaster type: Hurricane
- New York Hurricane Irene, Incident Period: August 26, 2011 to September 05, 2011, Major Disaster (Presidential) Declared DR-4020: August 31, 2011, FEMA Id: 4020, Natural disaster type: Hurricane
- New York Hurricane Irene, Incident Period: August 25, 2011 to September 05, 2011, Emergency Declared EM-3328: August 26, 2011, FEMA Id: 3328, Natural disaster type: Hurricane
- New York Hurricane Katrina Evacuation, Incident Period: August 29, 2005 to October 01, 2005, Emergency Declared EM-3262: September 30, 2005, FEMA Id: 3262, Natural disaster type: Hurricane
- New York Power Outage, Incident Period: August 14, 2003 to August 16, 2003, Emergency Declared EM-3186: August 23, 2003, FEMA Id: 3186, Natural disaster type: Power Outage
- New York Snowstorm, Incident Period: February 17, 2003 to February 18, 2003, Emergency Declared EM-3184: March 27, 2003, FEMA Id: 3184, Natural disaster type: Snowstorm
- New York Terrorist Attack, Incident Period: September 11, 2001, Major Disaster (Presidential) Declared DR-1391: September 11, 2001, FEMA Id: 1391, Natural disaster type: Other
- New York Virus Threat, Incident Period: May 22, 2000 to November 01, 2000, Emergency Declared EM-3155: October 11, 2000, FEMA Id: 3155, Natural disaster type: Other
- 8 other natural disasters have been reported since 1953.
The number of natural disasters in New York County (18) is near the US average (15).
Major Disasters (Presidential) Declared: 11
Emergencies Declared: 7
Causes of natural disasters: Hurricanes: 5, Floods: 4, Storms: 4, Blizzards: 2, Explosion: 1, Heavy Rain: 1, Power Outage: 1, Snowstorm: 1, Water Shortage: 1, Other: 3 (Note: some incidents may be assigned to more than one category).
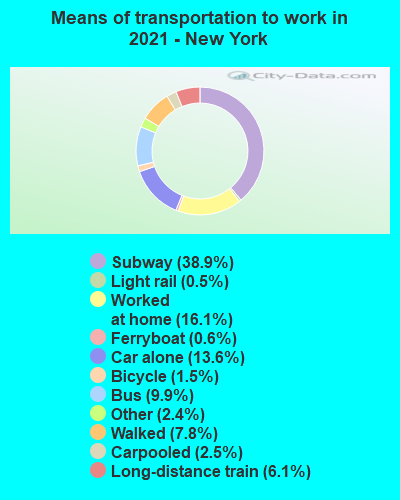
Means of transportation to work:
- Drove a car alone: 256,244 (11.7%)
- Carpooled: 51,848 (2.4%)
- Bus: 244,523 (11.1%)
- Subway or elevated rail: 983,600 (44.8%)
- Long-distance train or commuter rail: 178,094 (8.1%)
- Light rail, streetcar or trolley: 10,052 (0.5%)
- Ferryboat: 21,438 (1.0%)
- Taxicab, motorcycle, or other means: 49,989 (2.3%)
- Bicycle: 32,014 (1.5%)
- Walked: 158,489 (7.2%)
- Worked at home: 210,805 (9.6%)

- Health care and social assistance (18%)
- Professional, scientific, and technical services (17%)
- Educational services (13%)
- Finance and insurance (9%)
- Retail trade (8%)
- Information (6%)
- Other services, except public administration (5%)
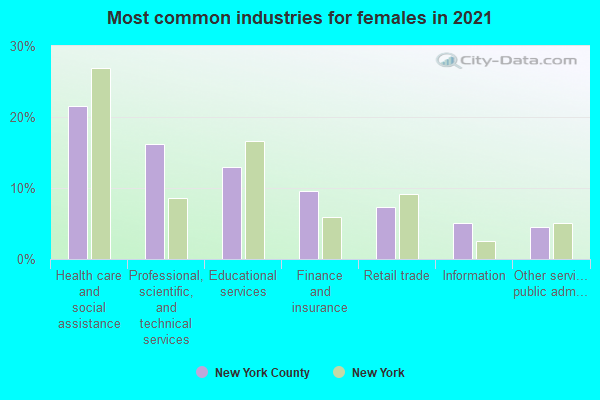
- Health care and social assistance (19%)
- Professional, scientific, and technical services (17%)
- Educational services (13%)
- Finance and insurance (10%)
- Retail trade (8%)
- Information (6%)
- Other services, except public administration (5%)
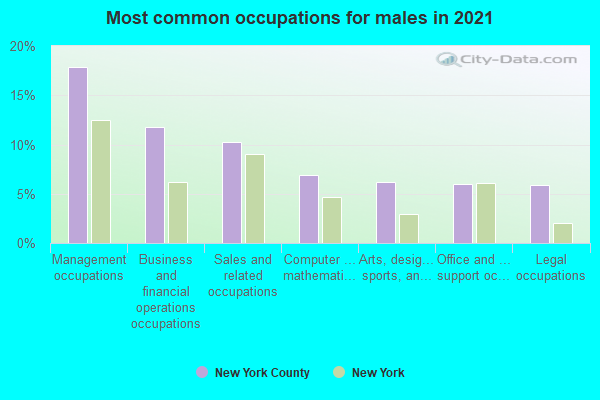
- Management occupations (19%)
- Business and financial operations occupations (12%)
- Sales and related occupations (9%)
- Computer and mathematical occupations (8%)
- Arts, design, entertainment, sports, and media occupations (7%)
- Food preparation and serving related occupations (5%)
- Office and administrative support occupations (5%)
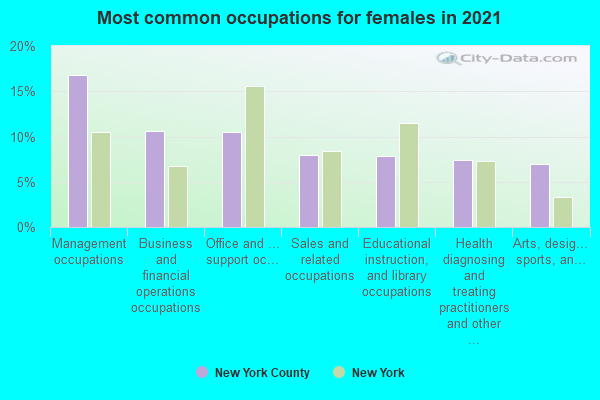
- Management occupations (15%)
- Business and financial operations occupations (13%)
- Office and administrative support occupations (10%)
- Educational instruction, and library occupations (9%)
- Arts, design, entertainment, sports, and media occupations (8%)
- Sales and related occupations (8%)
- Healthcare support occupations (6%)
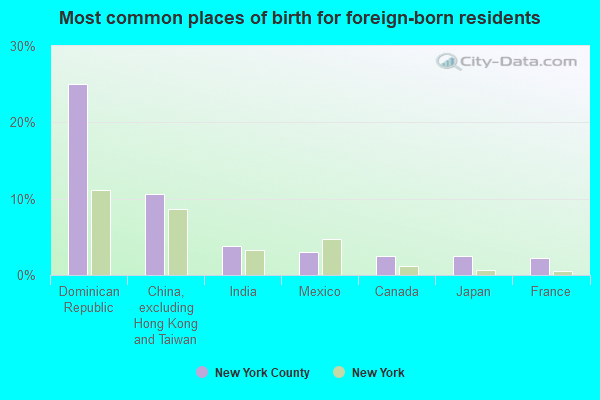
- Dominican Republic (22%)
- China, excluding Hong Kong and Taiwan (12%)
- Mexico (5%)
- India (4%)
- Canada (3%)
- Ecuador (2%)
- Korea (2%)
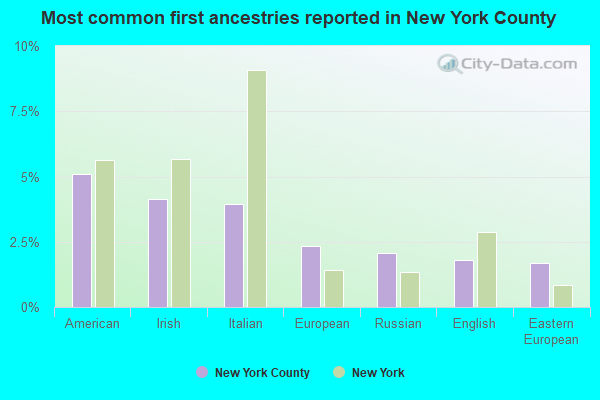
- American (5%)
- Italian (4%)
- Irish (3%)
- Eastern European (3%)
- Russian (2%)
- European (2%)
- German (2%)
People in group quarters in New York County, New York in 2010:
- 35,333 people in college/university student housing
- 8,496 people in emergency and transitional shelters (with sleeping facilities) for people experiencing homelessness
- 8,214 people in nursing facilities/skilled-nursing facilities
- 6,552 people in other noninstitutional facilities
- 2,649 people in residential treatment centers for adults
- 1,876 people in group homes intended for adults
- 850 people in federal detention centers
- 784 people in mental (psychiatric) hospitals and psychiatric units in other hospitals
- 689 people in local jails and other municipal confinement facilities
- 386 people in workers' group living quarters and job corps centers
- 329 people in correctional facilities intended for juveniles
- 286 people in correctional residential facilities
- 213 people in state prisons
- 209 people in group homes for juveniles (non-correctional)
- 205 people in residential treatment centers for juveniles (non-correctional)
- 181 people in hospitals with patients who have no usual home elsewhere
- 79 people in residential schools for people with disabilities
- 42 people in in-patient hospice facilities
People in group quarters in New York County, New York in 2000:
- 27,152 people in college dormitories (includes college quarters off campus)
- 12,408 people in other noninstitutional group quarters
- 6,323 people in nursing homes
- 2,495 people in homes or halfway houses for drug/alcohol abuse
- 1,717 people in other nonhousehold living situations
- 1,290 people in hospitals/wards and hospices for chronically ill
- 1,225 people in state prisons
- 1,167 people in other group homes
- 1,149 people in religious group quarters
- 1,139 people in federal prisons and detention centers
- 937 people in mental (psychiatric) hospitals or wards
- 921 people in local jails and other confinement facilities (including police lockups)
- 897 people in other hospitals or wards for chronically ill
- 679 people in homes for the mentally ill
- 515 people in homes for the mentally retarded
- 393 people in hospices or homes for chronically ill
- 260 people in hospitals or wards for drug/alcohol abuse
- 104 people in other workers' dormitories
- 99 people in other types of correctional institutions
- 88 people in unknown juvenile institutions
- 72 people in wards in general hospitals for patients who have no usual home elsewhere
- 49 people in schools, hospitals, or wards for the intellectually disabled
- 29 people in homes for the physically handicapped
- 8 people in training schools for juvenile delinquents
- 7 people in short-term care, detention or diagnostic centers for delinquent children
- 3 people in homes for abused, dependent, and neglected children
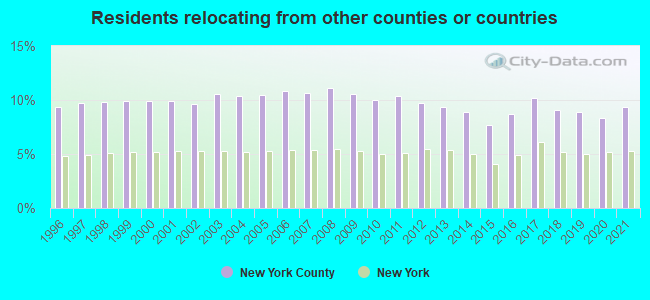
9.36% of this county's 2021 resident taxpayers lived in other counties in 2020 ($122,752 average adjusted gross income)
| Here: | 9.36% |
| New York average: | 5.29% |
0.03% of residents moved from foreign countries ($108 average AGI)
New York County: 0.03% New York average: 0.01%
4.34% relocated from other counties in New York ($49,256 average AGI)
4.99% relocated from other states ($73,388 average AGI)
New York County: 4.99% New York average: 1.86%
Top counties from which taxpayers relocated into this county between 2020 and 2021:
| from Kings County, NY | |
| from Bronx County, NY | |
| from Queens County, NY | |
| from Westchester County, NY | |
| from Hudson County, NJ | |
| from Los Angeles County, CA | |
| from Nassau County, NY |
13.94% of this county's 2020 resident taxpayers moved to other counties in 2021 ($239,017 average adjusted gross income)
| Here: | 13.94% |
| New York average: | 6.93% |
0.03% of residents moved to foreign countries ($390 average AGI)
New York County: 0.03% New York average: 0.02%
5.89% relocated to other counties in New York ($87,886 average AGI)
8.01% relocated to other states ($150,742 average AGI)
New York County: 8.01% New York average: 3.55%

Top counties to which taxpayers relocated from this county between 2020 and 2021:
| to Kings County, NY | |
| to Queens County, NY | |
| to Bronx County, NY | |
| to Hudson County, NJ | |
| to Westchester County, NY | |
| to Suffolk County, NY | |
| to Fairfield County, CT |
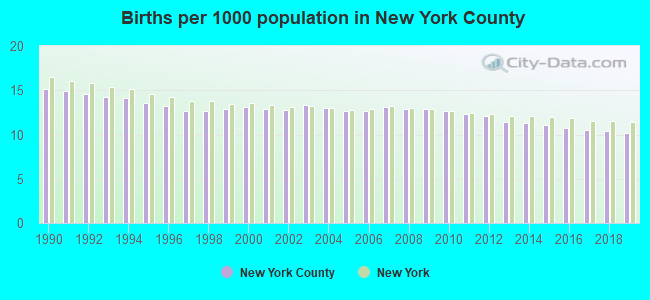
Births per 1000 population from 1990 to 1999: 13.8
Births per 1000 population from 2000 to 2009: 12.9
Births per 1000 population from 2010 to 2022: 9.4
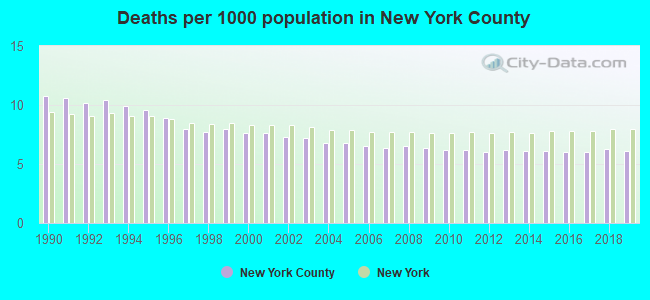
Deaths per 1000 population from 1990 to 1999: 9.4
Deaths per 1000 population from 2000 to 2009: 6.9
Deaths per 1000 population from 2010 to 2020: 6.4
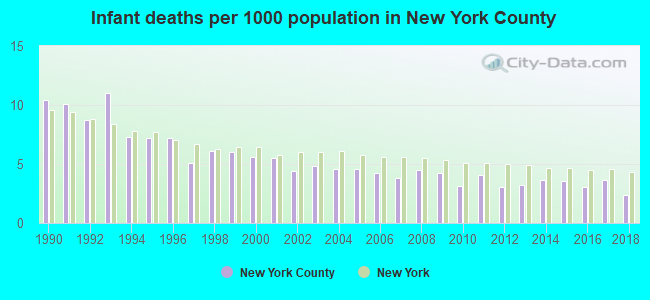
Infant deaths per 1000 live births from 1990 to 1999: 7.9
Infant deaths per 1000 live births from 2000 to 2009: 4.6
Infant deaths per 1000 live births from 2010 to 2021: 3.2
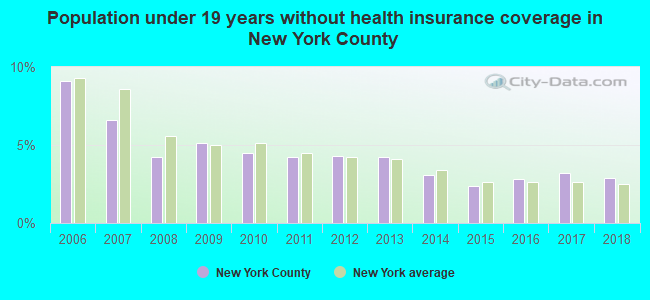
Persons under 19 years old without health insurance coverage in 2018: 2.9%
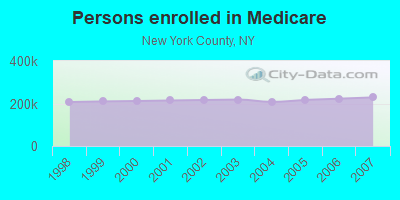
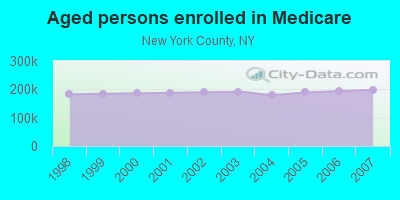
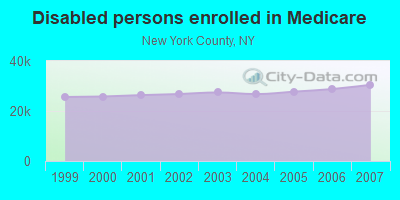
Persons enrolled in hospital insurance and/or supplemental medical insurance (Medicare) in July 1, 2007: 228,740 (198,252 aged, 30,488 disabled)
Children under 18 without health insurance coverage in 2007: 32,416 (12%)
Most common underlying causes of death in New York County, New York in 1999 - 2019:
- Atherosclerotic heart disease (27,740)
- Atherosclerotic cardiovascular disease, so described (12,549)
- Bronchus or lung, unspecified - Malignant neoplasms (11,928)
- Acute myocardial infarction, unspecified (10,434)
- Hypertensive heart disease without (congestive) heart failure (5,477)
- Pneumonia, unspecified (5,404)
- Chronic obstructive pulmonary disease, unspecified (4,853)
- Unspecified dementia (4,810)
- Breast, unspecified - Malignant neoplasms (4,751)
- Colon, unspecified - Malignant neoplasms (4,169)
Population without health insurance coverage in 2000: 15%
Children under 18 without health insurance coverage in 2000: 9%
Short term general hospital admissions per 100,000 population in 2004: 26,154
Short term general hospital beds per 100,000 population in 2004: 569
Emergency room visits per 100,000 population in 2004: 69,137
General practice office based MDs per 100,000 population in 2005: 1,288
Medical specialist MDs per 100,000 population in 2005: 714
Dentists per 100,000 population in 1998: 19
Total births per 100,000 population, July 2005 - July 2006 : 112
Total deaths per 100,000 population, July 2005 - July 2006: 171
Limited-service eating places per 100,000 population in 2005 : 23
Beer, wine & liquor stores per 100,000 population in 2005: 1
Fitness & recreation sports centers per 100,000 population in 2005: 5,222
EPA green book nonattainment status in 2004-2006: 1
Suicides per 1,000,000 population from 2000 to 2006: 79.8. This is more than state average.
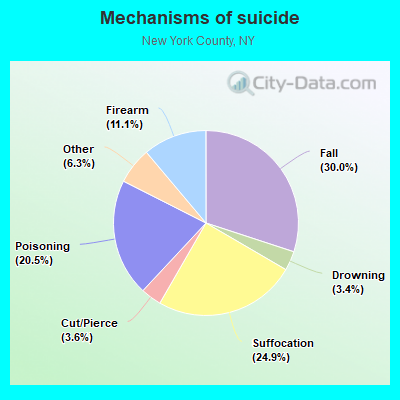
- Fall - 24.0
- Suffocation - 19.9
- Poisoning - 16.4
- Firearm - 8.9
- Cut/Pierce - 2.9
- Drowning - 2.7
- Other - 5.1
Household type by relationship:
Households: 1,596,273- Male householders: 363,807 (164,843 living alone), Female householders: 440,037 (223,167 living alone)
216,463 spouses (206,398 opposite-sex spouses), 56,163 unmarried partners, (47,633 opposite-sex unmarried partners), 289,780 children (282,421 natural, 3,316 adopted, 4,043 stepchildren), 22,121 grandchildren, 17,616 brothers or sisters, 18,667 parents, 614 foster children, 24,966 other relatives, 72,154 non-relatives
- In group quarters: 73,885
Size of family households: 164,744 2-persons, 84,325 3-persons, 49,183 4-persons, 13,432 5-persons, 5,784 6-persons, 5,178 7-or-more-persons.
Size of nonfamily households: 388,010 1-person, 76,532 2-persons, 12,561 3-persons, 3,713 4-persons, 40 5-persons, 234 6-persons, 108 7-or-more-persons.
127,476 married couples with children.
65,828 single-parent households (10,882 men, 54,946 women).
62.5% of residents of New York speak English at home.
20.4% of residents speak Spanish at home (60% speak English very well, 15% speak English well, 17% speak English not well, 8% don't speak English at all).
7.6% of residents speak other Indo-European language at home (83% speak English very well, 13% speak English well, 3% speak English not well, 1% don't speak English at all).
7.6% of residents speak Asian or Pacific Island language at home (54% speak English very well, 17% speak English well, 15% speak English not well, 14% don't speak English at all).
1.8% of residents speak other language at home (79% speak English very well, 16% speak English well, 4% speak English not well, 1% don't speak English at all).
In fiscal year 2004:
Federal Government expenditure: $0,000 ($0 per capita)
Department of Defense expenditure: $0,000
Federal direct payments to individuals for retirement and disability: $0,000
Federal other direct payments to individuals: $0,000
Federal direct payments not to individuals: $0,000
Federal grants: $0,000
Federal procurement contracts: $0,000 ($0,000 Department of Defense)
Federal salaries and wages: $0,000 ($0,000 Department of Defense)
Federal Government direct loans: $0,000
Federal guaranteed/insured loans: $0,000
Federal Government insurance: $0,000
Population change from April 1, 2000 to July 1, 2005:
Births: 109,382| Here: | 69 per 1000 residents |
| State: | 70 per 1000 residents |
Deaths: 57,606
| Here: | 36 per 1000 residents |
| State: | 42 per 1000 residents |
Net international migration: +90,461
| Here: | +57 per 1000 residents |
| State: | +35 per 1000 residents |
Net internal migration: -112,667
| Here: | |
| State: |
Total withdrawal of fresh water for public supply: 0.00 millions of gallons per day (all from surface)
| Here: | 4.1 |
| State: | 6.3 |
| Here: | 3.2 |
| State: | 3.8 |
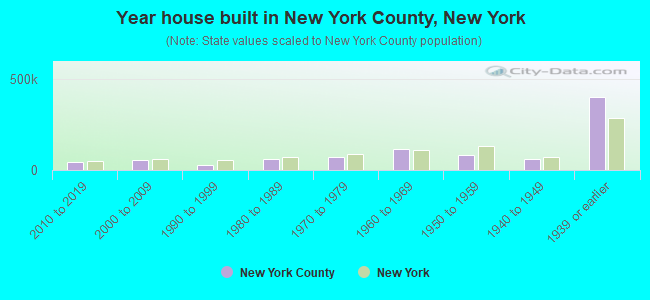
- Year house built in New York County, New York
- 2,9232020 or later
- 53,3862010 to 2019
- 55,1272000 to 2009
- 28,2541990 to 1999
- 62,1881980 to 1989
- 72,4801970 to 1979
- 110,8401960 to 1969
- 85,4941950 to 1959
- 61,2121940 to 1949
- 391,3351939 or earlier
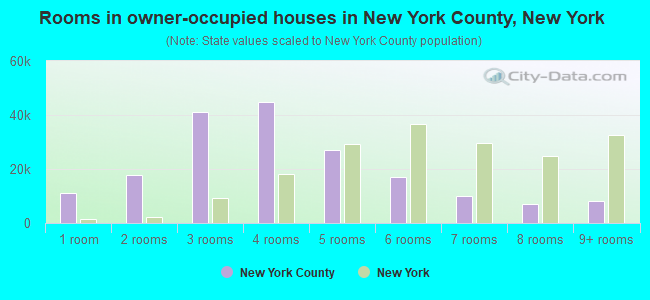
- Rooms in owner-occupied houses in New York County, New York
- 11,2101 room
- 15,3712 rooms
- 45,9793 rooms
- 40,7804 rooms
- 38,1885 rooms
- 17,5076 rooms
- 10,7397 rooms
- 7,2648 rooms
- 8,4089+ rooms

- Rooms in renter-occupied apartments in New York County, New York
- 92,0241 room
- 99,1632 rooms
- 167,5293 rooms
- 140,6074 rooms
- 73,9165 rooms
- 24,3476 rooms
- 6,2317 rooms
- 2,2678 rooms
- 2,3149+ rooms
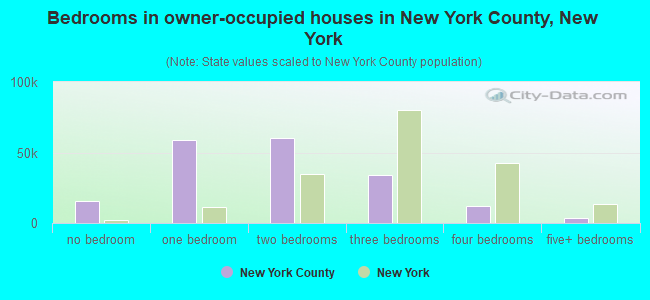
- Bedrooms in owner-occupied houses in New York County, New York
- 16,256no bedroom
- 58,3691 bedroom
- 63,5822 bedrooms
- 41,9203 bedrooms
- 11,8404 bedrooms
- 3,4795+ bedrooms
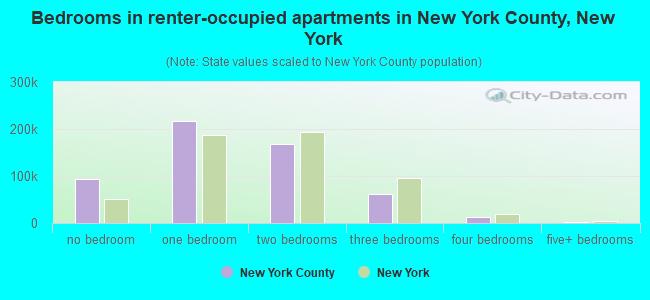
- Bedrooms in renter-occupied apartments in New York County, New York
- 110,460no bedroom
- 236,9701 bedroom
- 176,8002 bedrooms
- 72,8683 bedrooms
- 9,7694 bedrooms
- 1,5315+ bedrooms

- Cars and other vehicles available in New York County in owner-occupied houses/condos
- 118,918no vehicle
- 64,6021 vehicle
- 9,0442 vehicles
- 1,1543 vehicles
- 1,2184 vehicles
- 5105+ vehicles
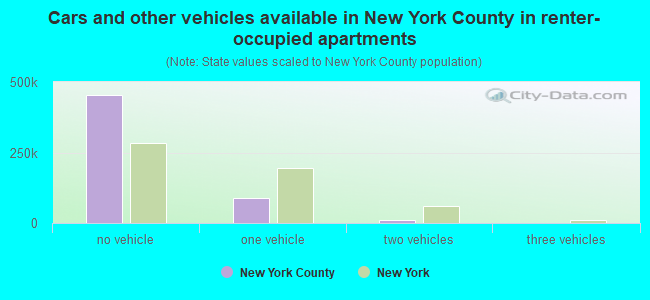
- Cars and other vehicles available in New York County in renter-occupied apartments
- 509,862no vehicle
- 89,2861 vehicle
- 7,6882 vehicles
- 1,2833 vehicles
- 1904 vehicles
- 895+ vehicles
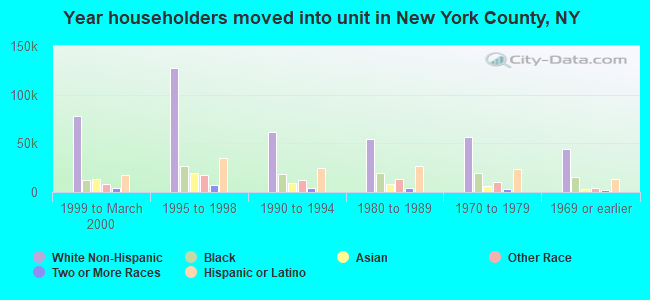
82.1% of New York County residents lived in the same house 1 years ago.
Out of people who lived in different houses, 35% lived in this county.
Out of people who lived in different counties, 18% lived in New York.
| New York County: | 82.1% |
| State average: | 89.6% |
Place of birth for U.S.-born residents:
- This state: 683,315
- Other state: 406,631
- Northeast: 142,242
- Midwest: 72,005
- South: 108,851
- West: 83,533
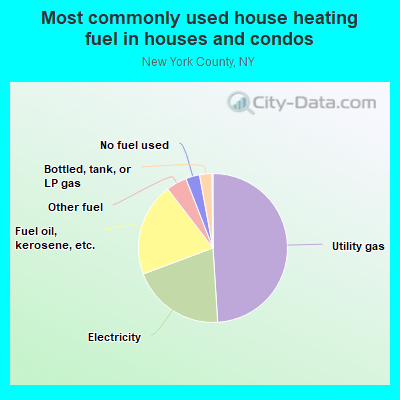
- 50.5%Utility gas
- 20.6%Electricity
- 17.8%Fuel oil, kerosene, etc.
- 4.0%Other fuel
- 3.3%Bottled, tank, or LP gas
- 3.2%No fuel used
- 0.6%Wood
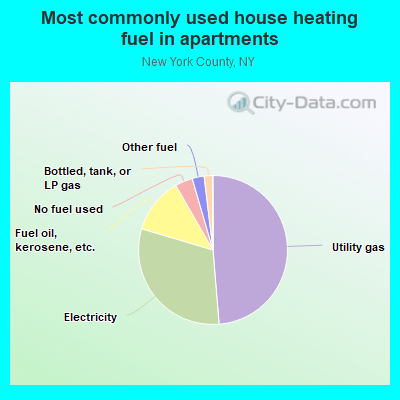
- 48.3%Utility gas
- 29.5%Electricity
- 13.2%Fuel oil, kerosene, etc.
- 4.8%No fuel used
- 2.2%Other fuel
- 1.7%Bottled, tank, or LP gas
Private vs. public school enrollment:
| Here: | 24.4% |
| New York: | 15.6% |
| Here: | 31.8% |
| New York: | 15.0% |
| Here: | 71.1% |
| New York: | 39.2% |
Supplemental Security Income (SSI) in 2006:
- Total number of recipients: 81,179
- Number of aged recipients: 21,186
- Number of blind and disabled recipients: 59,993
- Number of recipients under 18: 6,150
- Number of recipients between 18 and 64: 38,971
- Number of recipients older than 64: 36,058
- Number of recipients also receiving OASDI: 29,868
- Amount of payments (thousands of dollars): 40,392
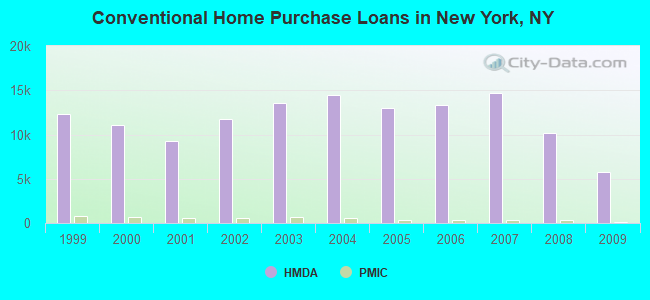
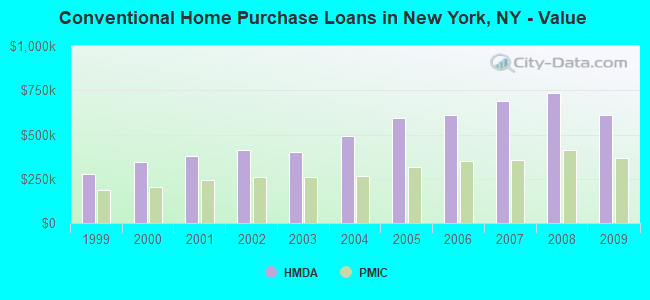
| Home Mortgage Disclosure Act Aggregated Statistics For Year 2009 (Based on 284 full tracts) | ||||||||||||||
| A) FHA, FSA/RHS & VA Home Purchase Loans | B) Conventional Home Purchase Loans | C) Refinancings | D) Home Improvement Loans | E) Loans on Dwellings For 5+ Families | F) Non-occupant Loans on < 5 Family Dwellings (A B C & D) | G) Loans On Manufactured Home Dwelling (A B C & D) | ||||||||
|---|---|---|---|---|---|---|---|---|---|---|---|---|---|---|
| Number | Average Value | Number | Average Value | Number | Average Value | Number | Average Value | Number | Average Value | Number | Average Value | Number | Average Value | |
| LOANS ORIGINATED | 26 | $597,308 | 5,747 | $610,235 | 12,150 | $464,928 | 335 | $359,146 | 376 | $2,525,588 | 1,861 | $576,235 | 1 | $10,000 |
| APPLICATIONS APPROVED, NOT ACCEPTED | 8 | $433,000 | 1,092 | $747,525 | 1,454 | $505,204 | 42 | $311,905 | 43 | $2,886,581 | 303 | $599,785 | 0 | $0 |
| APPLICATIONS DENIED | 49 | $461,163 | 2,143 | $665,531 | 5,199 | $539,560 | 353 | $166,147 | 56 | $2,832,250 | 1,108 | $516,727 | 12 | $87,667 |
| APPLICATIONS WITHDRAWN | 34 | $568,912 | 1,195 | $685,370 | 2,017 | $543,395 | 56 | $426,768 | 32 | $3,316,531 | 508 | $620,232 | 0 | $0 |
| FILES CLOSED FOR INCOMPLETENESS | 8 | $510,375 | 399 | $659,471 | 992 | $548,497 | 39 | $316,282 | 1 | $1,600,000 | 200 | $588,335 | 0 | $0 |
| Private Mortgage Insurance Companies Aggregated Statistics For Year 2009 (Based on 137 full tracts) | ||||||
| A) Conventional Home Purchase Loans | B) Refinancings | C) Non-occupant Loans on < 5 Family Dwellings (A & B) | ||||
|---|---|---|---|---|---|---|
| Number | Average Value | Number | Average Value | Number | Average Value | |
| LOANS ORIGINATED | 103 | $369,563 | 41 | $399,146 | 2 | $281,500 |
| APPLICATIONS APPROVED, NOT ACCEPTED | 83 | $372,024 | 26 | $354,962 | 5 | $303,000 |
| APPLICATIONS DENIED | 82 | $400,305 | 52 | $369,885 | 0 | $0 |
| APPLICATIONS WITHDRAWN | 33 | $322,242 | 13 | $420,692 | 2 | $619,000 |
| FILES CLOSED FOR INCOMPLETENESS | 12 | $385,167 | 2 | $407,000 | 0 | $0 |
| Most common first names in New York County, NY among deceased individuals | ||
| Name | Count | Lived (average) |
|---|---|---|
| John | 11,027 | 72.3 years |
| Mary | 10,178 | 79.6 years |
| William | 8,418 | 72.6 years |
| Joseph | 7,881 | 74.3 years |
| James | 7,139 | 70.1 years |
| Anna | 5,346 | 81.7 years |
| George | 5,225 | 73.7 years |
| Robert | 5,065 | 68.1 years |
| Charles | 4,983 | 73.6 years |
| Helen | 4,943 | 79.9 years |
| Most common last names in New York County, NY among deceased individuals | ||
| Last name | Count | Lived (average) |
|---|---|---|
| Smith | 3,093 | 72.9 years |
| Brown | 2,831 | 71.8 years |
| Williams | 2,650 | 70.8 years |
| Johnson | 2,497 | 71.5 years |
| Jones | 2,083 | 70.7 years |
| Rodriguez | 1,926 | 70.9 years |
| Lee | 1,620 | 75.8 years |
| Miller | 1,545 | 77.6 years |
| Davis | 1,542 | 72.4 years |
| Cohen | 1,490 | 79.5 years |
| Businesses in New York County, NY | ||||
| Name | Count | Name | Count | |
|---|---|---|---|---|
| 24 Hour Fitness | 4 | JoS. A. Bank | 3 | |
| 7-Eleven | 53 | Johnny Rockets | 5 | |
| A&P | 1 | Jones New York | 42 | |
| ALDI | 1 | Journeys | 6 | |
| ALDO | 21 | Justice | 5 | |
| AMF Bowling | 1 | KFC | 67 | |
| AT&T | 168 | Kmart | 8 | |
| Abercrombie & Fitch | 2 | Kohl's | 4 | |
| Ace Hardware | 11 | Kroger | 1 | |
| Advance Auto Parts | 12 | LA Fitness | 1 | |
| Aeropostale | 10 | La Quinta | 4 | |
| Aerosoles | 25 | La-Z-Boy | 5 | |
| American Eagle Outfitters | 8 | Lane Bryant | 8 | |
| Ann Taylor | 21 | Lane Furniture | 8 | |
| Apple Store | 5 | LensCrafters | 24 | |
| Applebee's | 24 | Levi Strauss & Co. | 6 | |
| Arby's | 2 | Little Caesars Pizza | 30 | |
| Ascend Collection | 6 | Loews | 1 | |
| Ashley Furniture | 3 | Lowe's | 3 | |
| Audi | 2 | Macy's | 10 | |
| AutoZone | 26 | Marriott | 23 | |
| Avenue | 16 | Marshalls | 16 | |
| BMW | 4 | MasterBrand Cabinets | 101 | |
| Baja Fresh Mexican Grill | 2 | McDonald's | 247 | |
| Bakers | 8 | Men's Wearhouse | 11 | |
| Bally Total Fitness | 16 | Motherhood Maternity | 15 | |
| Banana Republic | 16 | New Balance | 70 | |
| Barnes & Noble | 13 | New York & Co | 14 | |
| Baskin-Robbins | 205 | Nike | 476 | |
| Bath & Body Works | 11 | Nissan | 9 | |
| Bebe | 7 | Nordstrom | 1 | |
| Bed Bath & Beyond | 11 | Office Depot | 1 | |
| Ben & Jerry's | 9 | OfficeMax | 1 | |
| Bentleymotors.Com | 1 | Old Navy | 17 | |
| Best Cellars | 1 | Olive Garden | 3 | |
| Best Western | 15 | Outback | 6 | |
| Blockbuster | 29 | Outback Steakhouse | 6 | |
| Brooks Brothers | 7 | Pac Sun | 1 | |
| Brookstone | 10 | Panda Express | 1 | |
| Budget Car Rental | 5 | Panera Bread | 7 | |
| Buffalo Wild Wings | 1 | Papa John's Pizza | 32 | |
| Burger King | 32 | Pathmark | 21 | |
| Buybuy BABY | 1 | Payless | 102 | |
| CVS | 112 | Penske | 12 | |
| Cache | 3 | PetSmart | 3 | |
| Casual Male XL | 7 | Pier 1 Imports | 5 | |
| Catherines | 2 | Pizza Hut | 15 | |
| Century 21 | 3 | Popeyes | 72 | |
| Charlotte Russe | 4 | Pottery Barn | 3 | |
| Chevrolet | 8 | Pottery Barn Kids | 2 | |
| Chick-Fil-A | 1 | Qdoba Mexican Grill | 8 | |
| Chico's | 5 | Quality | 4 | |
| Chipotle | 31 | Quiznos | 12 | |
| Chuck E. Cheese's | 6 | RadioShack | 119 | |
| Church's Chicken | 1 | Ramada | 5 | |
| Cinnabon | 8 | Raymour & Flanigan | 10 | |
| Circle K | 2 | Red Lobster | 4 | |
| Clarion | 3 | Red Roof Inn | 2 | |
| Clarks | 3 | Rite Aid | 199 | |
| Cold Stone Creamery | 14 | Ruby Tuesday | 1 | |
| Coldwater Creek | 3 | Ryder Rental & Truck Leasing | 1 | |
| Comfort Inn | 19 | SAS Shoes | 37 | |
| Costco | 5 | Saks Fifth Avenue | 1 | |
| Crate & Barrel | 2 | Sears | 17 | |
| Curves | 19 | Sephora | 21 | |
| DHL | 118 | Sheraton | 5 | |
| Days Inn | 5 | Skechers USA | 8 | |
| Decora Cabinetry | 12 | Sleep Inn | 2 | |
| Domino's Pizza | 41 | Spencer Gifts | 2 | |
| DressBarn | 14 | Sprint Nextel | 99 | |
| Dressbarn | 14 | Staples | 54 | |
| Dunkin Donuts | 453 | Starbucks | 166 | |
| Econo Lodge | 2 | Steak 'n Shake | 1 | |
| Eddie Bauer | 1 | Stop & Shop | 14 | |
| Express | 11 | Subaru | 5 | |
| Extended Stay America | 1 | Subway | 303 | |
| Famous Footwear | 6 | Super 8 | 3 | |
| Fashion Bug | 4 | T-Mobile | 48 | |
| FedEx | 623 | T.G.I. Driday's | 14 | |
| Finish Line | 5 | T.J.Maxx | 9 | |
| Firestone Complete Auto Care | 5 | Taco Bell | 24 | |
| Food Basics | 1 | Talbots | 3 | |
| Foot Locker | 30 | Target | 10 | |
| Forever 21 | 8 | The Athlete's Foot | 1 | |
| Fredericks Of Hollywood | 2 | The Food Emporium | 13 | |
| GNC | 128 | The Limited | 1 | |
| GameStop | 81 | The Room Place | 21 | |
| Gap | 31 | Tim Hortons | 13 | |
| Goodwill | 1 | Toyota | 9 | |
| Gymboree | 5 | Toys"R"Us | 43 | |
| H&M | 11 | Trader Joe's | 6 | |
| H&R Block | 195 | True Value | 82 | |
| Haagen-Dazs | 12 | U-Haul | 88 | |
| Haworth | 5 | UPS | 532 | |
| Hilton | 28 | Urban Outfitters | 10 | |
| Holiday Inn | 25 | Vans | 26 | |
| Hollister Co. | 3 | Verizon Wireless | 58 | |
| Home Depot | 21 | Victoria's Secret | 19 | |
| Honda | 8 | Volkswagen | 7 | |
| Hot Topic | 2 | Waldbaums | 16 | |
| Howard Johnson | 9 | Walgreens | 81 | |
| Hyatt | 4 | Wendy's | 47 | |
| Hyundai | 7 | Westin | 1 | |
| IHOP | 14 | Wet Seal | 1 | |
| IKEA | 1 | White Castle | 35 | |
| J. Jill | 1 | Whole Foods Market | 8 | |
| J.Crew | 12 | Wingate | 2 | |
| JCPenney | 4 | YMCA | 22 | |
| Jamba Juice | 16 | |||
New York County on our top lists:
- #1 on the list of "Top 101 counties with the lowest percentage of residents that keep firearms around their homes"
- #3 on the list of "Top 101 counties with the most Orthodox congregations"
- #3 on the list of "Top 101 counties with the most Orthodox congregations (pop. 50,000+)"
- #5 on the list of "Top 101 counties with the most Orthodox adherents"
- #5 on the list of "Top 101 counties with the most Orthodox adherents (pop. 50,000+)"
- #10 on the list of "Top 101 counties with the most Catholic congregations"
- #10 on the list of "Top 101 counties with the most Catholic congregations (pop. 50,000+)"
- #10 on the list of "Top 101 counties with the most Other adherents"
- #10 on the list of "Top 101 counties with the most Other adherents (pop. 50,000+)"
- #11 on the list of "Top 101 counties with highest percentage of residents voting for Obama (Democrat) in the 2012 Presidential Election (pop. 50,000+)"
- #14 on the list of "Top 101 counties with the lowest average weight of females"
- #16 on the list of "Top 101 counties with the most Other congregations (pop. 50,000+)"
- #16 on the list of "Top 101 counties with the most Other congregations"
- #18 on the list of "Top 101 counties with highest percentage of residents voting for Obama (Democrat) in the 2012 Presidential Election"
- #18 on the list of "Top 101 counties with the most Mainline Protestant adherents"
- #18 on the list of "Top 101 counties with the most Mainline Protestant adherents (pop. 50,000+)"
- #23 on the list of "Top 101 counties with the most Mainline Protestant congregations"
- #23 on the list of "Top 101 counties with the most Mainline Protestant congregations (pop. 50,000+)"
- #25 on the list of "Top 101 counties with the largest decrease in the number of deaths per 1000 residents 2000-2006 to 2007-2013 (pop. 50,000+)"
- #27 on the list of "Top 101 counties with the lowest Ozone (1-hour) air pollution readings in 2012 (ppm)"