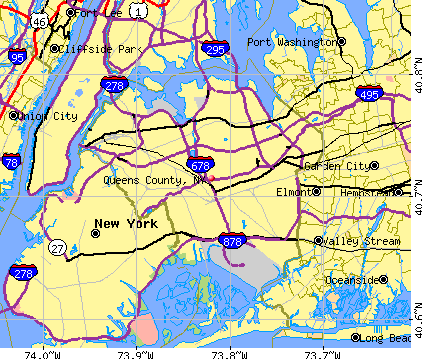
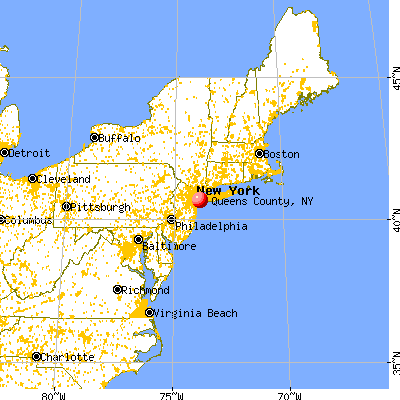
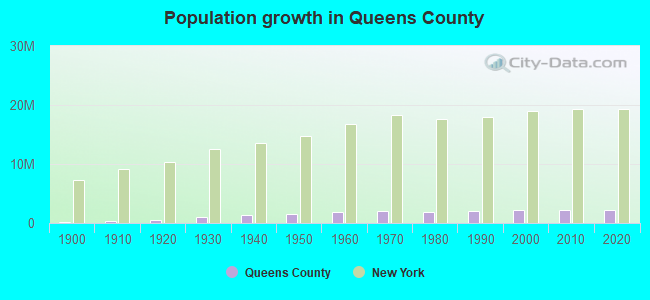
Queens County, New York (NY)
County owner-occupied free and clear houses and condos in 2010: 115,431
County owner-occupied houses and condos in 2000: 334,894
Renter-occupied apartments: 444,663 (it was 447,770 in 2000)
| % of renters here: | 57% |
| State: | 47% |
Land area: 109 sq. mi.
Water area: 69.0 sq. mi.
Population density: 20854 people per square mile (very high).
Industries providing employment: Educational, health and social services (26.3%), Professional, scientific, management, administrative, and waste management services (12.3%).
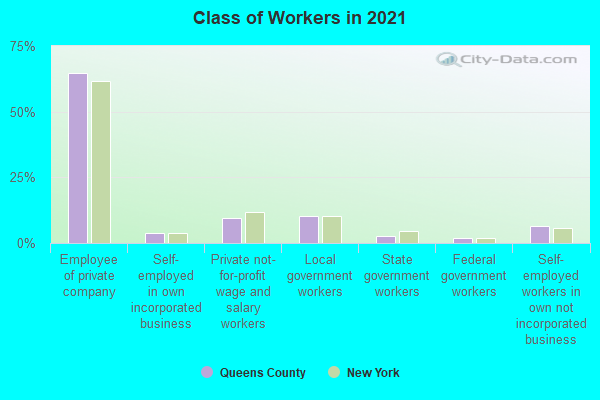
Type of workers:
- Private wage or salary: 79%
- Government: 14%
- Self-employed, not incorporated: 6%
- Unpaid family work: 0%
- OSM Map
- General Map
- Google Map
- MSN Map

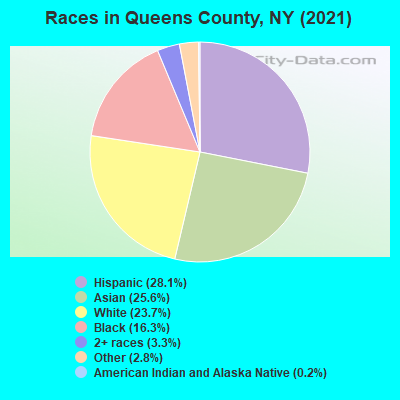
- 642,19628.2%Hispanic or Latino
- 595,54526.1%Asian alone
- 521,76822.9%White Non-Hispanic Alone
- 369,50216.2%Black Non-Hispanic Alone
- 81,1363.6%Two or more races
- 59,1052.6%Some other race alone
- 6,3870.3%American Indian and Alaska Native alone
- 2,3900.1%Native Hawaiian and Other
Pacific Islander alone
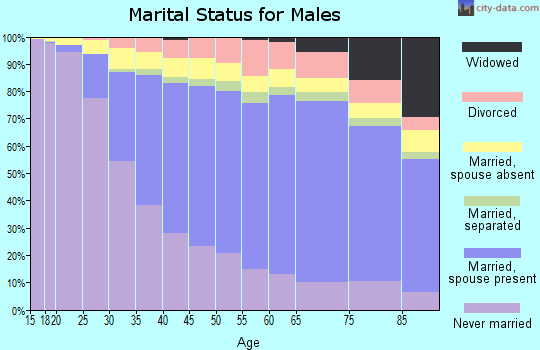
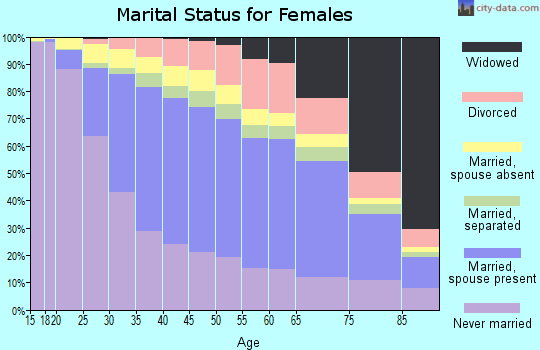
| Median resident age: | 40.9 years |
| New York median age: | 40.0 years |
| Males: 1,114,721 | |
| Females: 1,163,308 |

 | Latest Democrat plan to take your money: residential parking permits (41 replies) |
| NYS Top Court Rules NYC Property Tax *May* Violate Federal & State Laws (18 replies) |
| Upper Middle class african-american communities in ny (2034 replies) |
| NYC Natives: Do You Stay in the Borough in Which You Were Born? (52 replies) |
| what actually is long island? (18 replies) |
| Why do people hate Staten Island? (326 replies) |
| Queens County: | 2.0 people |
| New York: | 3 people |
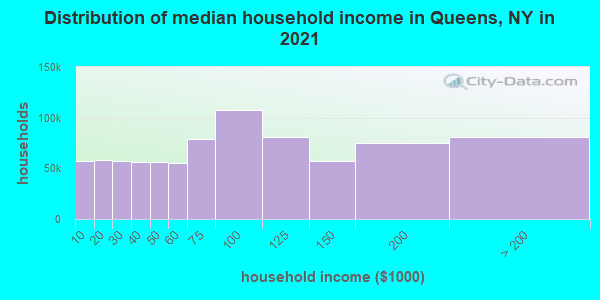
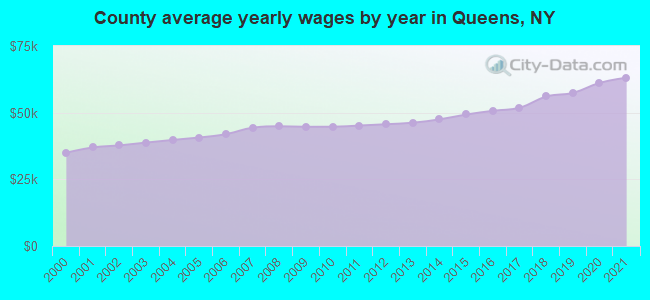
Estimated median household income in 2022: $80,557 ($42,439 in 1999)
| This county: | $80,557 |
| New York: | $79,557 |
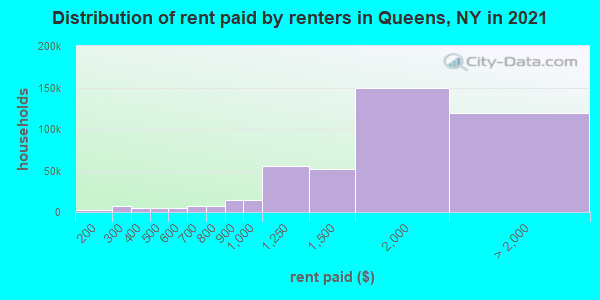
Median contract rent in 2022 for apartments: $1,683 (lower quartile is $1,240, upper quartile is $2,100)
| This county: | $1683 |
| State: | $1354 |
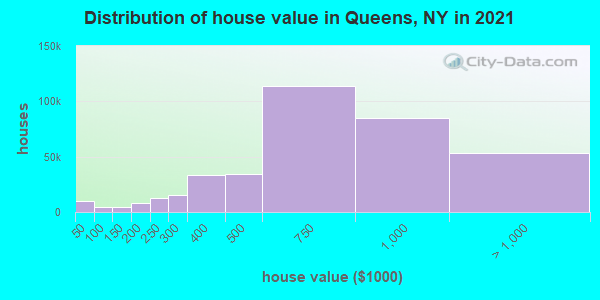
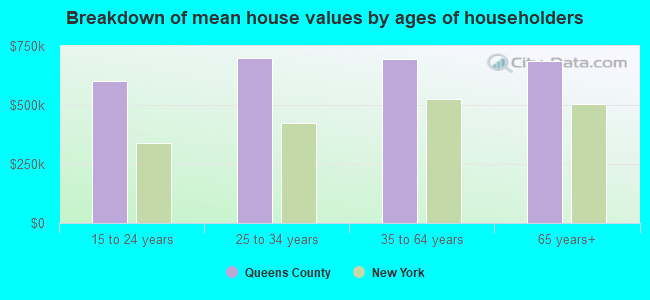
Estimated median house or condo value in 2022: $683,600 (it was $206,200 in 2000)
| Queens: | $683,600 |
| New York: | $400,400 |
Mean price in 2022:
Median monthly housing costs for homes and condos with a mortgage: $2,835Detached houses: $825,788
Here: $825,788 State: $476,719 Townhouses or other attached units: $810,362
Here: $810,362 State: $699,270 In 2-unit structures: $794,580
Here: $794,580 State: $713,077 In 3-to-4-unit structures: $895,523
Here: $895,523 State: $764,568 In 5-or-more-unit structures: $452,004
Here: $452,004 State: $912,009 Mobile homes: $368,353
Here: $368,353 State: $88,925
Median monthly housing costs for units without a mortgage: $999
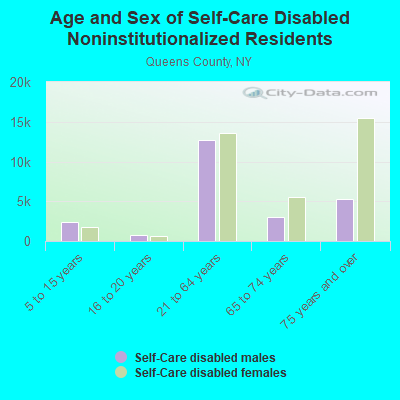
Institutionalized population: 15,364
Health of residents in Queens County based on CDC Behavioral Risk Factor Surveillance System Survey Questionnaires from 2003 to 2012:
General health status score of residents in this county from 1 (poor) to 5 (excellent) is 3.4. This is about average.68.7% of residents exercised in the past month. This is less than average.
41.4% of residents smoked 100+ cigarettes in their lives. This is about average.
75.3% of adult residents drank alcohol in the past 30 days. This is about average.
71.1% of residents visited a dentist within the past year. This is about average.
Average weight of males is 184 pounds. This is less than average.
Average weight of females is 156 pounds. This is about average.
5.2% of residents keep firearms around their homes. This is less than average.
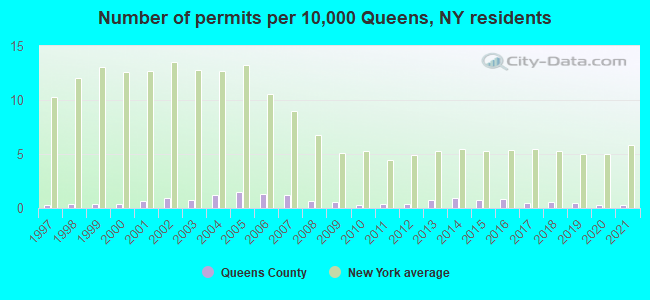
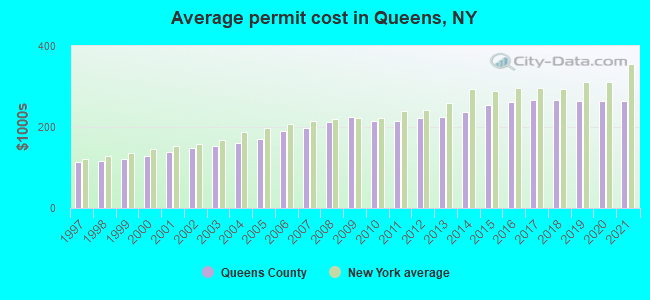
Single-family new house construction building permits:
- 2022: 28 buildings, average cost: $287,100
- 2021: 52 buildings, average cost: $263,100
- 2020: 62 buildings, average cost: $264,800
- 2019: 94 buildings, average cost: $263,800
- 2018: 119 buildings, average cost: $266,800
- 2017: 113 buildings, average cost: $266,700
- 2016: 190 buildings, average cost: $260,600
- 2015: 171 buildings, average cost: $254,200
- 2014: 214 buildings, average cost: $236,900
- 2013: 157 buildings, average cost: $224,200
- 2012: 76 buildings, average cost: $223,200
- 2011: 83 buildings, average cost: $213,800
- 2010: 63 buildings, average cost: $215,800
- 2009: 124 buildings, average cost: $223,900
- 2008: 140 buildings, average cost: $213,200
- 2007: 267 buildings, average cost: $198,400
- 2006: 288 buildings, average cost: $189,900
- 2005: 334 buildings, average cost: $170,700
- 2004: 265 buildings, average cost: $161,100
- 2003: 161 buildings, average cost: $152,100
- 2002: 214 buildings, average cost: $146,500
- 2001: 142 buildings, average cost: $138,700
- 2000: 87 buildings, average cost: $128,500
- 1999: 91 buildings, average cost: $120,400
- 1998: 89 buildings, average cost: $116,200
- 1997: 61 buildings, average cost: $112,700
Median real estate property taxes paid for housing units with mortgages in 2022: $5,916 (0.8%)
Median real estate property taxes paid for housing units with no mortgage in 2022: $5,840 (0.9%)
| Queens County: | 13.0% |
| New York: | 14.3% |
Median age of residents in 2022: 40.9 years old
(Males: 39.8 years old, Females: 42.4 years old)
(Median age for: White residents: 46.6 years old, Black residents: 40.4 years old, American Indian residents: 34.5 years old, Asian residents: 42.0 years old, Hispanic or Latino residents: 36.6 years old, Other race residents: 36.9 years old)
Area name: New York-Monmouth-Ocean, NY-NJ HUD Metro FMR Area
Fair market rent in 2006 for a 1-bedroom apartment in Queens County is $1003 a month.
Fair market rent for a 2-bedroom apartment is $1133 a month.
Fair market rent for a 3-bedroom apartment is $1406 a month.
Cities in this county include: Queens.
2023 air pollution in Queens County:
Carbon Monoxide: 0.271 ppm (standard limit: 9 ppm). Near U.S. average.
Nitrogen Dioxide: 0.01 ppm (standard limit: 0.053 ppm). Above U.S. average.
Ozone (1-hour): 0.031 ppm (standard limit: 0.12 ppm). Near U.S. average.
Particulate Matter (PM2.5) Annual: 9.2 µg/m3(standard limit: 15.0 µg/m3). Near U.S. average.
Sulfur Oxides Annual: 0.000 ppm (standard limit: 0.03 ppm). Near U.S. average.
Neighboring counties: Clinton County, Indiana  , Middlesex County, New Jersey
  , Warren County, New Jersey , Livingston County, Illinois , Otoe County, Nebraska .
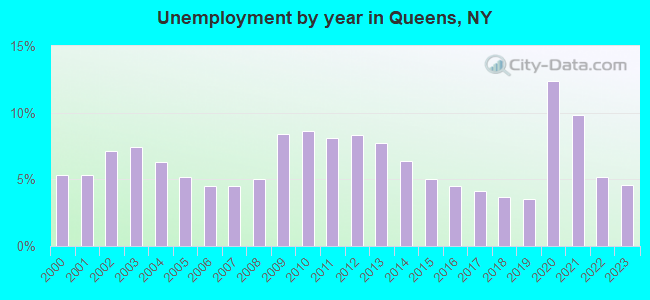
| Here: | 4.4% |
| New York: | 4.4% |
Current college students: 164,114
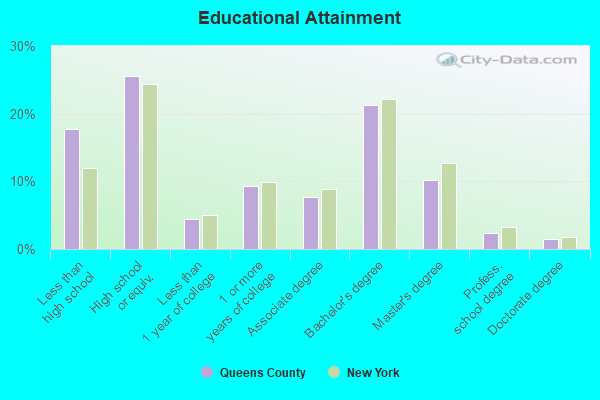
People 25 years of age or older with a high school degree or higher: 82.8%
People 25 years of age or older with a bachelor's degree or higher: 35.4%
Number of foreign born residents: 1,081,374 (61.6% naturalized citizens)
| Queens County: | 47.5% |
| Whole state: | 22.7% |
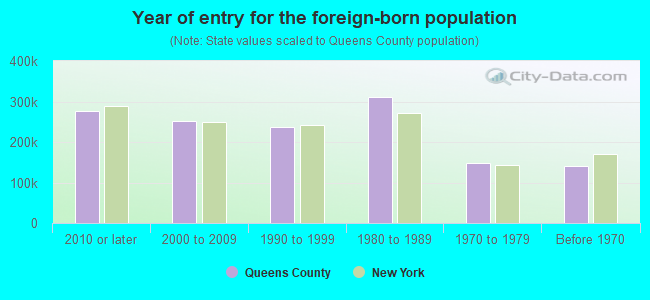
- Year of entry for the foreign-born population
- 277,8722010 or later
- 250,3682000 to 2009
- 229,2901990 to 1999
- 310,7221980 to 1989
- 148,1381970 to 1979
- 140,185Before 1970
Mean travel time to work (commute): + minutes
Percentage of county residents living and working in this county: 98.6%
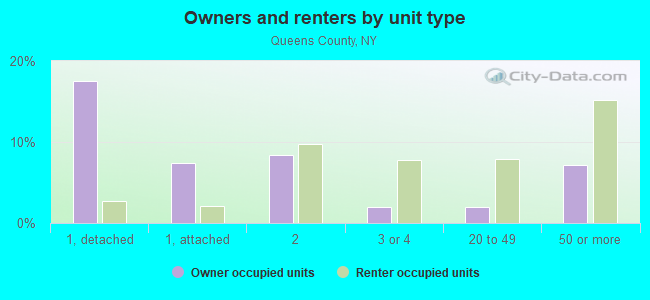
Housing units in structures:
- One, detached: 177,198
- One, attached: 82,131
- Two: 174,380
- 3 or 4: 89,923
- 5 to 9: 52,217
- 10 to 19: 35,833
- 20 to 49: 88,225
- 50 or more: 209,248
- Mobile homes: 2,463
- Boats, RVs, vans, etc.: 295
Housing units in Queens County with a mortgage: 204,464 (16,065 second mortgage, 1,073 home equity loan, 11,675 both second mortgage and home equity loan)
Houses without a mortgage: 5,197
| Here: | 97.6% with mortgage |
| State: | 95.5% with mortgage |
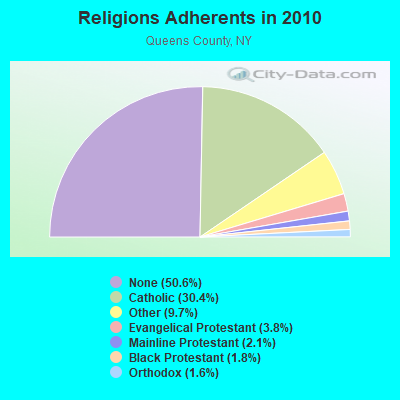
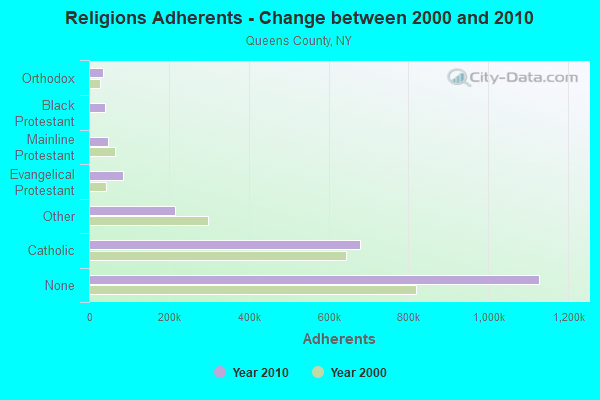
Religion statistics for Queens County
| Religion | Adherents | Congregations |
|---|---|---|
| Catholic | 677,520 | 100 |
| Other | 216,495 | 318 |
| Evangelical Protestant | 84,683 | 580 |
| Mainline Protestant | 47,425 | 207 |
| Black Protestant | 40,630 | 70 |
| Orthodox | 35,765 | 31 |
| None | 1,128,204 | - |
Source: Clifford Grammich, Kirk Hadaway, Richard Houseal, Dale E.Jones, Alexei Krindatch, Richie Stanley and Richard H.Taylor. 2012. 2010 U.S.Religion Census: Religious Congregations & Membership Study. Association of Statisticians of American Religious Bodies. Jones, Dale E., et al. 2002. Congregations and Membership in the United States 2000. Nashville, TN: Glenmary Research Center.
Food Environment Statistics:
| Queens County: | 4.93 / 10,000 pop. |
| State: | 4.13 / 10,000 pop. |
| Here: | 0.03 / 10,000 pop. |
| New York: | 0.06 / 10,000 pop. |
| This county: | 0.87 / 10,000 pop. |
| New York: | 0.92 / 10,000 pop. |
| Queens County: | 0.42 / 10,000 pop. |
| New York: | 1.68 / 10,000 pop. |
| This county: | 6.16 / 10,000 pop. |
| State: | 8.82 / 10,000 pop. |
| Queens County: | 8.6% |
| New York: | 8.2% |
| Queens County: | 23.3% |
| State: | 23.8% |
| Here: | 15.7% |
| State: | 15.6% |
Agriculture in Queens County:
The percentage of farms operated by a family or individual: 0.00%Earthquake activity:
Queens County-area historical earthquake activity is significantly above New York state average. It is 69% smaller than the overall U.S. average.On 8/23/2011 at 17:51:04, a magnitude 5.8 (5.8 MW, Depth: 3.7 mi, Class: Moderate, Intensity: VI - VII) earthquake occurred 293.4 miles away from Queens County center
On 10/7/1983 at 10:18:46, a magnitude 5.3 (5.1 MB, 5.3 LG, 5.1 ML) earthquake occurred 225.6 miles away from the county center
On 1/16/1994 at 01:49:16, a magnitude 4.6 (4.6 MB, 4.6 LG, Depth: 3.1 mi, Class: Light, Intensity: IV - V) earthquake occurred 119.5 miles away from the county center
On 4/20/2002 at 10:50:47, a magnitude 5.3 (5.3 ML, Depth: 3.0 mi) earthquake occurred 262.8 miles away from the county center
On 4/20/2002 at 10:50:47, a magnitude 5.2 (5.2 MB, 4.2 MS, 5.2 MW, 5.0 MW) earthquake occurred 261.0 miles away from Queens County center
On 8/22/1992 at 12:20:32, a magnitude 4.8 (4.8 MB, 3.8 MS, 4.7 LG, Depth: 6.2 mi) earthquake occurred 216.5 miles away from the county center
Magnitude types: regional Lg-wave magnitude (LG), body-wave magnitude (MB), local magnitude (ML), surface-wave magnitude (MS), moment magnitude (MW)
Most recent natural disasters:
- New York Tropical Storm Isaias, Incident Period: August 4, 2020, FEMA Id: 4567, Natural disaster type: Tropical Storm
- New York Covid-19 Pandemic, Incident Period: January 20, 2020, Major Disaster (Presidential) Declared DR-4480-NY: March 20, 2020, FEMA Id: 4480, Natural disaster type: Other
- New York Hurricane Sandy, Incident Period: October 27, 2012 to November 09, 2012, Emergency Declared EM-3351: October 28, 2012, FEMA Id: 3351, Natural disaster type: Hurricane
- New York Hurricane Sandy, Incident Period: October 27, 2012 to November 09, 2012, Major Disaster (Presidential) Declared DR-4085: October 30, 2012, FEMA Id: 4085, Natural disaster type: Hurricane
- New York Hurricane Irene, Incident Period: August 26, 2011 to September 05, 2011, Major Disaster (Presidential) Declared DR-4020: August 31, 2011, FEMA Id: 4020, Natural disaster type: Hurricane
- New York Hurricane Irene, Incident Period: August 25, 2011 to September 05, 2011, Emergency Declared EM-3328: August 26, 2011, FEMA Id: 3328, Natural disaster type: Hurricane
- New York Severe Storms, Tornadoes, and Straight-line Winds, Incident Period: September 16, 2010, Major Disaster (Presidential) Declared DR-1943: October 14, 2010, FEMA Id: 1943, Natural disaster type: Storm, Tornado, Wind
- New York Severe Storms, Flooding, and Tornado, Incident Period: August 08, 2007, Major Disaster (Presidential) Declared DR-1724: August 31, 2007, FEMA Id: 1724, Natural disaster type: Storm, Tornado, Flood
- New York Hurricane Katrina Evacuation, Incident Period: August 29, 2005 to October 01, 2005, Emergency Declared EM-3262: September 30, 2005, FEMA Id: 3262, Natural disaster type: Hurricane
- New York Power Outage, Incident Period: August 14, 2003 to August 16, 2003, Emergency Declared EM-3186: August 23, 2003, FEMA Id: 3186, Natural disaster type: Power Outage
- 9 other natural disasters have been reported since 1953.
The number of natural disasters in Queens County (19) is greater than the US average (15).
Major Disasters (Presidential) Declared: 11
Emergencies Declared: 7
Causes of natural disasters: Hurricanes: 5, Storms: 5, Floods: 4, Blizzards: 2, Tornadoes: 2, Heavy Rain: 1, Landslide: 1, Power Outage: 1, Snowstorm: 1, Tropical Storm: 1, Water Shortage: 1, Wind: 1, Other: 3 (Note: some incidents may be assigned to more than one category).
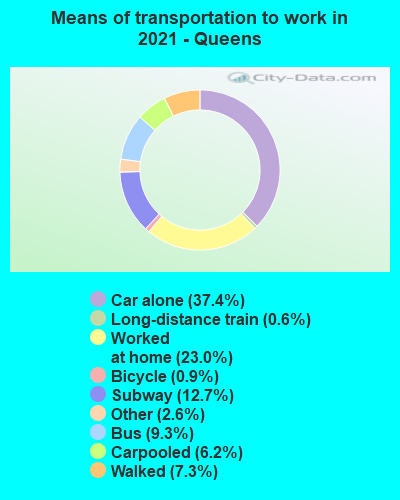
Means of transportation to work:
- Drove a car alone: 322,431 (39.5%)
- Carpooled: 57,552 (7.0%)
- Bus: 86,173 (10.6%)
- Subway or elevated rail: 126,628 (15.5%)
- Long-distance train or commuter rail: 12,326 (1.5%)
- Light rail, streetcar or trolley: 313 (0.0%)
- Ferryboat: 742 (0.1%)
- Taxicab, motorcycle, or other means: 21,210 (2.6%)
- Bicycle: 6,463 (0.8%)
- Walked: 53,878 (6.6%)
- Worked at home: 129,055 (15.8%)
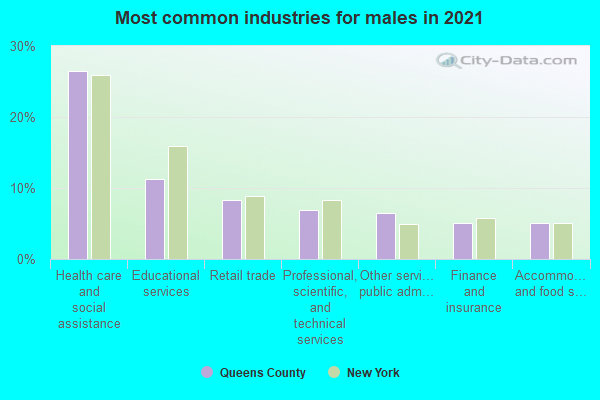
- Health care and social assistance (25%)
- Educational services (11%)
- Retail trade (8%)
- Other services, except public administration (6%)
- Professional, scientific, and technical services (6%)
- Accommodation and food services (6%)
- Finance and insurance (5%)
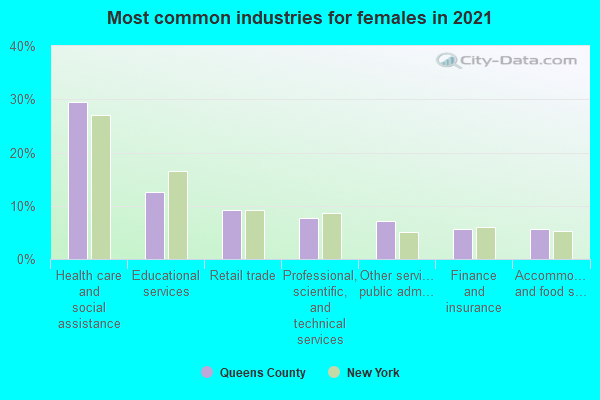
- Health care and social assistance (28%)
- Educational services (12%)
- Retail trade (9%)
- Other services, except public administration (7%)
- Professional, scientific, and technical services (7%)
- Accommodation and food services (6%)
- Finance and insurance (5%)
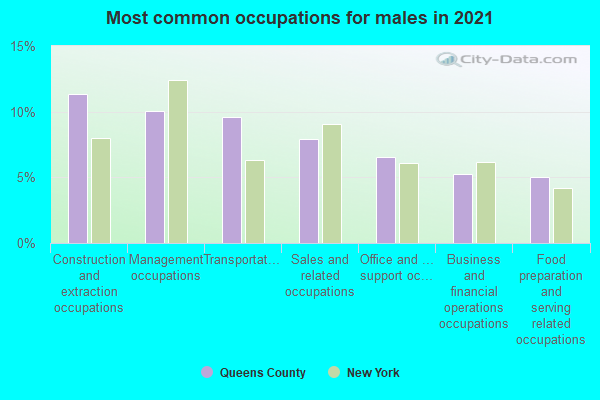
- Construction and extraction occupations (11%)
- Transportation occupations (11%)
- Management occupations (9%)
- Food preparation and serving related occupations (7%)
- Sales and related occupations (7%)
- Office and administrative support occupations (7%)
- Computer and mathematical occupations (6%)
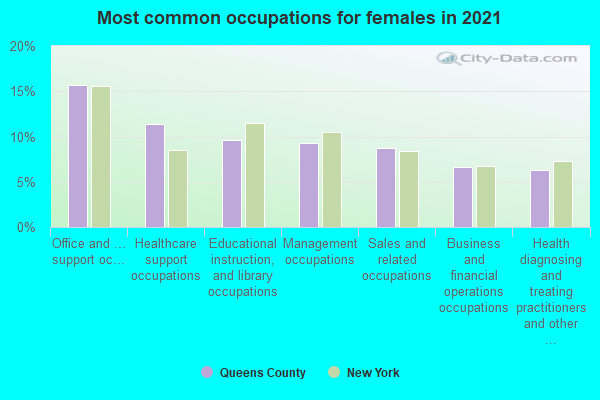
- Office and administrative support occupations (15%)
- Healthcare support occupations (11%)
- Management occupations (9%)
- Educational instruction, and library occupations (9%)
- Sales and related occupations (8%)
- Health diagnosing and treating practitioners and other technical occupations (6%)
- Business and financial operations occupations (6%)
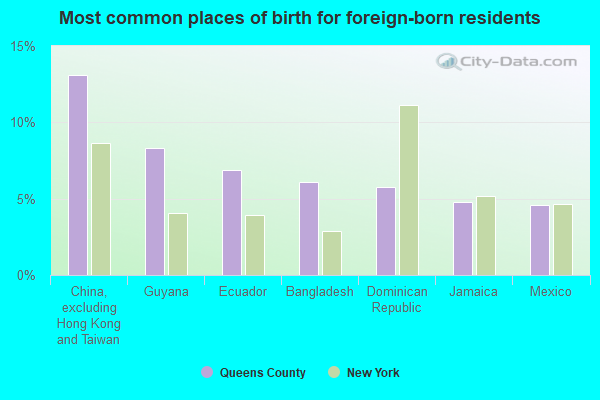
- China, excluding Hong Kong and Taiwan (14%)
- Guyana (8%)
- Ecuador (7%)
- Bangladesh (6%)
- Colombia (5%)
- Dominican Republic (5%)
- Mexico (5%)
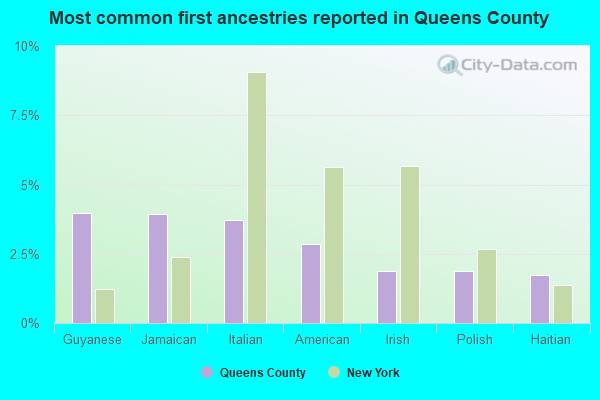
- Italian (4%)
- Guyanese (3%)
- Jamaican (3%)
- American (3%)
- Irish (2%)
- Haitian (2%)
- Polish (2%)
People in group quarters in Queens County, New York in 2010:
- 13,402 people in nursing facilities/skilled-nursing facilities
- 3,408 people in emergency and transitional shelters (with sleeping facilities) for people experiencing homelessness
- 3,366 people in college/university student housing
- 2,296 people in group homes intended for adults
- 2,224 people in other noninstitutional facilities
- 1,295 people in residential treatment centers for adults
- 902 people in mental (psychiatric) hospitals and psychiatric units in other hospitals
- 414 people in state prisons
- 234 people in federal detention centers
- 173 people in group homes for juveniles (non-correctional)
- 118 people in residential treatment centers for juveniles (non-correctional)
- 78 people in hospitals with patients who have no usual home elsewhere
- 47 people in workers' group living quarters and job corps centers
- 26 people in correctional facilities intended for juveniles
- 10 people in local jails and other municipal confinement facilities
- 7 people in correctional residential facilities
People in group quarters in Queens County, New York in 2000:
- 11,600 people in nursing homes
- 5,877 people in other noninstitutional group quarters
- 1,105 people in homes for the mentally ill
- 1,010 people in college dormitories (includes college quarters off campus)
- 947 people in mental (psychiatric) hospitals or wards
- 865 people in homes or halfway houses for drug/alcohol abuse
- 821 people in religious group quarters
- 795 people in homes for the mentally retarded
- 615 people in state prisons
- 483 people in other group homes
- 476 people in other nonhousehold living situations
- 467 people in local jails and other confinement facilities (including police lockups)
- 428 people in job corps and vocational training facilities
- 383 people in schools, hospitals, or wards for the intellectually disabled
- 331 people in wards in general hospitals for patients who have no usual home elsewhere
- 262 people in hospitals or wards for drug/alcohol abuse
- 107 people in training schools for juvenile delinquents
- 91 people in residential treatment centers for emotionally disturbed children
- 74 people in homes for the physically handicapped
- 44 people in hospitals/wards and hospices for chronically ill
- 44 people in other hospitals or wards for chronically ill
- 38 people in unknown juvenile institutions
- 23 people in short-term care, detention or diagnostic centers for delinquent children
- 14 people in homes for abused, dependent, and neglected children
- 11 people in other workers' dormitories
- 6 people in orthopedic wards and institutions for the physically handicapped
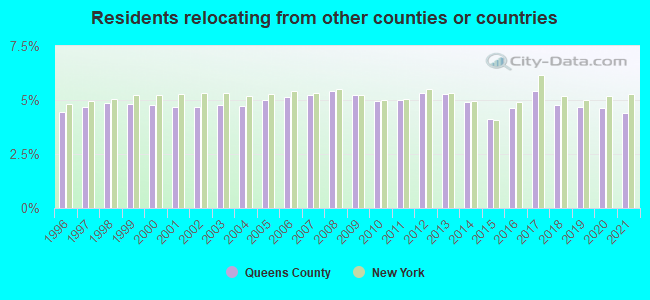
4.40% of this county's 2021 resident taxpayers lived in other counties in 2020 ($59,907 average adjusted gross income)
| Here: | 4.40% |
| New York average: | 5.29% |
0.01% of residents moved from foreign countries ($70 average AGI)
Queens County: 0.01% New York average: 0.01%
3.09% relocated from other counties in New York ($43,380 average AGI)
1.29% relocated from other states ($16,457 average AGI)
Queens County: 1.29% New York average: 1.86%
Top counties from which taxpayers relocated into this county between 2020 and 2021:
| from Kings County, NY | |
| from New York County, NY | |
| from Nassau County, NY | |
| from Bronx County, NY | |
| from Suffolk County, NY | |
| from Hudson County, NJ | |
| from Westchester County, NY |
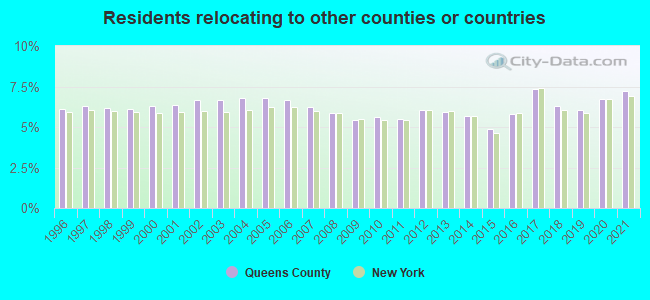
7.22% of this county's 2020 resident taxpayers moved to other counties in 2021 ($75,444 average adjusted gross income)
| Here: | 7.22% |
| New York average: | 6.93% |
0.01% of residents moved to foreign countries ($96 average AGI)
Queens County: 0.01% New York average: 0.02%
3.99% relocated to other counties in New York ($42,247 average AGI)
3.22% relocated to other states ($33,101 average AGI)
Queens County: 3.22% New York average: 3.55%
Top counties to which taxpayers relocated from this county between 2020 and 2021:
| to Nassau County, NY | |
| to Kings County, NY | |
| to New York County, NY | |
| to Suffolk County, NY | |
| to Bronx County, NY | |
| to Hudson County, NJ | |
| to Westchester County, NY |
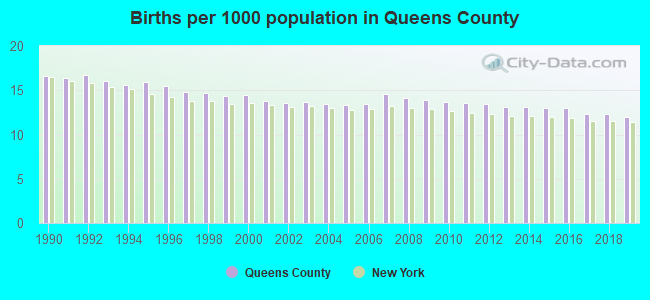
Births per 1000 population from 1990 to 1999: 15.7
Births per 1000 population from 2000 to 2009: 13.8
Births per 1000 population from 2010 to 2022: 10.8
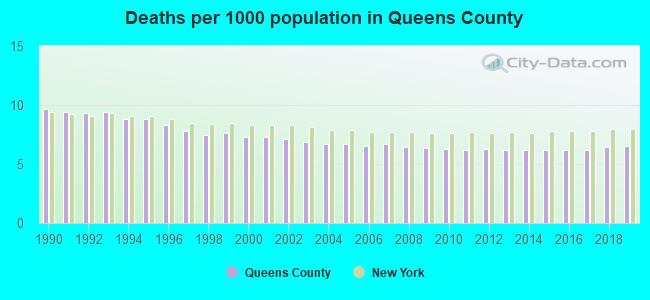
Deaths per 1000 population from 1990 to 1999: 8.7
Deaths per 1000 population from 2000 to 2009: 6.8
Deaths per 1000 population from 2010 to 2020: 6.6
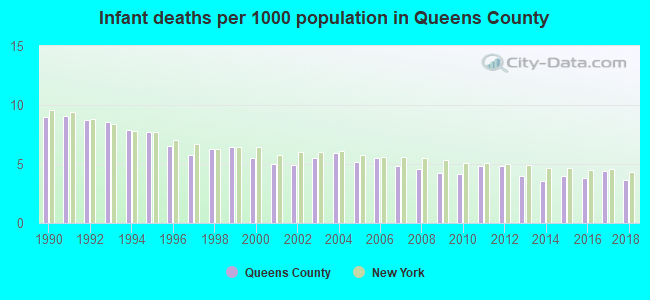
Infant deaths per 1000 live births from 1990 to 1999: 7.6
Infant deaths per 1000 live births from 2000 to 2009: 5.1
Infant deaths per 1000 live births from 2010 to 2021: 4.0
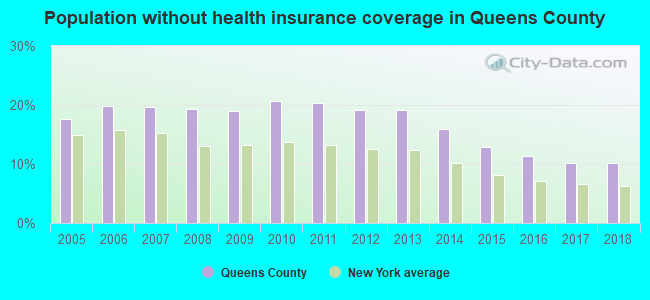
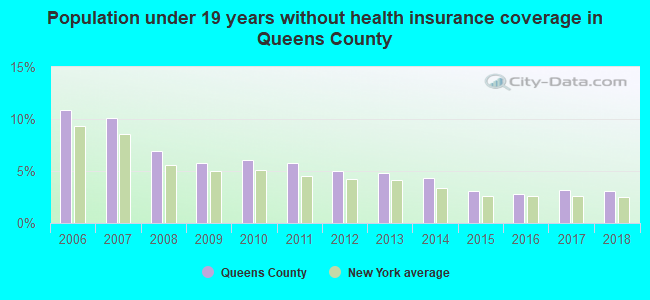
Persons under 19 years old without health insurance coverage in 2018: 3.1%
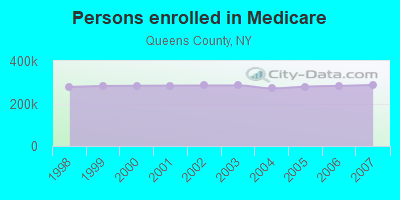
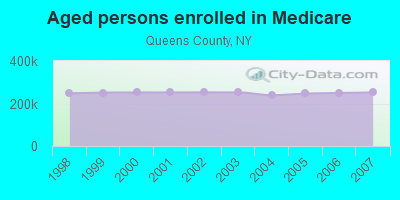
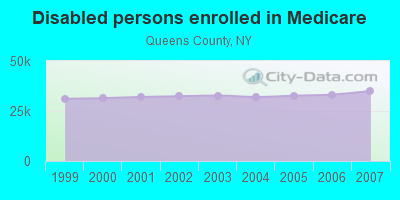
Persons enrolled in hospital insurance and/or supplemental medical insurance (Medicare) in July 1, 2007: 287,156 (252,106 aged, 35,050 disabled)
Children under 18 without health insurance coverage in 2007: 50,641 (10%)
Most common underlying causes of death in Queens County, New York in 1999 - 2019:
- Atherosclerotic heart disease (77,258)
- Bronchus or lung, unspecified - Malignant neoplasms (15,473)
- Acute myocardial infarction, unspecified (15,307)
- Atherosclerotic cardiovascular disease, so described (13,073)
- Pneumonia, unspecified (7,023)
- Colon, unspecified - Malignant neoplasms (6,531)
- Chronic obstructive pulmonary disease, unspecified (6,527)
- Breast, unspecified - Malignant neoplasms (6,132)
- Unspecified diabetes mellitus, without complications (5,663)
- Pancreas, unspecified - Malignant neoplasms (5,177)
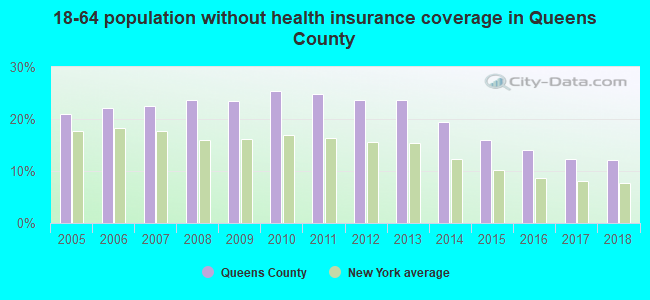
Population without health insurance coverage in 2000: 19%
Children under 18 without health insurance coverage in 2000: 13%
Short term general hospital admissions per 100,000 population in 2004: 8,703
Short term general hospital beds per 100,000 population in 2004: 220
Emergency room visits per 100,000 population in 2004: 31,669
General practice office based MDs per 100,000 population in 2005: 1,367
Medical specialist MDs per 100,000 population in 2005: 702
Dentists per 100,000 population in 1998: 10
Total births per 100,000 population, July 2005 - July 2006 : 61
Total deaths per 100,000 population, July 2005 - July 2006: 70
Limited-service eating places per 100,000 population in 2005 : 6
Beer, wine & liquor stores per 100,000 population in 2005: 1
Fitness & recreation sports centers per 100,000 population in 2005: 5,219
EPA green book nonattainment status in 2004-2006: 1
Suicides per 1,000,000 population from 2000 to 2006: 51.4. This is less than state average.
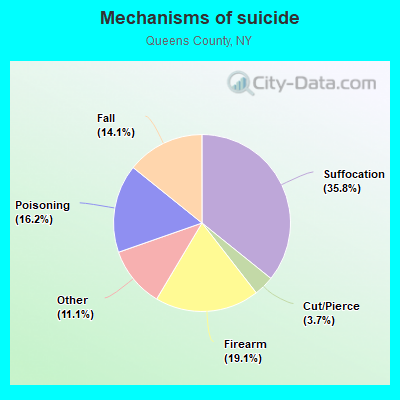
- Suffocation - 18.4
- Firearm - 9.8
- Poisoning - 8.3
- Fall - 7.3
- Cut/Pierce - 1.9
- Other - 5.7
Household type by relationship:
Households: 2,278,029- Male householders: 417,026 (94,281 living alone), Female householders: 422,827 (126,895 living alone)
363,805 spouses (358,033 opposite-sex spouses), 51,249 unmarried partners, (48,017 opposite-sex unmarried partners), 616,322 children (595,465 natural, 8,002 adopted, 12,855 stepchildren), 52,340 grandchildren, 49,743 brothers or sisters, 86,436 parents, 819 foster children, 86,346 other relatives, 98,635 non-relatives
- In group quarters: 32,481
Size of family households: 199,126 2-persons, 140,942 3-persons, 114,222 4-persons, 56,850 5-persons, 24,501 6-persons, 20,492 7-or-more-persons.
Size of nonfamily households: 221,176 1-person, 47,354 2-persons, 10,125 3-persons, 3,482 4-persons, 1,057 5-persons, 395 6-persons, 131 7-or-more-persons.
259,717 married couples with children.
104,770 single-parent households (28,567 men, 76,203 women).
43.9% of residents of Queens speak English at home.
23.6% of residents speak Spanish at home (50% speak English very well, 21% speak English well, 20% speak English not well, 8% don't speak English at all).
15.5% of residents speak other Indo-European language at home (56% speak English very well, 25% speak English well, 14% speak English not well, 4% don't speak English at all).
15.1% of residents speak Asian or Pacific Island language at home (38% speak English very well, 25% speak English well, 27% speak English not well, 11% don't speak English at all).
1.9% of residents speak other language at home (71% speak English very well, 22% speak English well, 5% speak English not well, 1% don't speak English at all).
In fiscal year 2004:
Federal Government expenditure: $0,000 ($0 per capita)
Department of Defense expenditure: $0,000
Federal direct payments to individuals for retirement and disability: $0,000
Federal other direct payments to individuals: $0,000
Federal direct payments not to individuals: $0,000
Federal grants: $0,000
Federal procurement contracts: $0,000 ($0,000 Department of Defense)
Federal salaries and wages: $0,000 ($0,000 Department of Defense)
Federal Government direct loans: $0,000
Federal guaranteed/insured loans: $0,000
Federal Government insurance: $0,000
Population change from April 1, 2000 to July 1, 2005:
Births: 162,185| Here: | 72 per 1000 residents |
| State: | 70 per 1000 residents |
Deaths: 82,308
| Here: | 37 per 1000 residents |
| State: | 42 per 1000 residents |
Net international migration: +181,176
| Here: | +81 per 1000 residents |
| State: | +35 per 1000 residents |
Net internal migration: -283,573
| Here: | |
| State: |
Total withdrawal of fresh water for public supply: 48.24 millions of gallons per day (all from ground)
| Here: | 5.4 |
| State: | 6.3 |
| Here: | 3.7 |
| State: | 3.8 |
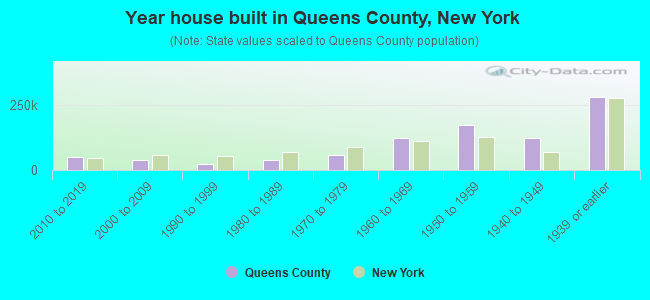
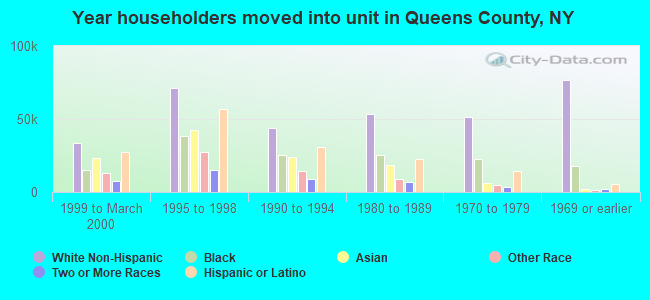
- Year house built in Queens County, New York
- 3,9962020 or later
- 50,0612010 to 2019
- 46,9452000 to 2009
- 25,7191990 to 1999
- 35,8861980 to 1989
- 53,7361970 to 1979
- 112,1091960 to 1969
- 181,5521950 to 1959
- 126,0591940 to 1949
- 275,8501939 or earlier
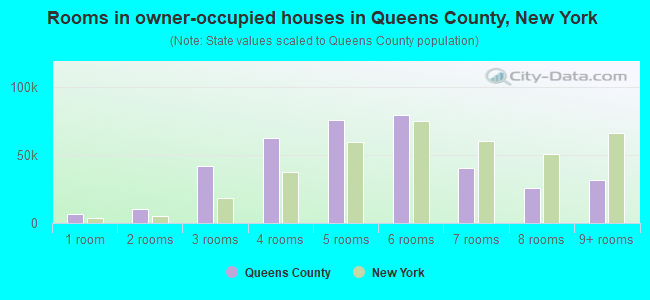
- Rooms in owner-occupied houses in Queens County, New York
- 7,0261 room
- 11,0332 rooms
- 37,1743 rooms
- 67,5914 rooms
- 74,0255 rooms
- 80,8796 rooms
- 38,6597 rooms
- 24,8548 rooms
- 33,4159+ rooms
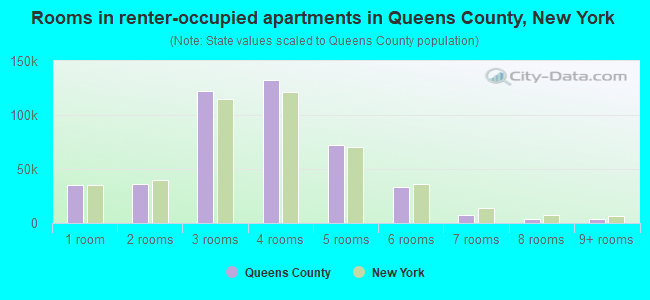
- Rooms in renter-occupied apartments in Queens County, New York
- 38,9321 room
- 37,5752 rooms
- 122,8523 rooms
- 134,3124 rooms
- 77,1345 rooms
- 38,2286 rooms
- 8,5067 rooms
- 2,8818 rooms
- 4,7779+ rooms
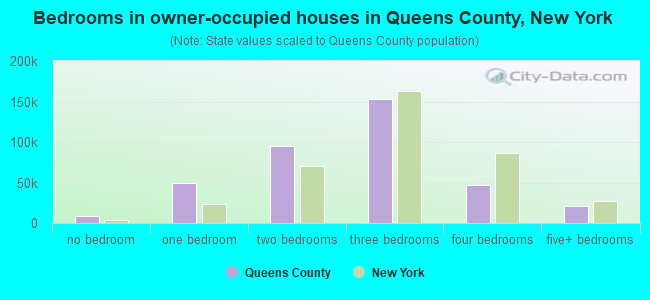
- Bedrooms in owner-occupied houses in Queens County, New York
- 9,006no bedroom
- 46,3821 bedroom
- 92,4642 bedrooms
- 156,9903 bedrooms
- 49,8424 bedrooms
- 19,9725+ bedrooms
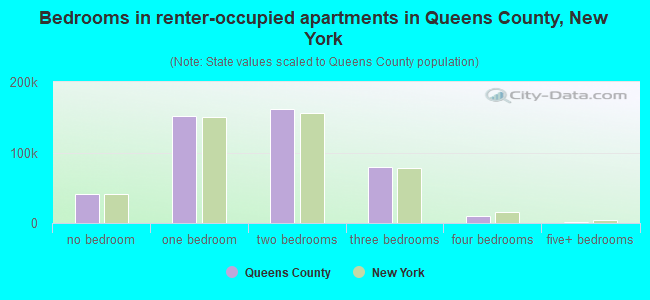
- Bedrooms in renter-occupied apartments in Queens County, New York
- 44,417no bedroom
- 159,4031 bedroom
- 159,3882 bedrooms
- 86,9683 bedrooms
- 11,9744 bedrooms
- 3,0475+ bedrooms
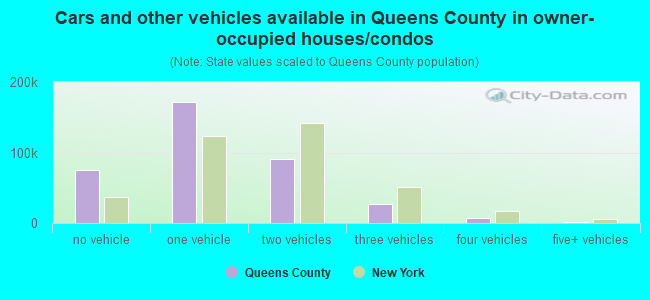
- Cars and other vehicles available in Queens County in owner-occupied houses/condos
- 70,639no vehicle
- 166,0761 vehicle
- 97,0932 vehicles
- 30,5393 vehicles
- 8,2134 vehicles
- 2,0965+ vehicles
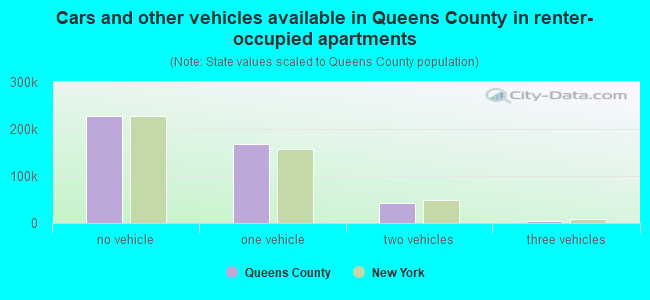
- Cars and other vehicles available in Queens County in renter-occupied apartments
- 238,758no vehicle
- 178,0421 vehicle
- 42,2212 vehicles
- 5,1353 vehicles
- 7084 vehicles
- 3335+ vehicles
91.9% of Queens County residents lived in the same house 1 years ago.
Out of people who lived in different houses, 40% lived in this county.
Out of people who lived in different counties, 47% lived in New York.
| Queens County: | 91.9% |
| State average: | 89.6% |
Place of birth for U.S.-born residents:
- This state: 1,011,017
- Other state: 134,650
- Northeast: 41,398
- Midwest: 19,656
- South: 51,856
- West: 21,740
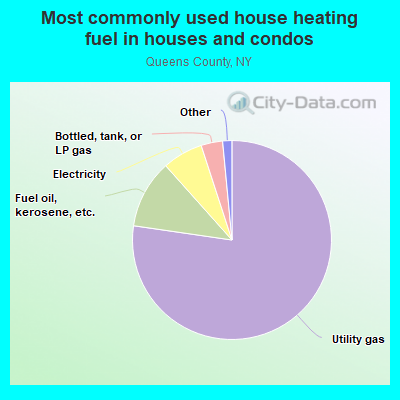
- 76.1%Utility gas
- 12.6%Fuel oil, kerosene, etc.
- 6.2%Electricity
- 3.3%Bottled, tank, or LP gas
- 0.8%Other fuel
- 0.7%No fuel used
- 0.1%Solar energy
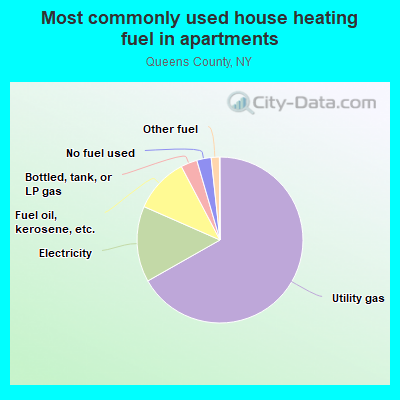
- 69.8%Utility gas
- 12.4%Electricity
- 10.9%Fuel oil, kerosene, etc.
- 3.2%Bottled, tank, or LP gas
- 2.1%No fuel used
- 1.5%Other fuel
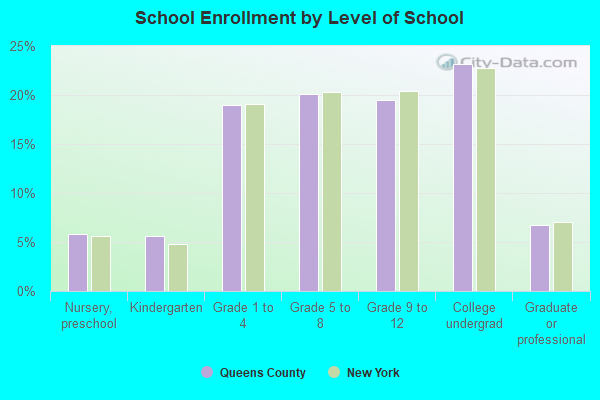
Private vs. public school enrollment:
| Here: | 11.8% |
| New York: | 15.6% |
| Here: | 12.5% |
| New York: | 15.0% |
| Here: | 25.2% |
| New York: | 39.2% |
Supplemental Security Income (SSI) in 2006:
- Total number of recipients: 72,984
- Number of aged recipients: 26,948
- Number of blind and disabled recipients: 46,036
- Number of recipients under 18: 5,668
- Number of recipients between 18 and 64: 28,315
- Number of recipients older than 64: 39,001
- Number of recipients also receiving OASDI: 21,375
- Amount of payments (thousands of dollars): 36,432
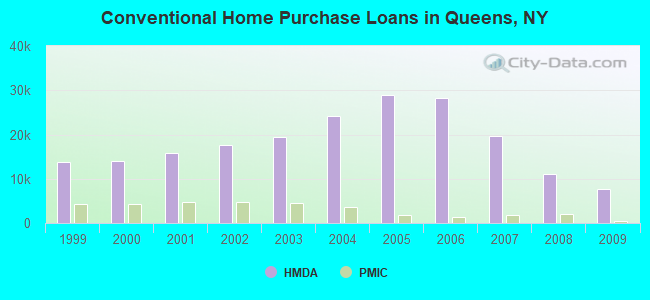
| Home Mortgage Disclosure Act Aggregated Statistics For Year 2009 (Based on 666 full tracts) | ||||||||||||||
| A) FHA, FSA/RHS & VA Home Purchase Loans | B) Conventional Home Purchase Loans | C) Refinancings | D) Home Improvement Loans | E) Loans on Dwellings For 5+ Families | F) Non-occupant Loans on < 5 Family Dwellings (A B C & D) | G) Loans On Manufactured Home Dwelling (A B C & D) | ||||||||
|---|---|---|---|---|---|---|---|---|---|---|---|---|---|---|
| Number | Average Value | Number | Average Value | Number | Average Value | Number | Average Value | Number | Average Value | Number | Average Value | Number | Average Value | |
| LOANS ORIGINATED | 1,636 | $390,675 | 7,722 | $282,800 | 9,041 | $274,601 | 579 | $156,193 | 284 | $1,273,754 | 773 | $340,325 | 21 | $343,143 |
| APPLICATIONS APPROVED, NOT ACCEPTED | 183 | $376,743 | 1,080 | $314,462 | 1,697 | $299,335 | 215 | $82,330 | 16 | $1,217,438 | 137 | $322,328 | 3 | $244,333 |
| APPLICATIONS DENIED | 858 | $415,867 | 2,595 | $302,749 | 7,447 | $322,342 | 1,219 | $80,596 | 61 | $1,358,230 | 792 | $272,684 | 14 | $192,286 |
| APPLICATIONS WITHDRAWN | 619 | $394,868 | 1,105 | $310,261 | 3,548 | $321,636 | 222 | $208,865 | 72 | $1,352,542 | 258 | $304,895 | 3 | $311,333 |
| FILES CLOSED FOR INCOMPLETENESS | 171 | $412,193 | 531 | $296,066 | 1,505 | $315,270 | 109 | $194,835 | 7 | $5,596,429 | 102 | $301,735 | 2 | $17,500 |
| Private Mortgage Insurance Companies Aggregated Statistics For Year 2009 (Based on 404 full tracts) | ||||||||
| A) Conventional Home Purchase Loans | B) Refinancings | C) Non-occupant Loans on < 5 Family Dwellings (A & B) | D) Loans On Manufactured Home Dwelling (A & B) | |||||
|---|---|---|---|---|---|---|---|---|
| Number | Average Value | Number | Average Value | Number | Average Value | Number | Average Value | |
| LOANS ORIGINATED | 484 | $289,550 | 85 | $326,376 | 1 | $163,000 | 0 | $0 |
| APPLICATIONS APPROVED, NOT ACCEPTED | 375 | $363,003 | 69 | $332,043 | 2 | $334,500 | 1 | $129,000 |
| APPLICATIONS DENIED | 238 | $319,727 | 75 | $339,000 | 2 | $230,500 | 0 | $0 |
| APPLICATIONS WITHDRAWN | 119 | $318,613 | 28 | $315,607 | 0 | $0 | 0 | $0 |
| FILES CLOSED FOR INCOMPLETENESS | 39 | $359,538 | 6 | $433,667 | 2 | $346,500 | 0 | $0 |
Queens County on our top lists:
- #3 on the list of "Top 101 counties with the most Orthodox adherents"
- #3 on the list of "Top 101 counties with the most Orthodox adherents (pop. 50,000+)"
- #4 on the list of "Top 101 counties with the most Orthodox congregations"
- #4 on the list of "Top 101 counties with the most Orthodox congregations (pop. 50,000+)"
- #7 on the list of "Top 101 counties with the lowest percentage of residents that keep firearms around their homes"
- #8 on the list of "Top 101 counties with the most Catholic adherents (pop. 50,000+)"
- #8 on the list of "Top 101 counties with the most Catholic adherents"
- #8 on the list of "Top 101 counties with the most Other adherents"
- #8 on the list of "Top 101 counties with the most Other adherents (pop. 50,000+)"
- #9 on the list of "Top 101 counties with the highest Nitrogen Dioxide air pollution readings in 2012 (ppm)"
- #12 on the list of "Top 101 counties with the most Other congregations (pop. 50,000+)"
- #12 on the list of "Top 101 counties with the most Other congregations"
- #16 on the list of "Top 101 counties with highest percentage of residents voting for Obama (Democrat) in the 2012 Presidential Election (pop. 50,000+)"
- #18 on the list of "Top 101 counties with the most Catholic congregations (pop. 50,000+)"
- #18 on the list of "Top 101 counties with the most Black Protestant adherents (pop. 50,000+)"
- #18 on the list of "Top 101 counties with the most Black Protestant adherents"
- #19 on the list of "Top 101 counties with the most Evangelical Protestant congregations (pop. 50,000+)"
- #19 on the list of "Top 101 counties with the most Evangelical Protestant congregations"
- #19 on the list of "Top 101 counties with the most Catholic congregations"
- #20 on the list of "Top 101 counties with the most Mainline Protestant congregations (pop. 50,000+)"