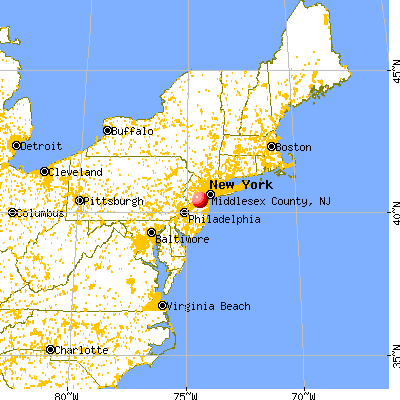
Middlesex County, New Jersey (NJ)
County owner-occupied free and clear houses and condos in 2010: 50,607
County owner-occupied houses and condos in 2000: 177,377
Renter-occupied apartments: 94,039 (it was 88,438 in 2000)
| % of renters here: | 33% |
| State: | 35% |
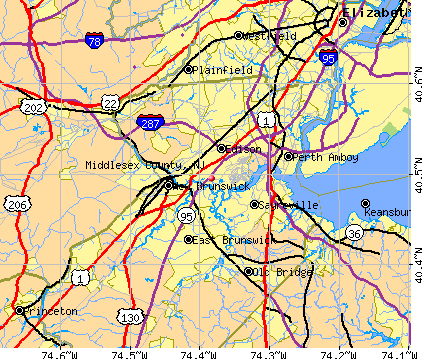
Land area: 310 sq. mi.
Water area: 12.8 sq. mi.
Population density: 2781 people per square mile (very high).
Industries providing employment: Educational, health and social services (23.5%), Professional, scientific, management, administrative, and waste management services (16.1%), Retail trade (10.6%), Manufacturing (10.4%).
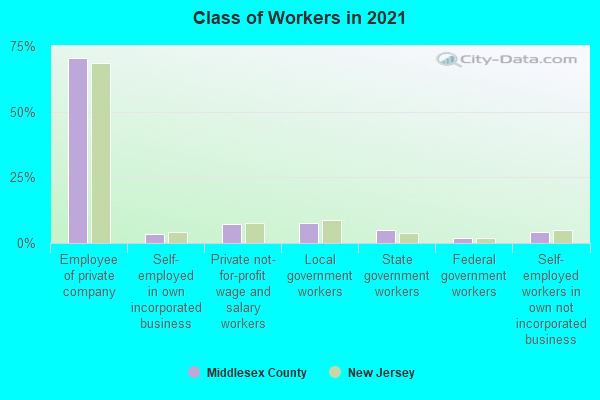
Type of workers:
- Private wage or salary: 81%
- Government: 15%
- Self-employed, not incorporated: 4%
- Unpaid family work: 0%
- OSM Map
- General Map
- Google Map
- MSN Map

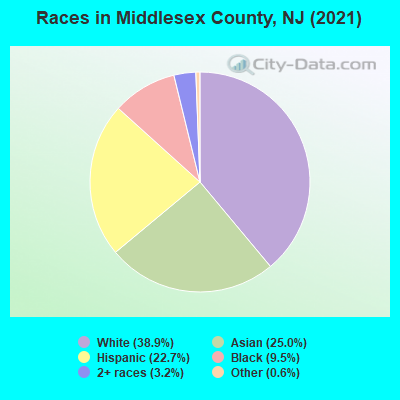
- 330,18738.3%White Non-Hispanic Alone
- 221,29325.7%Asian alone
- 199,63223.2%Hispanic or Latino
- 85,6179.9%Black Non-Hispanic Alone
- 20,1492.3%Two or more races
- 3,6790.4%Some other race alone
- 5860.07%American Indian and Alaska Native alone
- 2750.03%Native Hawaiian and Other
Pacific Islander alone
| Median resident age: | 39.5 years |
| New Jersey median age: | 40.4 years |
| Males: 429,006 | |
| Females: 432,412 |


| Middlesex County: | 2.0 people |
| New Jersey: | 3 people |
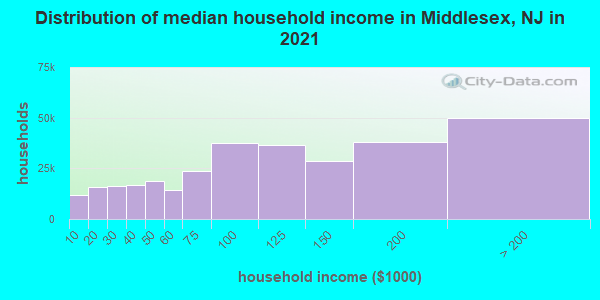
Estimated median household income in 2022: $102,400 ($61,446 in 1999)
| This county: | $102,400 |
| New Jersey: | $96,346 |
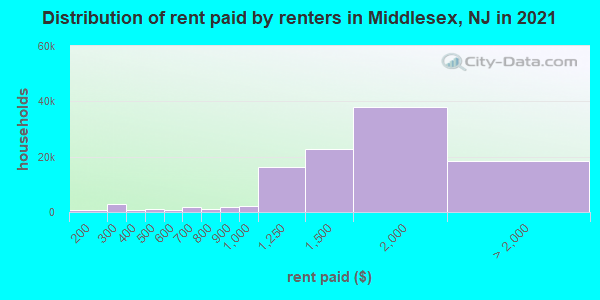
Median contract rent in 2022 for apartments: $1,549 (lower quartile is $1,180, upper quartile is $1,889)
| This county: | $1549 |
| State: | $1399 |
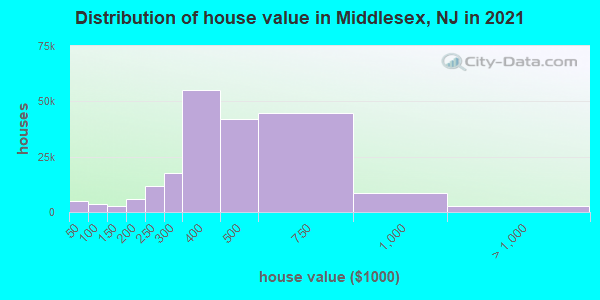
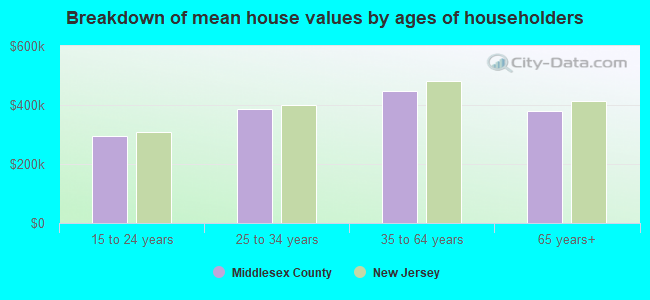
Estimated median house or condo value in 2022: $440,000 (it was $164,400 in 2000)
| Middlesex: | $440,000 |
| New Jersey: | $428,900 |
Mean price in 2022:
Median monthly housing costs for homes and condos with a mortgage: $2,628Detached houses: $489,297
Here: $489,297 State: $537,591 Townhouses or other attached units: $387,943
Here: $387,943 State: $381,113 In 2-unit structures: $281,108
Here: $281,108 State: $444,476 In 3-to-4-unit structures: $341,963
Here: $341,963 State: $457,463 In 5-or-more-unit structures: $260,268
Here: $260,268 State: $368,745 Mobile homes: $71,279
Here: $71,279 State: $119,788
Median monthly housing costs for units without a mortgage: $1,118
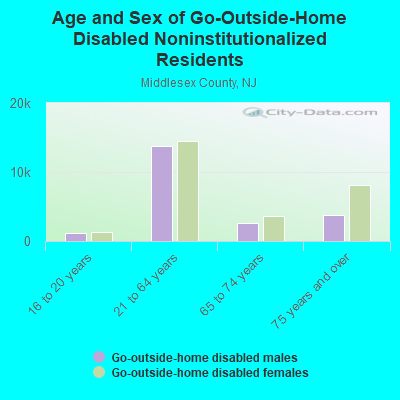
Institutionalized population: 8,024
Crime in 2020 (reported by the sheriff's office or county police, not the county total):
- Murders: 0
- Rapes: 0
- Robberies: 0
- Assaults: 0
- Burglaries: 0
- Thefts: 0
- Auto thefts: 0
Crime in 2019 (reported by the sheriff's office or county police, not the county total):
- Murders: 0
- Rapes: 0
- Robberies: 0
- Assaults: 0
- Burglaries: 0
- Thefts: 0
- Auto thefts: 0
Health of residents in Middlesex County based on CDC Behavioral Risk Factor Surveillance System Survey Questionnaires from 2003 to 2012:
General health status score of residents in this county from 1 (poor) to 5 (excellent) is 3.5. This is about average.72.4% of residents exercised in the past month. This is about average.
41.9% of residents smoked 100+ cigarettes in their lives. This is about average.
72.4% of adult residents drank alcohol in the past 30 days. This is about average.
73.9% of residents visited a dentist within the past year. This is about average.
Average weight of males is 191 pounds. This is about average.
Average weight of females is 160 pounds. This is about average.
9.3% of residents keep firearms around their homes. This is less than average.
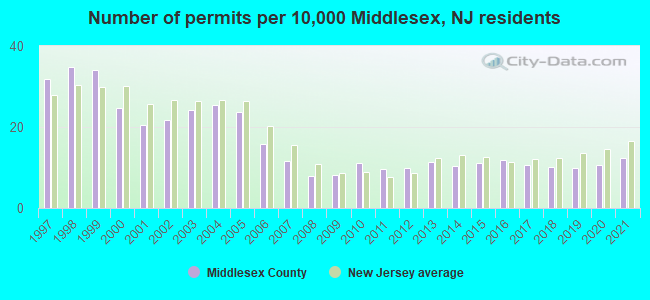
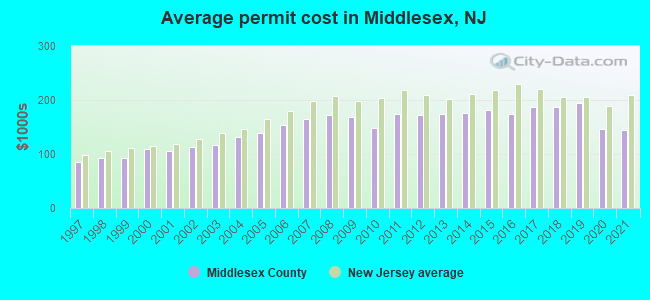
Single-family new house construction building permits:
- 2022: 769 buildings, average cost: $217,800
- 2021: 922 buildings, average cost: $144,500
- 2020: 789 buildings, average cost: $145,600
- 2019: 749 buildings, average cost: $195,100
- 2018: 767 buildings, average cost: $187,400
- 2017: 799 buildings, average cost: $187,300
- 2016: 886 buildings, average cost: $175,200
- 2015: 839 buildings, average cost: $181,600
- 2014: 783 buildings, average cost: $175,800
- 2013: 852 buildings, average cost: $174,100
- 2012: 738 buildings, average cost: $171,700
- 2011: 724 buildings, average cost: $174,400
- 2010: 836 buildings, average cost: $147,800
- 2009: 603 buildings, average cost: $168,500
- 2008: 589 buildings, average cost: $172,100
- 2007: 878 buildings, average cost: $165,000
- 2006: 1177 buildings, average cost: $153,100
- 2005: 1774 buildings, average cost: $137,500
- 2004: 1899 buildings, average cost: $131,400
- 2003: 1808 buildings, average cost: $116,100
- 2002: 1623 buildings, average cost: $112,700
- 2001: 1533 buildings, average cost: $105,300
- 2000: 1850 buildings, average cost: $108,900
- 1999: 2562 buildings, average cost: $93,000
- 1998: 2608 buildings, average cost: $92,100
- 1997: 2392 buildings, average cost: $86,100
Median real estate property taxes paid for housing units with mortgages in 2022: $9,425 (2.0%)
Median real estate property taxes paid for housing units with no mortgage in 2022: $8,823 (2.2%)
| Middlesex County: | 8.4% |
| New Jersey: | 9.7% |
Median age of residents in 2022: 39.5 years old
(Males: 39.1 years old, Females: 40.1 years old)
(Median age for: White residents: 49.0 years old, Black residents: 36.6 years old, American Indian residents: 31.7 years old, Asian residents: 38.2 years old, Hispanic or Latino residents: 31.7 years old, Other race residents: 33.5 years old)
Area name: Middlesex-Somerset-Hunterdon, NJ HUD Metro FMR Area
Fair market rent in 2006 for a 1-bedroom apartment in Middlesex County is $1009 a month.
Fair market rent for a 2-bedroom apartment is $1187 a month.
Fair market rent for a 3-bedroom apartment is $1490 a month.
Cities in this county include: Edison, New Brunswick, Perth Amboy, East Brunswick, Sayreville, North Brunswick Township, Old Bridge, South Plainfield, Carteret, Woodbridge.
2023 air pollution in Middlesex County:
Nitrogen Dioxide: 0.01 ppm (standard limit: 0.053 ppm). Above U.S. average.
Ozone (1-hour): 0.031 ppm (standard limit: 0.12 ppm). Near U.S. average.
Particulate Matter (PM2.5) Annual: 10.3 µg/m3(standard limit: 15.0 µg/m3). Near U.S. average.
Notable locations in this county outside city limits:
Notable location: Camp Wilson (A). Display/hide its location on the map
Creek: Tinicum Creek (A). Display/hide its location on the map
Neighboring counties: Hunterdon County  , Clinton County, Indiana , Franklin County, Ohio , Plumas County, California , Ohio County, West Virginia , Queens County, New York
  , Livingston County, Illinois , Peoria County, Illinois .
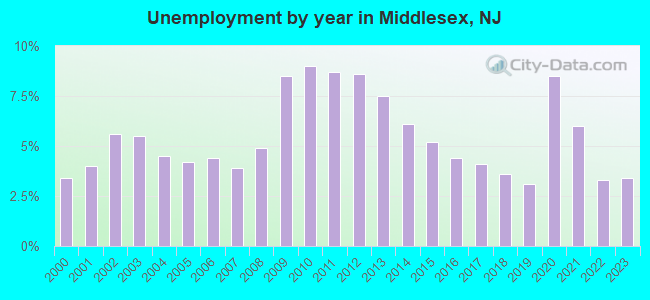
| Here: | 4.1% |
| New Jersey: | 4.5% |
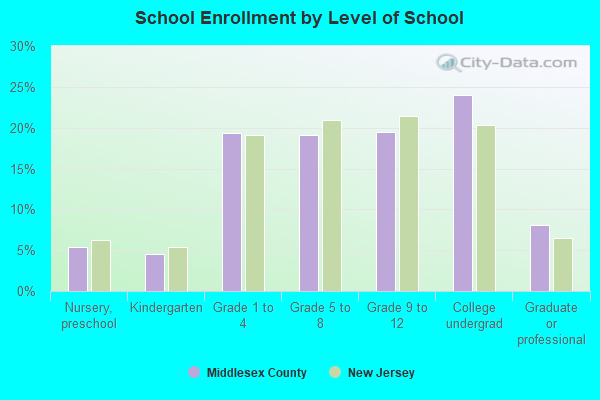
Current college students: 54,877
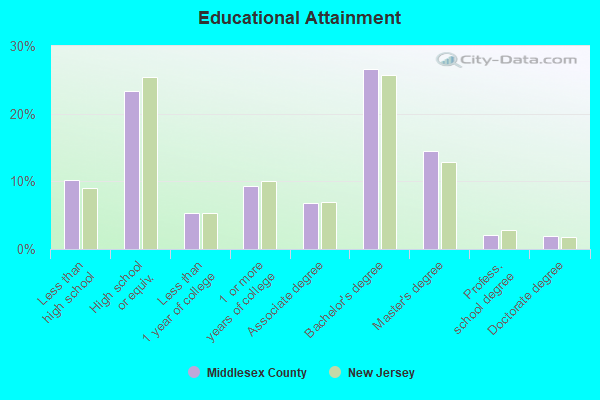
People 25 years of age or older with a high school degree or higher: 89.4%
People 25 years of age or older with a bachelor's degree or higher: 45.0%
Number of foreign born residents: 306,479 (60.8% naturalized citizens)
| Middlesex County: | 35.6% |
| Whole state: | 23.5% |
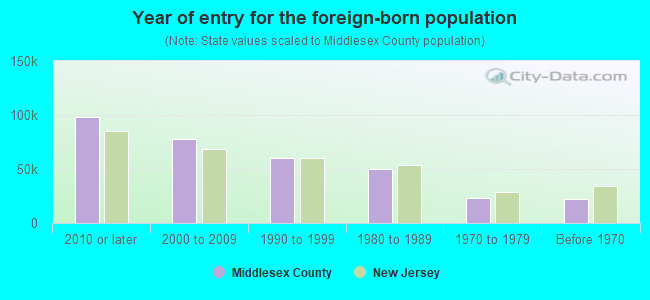
- Year of entry for the foreign-born population
- 97,8442010 or later
- 83,7782000 to 2009
- 60,9081990 to 1999
- 49,9251980 to 1989
- 22,9291970 to 1979
- 21,918Before 1970
Mean travel time to work (commute): minutes
Percentage of county residents living and working in this county: 92.0%
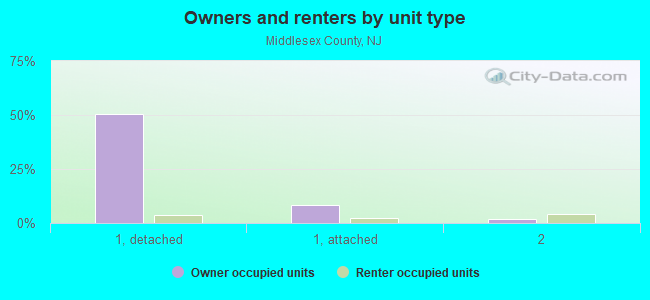
Housing units in structures:
- One, detached: 168,005
- One, attached: 35,934
- Two: 18,580
- 3 or 4: 15,596
- 5 to 9: 18,627
- 10 to 19: 28,378
- 20 to 49: 9,921
- 50 or more: 18,922
- Mobile homes: 3,240
- Boats, RVs, vans, etc.: 74
Housing units in Middlesex County with a mortgage: 124,691 (13,828 second mortgage, 608 home equity loan, 11,790 both second mortgage and home equity loan)
Houses without a mortgage: 5,974
| Here: | 96.1% with mortgage |
| State: | 95.9% with mortgage |
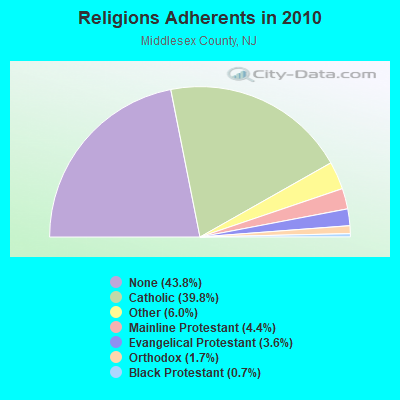
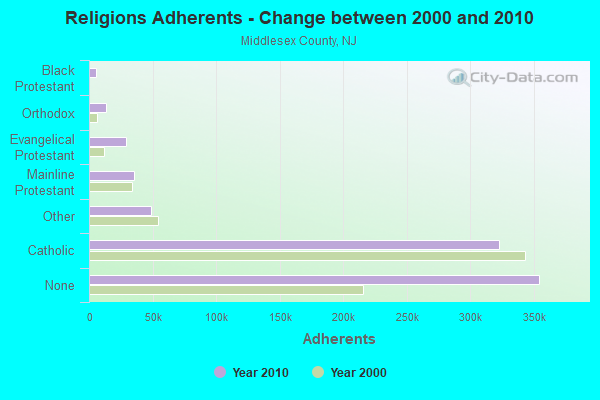
Religion statistics for Middlesex County
| Religion | Adherents | Congregations |
|---|---|---|
| Catholic | 322,340 | 74 |
| Other | 48,717 | 73 |
| Mainline Protestant | 35,693 | 113 |
| Evangelical Protestant | 29,296 | 130 |
| Orthodox | 13,491 | 14 |
| Black Protestant | 5,879 | 17 |
| None | 354,442 | - |
Source: Clifford Grammich, Kirk Hadaway, Richard Houseal, Dale E.Jones, Alexei Krindatch, Richie Stanley and Richard H.Taylor. 2012. 2010 U.S.Religion Census: Religious Congregations & Membership Study. Association of Statisticians of American Religious Bodies. Jones, Dale E., et al. 2002. Congregations and Membership in the United States 2000. Nashville, TN: Glenmary Research Center.
Food Environment Statistics:
| Middlesex County: | 2.82 / 10,000 pop. |
| State: | 2.90 / 10,000 pop. |
| Here: | 0.05 / 10,000 pop. |
| New Jersey: | 0.06 / 10,000 pop. |
| This county: | 2.20 / 10,000 pop. |
| New Jersey: | 1.76 / 10,000 pop. |
| Middlesex County: | 0.88 / 10,000 pop. |
| New Jersey: | 0.81 / 10,000 pop. |
| This county: | 6.09 / 10,000 pop. |
| State: | 7.15 / 10,000 pop. |
| Middlesex County: | 7.6% |
| New Jersey: | 8.3% |
| Middlesex County: | 23.8% |
| State: | 23.3% |
| Here: | 18.2% |
| State: | 18.0% |
Agriculture in Middlesex County:
Average size of farms: 79 acresAverage value of agricultural products sold per farm: $82,555
Average value of crops sold per acre for harvested cropland: $1408.66
The value of nursery, greenhouse, floriculture, and sod as a percentage of the total market value of agricultural products sold: 66.39%
The value of livestock, poultry, and their products as a percentage of the total market value of agricultural products sold: 6.20%
Average total farm production expenses per farm: $64,275
Harvested cropland as a percentage of land in farms: 69.27%
Irrigated harvested cropland as a percentage of land in farms: 18.43%
Average market value of all machinery and equipment per farm: $87,190
The percentage of farms operated by a family or individual: 80.00%
Average age of principal farm operators: 57 years
Average number of cattle and calves per 100 acres of all land in farms: 1.35
Corn for grain: 3855 harvested acres
All wheat for grain: 758 harvested acres
Soybeans for beans: 6370 harvested acres
Vegetables: 2,089 harvested acres
Earthquake activity:
Middlesex County-area historical earthquake activity is significantly above New Jersey state average. It is 68% smaller than the overall U.S. average.On 8/23/2011 at 17:51:04, a magnitude 5.8 (5.8 MW, Depth: 3.7 mi, Class: Moderate, Intensity: VI - VII) earthquake occurred 261.1 miles away from Middlesex County center
On 1/16/1994 at 01:49:16, a magnitude 4.6 (4.6 MB, 4.6 LG, Depth: 3.1 mi, Class: Light, Intensity: IV - V) earthquake occurred 87.8 miles away from the county center
On 10/7/1983 at 10:18:46, a magnitude 5.3 (5.1 MB, 5.3 LG, 5.1 ML) earthquake occurred 239.3 miles away from the county center
On 4/20/2002 at 10:50:47, a magnitude 5.3 (5.3 ML, Depth: 3.0 mi) earthquake occurred 280.1 miles away from the county center
On 4/20/2002 at 10:50:47, a magnitude 5.2 (5.2 MB, 4.2 MS, 5.2 MW, 5.0 MW) earthquake occurred 278.3 miles away from Middlesex County center
On 1/16/1994 at 00:42:43, a magnitude 4.2 (4.2 MB, 4.0 LG, Depth: 3.1 mi) earthquake occurred 86.3 miles away from the county center
Magnitude types: regional Lg-wave magnitude (LG), body-wave magnitude (MB), local magnitude (ML), surface-wave magnitude (MS), moment magnitude (MW)
Most recent natural disasters:
- New Jersey Covid-19 Pandemic, Incident Period: January 20, 2020, Major Disaster (Presidential) Declared DR-4488-NJ: March 25, 2020, FEMA Id: 4488, Natural disaster type: Other
- New Jersey Severe Winter Storm and Snowstorm, Incident Period: January 22, 2016 to January 24, 2016, Major Disaster (Presidential) Declared DR-4264: March 14, 2016, FEMA Id: 4264, Natural disaster type: Snowstorm, Winter Storm
- New Jersey Hurricane Sandy, Incident Period: October 26, 2012 to November 08, 2012, Emergency Declared EM-3354: October 28, 2012, FEMA Id: 3354, Natural disaster type: Hurricane
- New Jersey Hurricane Sandy, Incident Period: October 26, 2012 to November 08, 2012, Major Disaster (Presidential) Declared DR-4086: October 30, 2012, FEMA Id: 4086, Natural disaster type: Hurricane
- New Jersey Severe Storm, Incident Period: October 29, 2011, Major Disaster (Presidential) Declared DR-4048: November 30, 2011, FEMA Id: 4048, Natural disaster type: Storm
- New Jersey Hurricane Irene, Incident Period: August 27, 2011 to September 05, 2011, Major Disaster (Presidential) Declared DR-4021: August 31, 2011, FEMA Id: 4021, Natural disaster type: Hurricane
- New Jersey Hurricane Irene, Incident Period: August 26, 2011 to September 05, 2011, Emergency Declared EM-3332: August 27, 2011, FEMA Id: 3332, Natural disaster type: Hurricane
- New Jersey Severe Winter Storm and Snowstorm, Incident Period: December 26, 2010 to December 27, 2010, Major Disaster (Presidential) Declared DR-1954: February 04, 2011, FEMA Id: 1954, Natural disaster type: Snowstorm, Winter Storm
- New Jersey Severe Storms and Flooding, Incident Period: March 12, 2010 to April 15, 2010, Major Disaster (Presidential) Declared DR-1897: April 02, 2010, FEMA Id: 1897, Natural disaster type: Storm, Flood
- New Jersey Severe Storms and Inland and Coastal Flooding, Incident Period: April 14, 2007 to April 20, 2007, Major Disaster (Presidential) Declared DR-1694: April 26, 2007, FEMA Id: 1694, Natural disaster type: Storm, Flood
- 16 other natural disasters have been reported since 1953.
The number of natural disasters in Middlesex County (26) is a lot greater than the US average (15).
Major Disasters (Presidential) Declared: 17
Emergencies Declared: 9
Causes of natural disasters: Floods: 7, Hurricanes: 7, Storms: 6, Heavy Rains: 4, Snowstorms: 3, Blizzards: 2, Water Shortages: 2, Winter Storms: 2, Tornado: 1, Wind: 1, Other: 3 (Note: some incidents may be assigned to more than one category).
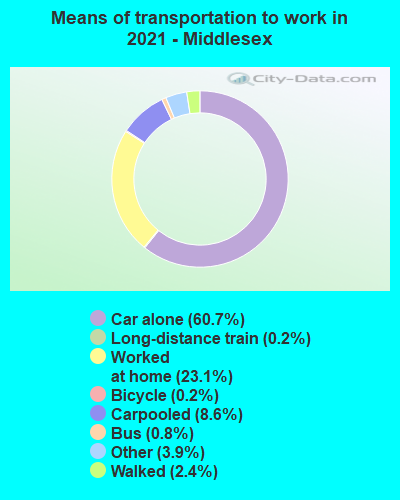
Means of transportation to work:
- Drove a car alone: 287,590 (64.4%)
- Carpooled: 44,458 (10.0%)
- Bus: 2,028 (0.5%)
- Subway or elevated rail: 1,059 (0.2%)
- Long-distance train or commuter rail: 685 (0.2%)
- Taxicab, motorcycle, or other means: 17,702 (4.0%)
- Bicycle: 1,139 (0.3%)
- Walked: 17,371 (3.9%)
- Worked at home: 74,251 (16.6%)
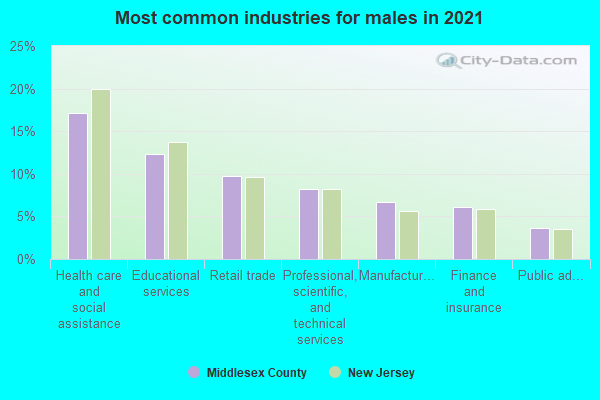
- Health care and social assistance (17%)
- Educational services (13%)
- Retail trade (9%)
- Professional, scientific, and technical services (8%)
- Manufacturing (7%)
- Finance and insurance (5%)
- Transportation and warehousing (4%)

- Health care and social assistance (20%)
- Educational services (15%)
- Retail trade (11%)
- Professional, scientific, and technical services (10%)
- Manufacturing (8%)
- Finance and insurance (6%)
- Transportation and warehousing (5%)
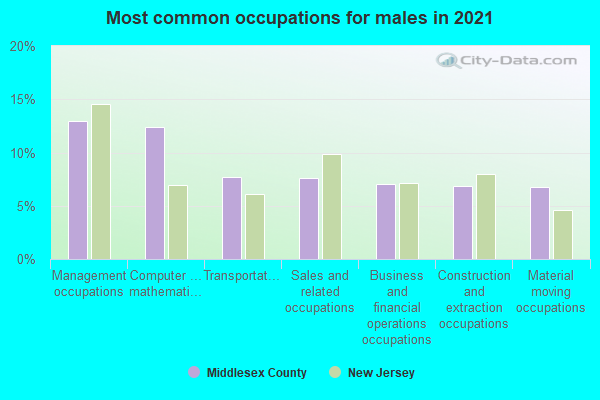
- Management occupations (13%)
- Computer and mathematical occupations (12%)
- Business and financial operations occupations (7%)
- Office and administrative support occupations (7%)
- Sales and related occupations (7%)
- Transportation occupations (6%)
- Production occupations (6%)
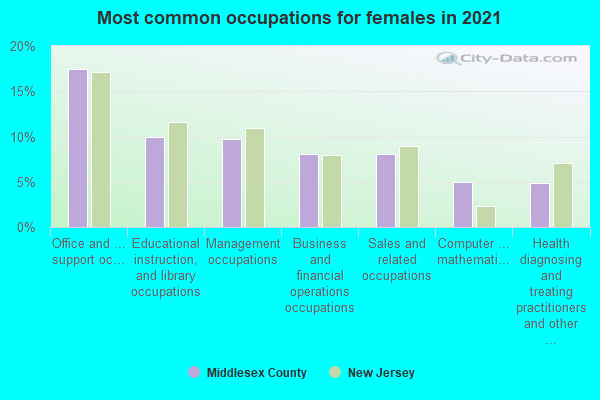
- Office and administrative support occupations (19%)
- Educational instruction, and library occupations (11%)
- Management occupations (10%)
- Business and financial operations occupations (8%)
- Sales and related occupations (7%)
- Health diagnosing and treating practitioners and other technical occupations (6%)
- Material moving occupations (5%)
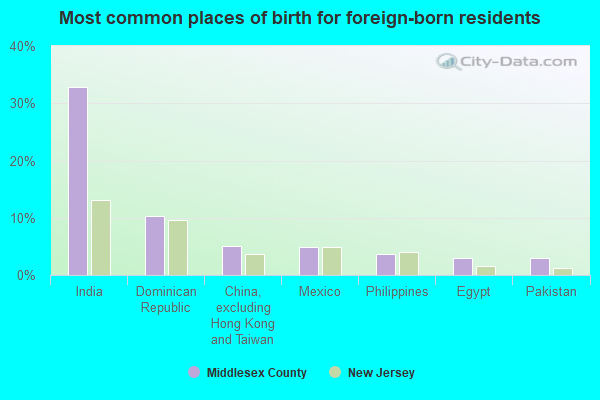
- India (32%)
- Dominican Republic (11%)
- Mexico (5%)
- China, excluding Hong Kong and Taiwan (5%)
- Philippines (4%)
- Pakistan (2%)
- Egypt (2%)
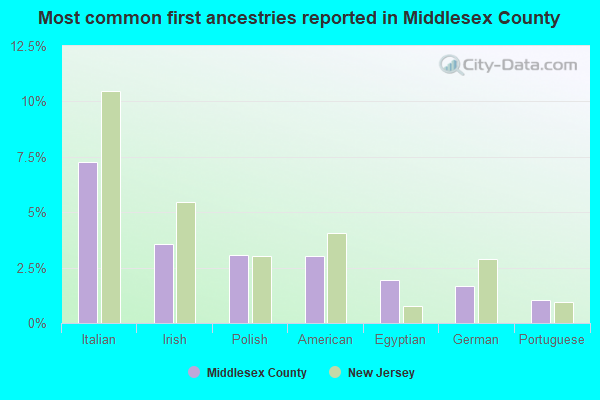
- Italian (7%)
- Polish (3%)
- Irish (3%)
- American (3%)
- Egyptian (2%)
- German (2%)
- Portuguese (1%)
People in group quarters in Middlesex County, New Jersey in 2010:
- 13,766 people in college/university student housing
- 3,665 people in nursing facilities/skilled-nursing facilities
- 2,957 people in state prisons
- 989 people in local jails and other municipal confinement facilities
- 774 people in workers' group living quarters and job corps centers
- 399 people in other noninstitutional facilities
- 385 people in group homes intended for adults
- 365 people in emergency and transitional shelters (with sleeping facilities) for people experiencing homelessness
- 283 people in correctional facilities intended for juveniles
- 122 people in residential treatment centers for adults
- 45 people in group homes for juveniles (non-correctional)
- 38 people in residential treatment centers for juveniles (non-correctional)
- 26 people in mental (psychiatric) hospitals and psychiatric units in other hospitals
- 19 people in correctional residential facilities
- 2 people in in-patient hospice facilities
People in group quarters in Middlesex County, New Jersey in 2000:
- 9,390 people in college dormitories (includes college quarters off campus)
- 3,370 people in nursing homes
- 2,640 people in state prisons
- 994 people in other noninstitutional group quarters
- 926 people in other types of correctional institutions
- 790 people in other group homes
- 599 people in other nonhousehold living situations
- 538 people in job corps and vocational training facilities
- 532 people in training schools for juvenile delinquents
- 263 people in homes or halfway houses for drug/alcohol abuse
- 230 people in religious group quarters
- 209 people in homes for the mentally retarded
- 147 people in unknown juvenile institutions
- 77 people in homes for the mentally ill
- 42 people in homes for the physically handicapped
- 30 people in residential treatment centers for emotionally disturbed children
- 22 people in orthopedic wards and institutions for the physically handicapped
- 19 people in halfway houses
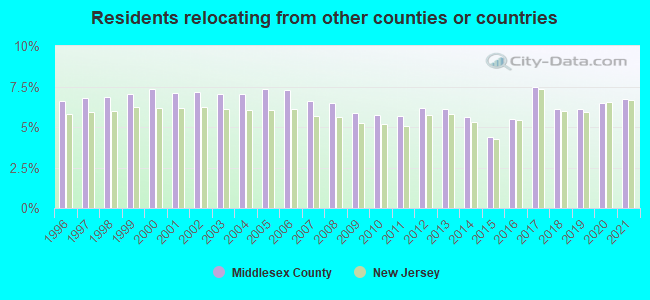
6.75% of this county's 2021 resident taxpayers lived in other counties in 2020 ($80,605 average adjusted gross income)
| Here: | 6.75% |
| New Jersey average: | 6.70% |
0.01% of residents moved from foreign countries ($55 average AGI)
Middlesex County: 0.01% New Jersey average: 0.01%
3.94% relocated from other counties in New Jersey ($44,775 average AGI)
2.79% relocated from other states ($35,775 average AGI)
Middlesex County: 2.79% New Jersey average: 2.98%
Top counties from which taxpayers relocated into this county between 2020 and 2021:
| from Union County, NJ | |
| from Hudson County, NJ | |
| from Somerset County, NJ | |
| from Monmouth County, NJ | |
| from Essex County, NJ | |
| from Kings County, NY | |
| from Mercer County, NJ |
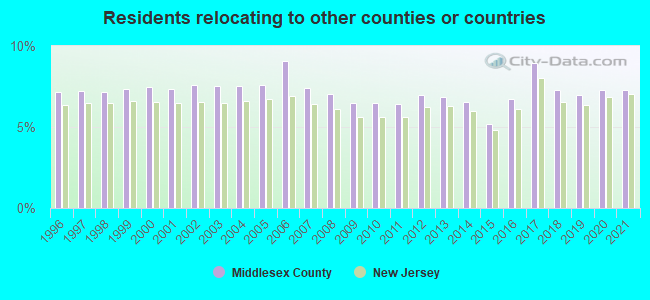
7.27% of this county's 2020 resident taxpayers moved to other counties in 2021 ($94,247 average adjusted gross income)
| Here: | 7.27% |
| New Jersey average: | 7.02% |
0.02% of residents moved to foreign countries ($103 average AGI)
Middlesex County: 0.02% New Jersey average: 0.02%
4.01% relocated to other counties in New Jersey ($49,316 average AGI)
3.25% relocated to other states ($44,828 average AGI)
Middlesex County: 3.25% New Jersey average: 3.32%
Top counties to which taxpayers relocated from this county between 2020 and 2021:
| to Somerset County, NJ | |
| to Monmouth County, NJ | |
| to Mercer County, NJ | |
| to Union County, NJ | |
| to Ocean County, NJ | |
| to Hudson County, NJ | |
| to Essex County, NJ |
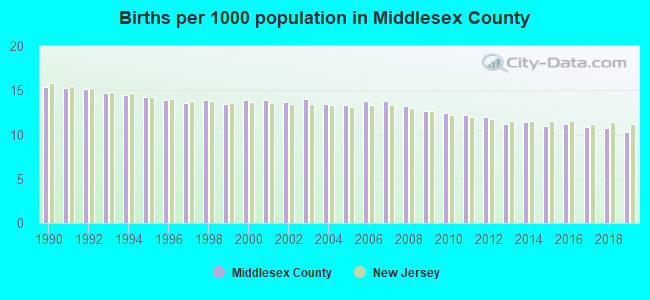
Births per 1000 population from 1990 to 1999: 14.4
Births per 1000 population from 2000 to 2009: 13.6
Births per 1000 population from 2010 to 2022: 9.5
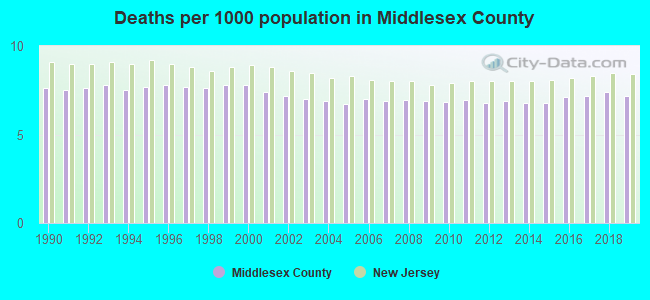
Deaths per 1000 population from 1990 to 1999: 7.7
Deaths per 1000 population from 2000 to 2009: 7.1
Deaths per 1000 population from 2010 to 2020: 7.2
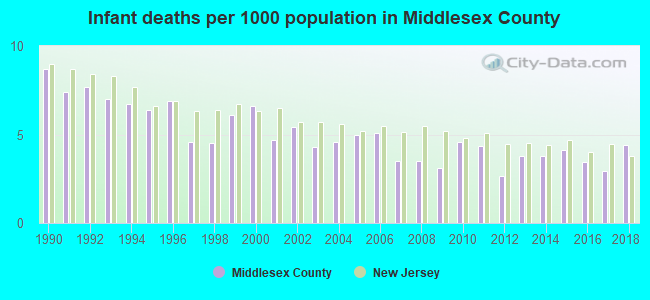
Infant deaths per 1000 live births from 1990 to 1999: 6.6
Infant deaths per 1000 live births from 2000 to 2009: 4.6
Infant deaths per 1000 live births from 2010 to 2021: 3.8
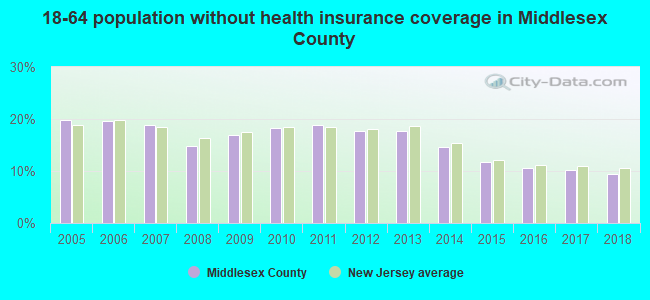
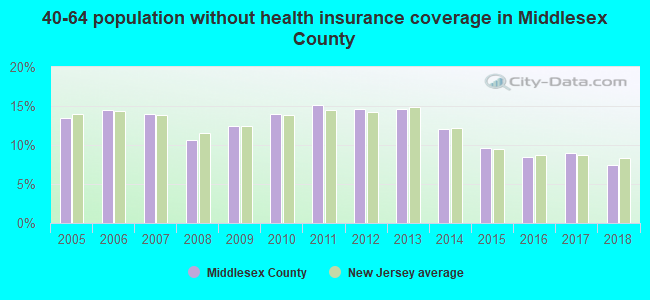
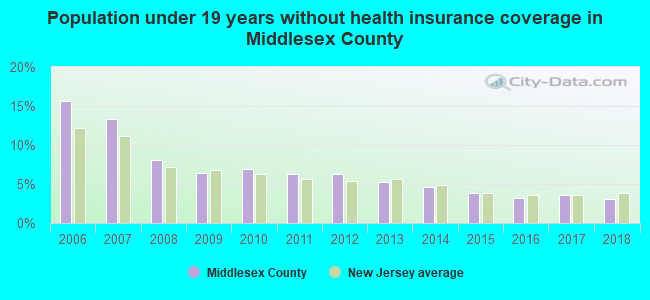
Persons under 19 years old without health insurance coverage in 2018: 3.1%
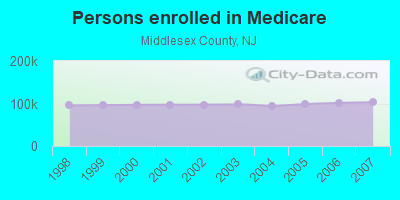
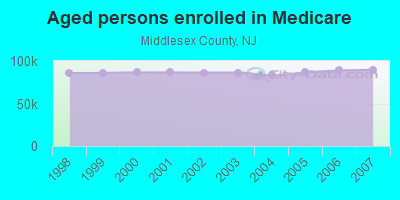
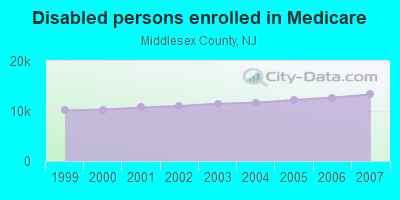
Persons enrolled in hospital insurance and/or supplemental medical insurance (Medicare) in July 1, 2007: 103,063 (89,740 aged, 13,323 disabled)
Children under 18 without health insurance coverage in 2007: 21,770 (11%)
Most common underlying causes of death in Middlesex County, New Jersey in 1999 - 2019:
- Atherosclerotic heart disease (10,647)
- Acute myocardial infarction, unspecified (7,975)
- Bronchus or lung, unspecified - Malignant neoplasms (6,754)
- Unspecified dementia (3,630)
- Chronic obstructive pulmonary disease, unspecified (3,385)
- Septicaemia, unspecified (3,173)
- Stroke, not specified as haemorrhage or infarction (2,877)
- Congestive heart failure (2,730)
- Atherosclerotic cardiovascular disease, so described (2,562)
- Breast, unspecified - Malignant neoplasms (2,367)
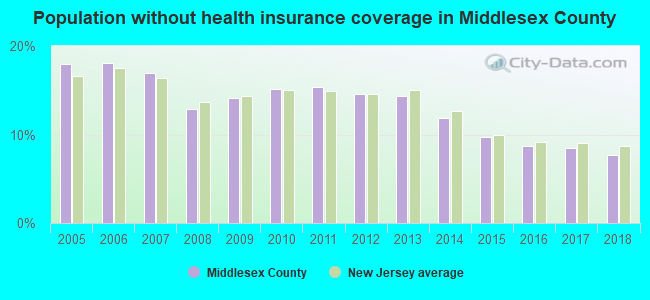
Population without health insurance coverage in 2000: 12%
Children under 18 without health insurance coverage in 2000: 10%
Short term general hospital admissions per 100,000 population in 2004: 11,530
Short term general hospital beds per 100,000 population in 2004: 215
Emergency room visits per 100,000 population in 2004: 26,994
General practice office based MDs per 100,000 population in 2005: 1,287
Medical specialist MDs per 100,000 population in 2005: 666
Dentists per 100,000 population in 1998: 16
Total births per 100,000 population, July 2005 - July 2006 : 61
Total deaths per 100,000 population, July 2005 - July 2006: 93
Limited-service eating places per 100,000 population in 2005 : 14
Beer, wine & liquor stores per 100,000 population in 2005: 1
Fitness & recreation sports centers per 100,000 population in 2005: 3,410
EPA green book nonattainment status in 2004-2006: 1
Suicides per 1,000,000 population from 2000 to 2006: 57.1. This is less than state average.
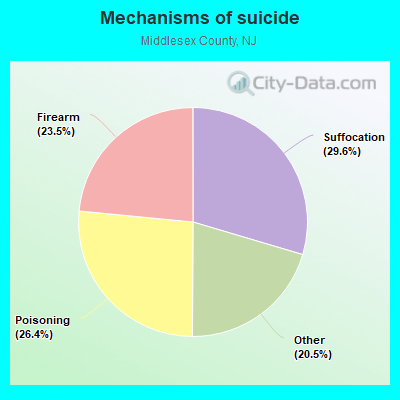
- Suffocation - 16.9
- Poisoning - 15.1
- Firearm - 13.4
- Other - 11.7
Household type by relationship:
Households: 861,418- Male householders: 161,260 (30,819 living alone), Female householders: 145,690 (39,039 living alone)
168,126 spouses (166,640 opposite-sex spouses), 20,032 unmarried partners, (18,999 opposite-sex unmarried partners), 257,831 children (245,542 natural, 4,962 adopted, 7,327 stepchildren), 15,271 grandchildren, 9,541 brothers or sisters, 21,897 parents, 0 foster children, 15,345 other relatives, 21,456 non-relatives
- In group quarters: 24,969
Size of family households: 78,732 2-persons, 51,771 3-persons, 55,146 4-persons, 18,620 5-persons, 8,444 6-persons, 4,469 7-or-more-persons.
Size of nonfamily households: 69,858 1-person, 17,011 2-persons, 1,438 3-persons, 646 4-persons, 333 5-persons, 408 6-persons, 74 7-or-more-persons.
126,309 married couples with children.
36,784 single-parent households (6,792 men, 29,992 women).
53.7% of residents of Middlesex speak English at home.
17.7% of residents speak Spanish at home (53% speak English very well, 17% speak English well, 16% speak English not well, 14% don't speak English at all).
16.2% of residents speak other Indo-European language at home (68% speak English very well, 20% speak English well, 10% speak English not well, 2% don't speak English at all).
9.8% of residents speak Asian or Pacific Island language at home (68% speak English very well, 23% speak English well, 8% speak English not well, 1% don't speak English at all).
2.6% of residents speak other language at home (77% speak English very well, 13% speak English well, 5% speak English not well, 5% don't speak English at all).
In fiscal year 2004:
Federal Government expenditure: $3,635,387,000 ($4,631 per capita)
Department of Defense expenditure: $183,266,000
Federal direct payments to individuals for retirement and disability: $1,417,311,000
Federal other direct payments to individuals: $882,106,000
Federal direct payments not to individuals: $8,666,000
Federal grants: $729,577,000
Federal procurement contracts: $335,350,000 ($140,183,000 Department of Defense)
Federal salaries and wages: $262,379,000 ($21,986,000 Department of Defense)
Federal Government direct loans: $121,827,000
Federal guaranteed/insured loans: $484,224,000
Federal Government insurance: $522,036,000
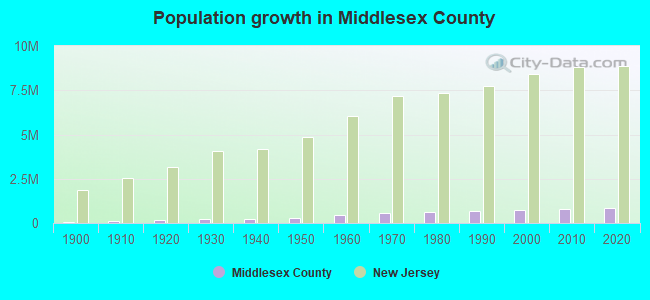
Population change from April 1, 2000 to July 1, 2005:
Births: 55,838| Here: | 71 per 1000 residents |
| State: | 69 per 1000 residents |
Deaths: 29,177
| Here: | 37 per 1000 residents |
| State: | 44 per 1000 residents |
Net international migration: +43,606
| Here: | +55 per 1000 residents |
| State: | +33 per 1000 residents |
Net internal migration: -29,817
| Here: | |
| State: |
Total withdrawal of fresh water for public supply: 30.89 millions of gallons per day (90% from ground, 10% from surface)
| Here: | 6.6 |
| State: | 6.8 |
| Here: | 3.8 |
| State: | 3.9 |
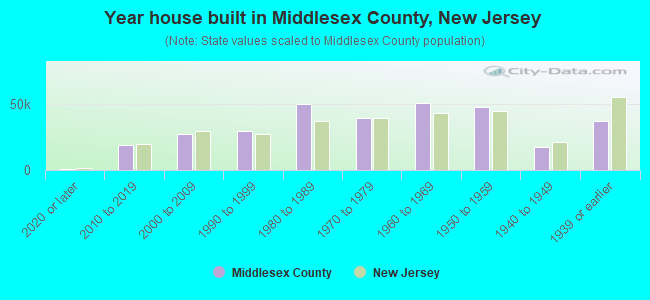
- Year house built in Middlesex County, New Jersey
- 2,0472020 or later
- 22,0232010 to 2019
- 28,3372000 to 2009
- 32,2741990 to 1999
- 53,3201980 to 1989
- 41,1081970 to 1979
- 44,6601960 to 1969
- 48,1631950 to 1959
- 16,4231940 to 1949
- 28,9221939 or earlier
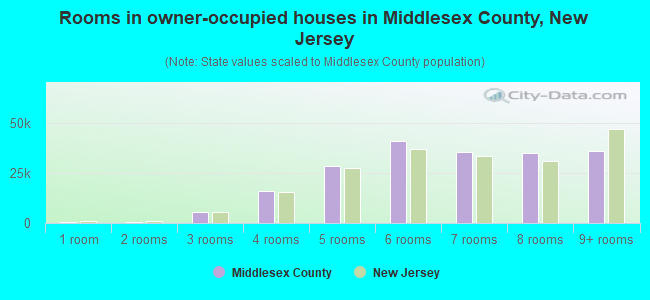
- Rooms in owner-occupied houses in Middlesex County, New Jersey
- 5291 room
- 8072 rooms
- 4,4833 rooms
- 17,6894 rooms
- 30,6685 rooms
- 42,2656 rooms
- 35,2617 rooms
- 32,2188 rooms
- 35,4629+ rooms
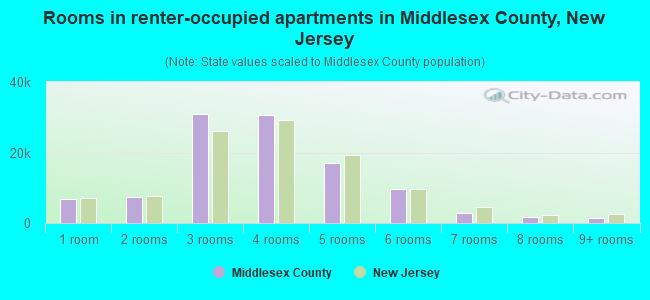
- Rooms in renter-occupied apartments in Middlesex County, New Jersey
- 6,1781 room
- 10,1322 rooms
- 29,2893 rooms
- 28,9034 rooms
- 18,2965 rooms
- 6,1106 rooms
- 4,6097 rooms
- 1,6938 rooms
- 2,3589+ rooms
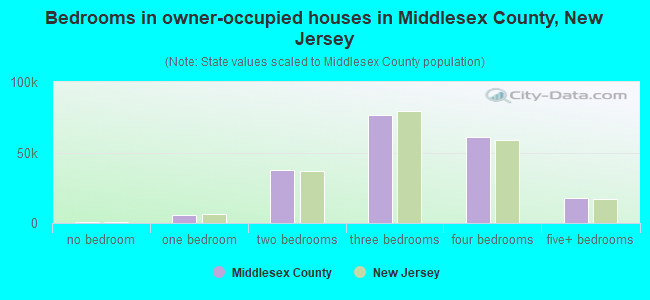
- Bedrooms in owner-occupied houses in Middlesex County, New Jersey
- 529no bedroom
- 3,8721 bedroom
- 37,1002 bedrooms
- 83,5233 bedrooms
- 60,0504 bedrooms
- 14,3085+ bedrooms
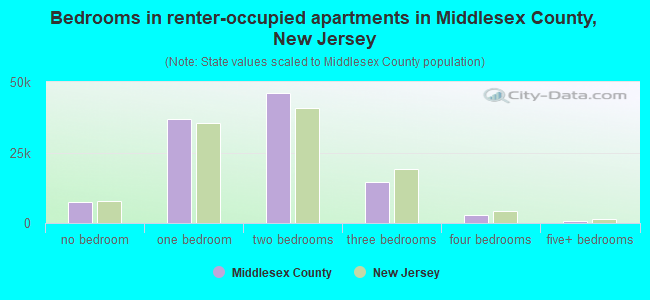
- Bedrooms in renter-occupied apartments in Middlesex County, New Jersey
- 6,554no bedroom
- 43,8541 bedroom
- 37,1002 bedrooms
- 15,3603 bedrooms
- 3,3334 bedrooms
- 1,3675+ bedrooms
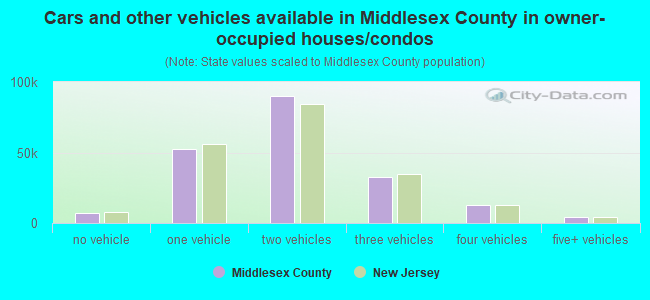
- Cars and other vehicles available in Middlesex County in owner-occupied houses/condos
- 6,658no vehicle
- 52,4191 vehicle
- 88,3772 vehicles
- 35,5383 vehicles
- 12,8884 vehicles
- 3,5025+ vehicles
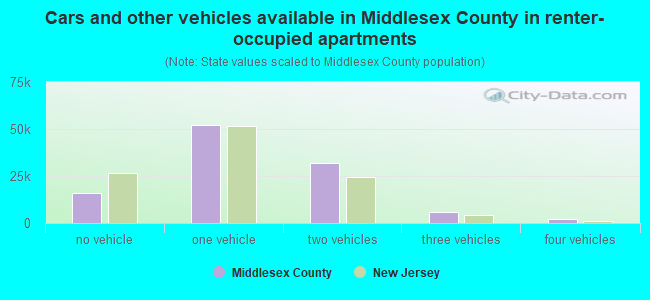
- Cars and other vehicles available in Middlesex County in renter-occupied apartments
- 16,898no vehicle
- 51,0581 vehicle
- 32,0382 vehicles
- 5,6703 vehicles
- 1,2594 vehicles
- 6455+ vehicles
90.6% of Middlesex County residents lived in the same house 1 years ago.
Out of people who lived in different houses, 34% lived in this county.
Out of people who lived in different counties, 53% lived in New Jersey.
| Middlesex County: | 90.6% |
| State average: | 90.4% |
Place of birth for U.S.-born residents:
- This state: 380,822
- Other state: 156,571
- Northeast: 118,474
- Midwest: 10,872
- South: 17,591
- West: 9,634
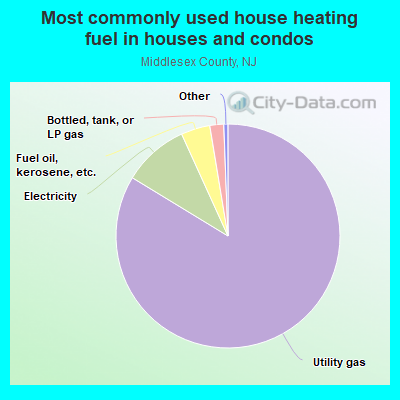
- 85.1%Utility gas
- 8.5%Electricity
- 3.7%Fuel oil, kerosene, etc.
- 1.8%Bottled, tank, or LP gas
- 0.4%No fuel used
- 0.2%Other fuel
- 0.1%Solar energy
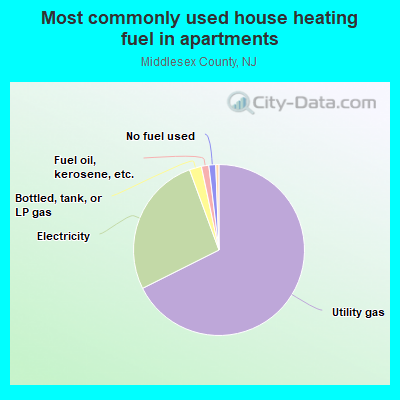
- 65.6%Utility gas
- 29.9%Electricity
- 1.8%Fuel oil, kerosene, etc.
- 1.6%No fuel used
- 1.0%Bottled, tank, or LP gas
- 0.1%Other fuel
Private vs. public school enrollment:
| Here: | 7.9% |
| New Jersey: | 12.3% |
| Here: | 7.5% |
| New Jersey: | 13.1% |
| Here: | 42.0% |
| New Jersey: | 33.2% |
Middlesex County government finances - Expenditure in 2018:
- Assistance and Subsidies - Public Welfare, Federal Categorical Assistance Programs: $9,078,000
Public Welfare, Federal Categorical Assistance Programs: $8,043,000
Public Welfare, Cash Assistance Programs - Other: $2,056,000
- Bond Funds - Cash and Securities: $566,000
Cash and Securities: $101,000
- Charges - Sewerage: $97,707,000
Sewerage: $93,140,000
Other: $54,746,000
Solid Waste Management: $54,630,000
Other: $52,737,000
Higher Education - Other: $45,883,000
Solid Waste Management: $45,332,000
Higher Education - Other: $28,377,000
Parks and Recreation: $3,237,000
Parks and Recreation: $2,959,000
Elementary and Secondary Education School Tuition and Transportation: $563,000
Elementary and Secondary Education School Tuition and Transportation: $478,000
Elementary and Secondary Education School Lunch: $248,000
Elementary and Secondary Education School Lunch: $171,000
Regular Highways: $161,000
- Construction - Sewerage: $69,243,000
Sewerage: $57,194,000
Solid Waste Management: $9,841,000
Other Higher Education: $5,299,000
Elementary and Secondary Education: $4,886,000
Elementary and Secondary Education: $4,574,000
Other Higher Education: $2,928,000
Solid Waste Management: $1,471,000
General - Other: $26,000
- Current Operations - General - Other: $130,508,000
Other Higher Education: $90,384,000
General - Other: $88,611,000
Other Higher Education: $87,659,000
Sewerage: $65,469,000
Public Welfare Institutions: $49,260,000
Sewerage: $48,919,000
Public Welfare Institutions: $45,894,000
Elementary and Secondary Education: $45,292,000
Elementary and Secondary Education: $43,567,000
Correctional Institutions: $42,631,000
Correctional Institutions: $37,972,000
Public Welfare - Other: $35,131,000
Solid Waste Management: $34,460,000
Solid Waste Management: $30,994,000
Police Protection: $25,146,000
Public Welfare - Other: $24,542,000
Judicial and Legal Services: $22,468,000
Judicial and Legal Services: $19,452,000
Police Protection: $18,991,000
Parks and Recreation: $16,346,000
Health - Other: $11,531,000
Parks and Recreation: $8,847,000
Central Staff Services: $7,264,000
Regular Highways: $7,101,000
Central Staff Services: $6,862,000
Health - Other: $6,685,000
Regular Highways: $6,437,000
Financial Administration: $5,786,000
General Public Buildings: $5,692,000
Hospitals: $5,256,000
Hospitals: $4,948,000
Housing and Community Development: $3,419,000
Financial Administration: $2,861,000
Local Fire Protection: $1,954,000
Protective Inspection and Regulation - Other: $1,804,000
Protective Inspection and Regulation - Other: $1,549,000
Corrections - Other: $126,000
- Federal Intergovernmental - Education: $11,857,000
Education: $2,986,000
Housing and Community Development: $902,000
Housing and Community Development: $859,000
- General - Interest on Debt: $21,532,000
Interest on Debt: $12,168,000
- Intergovernmental to Local - Other - Parks and Recreation: $1,272,000
Other - Natural Resources - Other: $1,272,000
Other - Regular Highways: $1,272,000
- Intergovernmental to State - Elementary and Secondary Education: $98,000
Elementary and Secondary Education: $98,000
- Local Intergovernmental - Education: $16,529,000
Education: $16,163,000
Other: $14,067,000
Other: $13,278,000
- Long Term Debt - Beginning Outstanding - Unspecified Public Purpose: $687,166,000
Outstanding Unspecified Public Purpose: $630,761,000
Outstanding Unspecified Public Purpose: $508,384,000
Beginning Outstanding - Unspecified Public Purpose: $502,684,000
Retired Unspecified Public Purpose: $99,944,000
Beginning Outstanding - Public Debt for Private Purpose: $61,400,000
Outstanding Nonguaranteed - Industrial Revenue: $57,900,000
Beginning Outstanding - Public Debt for Private Purpose: $54,400,000
Outstanding Nonguaranteed - Industrial Revenue: $50,900,000
Issue, Unspecified Public Purpose: $43,540,000
Issue, Unspecified Public Purpose: $31,858,000
Retired Unspecified Public Purpose: $26,158,000
Retired Nonguaranteed - Public Debt for Private Purpose: $3,500,000
Retired Nonguaranteed - Public Debt for Private Purpose: $3,500,000
- Miscellaneous - General Revenue - Other: $19,145,000
Fines and Forfeits: $4,295,000
Interest Earnings: $3,735,000
Fines and Forfeits: $1,274,000
Donations From Private Sources: $1,238,000
Interest Earnings: $1,205,000
General Revenue - Other: $1,080,000
Rents: $415,000
- Other Capital Outlay - Sewerage: $6,983,000
Other Higher Education: $2,000,000
Other Higher Education: $2,000,000
Elementary and Secondary Education: $914,000
Elementary and Secondary Education: $661,000
- Other Funds - Cash and Securities: $350,195,000
Cash and Securities: $252,496,000
- Short Term Debt Outstanding - Beginning: $44,000,000
End of Fiscal Year: $34,000,000
End of Fiscal Year: $185,000
Beginning: $168,000
- Sinking Funds - Cash and Securities: $72,442,000
Cash and Securities: $50,900,000
- State Intergovernmental - Education: $32,316,000
Education: $27,763,000
Health and Hospitals: $12,644,000
Public Welfare: $12,052,000
Highways: $11,769,000
Health and Hospitals: $10,530,000
Other: $3,450,000
General Local Government Support: $1,841,000
Public Welfare: $1,171,000
Other: $399,000
- Tax - Property: $401,702,000
Property: $380,430,000
- Total Salaries and Wages: $26,147,000
: $25,347,000
Middlesex County government finances - Revenue in 2018:
- Assistance and Subsidies - Public Welfare, Federal Categorical Assistance Programs: $9,078,000
Public Welfare, Federal Categorical Assistance Programs: $8,043,000
Public Welfare, Cash Assistance Programs - Other: $2,056,000
- Bond Funds - Cash and Securities: $566,000
Cash and Securities: $101,000
- Charges - Sewerage: $97,707,000
Sewerage: $93,140,000
Other: $54,746,000
Solid Waste Management: $54,630,000
Other: $52,737,000
Higher Education - Other: $45,883,000
Solid Waste Management: $45,332,000
Higher Education - Other: $28,377,000
Parks and Recreation: $3,237,000
Parks and Recreation: $2,959,000
Elementary and Secondary Education School Tuition and Transportation: $563,000
Elementary and Secondary Education School Tuition and Transportation: $478,000
Elementary and Secondary Education School Lunch: $248,000
Elementary and Secondary Education School Lunch: $171,000
Regular Highways: $161,000
- Construction - Sewerage: $69,243,000
Sewerage: $57,194,000
Solid Waste Management: $9,841,000
Other Higher Education: $5,299,000
Elementary and Secondary Education: $4,886,000
Elementary and Secondary Education: $4,574,000
Other Higher Education: $2,928,000
Solid Waste Management: $1,471,000
General - Other: $26,000
- Current Operations - General - Other: $130,508,000
Other Higher Education: $90,384,000
General - Other: $88,611,000
Other Higher Education: $87,659,000
Sewerage: $65,469,000
Public Welfare Institutions: $49,260,000
Sewerage: $48,919,000
Public Welfare Institutions: $45,894,000
Elementary and Secondary Education: $45,292,000
Elementary and Secondary Education: $43,567,000
Correctional Institutions: $42,631,000
Correctional Institutions: $37,972,000
Public Welfare - Other: $35,131,000
Solid Waste Management: $34,460,000
Solid Waste Management: $30,994,000
Police Protection: $25,146,000
Public Welfare - Other: $24,542,000
Judicial and Legal Services: $22,468,000
Judicial and Legal Services: $19,452,000
Police Protection: $18,991,000
Parks and Recreation: $16,346,000
Health - Other: $11,531,000
Parks and Recreation: $8,847,000
Central Staff Services: $7,264,000
Regular Highways: $7,101,000
Central Staff Services: $6,862,000
Health - Other: $6,685,000
Regular Highways: $6,437,000
Financial Administration: $5,786,000
General Public Buildings: $5,692,000
Hospitals: $5,256,000
Hospitals: $4,948,000
Housing and Community Development: $3,419,000
Financial Administration: $2,861,000
Local Fire Protection: $1,954,000
Protective Inspection and Regulation - Other: $1,804,000
Protective Inspection and Regulation - Other: $1,549,000
Corrections - Other: $126,000
- Federal Intergovernmental - Education: $11,857,000
Education: $2,986,000
Housing and Community Development: $902,000
Housing and Community Development: $859,000
- General - Interest on Debt: $21,532,000
Interest on Debt: $12,168,000
- Intergovernmental to Local - Other - Parks and Recreation: $1,272,000
Other - Natural Resources - Other: $1,272,000
Other - Regular Highways: $1,272,000
- Intergovernmental to State - Elementary and Secondary Education: $98,000
Elementary and Secondary Education: $98,000
- Local Intergovernmental - Education: $16,529,000
Education: $16,163,000
Other: $14,067,000
Other: $13,278,000
- Long Term Debt - Beginning Outstanding - Unspecified Public Purpose: $687,166,000
Outstanding Unspecified Public Purpose: $630,761,000
Outstanding Unspecified Public Purpose: $508,384,000
Beginning Outstanding - Unspecified Public Purpose: $502,684,000
Retired Unspecified Public Purpose: $99,944,000
Beginning Outstanding - Public Debt for Private Purpose: $61,400,000
Outstanding Nonguaranteed - Industrial Revenue: $57,900,000
Beginning Outstanding - Public Debt for Private Purpose: $54,400,000
Outstanding Nonguaranteed - Industrial Revenue: $50,900,000
Issue, Unspecified Public Purpose: $43,540,000
Issue, Unspecified Public Purpose: $31,858,000
Retired Unspecified Public Purpose: $26,158,000
Retired Nonguaranteed - Public Debt for Private Purpose: $3,500,000
Retired Nonguaranteed - Public Debt for Private Purpose: $3,500,000
- Miscellaneous - General Revenue - Other: $19,145,000
Fines and Forfeits: $4,295,000
Interest Earnings: $3,735,000
Fines and Forfeits: $1,274,000
Donations From Private Sources: $1,238,000
Interest Earnings: $1,205,000
General Revenue - Other: $1,080,000
Rents: $415,000
- Other Capital Outlay - Sewerage: $6,983,000
Other Higher Education: $2,000,000
Other Higher Education: $2,000,000
Elementary and Secondary Education: $914,000
Elementary and Secondary Education: $661,000
- Other Funds - Cash and Securities: $350,195,000
Cash and Securities: $252,496,000
- Short Term Debt Outstanding - Beginning: $44,000,000
End of Fiscal Year: $34,000,000
End of Fiscal Year: $185,000
Beginning: $168,000
- Sinking Funds - Cash and Securities: $72,442,000
Cash and Securities: $50,900,000
- State Intergovernmental - Education: $32,316,000
Education: $27,763,000
Health and Hospitals: $12,644,000
Public Welfare: $12,052,000
Highways: $11,769,000
Health and Hospitals: $10,530,000
Other: $3,450,000
General Local Government Support: $1,841,000
Public Welfare: $1,171,000
Other: $399,000
- Tax - Property: $401,702,000
Property: $380,430,000
- Total Salaries and Wages: $26,147,000
: $25,347,000
Middlesex County government finances - Debt in 2018:
- Assistance and Subsidies - Public Welfare, Federal Categorical Assistance Programs: $9,078,000
Public Welfare, Federal Categorical Assistance Programs: $8,043,000
Public Welfare, Cash Assistance Programs - Other: $2,056,000
- Bond Funds - Cash and Securities: $566,000
Cash and Securities: $101,000
- Charges - Sewerage: $97,707,000
Sewerage: $93,140,000
Other: $54,746,000
Solid Waste Management: $54,630,000
Other: $52,737,000
Higher Education - Other: $45,883,000
Solid Waste Management: $45,332,000
Higher Education - Other: $28,377,000
Parks and Recreation: $3,237,000
Parks and Recreation: $2,959,000
Elementary and Secondary Education School Tuition and Transportation: $563,000
Elementary and Secondary Education School Tuition and Transportation: $478,000
Elementary and Secondary Education School Lunch: $248,000
Elementary and Secondary Education School Lunch: $171,000
Regular Highways: $161,000
- Construction - Sewerage: $69,243,000
Sewerage: $57,194,000
Solid Waste Management: $9,841,000
Other Higher Education: $5,299,000
Elementary and Secondary Education: $4,886,000
Elementary and Secondary Education: $4,574,000
Other Higher Education: $2,928,000
Solid Waste Management: $1,471,000
General - Other: $26,000
- Current Operations - General - Other: $130,508,000
Other Higher Education: $90,384,000
General - Other: $88,611,000
Other Higher Education: $87,659,000
Sewerage: $65,469,000
Public Welfare Institutions: $49,260,000
Sewerage: $48,919,000
Public Welfare Institutions: $45,894,000
Elementary and Secondary Education: $45,292,000
Elementary and Secondary Education: $43,567,000
Correctional Institutions: $42,631,000
Correctional Institutions: $37,972,000
Public Welfare - Other: $35,131,000
Solid Waste Management: $34,460,000
Solid Waste Management: $30,994,000
Police Protection: $25,146,000
Public Welfare - Other: $24,542,000
Judicial and Legal Services: $22,468,000
Judicial and Legal Services: $19,452,000
Police Protection: $18,991,000
Parks and Recreation: $16,346,000
Health - Other: $11,531,000
Parks and Recreation: $8,847,000
Central Staff Services: $7,264,000
Regular Highways: $7,101,000
Central Staff Services: $6,862,000
Health - Other: $6,685,000
Regular Highways: $6,437,000
Financial Administration: $5,786,000
General Public Buildings: $5,692,000
Hospitals: $5,256,000
Hospitals: $4,948,000
Housing and Community Development: $3,419,000
Financial Administration: $2,861,000
Local Fire Protection: $1,954,000
Protective Inspection and Regulation - Other: $1,804,000
Protective Inspection and Regulation - Other: $1,549,000
Corrections - Other: $126,000
- Federal Intergovernmental - Education: $11,857,000
Education: $2,986,000
Housing and Community Development: $902,000
Housing and Community Development: $859,000
- General - Interest on Debt: $21,532,000
Interest on Debt: $12,168,000
- Intergovernmental to Local - Other - Parks and Recreation: $1,272,000
Other - Natural Resources - Other: $1,272,000
Other - Regular Highways: $1,272,000
- Intergovernmental to State - Elementary and Secondary Education: $98,000
Elementary and Secondary Education: $98,000
- Local Intergovernmental - Education: $16,529,000
Education: $16,163,000
Other: $14,067,000
Other: $13,278,000
- Long Term Debt - Beginning Outstanding - Unspecified Public Purpose: $687,166,000
Outstanding Unspecified Public Purpose: $630,761,000
Outstanding Unspecified Public Purpose: $508,384,000
Beginning Outstanding - Unspecified Public Purpose: $502,684,000
Retired Unspecified Public Purpose: $99,944,000
Beginning Outstanding - Public Debt for Private Purpose: $61,400,000
Outstanding Nonguaranteed - Industrial Revenue: $57,900,000
Beginning Outstanding - Public Debt for Private Purpose: $54,400,000
Outstanding Nonguaranteed - Industrial Revenue: $50,900,000
Issue, Unspecified Public Purpose: $43,540,000
Issue, Unspecified Public Purpose: $31,858,000
Retired Unspecified Public Purpose: $26,158,000
Retired Nonguaranteed - Public Debt for Private Purpose: $3,500,000
Retired Nonguaranteed - Public Debt for Private Purpose: $3,500,000
- Miscellaneous - General Revenue - Other: $19,145,000
Fines and Forfeits: $4,295,000
Interest Earnings: $3,735,000
Fines and Forfeits: $1,274,000
Donations From Private Sources: $1,238,000
Interest Earnings: $1,205,000
General Revenue - Other: $1,080,000
Rents: $415,000
- Other Capital Outlay - Sewerage: $6,983,000
Other Higher Education: $2,000,000
Other Higher Education: $2,000,000
Elementary and Secondary Education: $914,000
Elementary and Secondary Education: $661,000
- Other Funds - Cash and Securities: $350,195,000
Cash and Securities: $252,496,000
- Short Term Debt Outstanding - Beginning: $44,000,000
End of Fiscal Year: $34,000,000
End of Fiscal Year: $185,000
Beginning: $168,000
- Sinking Funds - Cash and Securities: $72,442,000
Cash and Securities: $50,900,000
- State Intergovernmental - Education: $32,316,000
Education: $27,763,000
Health and Hospitals: $12,644,000
Public Welfare: $12,052,000
Highways: $11,769,000
Health and Hospitals: $10,530,000
Other: $3,450,000
General Local Government Support: $1,841,000
Public Welfare: $1,171,000
Other: $399,000
- Tax - Property: $401,702,000
Property: $380,430,000
- Total Salaries and Wages: $26,147,000
: $25,347,000
Middlesex County government finances - Cash and Securities in 2018:
- Assistance and Subsidies - Public Welfare, Federal Categorical Assistance Programs: $9,078,000
Public Welfare, Federal Categorical Assistance Programs: $8,043,000
Public Welfare, Cash Assistance Programs - Other: $2,056,000
- Bond Funds - Cash and Securities: $566,000
Cash and Securities: $101,000
- Charges - Sewerage: $97,707,000
Sewerage: $93,140,000
Other: $54,746,000
Solid Waste Management: $54,630,000
Other: $52,737,000
Higher Education - Other: $45,883,000
Solid Waste Management: $45,332,000
Higher Education - Other: $28,377,000
Parks and Recreation: $3,237,000
Parks and Recreation: $2,959,000
Elementary and Secondary Education School Tuition and Transportation: $563,000
Elementary and Secondary Education School Tuition and Transportation: $478,000
Elementary and Secondary Education School Lunch: $248,000
Elementary and Secondary Education School Lunch: $171,000
Regular Highways: $161,000
- Construction - Sewerage: $69,243,000
Sewerage: $57,194,000
Solid Waste Management: $9,841,000
Other Higher Education: $5,299,000
Elementary and Secondary Education: $4,886,000
Elementary and Secondary Education: $4,574,000
Other Higher Education: $2,928,000
Solid Waste Management: $1,471,000
General - Other: $26,000
- Current Operations - General - Other: $130,508,000
Other Higher Education: $90,384,000
General - Other: $88,611,000
Other Higher Education: $87,659,000
Sewerage: $65,469,000
Public Welfare Institutions: $49,260,000
Sewerage: $48,919,000
Public Welfare Institutions: $45,894,000
Elementary and Secondary Education: $45,292,000
Elementary and Secondary Education: $43,567,000
Correctional Institutions: $42,631,000
Correctional Institutions: $37,972,000
Public Welfare - Other: $35,131,000
Solid Waste Management: $34,460,000
Solid Waste Management: $30,994,000
Police Protection: $25,146,000
Public Welfare - Other: $24,542,000
Judicial and Legal Services: $22,468,000
Judicial and Legal Services: $19,452,000
Police Protection: $18,991,000
Parks and Recreation: $16,346,000
Health - Other: $11,531,000
Parks and Recreation: $8,847,000
Central Staff Services: $7,264,000
Regular Highways: $7,101,000
Central Staff Services: $6,862,000
Health - Other: $6,685,000
Regular Highways: $6,437,000
Financial Administration: $5,786,000
General Public Buildings: $5,692,000
Hospitals: $5,256,000
Hospitals: $4,948,000
Housing and Community Development: $3,419,000
Financial Administration: $2,861,000
Local Fire Protection: $1,954,000
Protective Inspection and Regulation - Other: $1,804,000
Protective Inspection and Regulation - Other: $1,549,000
Corrections - Other: $126,000
- Federal Intergovernmental - Education: $11,857,000
Education: $2,986,000
Housing and Community Development: $902,000
Housing and Community Development: $859,000
- General - Interest on Debt: $21,532,000
Interest on Debt: $12,168,000
- Intergovernmental to Local - Other - Parks and Recreation: $1,272,000
Other - Natural Resources - Other: $1,272,000
Other - Regular Highways: $1,272,000
- Intergovernmental to State - Elementary and Secondary Education: $98,000
Elementary and Secondary Education: $98,000
- Local Intergovernmental - Education: $16,529,000
Education: $16,163,000
Other: $14,067,000
Other: $13,278,000
- Long Term Debt - Beginning Outstanding - Unspecified Public Purpose: $687,166,000
Outstanding Unspecified Public Purpose: $630,761,000
Outstanding Unspecified Public Purpose: $508,384,000
Beginning Outstanding - Unspecified Public Purpose: $502,684,000
Retired Unspecified Public Purpose: $99,944,000
Beginning Outstanding - Public Debt for Private Purpose: $61,400,000
Outstanding Nonguaranteed - Industrial Revenue: $57,900,000
Beginning Outstanding - Public Debt for Private Purpose: $54,400,000
Outstanding Nonguaranteed - Industrial Revenue: $50,900,000
Issue, Unspecified Public Purpose: $43,540,000
Issue, Unspecified Public Purpose: $31,858,000
Retired Unspecified Public Purpose: $26,158,000
Retired Nonguaranteed - Public Debt for Private Purpose: $3,500,000
Retired Nonguaranteed - Public Debt for Private Purpose: $3,500,000
- Miscellaneous - General Revenue - Other: $19,145,000
Fines and Forfeits: $4,295,000
Interest Earnings: $3,735,000
Fines and Forfeits: $1,274,000
Donations From Private Sources: $1,238,000
Interest Earnings: $1,205,000
General Revenue - Other: $1,080,000
Rents: $415,000
- Other Capital Outlay - Sewerage: $6,983,000
Other Higher Education: $2,000,000
Other Higher Education: $2,000,000
Elementary and Secondary Education: $914,000
Elementary and Secondary Education: $661,000
- Other Funds - Cash and Securities: $350,195,000
Cash and Securities: $252,496,000
- Short Term Debt Outstanding - Beginning: $44,000,000
End of Fiscal Year: $34,000,000
End of Fiscal Year: $185,000
Beginning: $168,000
- Sinking Funds - Cash and Securities: $72,442,000
Cash and Securities: $50,900,000
- State Intergovernmental - Education: $32,316,000
Education: $27,763,000
Health and Hospitals: $12,644,000
Public Welfare: $12,052,000
Highways: $11,769,000
Health and Hospitals: $10,530,000
Other: $3,450,000
General Local Government Support: $1,841,000
Public Welfare: $1,171,000
Other: $399,000
- Tax - Property: $401,702,000
Property: $380,430,000
- Total Salaries and Wages: $26,147,000
: $25,347,000
Supplemental Security Income (SSI) in 2006:
- Total number of recipients: 10,712
- Number of aged recipients: 3,895
- Number of blind and disabled recipients: 6,817
- Number of recipients under 18: 1,169
- Number of recipients between 18 and 64: 4,447
- Number of recipients older than 64: 5,096
- Number of recipients also receiving OASDI: 2,930
- Amount of payments (thousands of dollars): 4,839
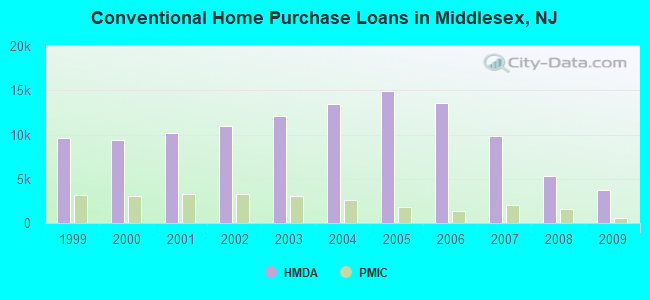
| Home Mortgage Disclosure Act Aggregated Statistics For Year 2009 (Based on 177 full tracts) | ||||||||||||||
| A) FHA, FSA/RHS & VA Home Purchase Loans | B) Conventional Home Purchase Loans | C) Refinancings | D) Home Improvement Loans | E) Loans on Dwellings For 5+ Families | F) Non-occupant Loans on < 5 Family Dwellings (A B C & D) | G) Loans On Manufactured Home Dwelling (A B C & D) | ||||||||
|---|---|---|---|---|---|---|---|---|---|---|---|---|---|---|
| Number | Average Value | Number | Average Value | Number | Average Value | Number | Average Value | Number | Average Value | Number | Average Value | Number | Average Value | |
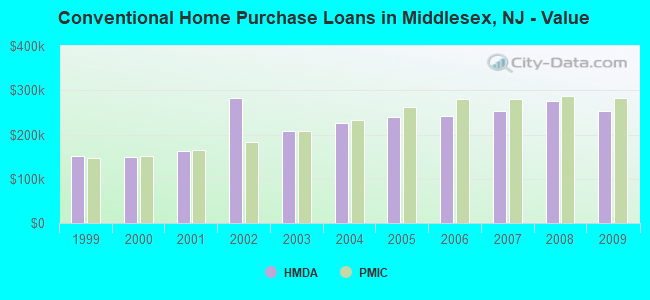
| LOANS ORIGINATED | 2,262 | $260,520 | 3,759 | $253,715 | 17,946 | $254,706 | 826 | $107,340 | 26 | $5,706,500 | 534 | $194,227 | 30 | $73,167 |
| APPLICATIONS APPROVED, NOT ACCEPTED | 175 | $257,154 | 522 | $268,368 | 1,844 | $261,458 | 137 | $80,022 | 0 | $0 | 55 | $200,127 | 4 | $55,750 |
| APPLICATIONS DENIED | 459 | $261,022 | 760 | $251,991 | 7,277 | $272,828 | 764 | $79,704 | 5 | $2,657,800 | 370 | $226,797 | 28 | $99,250 |
| APPLICATIONS WITHDRAWN | 376 | $254,189 | 568 | $261,780 | 4,500 | $266,645 | 196 | $141,923 | 7 | $306,571 | 169 | $189,497 | 4 | $72,000 |
| FILES CLOSED FOR INCOMPLETENESS | 127 | $271,976 | 203 | $273,783 | 1,255 | $271,161 | 64 | $105,922 | 1 | $200,000 | 41 | $184,634 | 0 | $0 |
| Private Mortgage Insurance Companies Aggregated Statistics For Year 2009 (Based on 166 full tracts) | ||||||
| A) Conventional Home Purchase Loans | B) Refinancings | C) Non-occupant Loans on < 5 Family Dwellings (A & B) | ||||
|---|---|---|---|---|---|---|
| Number | Average Value | Number | Average Value | Number | Average Value | |
| LOANS ORIGINATED | 549 | $282,889 | 328 | $312,091 | 1 | $126,000 |
| APPLICATIONS APPROVED, NOT ACCEPTED | 212 | $290,783 | 171 | $313,047 | 3 | $221,667 |
| APPLICATIONS DENIED | 105 | $273,981 | 125 | $314,144 | 0 | $0 |
| APPLICATIONS WITHDRAWN | 57 | $285,842 | 51 | $308,157 | 1 | $247,000 |
| FILES CLOSED FOR INCOMPLETENESS | 30 | $280,567 | 9 | $292,667 | 1 | $126,000 |
| Most common first names in Middlesex County, NJ among deceased individuals | ||
| Name | Count | Lived (average) |
|---|---|---|
| John | 6,631 | 73.5 years |
| Mary | 5,761 | 80.1 years |
| Joseph | 4,668 | 73.8 years |
| William | 3,385 | 72.5 years |
| Anna | 3,294 | 81.3 years |
| Helen | 3,164 | 79.2 years |
| Frank | 2,464 | 74.6 years |
| George | 2,350 | 74.1 years |
| James | 2,226 | 70.9 years |
| Margaret | 2,199 | 78.4 years |
| Most common last names in Middlesex County, NJ among deceased individuals | ||
| Last name | Count | Lived (average) |
|---|---|---|
| Smith | 864 | 74.3 years |
| Miller | 584 | 75.4 years |
| Johnson | 508 | 74.6 years |
| Brown | 446 | 73.7 years |
| Williams | 342 | 72.8 years |
| Jones | 286 | 74.2 years |
| Anderson | 281 | 75.3 years |
| Toth | 260 | 75.0 years |
| Davis | 242 | 73.4 years |
| Patel | 234 | 71.9 years |
| Businesses in Middlesex County, NJ | ||||
| Name | Count | Name | Count | |
|---|---|---|---|---|
| 7-Eleven | 33 | Jimmy John's | 1 | |
| A&P | 4 | JoS. A. Bank | 2 | |
| ALDI | 2 | Johnny Rockets | 1 | |
| ALDO | 1 | Jones New York | 9 | |
| AMF Bowling | 1 | Journeys | 2 | |
| AT&T | 16 | Justice | 4 | |
| Ace Hardware | 1 | KFC | 8 | |
| Advance Auto Parts | 6 | Kmart | 2 | |
| Aeropostale | 3 | Knights Inn | 1 | |
| Aerosoles | 1 | Kohl's | 3 | |
| American Eagle Outfitters | 2 | Kroger | 2 | |
| Ann Taylor | 3 | LA Fitness | 3 | |
| Applebee's | 3 | La-Z-Boy | 2 | |
| Arby's | 1 | Lane Bryant | 2 | |
| Ashley Furniture | 1 | Lane Furniture | 6 | |
| Audi | 1 | LensCrafters | 3 | |
| AutoZone | 8 | Little Caesars Pizza | 3 | |
| Avenue | 3 | Lowe's | 4 | |
| BMW | 1 | Macy's | 4 | |
| Baja Fresh Mexican Grill | 2 | Marriott | 5 | |
| Bakers | 2 | Marshalls | 4 | |
| Bally Total Fitness | 1 | MasterBrand Cabinets | 64 | |
| Banana Republic | 2 | McDonald's | 20 | |
| Barnes & Noble | 2 | Men's Wearhouse | 3 | |
| Baskin-Robbins | 15 | Motel 6 | 2 | |
| Bath & Body Works | 4 | Motherhood Maternity | 5 | |
| Bebe | 1 | New Balance | 4 | |
| Bed Bath & Beyond | 2 | New York & Co | 4 | |
| Ben & Jerry's | 1 | Nike | 13 | |
| Best Western | 3 | Nissan | 3 | |
| Blockbuster | 6 | Office Depot | 1 | |
| Brookstone | 1 | Old Navy | 1 | |
| Brunswick Bowling & Billiards | 1 | Olive Garden | 2 | |
| Budget Car Rental | 2 | On The Border | 1 | |
| Buffalo Wild Wings | 1 | Outback | 3 | |
| Burger King | 21 | Outback Steakhouse | 3 | |
| CVS | 15 | Pac Sun | 1 | |
| Casual Male XL | 1 | Panda Express | 1 | |
| Catherines | 2 | Panera Bread | 4 | |
| Charlotte Russe | 2 | Papa John's Pizza | 7 | |
| Chevrolet | 3 | Pathmark | 6 | |
| Chick-Fil-A | 1 | Payless | 11 | |
| Chico's | 2 | Penske | 4 | |
| Chipotle | 2 | PetSmart | 4 | |
| Cinnabon | 2 | Pier 1 Imports | 2 | |
| Circle K | 4 | Pizza Hut | 5 | |
| Clarks | 2 | Popeyes | 4 | |
| Cold Stone Creamery | 4 | Qdoba Mexican Grill | 2 | |
| Coldwater Creek | 2 | Quiznos | 5 | |
| Comfort Inn | 1 | RadioShack | 12 | |
| Comfort Suites | 2 | Ramada | 2 | |
| Costco | 1 | Raymour & Flanigan | 1 | |
| Crate & Barrel | 1 | Red Lobster | 3 | |
| Curves | 4 | Red Robin | 1 | |
| DHL | 3 | Red Roof Inn | 2 | |
| Dairy Queen | 2 | Rite Aid | 17 | |
| Days Hotel | 1 | Ruby Tuesday | 4 | |
| Days Inn | 2 | Ryder Rental & Truck Leasing | 3 | |
| Decora Cabinetry | 14 | SONIC Drive-In | 1 | |
| Dennys | 2 | Sam's Club | 1 | |
| Domino's Pizza | 9 | Sears | 10 | |
| DressBarn | 2 | Sephora | 1 | |
| Dressbarn | 1 | Skechers USA | 1 | |
| Dunkin Donuts | 71 | Spencer Gifts | 2 | |
| Express | 2 | Sprint Nextel | 7 | |
| Extended Stay America | 1 | Staples | 8 | |
| Extended Stay Deluxe | 1 | Starbucks | 16 | |
| Famous Footwear | 3 | Stop & Shop | 8 | |
| Fashion Bug | 2 | Studio 6 | 1 | |
| FedEx | 143 | Subaru | 2 | |
| Firestone Complete Auto Care | 2 | Subway | 40 | |
| Foot Locker | 3 | T-Mobile | 3 | |
| Ford | 3 | T.G.I. Driday's | 4 | |
| Forever 21 | 2 | T.J.Maxx | 2 | |
| GNC | 14 | Taco Bell | 8 | |
| GameStop | 15 | Talbots | 1 | |
| Gap | 3 | Target | 3 | |
| Goodwill | 1 | The Limited | 1 | |
| Gymboree | 2 | The Room Place | 9 | |
| H&M | 1 | Torrid | 2 | |
| H&R Block | 18 | Toyota | 4 | |
| Haagen-Dazs | 1 | Toys"R"Us | 6 | |
| Harmon Face Values | 5 | True Value | 1 | |
| Hilton | 5 | U-Haul | 22 | |
| Holiday Inn | 8 | UPS | 161 | |
| Hollister Co. | 2 | Verizon Wireless | 8 | |
| Home Depot | 6 | Victoria's Secret | 2 | |
| HomeTown Buffet | 1 | Volkswagen | 1 | |
| Homestead Studio Suites | 1 | Walgreens | 11 | |
| Honda | 2 | Walmart | 5 | |
| Hot Topic | 1 | Wendy's | 12 | |
| Houlihan's | 1 | Wet Seal | 2 | |
| Hyatt | 1 | White Castle | 5 | |
| Hyundai | 2 | Wine & Spirits | 1 | |
| IHOP | 2 | World Gym | 1 | |
| JCPenney | 2 | YMCA | 10 | |
| Jamba Juice | 1 | |||
Middlesex County on our top lists:
- #15 on the list of "Top 101 counties with the most Orthodox adherents"
- #15 on the list of "Top 101 counties with the most Orthodox adherents (pop. 50,000+)"
- #17 on the list of "Top 101 counties with the lowest percentage of residents that keep firearms around their homes"
- #24 on the list of "Top 101 counties with the lowest number of infant deaths per 1000 residents 2007-2013 (pop. 50,000+)"
- #25 on the list of "Top 101 counties with the largest decrease in the number of infant deaths per 1000 residents 2000-2006 to 2007-2013 (pop. 50,000+)"
- #29 on the list of "Top 101 counties with the most Catholic congregations"
- #29 on the list of "Top 101 counties with the most Catholic congregations (pop. 50,000+)"
- #30 on the list of "Top 101 counties with the most Orthodox congregations (pop. 50,000+)"
- #33 on the list of "Top 101 counties with the most Catholic adherents"
- #33 on the list of "Top 101 counties with the most Catholic adherents (pop. 50,000+)"
- #34 on the list of "Top 101 counties with the most Orthodox congregations"
- #52 on the list of "Top 101 counties with the most Other adherents"
- #52 on the list of "Top 101 counties with the most Other adherents (pop. 50,000+)"
- #55 on the list of "Top 101 counties with the lowest percentage of residents that drank alcohol in the past 30 days"
- #78 on the list of "Top 101 counties with the lowest percentage of residents that smoked 100+ cigarettes in their lives"
- #81 on the list of "Top 101 counties with the lowest Nitrogen Dioxide air pollution readings in 2012 (ppm)"
- #83 on the list of "Top 101 counties with the most Other congregations (pop. 50,000+)"
- #86 on the list of "Top 101 counties with the highest Nitrogen Dioxide air pollution readings in 2012 (ppm)"
- #88 on the list of "Top 101 counties with the most Other congregations"
- #94 on the list of "Top 101 counties with the highest ground withdrawal of fresh water for public supply (pop. 50,000+)"