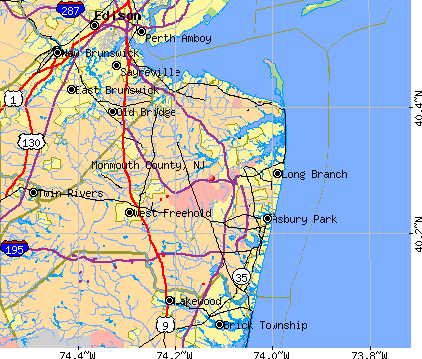
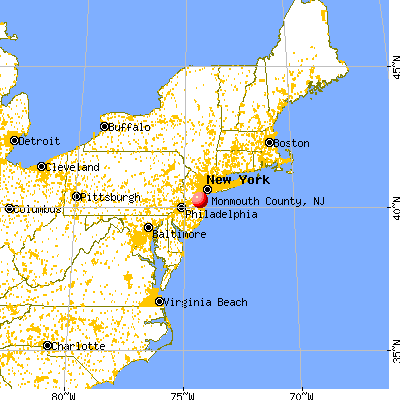
Monmouth County, New Jersey (NJ)
County owner-occupied free and clear houses and condos in 2010: 44,152
County owner-occupied houses and condos in 2000: 167,273
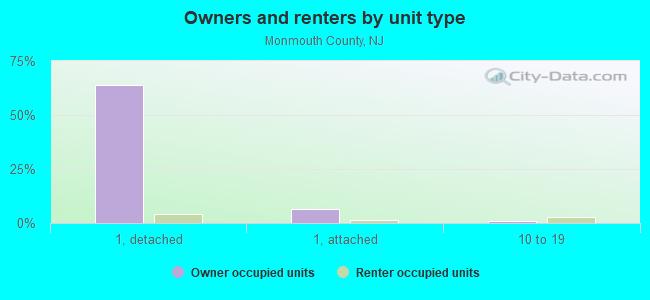
Renter-occupied apartments: 58,826 (it was 56,963 in 2000)
| % of renters here: | 25% |
| State: | 35% |
Land area: 472 sq. mi.
Water area: 193.2 sq. mi.
Population density: 1365 people per square mile (very high).
Industries providing employment: Educational, health and social services (23.2%), Professional, scientific, management, administrative, and waste management services (14.6%), Retail trade (12.2%), Finance, insurance, real estate, and rental and leasing (10.7%).
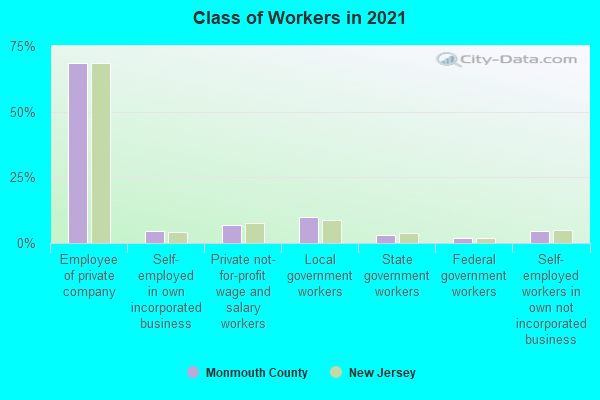
Type of workers:
- Private wage or salary: 81%
- Government: 14%
- Self-employed, not incorporated: 5%
- Unpaid family work: 0%
- OSM Map
- General Map
- Google Map
- MSN Map

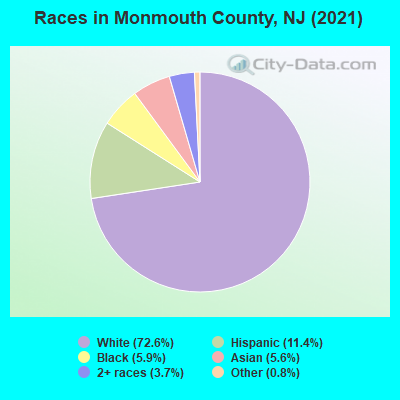
- 465,95772.3%White Non-Hispanic Alone
- 75,10711.7%Hispanic or Latino
- 34,6845.4%Asian alone
- 34,6155.4%Black Non-Hispanic Alone
- 25,9154.0%Two or more races
- 7,1901.1%Some other race alone
- 6300.10%American Indian and Alaska Native alone
| Median resident age: | 43.6 years |
| New Jersey median age: | 40.4 years |
| Males: 315,619 | |
| Females: 328,479 |


| Monmouth County: | 2.0 people |
| New Jersey: | 3 people |
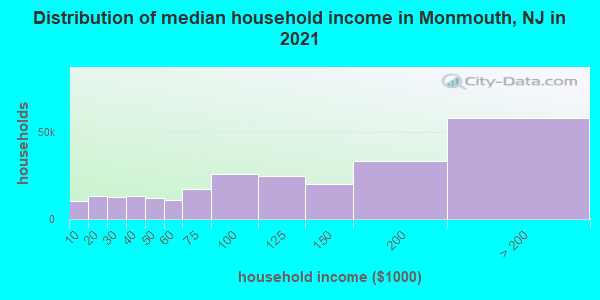
Estimated median household income in 2022: $118,194 ($64,271 in 1999)
| This county: | $118,194 |
| New Jersey: | $96,346 |
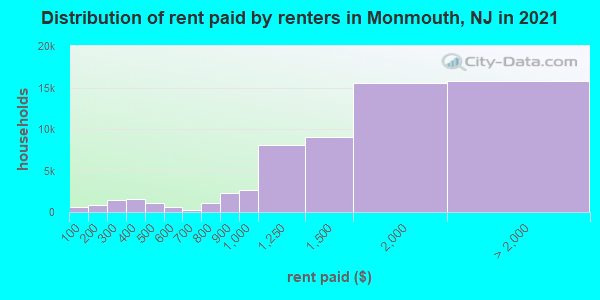
Median contract rent in 2022 for apartments: $1,472 (lower quartile is $1,098, upper quartile is $2,007)
| This county: | $1472 |
| State: | $1399 |
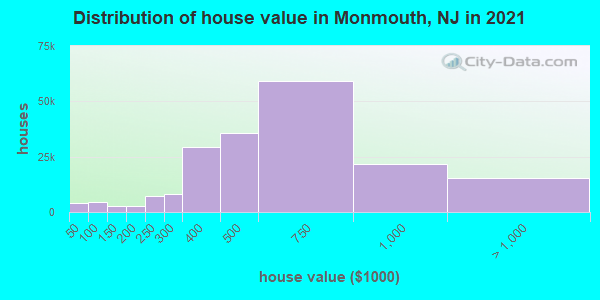
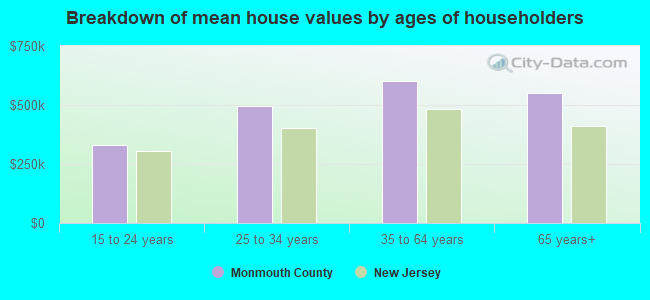
Estimated median house or condo value in 2022: $576,800 (it was $195,800 in 2000)
| Monmouth: | $576,800 |
| New Jersey: | $428,900 |
Mean price in 2022:
Median monthly housing costs for homes and condos with a mortgage: $2,813Detached houses: $685,426
Here: $685,426 State: $537,591 Townhouses or other attached units: $413,320
Here: $413,320 State: $381,113 In 2-unit structures: $504,703
Here: $504,703 State: $444,476 In 3-to-4-unit structures: $490,208
Here: $490,208 State: $457,463 In 5-or-more-unit structures: $384,799
Here: $384,799 State: $368,745 Mobile homes: $81,448
Here: $81,448 State: $119,788
Median monthly housing costs for units without a mortgage: $1,220
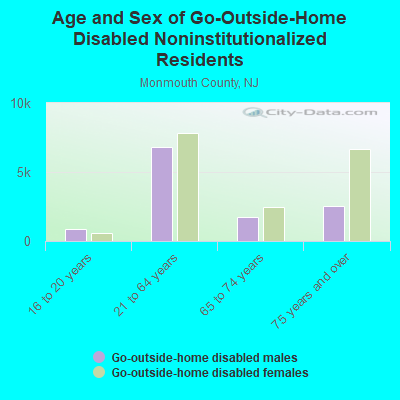
Institutionalized population: 4,345
Crime in 2020 (reported by the sheriff's office or county police, not the county total):
- Murders: 0
- Rapes: 0
- Robberies: 0
- Assaults: 3
- Burglaries: 0
- Thefts: 0
- Auto thefts: 0
Crime in 2019 (reported by the sheriff's office or county police, not the county total):
- Murders: 0
- Rapes: 0
- Robberies: 0
- Assaults: 7
- Burglaries: 0
- Thefts: 1
- Auto thefts: 0
Health of residents in Monmouth County based on CDC Behavioral Risk Factor Surveillance System Survey Questionnaires from 2003 to 2012:
General health status score of residents in this county from 1 (poor) to 5 (excellent) is 3.7. This is better than average.76.3% of residents exercised in the past month. This is about average.
49.9% of residents smoked 100+ cigarettes in their lives. This is about average.
79.7% of adult residents drank alcohol in the past 30 days. This is about average.
78.6% of residents visited a dentist within the past year. This is more than average.
Average weight of males is 195 pounds. This is about average.
Average weight of females is 159 pounds. This is about average.
8.9% of residents keep firearms around their homes. This is less than average.
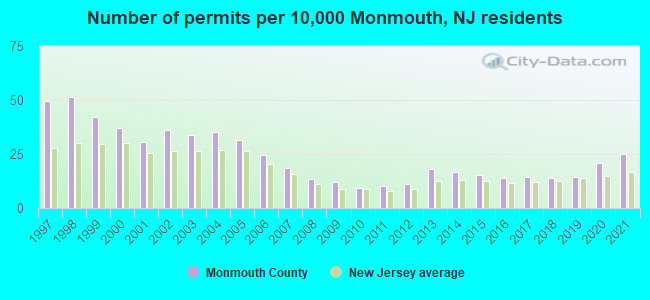
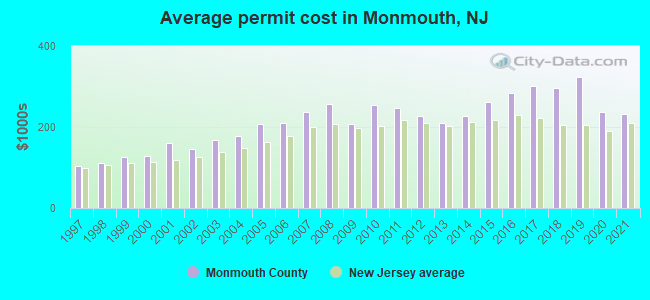
Single-family new house construction building permits:
- 2022: 1609 buildings, average cost: $263,600
- 2021: 1545 buildings, average cost: $231,400
- 2020: 1282 buildings, average cost: $235,800
- 2019: 888 buildings, average cost: $323,500
- 2018: 868 buildings, average cost: $295,700
- 2017: 888 buildings, average cost: $301,300
- 2016: 867 buildings, average cost: $285,000
- 2015: 944 buildings, average cost: $260,600
- 2014: 1014 buildings, average cost: $226,800
- 2013: 1121 buildings, average cost: $209,800
- 2012: 690 buildings, average cost: $228,200
- 2011: 617 buildings, average cost: $246,400
- 2010: 577 buildings, average cost: $253,800
- 2009: 753 buildings, average cost: $207,800
- 2008: 831 buildings, average cost: $257,900
- 2007: 1130 buildings, average cost: $236,400
- 2006: 1517 buildings, average cost: $209,300
- 2005: 1932 buildings, average cost: $208,000
- 2004: 2179 buildings, average cost: $179,100
- 2003: 2068 buildings, average cost: $167,600
- 2002: 2213 buildings, average cost: $144,900
- 2001: 1871 buildings, average cost: $159,600
- 2000: 2268 buildings, average cost: $129,100
- 1999: 2587 buildings, average cost: $127,400
- 1998: 3159 buildings, average cost: $109,700
- 1997: 3047 buildings, average cost: $103,300
Median real estate property taxes paid for housing units with mortgages in 2022: $9,707 (1.6%)
Median real estate property taxes paid for housing units with no mortgage in 2022: $9,546 (1.8%)
| Monmouth County: | 6.1% |
| New Jersey: | 9.7% |
Median age of residents in 2022: 43.6 years old
(Males: 42.5 years old, Females: 44.8 years old)
(Median age for: White residents: 47.7 years old, Black residents: 39.9 years old, American Indian residents: 26.8 years old, Asian residents: 43.6 years old, Hispanic or Latino residents: 30.8 years old, Other race residents: 38.0 years old)
Area name: New York-Monmouth-Ocean, NY-NJ HUD Metro FMR Area
Fair market rent in 2006 for a 1-bedroom apartment in Monmouth County is $1003 a month.
Fair market rent for a 2-bedroom apartment is $1133 a month.
Fair market rent for a 3-bedroom apartment is $1406 a month.
Cities in this county include: Long Branch, Asbury Park, Tinton Falls, Eatontown, West Freehold, Red Bank, Robertsville, Morganville, Freehold, Keansburg.
2023 air pollution in Monmouth County:
Ozone (1-hour): 0.037 ppm (standard limit: 0.12 ppm). Near U.S. average.
Neighboring counties: Allegheny County, Pennsylvania  , Ocean County
  , Holmes County, Ohio , Harrison County, Missouri , Rio Blanco County, Colorado , Piatt County, Illinois .
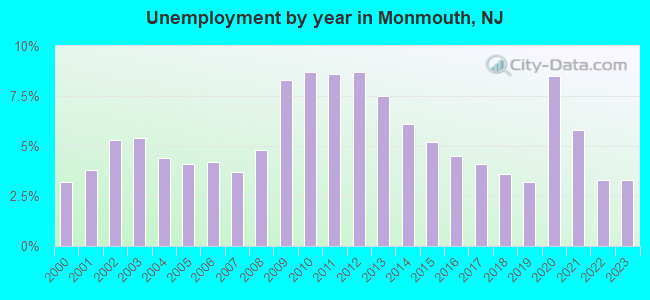
| Here: | 3.8% |
| New Jersey: | 4.5% |
Current college students: 30,358
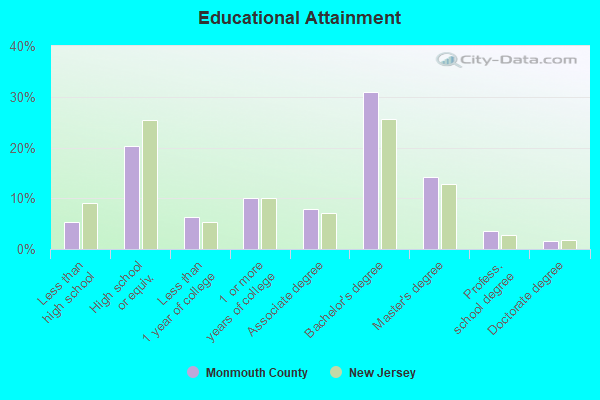
People 25 years of age or older with a high school degree or higher: 94.6%
People 25 years of age or older with a bachelor's degree or higher: 52.3%
Number of foreign born residents: 86,759 (67.2% naturalized citizens)
| Monmouth County: | 13.5% |
| Whole state: | 23.5% |
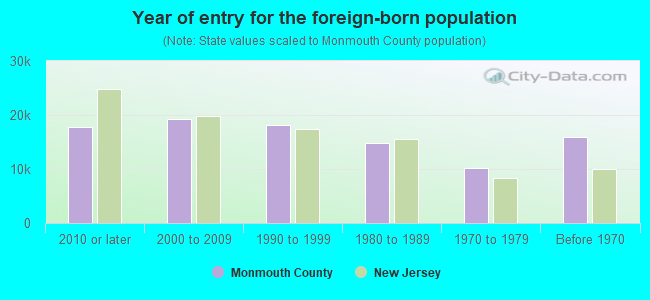
- Year of entry for the foreign-born population
- 17,0462010 or later
- 19,5372000 to 2009
- 20,2441990 to 1999
- 14,8081980 to 1989
- 10,1811970 to 1979
- 15,977Before 1970
Mean travel time to work (commute): minutes
Percentage of county residents living and working in this county: 91.9%
Housing units in structures:
- One, detached: 177,301
- One, attached: 26,827
- Two: 7,351
- 3 or 4: 9,615
- 5 to 9: 10,604
- 10 to 19: 9,010
- 20 to 49: 7,142
- 50 or more: 18,177
- Mobile homes: 3,990
- Boats, RVs, vans, etc.: 170
Housing units in Monmouth County with a mortgage: 121,293 (16,973 second mortgage, 316 home equity loan, 14,746 both second mortgage and home equity loan)
Houses without a mortgage: 6,159
| Here: | 95.3% with mortgage |
| State: | 95.9% with mortgage |
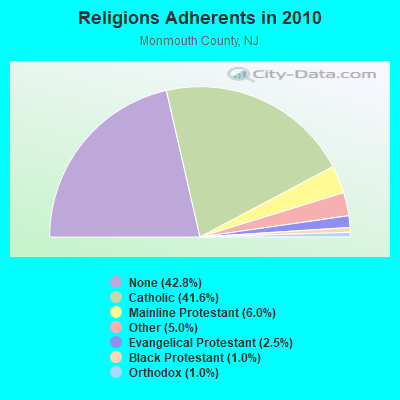
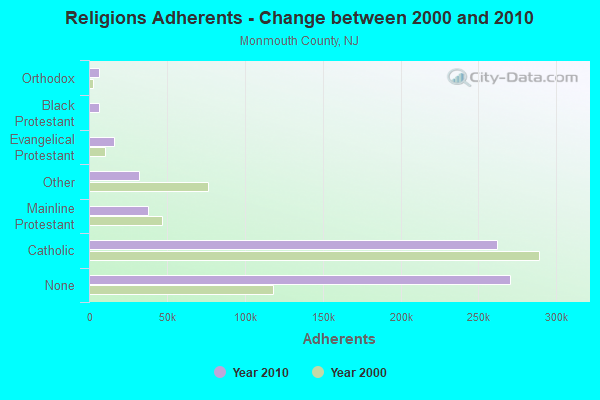
Religion statistics for Monmouth County
| Religion | Adherents | Congregations |
|---|---|---|
| Catholic | 262,031 | 48 |
| Mainline Protestant | 37,657 | 131 |
| Other | 31,794 | 70 |
| Evangelical Protestant | 16,025 | 106 |
| Black Protestant | 6,507 | 33 |
| Orthodox | 6,377 | 9 |
| None | 269,989 | - |
Source: Clifford Grammich, Kirk Hadaway, Richard Houseal, Dale E.Jones, Alexei Krindatch, Richie Stanley and Richard H.Taylor. 2012. 2010 U.S.Religion Census: Religious Congregations & Membership Study. Association of Statisticians of American Religious Bodies. Jones, Dale E., et al. 2002. Congregations and Membership in the United States 2000. Nashville, TN: Glenmary Research Center.
Food Environment Statistics:
| Monmouth County: | 2.57 / 10,000 pop. |
| State: | 2.90 / 10,000 pop. |
| Here: | 0.08 / 10,000 pop. |
| New Jersey: | 0.06 / 10,000 pop. |
| This county: | 1.82 / 10,000 pop. |
| New Jersey: | 1.76 / 10,000 pop. |
| Monmouth County: | 0.80 / 10,000 pop. |
| New Jersey: | 0.81 / 10,000 pop. |
| This county: | 9.71 / 10,000 pop. |
| State: | 7.15 / 10,000 pop. |
| Monmouth County: | 7.6% |
| New Jersey: | 8.3% |
| Monmouth County: | 20.4% |
| State: | 23.3% |
| Here: | 21.8% |
| State: | 18.0% |
Agriculture in Monmouth County:
Average size of farms: 53 acresAverage value of agricultural products sold per farm: $91,425
Average value of crops sold per acre for harvested cropland: $2784.72
The value of nursery, greenhouse, floriculture, and sod as a percentage of the total market value of agricultural products sold: 73.11%
The value of livestock, poultry, and their products as a percentage of the total market value of agricultural products sold: 10.85%
Average total farm production expenses per farm: $75,884
Harvested cropland as a percentage of land in farms: 55.31%
Irrigated harvested cropland as a percentage of land in farms: 20.39%
Average market value of all machinery and equipment per farm: $63,417
The percentage of farms operated by a family or individual: 81.61%
Average age of principal farm operators: 55 years
Average number of cattle and calves per 100 acres of all land in farms: 1.36
Corn for grain: 2495 harvested acres
All wheat for grain: 911 harvested acres
Soybeans for beans: 6015 harvested acres
Vegetables: 2,953 harvested acres
Land in orchards: 463 acres
Earthquake activity:
Monmouth County-area historical earthquake activity is significantly above New Jersey state average. It is 70% smaller than the overall U.S. average.On 8/23/2011 at 17:51:04, a magnitude 5.8 (5.8 MW, Depth: 3.7 mi, Class: Moderate, Intensity: VI - VII) earthquake occurred 262.3 miles away from Monmouth County center
On 1/16/1994 at 01:49:16, a magnitude 4.6 (4.6 MB, 4.6 LG, Depth: 3.1 mi, Class: Light, Intensity: IV - V) earthquake occurred 100.8 miles away from the county center
On 10/7/1983 at 10:18:46, a magnitude 5.3 (5.1 MB, 5.3 LG, 5.1 ML) earthquake occurred 253.9 miles away from the county center
On 4/20/2002 at 10:50:47, a magnitude 5.3 (5.3 ML, Depth: 3.0 mi) earthquake occurred 293.2 miles away from the county center
On 4/20/2002 at 10:50:47, a magnitude 5.2 (5.2 MB, 4.2 MS, 5.2 MW, 5.0 MW) earthquake occurred 291.3 miles away from Monmouth County center
On 1/16/1994 at 00:42:43, a magnitude 4.2 (4.2 MB, 4.0 LG, Depth: 3.1 mi) earthquake occurred 99.2 miles away from the county center
Magnitude types: regional Lg-wave magnitude (LG), body-wave magnitude (MB), local magnitude (ML), surface-wave magnitude (MS), moment magnitude (MW)
Most recent natural disasters:
- New Jersey Tropical Storm Isaias, Incident Period: August 4, 2020, Major Disaster (Presidential) Declared DR-4574-NJ: December 11, 2020, FEMA Id: 4574, Natural disaster type: Tropical Storm
- New Jersey Covid-19 Pandemic, Incident Period: January 20, 2020, Major Disaster (Presidential) Declared DR-4488-NJ: March 25, 2020, FEMA Id: 4488, Natural disaster type: Other
- New Jersey Severe Winter Storm and Snowstorm, Incident Period: January 22, 2016 to January 24, 2016, Major Disaster (Presidential) Declared DR-4264: March 14, 2016, FEMA Id: 4264, Natural disaster type: Snowstorm, Winter Storm
- New Jersey Hurricane Sandy, Incident Period: October 26, 2012 to November 08, 2012, Emergency Declared EM-3354: October 28, 2012, FEMA Id: 3354, Natural disaster type: Hurricane
- New Jersey Hurricane Sandy, Incident Period: October 26, 2012 to November 08, 2012, Major Disaster (Presidential) Declared DR-4086: October 30, 2012, FEMA Id: 4086, Natural disaster type: Hurricane
- New Jersey Hurricane Irene, Incident Period: August 27, 2011 to September 05, 2011, Major Disaster (Presidential) Declared DR-4021: August 31, 2011, FEMA Id: 4021, Natural disaster type: Hurricane
- New Jersey Hurricane Irene, Incident Period: August 26, 2011 to September 05, 2011, Emergency Declared EM-3332: August 27, 2011, FEMA Id: 3332, Natural disaster type: Hurricane
- New Jersey Severe Winter Storm and Snowstorm, Incident Period: December 26, 2010 to December 27, 2010, Major Disaster (Presidential) Declared DR-1954: February 04, 2011, FEMA Id: 1954, Natural disaster type: Snowstorm, Winter Storm
- New Jersey Severe Storms and Flooding, Incident Period: March 12, 2010 to April 15, 2010, Major Disaster (Presidential) Declared DR-1897: April 02, 2010, FEMA Id: 1897, Natural disaster type: Storm, Flood
- New Jersey Hurricane Katrina Evacuation, Incident Period: August 29, 2005 to October 01, 2005, Emergency Declared EM-3257: September 19, 2005, FEMA Id: 3257, Natural disaster type: Hurricane
- 14 other natural disasters have been reported since 1953.
The number of natural disasters in Monmouth County (24) is greater than the US average (15).
Major Disasters (Presidential) Declared: 15
Emergencies Declared: 9
Causes of natural disasters: Hurricanes: 7, Floods: 5, Storms: 5, Snowstorms: 3, Blizzards: 2, Heavy Rains: 2, Water Shortages: 2, Winter Storms: 2, Tropical Storm: 1, Wind: 1, Other: 3 (Note: some incidents may be assigned to more than one category).
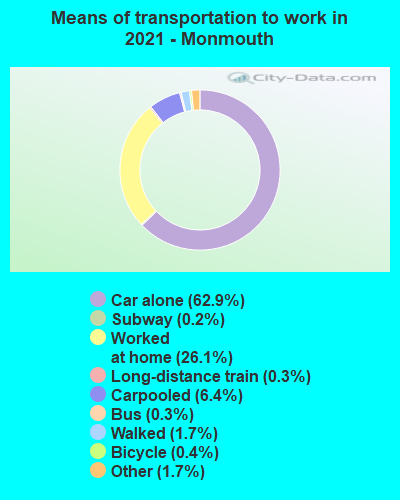
Means of transportation to work:
- Drove a car alone: 197,378 (64.4%)
- Carpooled: 23,847 (7.8%)
- Bus: 2,707 (0.9%)
- Subway or elevated rail: 546 (0.2%)
- Long-distance train or commuter rail: 1,103 (0.4%)
- Light rail, streetcar or trolley: 106 (0.0%)
- Ferryboat: 110 (0.0%)
- Taxicab, motorcycle, or other means: 7,175 (2.3%)
- Bicycle: 986 (0.3%)
- Walked: 6,019 (2.0%)
- Worked at home: 66,575 (21.7%)
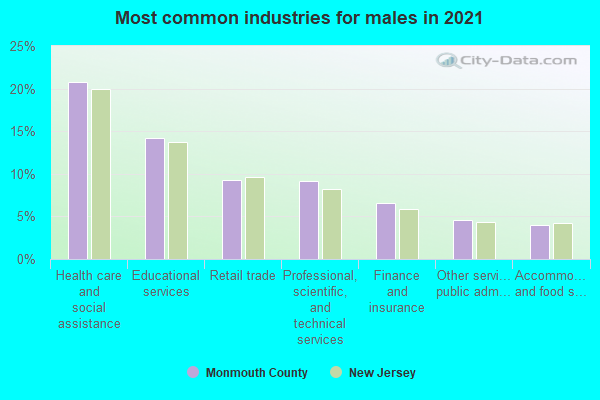
- Health care and social assistance (19%)
- Educational services (14%)
- Retail trade (12%)
- Professional, scientific, and technical services (9%)
- Finance and insurance (7%)
- Accommodation and food services (6%)
- Manufacturing (5%)
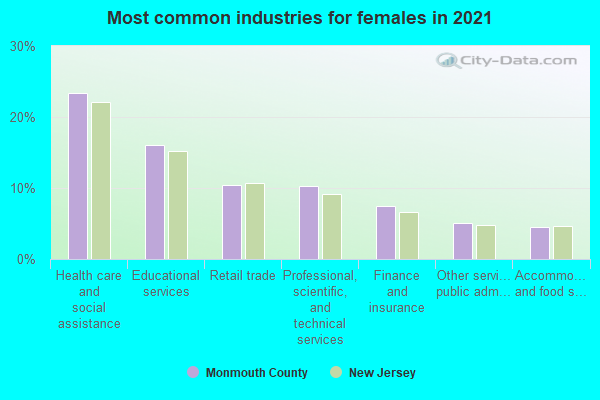
- Health care and social assistance (21%)
- Educational services (15%)
- Retail trade (13%)
- Professional, scientific, and technical services (10%)
- Finance and insurance (7%)
- Accommodation and food services (7%)
- Manufacturing (5%)
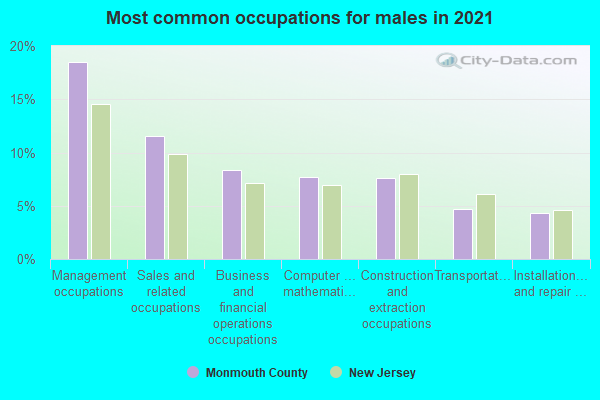
- Management occupations (18%)
- Sales and related occupations (13%)
- Business and financial operations occupations (10%)
- Construction and extraction occupations (7%)
- Computer and mathematical occupations (5%)
- Transportation occupations (5%)
- Architecture and engineering occupations (5%)
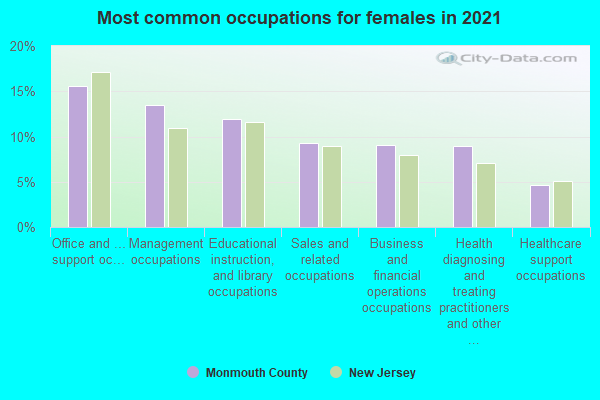
- Office and administrative support occupations (16%)
- Management occupations (12%)
- Sales and related occupations (12%)
- Educational instruction, and library occupations (11%)
- Health diagnosing and treating practitioners and other technical occupations (8%)
- Business and financial operations occupations (8%)
- Food preparation and serving related occupations (5%)
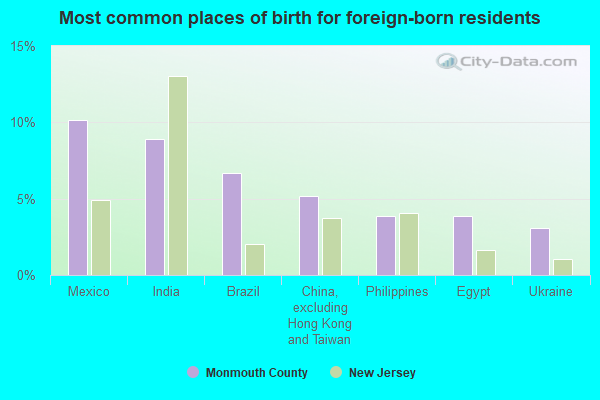
- Mexico (10%)
- India (9%)
- Brazil (6%)
- China, excluding Hong Kong and Taiwan (5%)
- Philippines (3%)
- Haiti (3%)
- Ukraine (3%)
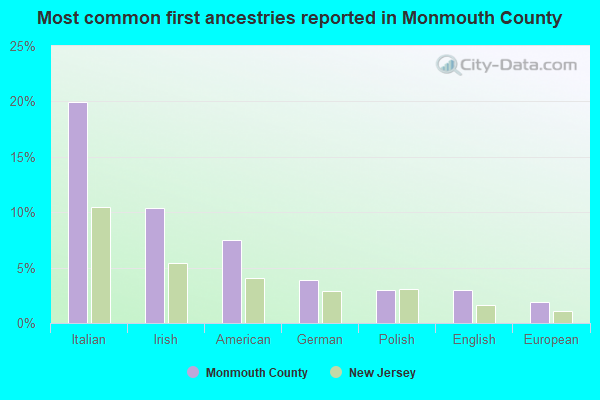
- Italian (20%)
- Irish (10%)
- American (8%)
- German (4%)
- Polish (3%)
- English (3%)
- Russian (2%)
People in group quarters in Monmouth County, New Jersey in 2010:
- 2,963 people in nursing facilities/skilled-nursing facilities
- 1,583 people in college/university student housing
- 1,305 people in local jails and other municipal confinement facilities
- 423 people in group homes intended for adults
- 362 people in other noninstitutional facilities
- 324 people in military barracks and dormitories (nondisciplinary)
- 260 people in emergency and transitional shelters (with sleeping facilities) for people experiencing homelessness
- 201 people in workers' group living quarters and job corps centers
- 115 people in residential treatment centers for adults
- 57 people in maritime/merchant vessels
- 52 people in correctional facilities intended for juveniles
- 12 people in residential treatment centers for juveniles (non-correctional)
- 8 people in group homes for juveniles (non-correctional)
- 5 people in in-patient hospice facilities
People in group quarters in Monmouth County, New Jersey in 2000:
- 3,650 people in nursing homes
- 1,469 people in college dormitories (includes college quarters off campus)
- 1,158 people in military ships
- 1,055 people in local jails and other confinement facilities (including police lockups)
- 869 people in other noninstitutional group quarters
- 327 people in military barracks, etc.
- 316 people in other nonhousehold living situations
- 246 people in religious group quarters
- 233 people in homes or halfway houses for drug/alcohol abuse
- 189 people in homes for the mentally ill
- 144 people in other group homes
- 132 people in state prisons
- 114 people in homes for the mentally retarded
- 56 people in short-term care, detention or diagnostic centers for delinquent children
- 36 people in agriculture workers' dormitories on farms
- 33 people in homes for the physically handicapped
- 6 people in homes for abused, dependent, and neglected children
- 3 people in military transient quarters for temporary residents
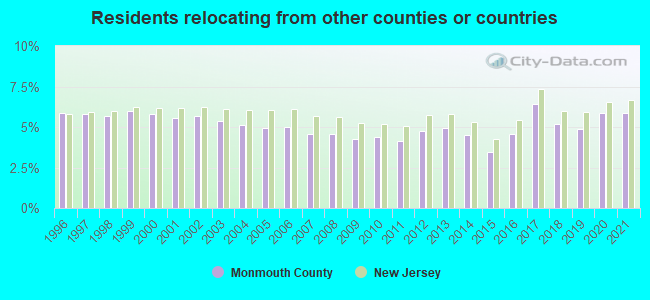
5.88% of this county's 2021 resident taxpayers lived in other counties in 2020 ($138,297 average adjusted gross income)
| Here: | 5.88% |
| New Jersey average: | 6.70% |
10 or fewer of this county's residents moved from foreign countries.
3.30% relocated from other counties in New Jersey ($75,940 average AGI)
2.58% relocated from other states ($62,357 average AGI)
Monmouth County: 2.58% New Jersey average: 2.98%
Top counties from which taxpayers relocated into this county between 2020 and 2021:
| from Ocean County, NJ | |
| from Middlesex County, NJ | |
| from Hudson County, NJ | |
| from Richmond County, NY | |
| from Kings County, NY | |
| from New York County, NY | |
| from Union County, NJ |
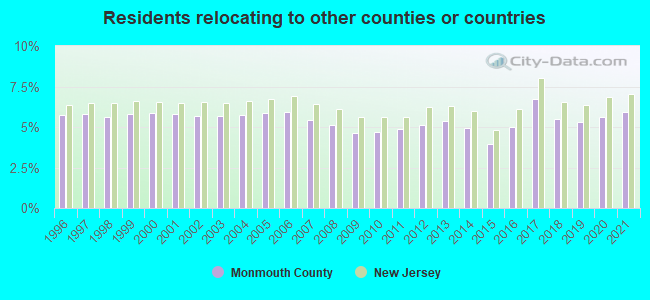
5.93% of this county's 2020 resident taxpayers moved to other counties in 2021 ($112,522 average adjusted gross income)
| Here: | 5.93% |
| New Jersey average: | 7.02% |
0.01% of residents moved to foreign countries ($114 average AGI)
Monmouth County: 0.01% New Jersey average: 0.02%
3.10% relocated to other counties in New Jersey ($46,753 average AGI)
2.83% relocated to other states ($65,655 average AGI)
Monmouth County: 2.83% New Jersey average: 3.32%
Top counties to which taxpayers relocated from this county between 2020 and 2021:
| to Ocean County, NJ | |
| to Middlesex County, NJ | |
| to Hudson County, NJ | |
| to New York County, NY | |
| to Palm Beach County, FL | |
| to Mercer County, NJ | |
| to Burlington County, NJ |
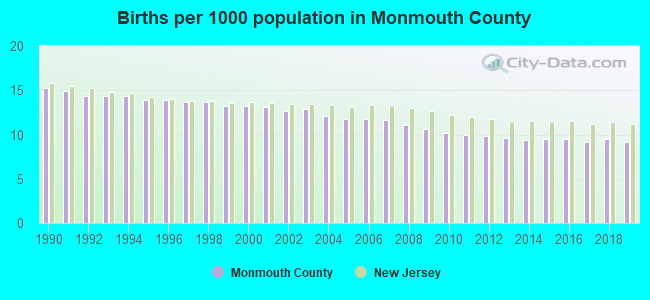
Births per 1000 population from 1990 to 1999: 14.1
Births per 1000 population from 2000 to 2009: 12.1
Births per 1000 population from 2010 to 2022: 8.1
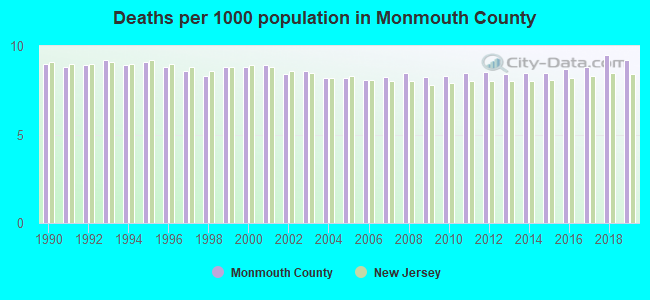
Deaths per 1000 population from 1990 to 1999: 8.8
Deaths per 1000 population from 2000 to 2009: 8.4
Deaths per 1000 population from 2010 to 2020: 8.9
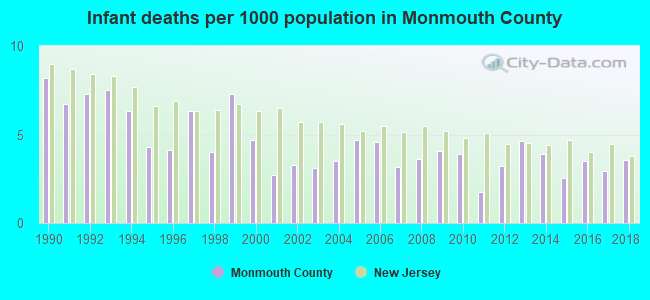
Infant deaths per 1000 live births from 1990 to 1999: 6.2
Infant deaths per 1000 live births from 2000 to 2009: 3.7
Infant deaths per 1000 live births from 2010 to 2021: 3.3
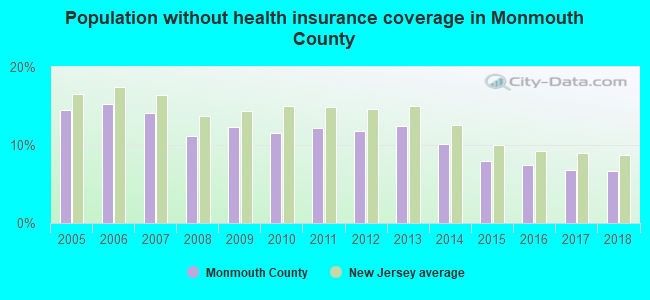
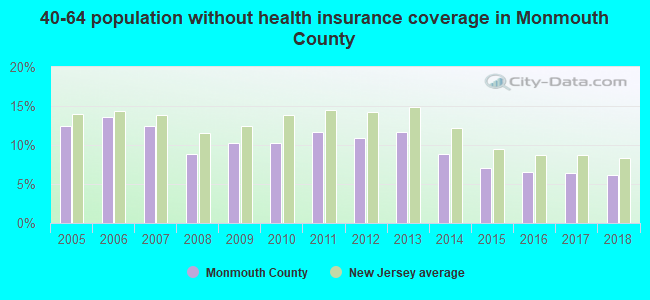
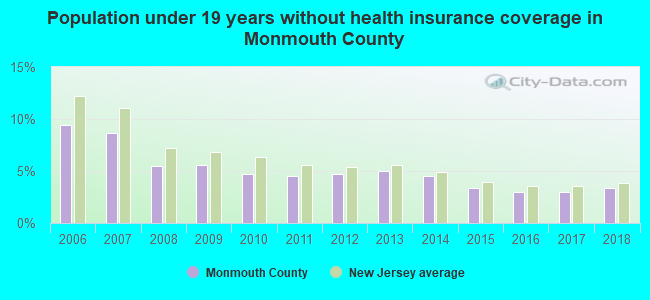
Persons under 19 years old without health insurance coverage in 2018: 3.4%

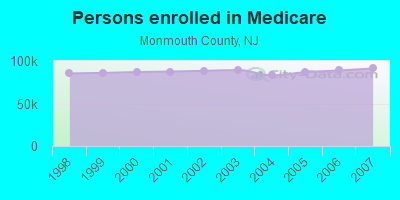
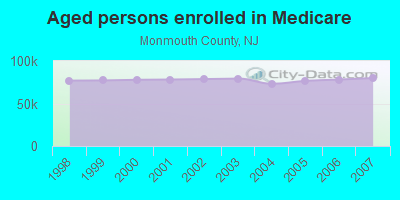
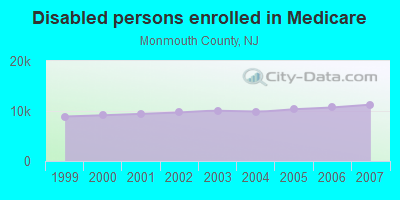
Persons enrolled in hospital insurance and/or supplemental medical insurance (Medicare) in July 1, 2007: 91,196 (79,924 aged, 11,272 disabled)
Children under 18 without health insurance coverage in 2007: 12,491 (8%)
Most common underlying causes of death in Monmouth County, New Jersey in 1999 - 2019:
- Atherosclerotic heart disease (10,585)
- Bronchus or lung, unspecified - Malignant neoplasms (6,789)
- Acute myocardial infarction, unspecified (5,902)
- Unspecified dementia (4,264)
- Chronic obstructive pulmonary disease, unspecified (3,891)
- Alzheimer disease, unspecified (3,245)
- Congestive heart failure (2,874)
- Stroke, not specified as haemorrhage or infarction (2,788)
- Septicaemia, unspecified (2,479)
- Breast, unspecified - Malignant neoplasms (2,257)
Population without health insurance coverage in 2000: 10%
Children under 18 without health insurance coverage in 2000: 8%
Short term general hospital admissions per 100,000 population in 2004: 12,998
Short term general hospital beds per 100,000 population in 2004: 220
Emergency room visits per 100,000 population in 2004: 31,294
General practice office based MDs per 100,000 population in 2005: 1,104
Medical specialist MDs per 100,000 population in 2005: 801
Dentists per 100,000 population in 1998: 21
Total births per 100,000 population, July 2005 - July 2006 : 74
Total deaths per 100,000 population, July 2005 - July 2006: 107
Limited-service eating places per 100,000 population in 2005 : 22
Beer, wine & liquor stores per 100,000 population in 2005: 1
Fitness & recreation sports centers per 100,000 population in 2005: 3,151
EPA green book nonattainment status in 2004-2006: 1
Suicides per 1,000,000 population from 2000 to 2006: 71.6. This is more than state average.
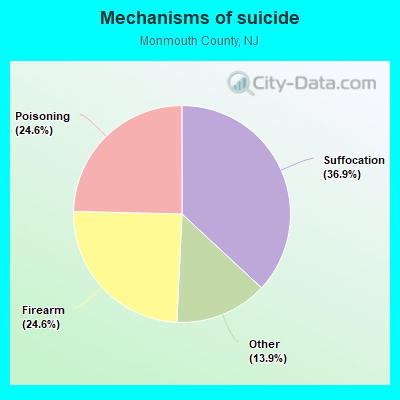
- Suffocation - 26.4
- Firearm - 17.6
- Poisoning - 17.6
- Other - 9.9
Household type by relationship:
Households: 644,098- Male householders: 126,066 (25,288 living alone), Female householders: 127,701 (40,595 living alone)
141,292 spouses (139,666 opposite-sex spouses), 14,199 unmarried partners, (13,447 opposite-sex unmarried partners), 191,881 children (182,822 natural, 4,034 adopted, 5,025 stepchildren), 9,594 grandchildren, 4,128 brothers or sisters, 7,557 parents, 65 foster children, 7,649 other relatives, 6,653 non-relatives
- In group quarters: 7,313
Size of family households: 73,680 2-persons, 40,096 3-persons, 38,640 4-persons, 17,759 5-persons, 3,793 6-persons, 1,881 7-or-more-persons.
Size of nonfamily households: 65,883 1-person, 11,379 2-persons, 337 3-persons, 319 4-persons.
97,735 married couples with children.
23,884 single-parent households (6,770 men, 17,114 women).
81.9% of residents of Monmouth speak English at home.
6.2% of residents speak Spanish at home (58% speak English very well, 23% speak English well, 17% speak English not well, 2% don't speak English at all).
8.0% of residents speak other Indo-European language at home (68% speak English very well, 18% speak English well, 12% speak English not well, 2% don't speak English at all).
3.0% of residents speak Asian or Pacific Island language at home (66% speak English very well, 21% speak English well, 11% speak English not well, 1% don't speak English at all).
0.9% of residents speak other language at home (91% speak English very well, 5% speak English well, 3% speak English not well).
In fiscal year 2004:
Federal Government expenditure: $4,298,847,000 ($6,756 per capita)
Department of Defense expenditure: $1,233,759,000
Federal direct payments to individuals for retirement and disability: $1,477,340,000
Federal other direct payments to individuals: $757,508,000
Federal direct payments not to individuals: $7,283,000
Federal grants: $464,068,000
Federal procurement contracts: $1,114,451,000 ($872,878,000 Department of Defense)
Federal salaries and wages: $478,197,000 ($310,947,000 Department of Defense)
Federal Government direct loans: $33,479,000
Federal guaranteed/insured loans: $314,467,000
Federal Government insurance: $2,561,359,000
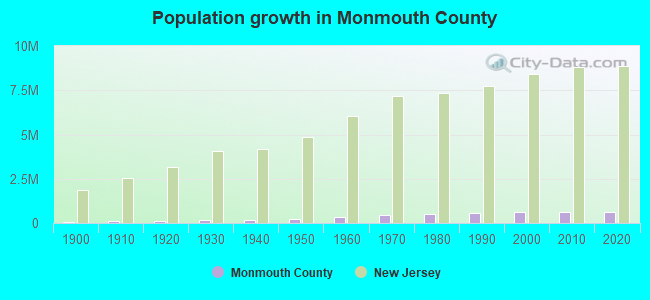
Population change from April 1, 2000 to July 1, 2005:
Births: 41,338| Here: | 65 per 1000 residents |
| State: | 69 per 1000 residents |
Deaths: 28,142
| Here: | 44 per 1000 residents |
| State: | 44 per 1000 residents |
Net international migration: +10,868
| Here: | +17 per 1000 residents |
| State: | +33 per 1000 residents |
Net internal migration: -2,665
| Here: | |
| State: |
Total withdrawal of fresh water for public supply: 56.48 millions of gallons per day (31% from ground, 69% from surface)
| Here: | 7.3 |
| State: | 6.8 |
| Here: | 3.9 |
| State: | 3.9 |
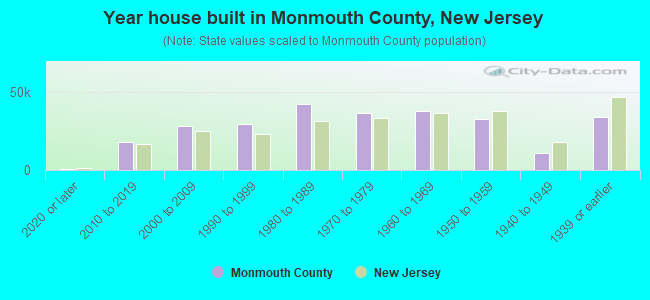
- Year house built in Monmouth County, New Jersey
- 2,7472020 or later
- 17,8172010 to 2019
- 26,4092000 to 2009
- 29,2821990 to 1999
- 41,7481980 to 1989
- 35,6501970 to 1979
- 36,8641960 to 1969
- 35,2021950 to 1959
- 9,2991940 to 1949
- 35,1691939 or earlier
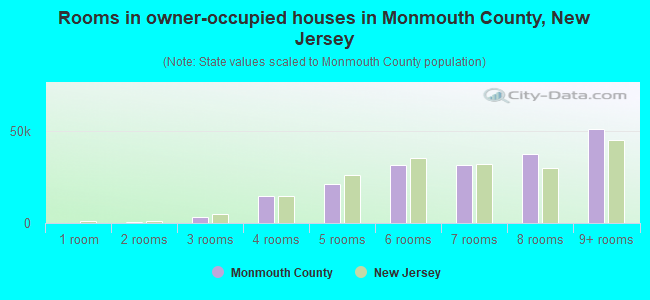
- Rooms in owner-occupied houses in Monmouth County, New Jersey
- 5291 room
- 1,5672 rooms
- 3,4103 rooms
- 14,3784 rooms
- 22,4135 rooms
- 29,3876 rooms
- 32,0647 rooms
- 33,1348 rooms
- 56,4699+ rooms
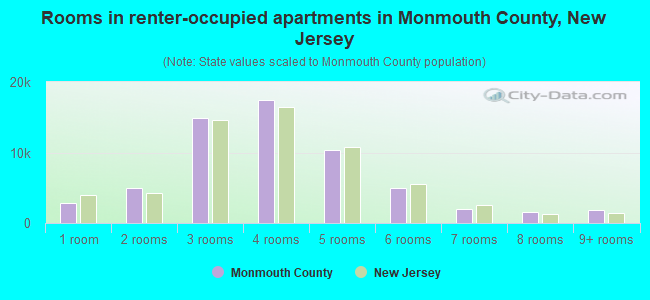
- Rooms in renter-occupied apartments in Monmouth County, New Jersey
- 2,6881 room
- 5,4772 rooms
- 15,3013 rooms
- 17,0144 rooms
- 8,7265 rooms
- 6,0856 rooms
- 1,9777 rooms
- 1,9478 rooms
- 1,2019+ rooms
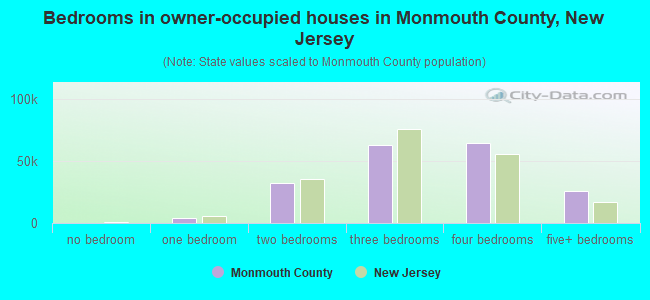
- Bedrooms in owner-occupied houses in Monmouth County, New Jersey
- 810no bedroom
- 5,3351 bedroom
- 34,3742 bedrooms
- 63,5763 bedrooms
- 67,1344 bedrooms
- 22,1225+ bedrooms
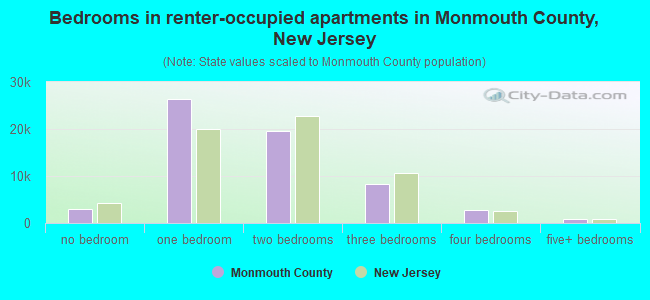
- Bedrooms in renter-occupied apartments in Monmouth County, New Jersey
- 3,043no bedroom
- 26,3161 bedroom
- 19,2402 bedrooms
- 8,8973 bedrooms
- 2,3994 bedrooms
- 5215+ bedrooms
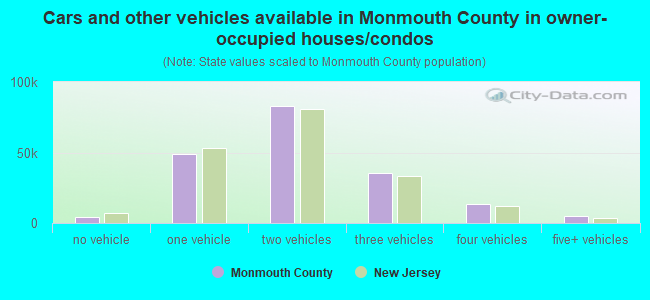
- Cars and other vehicles available in Monmouth County in owner-occupied houses/condos
- 5,452no vehicle
- 47,2551 vehicle
- 86,5852 vehicles
- 37,4123 vehicles
- 12,9214 vehicles
- 3,7265+ vehicles
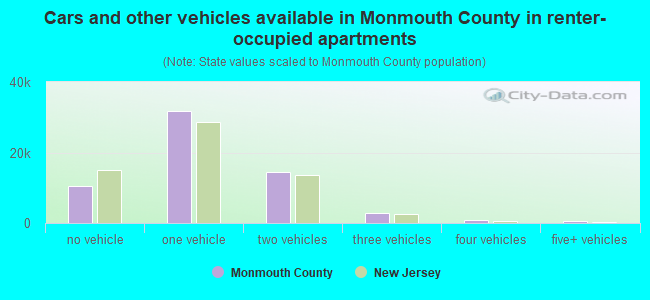
- Cars and other vehicles available in Monmouth County in renter-occupied apartments
- 11,842no vehicle
- 29,9881 vehicle
- 15,0992 vehicles
- 2,4533 vehicles
- 8794 vehicles
- 1555+ vehicles
93.0% of Monmouth County residents lived in the same house 1 years ago.
Out of people who lived in different houses, 32% lived in this county.
Out of people who lived in different counties, 62% lived in New Jersey.
| Monmouth County: | 93.0% |
| State average: | 90.4% |
Place of birth for U.S.-born residents:
- This state: 365,359
- Other state: 183,042
- Northeast: 144,270
- Midwest: 9,798
- South: 20,765
- West: 8,209
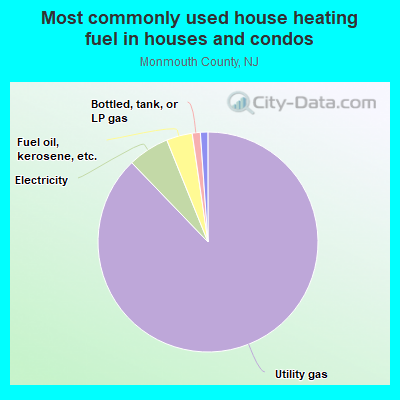
- 87.0%Utility gas
- 7.2%Electricity
- 3.7%Fuel oil, kerosene, etc.
- 1.4%Bottled, tank, or LP gas
- 0.3%Solar energy
- 0.2%Wood
- 0.1%No fuel used
- 0.1%Other fuel
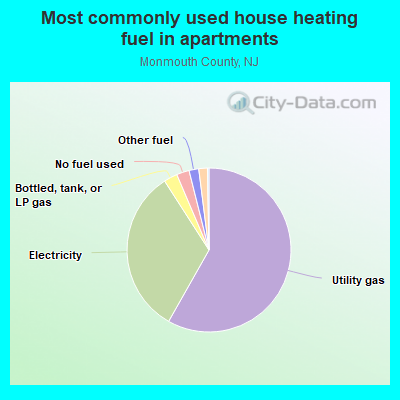
- 60.3%Utility gas
- 32.7%Electricity
- 3.2%Bottled, tank, or LP gas
- 1.7%No fuel used
- 1.3%Fuel oil, kerosene, etc.
- 0.9%Other fuel
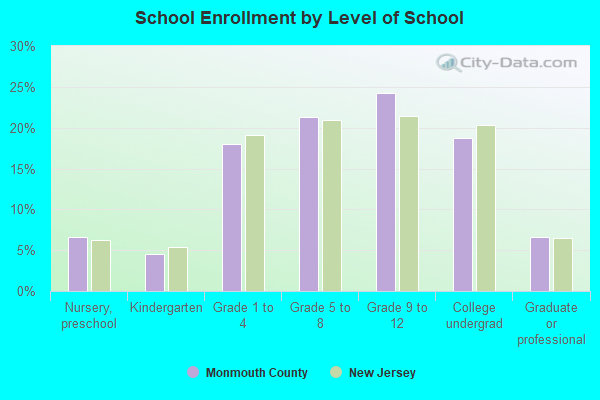
Private vs. public school enrollment:
| Here: | 8.4% |
| New Jersey: | 12.3% |
| Here: | 13.1% |
| New Jersey: | 13.1% |
| Here: | 28.2% |
| New Jersey: | 33.2% |
Monmouth County government finances - Expenditure in 2020:
- Bond Funds - Cash and Securities: $118,976,000
Cash and Securities: $100,594,000
- Charges - Other: $43,618,000
Higher Education - Other: $31,287,000
Other: $31,017,000
Higher Education - Other: $30,705,000
Solid Waste Management: $29,413,000
Solid Waste Management: $27,300,000
Parks and Recreation: $7,867,000
Parks and Recreation: $7,396,000
Higher Education Auxiliary Enterprises: $4,728,000
Elementary and Secondary Education School Tuition and Transportation: $2,949,000
Higher Education Auxiliary Enterprises: $1,246,000
Regular Highways: $713,000
Elementary and Secondary Education School Lunch: $10,000
Elementary and Secondary Education School Lunch: $4,000
- Construction - Other Higher Education: $4,475,000
Other Higher Education: $3,500,000
- Current Operations - General - Other: $133,309,000
Other Higher Education: $81,781,000
Other Higher Education: $79,373,000
General - Other: $60,556,000
Elementary and Secondary Education: $47,708,000
Elementary and Secondary Education: $47,482,000
Correctional Institutions: $41,659,000
Correctional Institutions: $40,717,000
Solid Waste Management: $32,013,000
Public Welfare - Other: $31,255,000
Public Welfare - Other: $30,767,000
Regular Highways: $29,766,000
Police Protection: $29,261,000
Police Protection: $27,474,000
Judicial and Legal Services: $24,967,000
Judicial and Legal Services: $23,098,000
Public Welfare Institutions: $21,924,000
Parks and Recreation: $18,802,000
Regular Highways: $17,978,000
Central Staff Services: $16,326,000
Central Staff Services: $15,249,000
General Public Buildings: $13,648,000
General Public Buildings: $12,453,000
Financial Administration: $6,650,000
Financial Administration: $5,761,000
Higher Education Auxiliary Enterprises: $5,711,000
Public Welfare Institutions: $4,060,000
Health - Other: $2,990,000
Higher Education Auxiliary Enterprises: $2,169,000
Natural Resources - Other: $1,822,000
Protective Inspection and Regulation - Other: $1,437,000
Parks and Recreation: $1,295,000
Natural Resources - Other: $1,287,000
Health - Other: $1,015,000
Local Fire Protection: $625,000
Local Fire Protection: $575,000
Housing and Community Development: $450,000
Housing and Community Development: $428,000
- Federal Intergovernmental - Education: $12,272,000
Education: $12,031,000
Housing and Community Development: $450,000
Housing and Community Development: $428,000
- General - Interest on Debt: $18,241,000
Interest on Debt: $15,645,000
- Intergovernmental to State - Hospitals: $33,157,000
Elementary and Secondary Education: $81,000
Elementary and Secondary Education: $81,000
- Local Intergovernmental - Education: $37,509,000
Education: $34,404,000
- Long Term Debt - Outstanding Unspecified Public Purpose: $489,062,000
Beginning Outstanding - Unspecified Public Purpose: $456,022,000
Outstanding Unspecified Public Purpose: $362,860,000
Beginning Outstanding - Unspecified Public Purpose: $324,169,000
Issue, Unspecified Public Purpose: $105,695,000
Issue, Unspecified Public Purpose: $84,530,000
Retired Unspecified Public Purpose: $67,004,000
Retired Unspecified Public Purpose: $51,490,000
- Miscellaneous - General Revenue - Other: $28,425,000
Interest Earnings: $4,988,000
Interest Earnings: $2,064,000
General Revenue - Other: $2,037,000
Donations From Private Sources: $447,000
Rents: $414,000
Donations From Private Sources: $302,000
Fines and Forfeits: $36,000
- Other Capital Outlay - Other Higher Education: $573,000
Other Higher Education: $317,000
Elementary and Secondary Education: $174,000
Elementary and Secondary Education: $55,000
- Other Funds - Cash and Securities: $159,972,000
Cash and Securities: $148,790,000
- Short Term Debt Outstanding - Beginning: $33,880,000
- Sinking Funds - Cash and Securities: $470,876,000
Cash and Securities: $449,620,000
- State Intergovernmental - Highways: $53,145,000
Health and Hospitals: $26,660,000
Public Welfare: $25,912,000
Education: $24,075,000
Education: $20,953,000
Other: $20,814,000
Other: $8,530,000
Health and Hospitals: $2,188,000
Highways: $1,697,000
- Tax - Property: $305,500,000
Property: $302,475,000
Other License: $118,000
- Total Salaries and Wages: $28,183,000
: $27,575,000
Monmouth County government finances - Revenue in 2020:
- Bond Funds - Cash and Securities: $118,976,000
Cash and Securities: $100,594,000
- Charges - Other: $43,618,000
Higher Education - Other: $31,287,000
Other: $31,017,000
Higher Education - Other: $30,705,000
Solid Waste Management: $29,413,000
Solid Waste Management: $27,300,000
Parks and Recreation: $7,867,000
Parks and Recreation: $7,396,000
Higher Education Auxiliary Enterprises: $4,728,000
Elementary and Secondary Education School Tuition and Transportation: $2,949,000
Higher Education Auxiliary Enterprises: $1,246,000
Regular Highways: $713,000
Elementary and Secondary Education School Lunch: $10,000
Elementary and Secondary Education School Lunch: $4,000
- Construction - Other Higher Education: $4,475,000
Other Higher Education: $3,500,000
- Current Operations - General - Other: $133,309,000
Other Higher Education: $81,781,000
Other Higher Education: $79,373,000
General - Other: $60,556,000
Elementary and Secondary Education: $47,708,000
Elementary and Secondary Education: $47,482,000
Correctional Institutions: $41,659,000
Correctional Institutions: $40,717,000
Solid Waste Management: $32,013,000
Public Welfare - Other: $31,255,000
Public Welfare - Other: $30,767,000
Regular Highways: $29,766,000
Police Protection: $29,261,000
Police Protection: $27,474,000
Judicial and Legal Services: $24,967,000
Judicial and Legal Services: $23,098,000
Public Welfare Institutions: $21,924,000
Parks and Recreation: $18,802,000
Regular Highways: $17,978,000
Central Staff Services: $16,326,000
Central Staff Services: $15,249,000
General Public Buildings: $13,648,000
General Public Buildings: $12,453,000
Financial Administration: $6,650,000
Financial Administration: $5,761,000
Higher Education Auxiliary Enterprises: $5,711,000
Public Welfare Institutions: $4,060,000
Health - Other: $2,990,000
Higher Education Auxiliary Enterprises: $2,169,000
Natural Resources - Other: $1,822,000
Protective Inspection and Regulation - Other: $1,437,000
Parks and Recreation: $1,295,000
Natural Resources - Other: $1,287,000
Health - Other: $1,015,000
Local Fire Protection: $625,000
Local Fire Protection: $575,000
Housing and Community Development: $450,000
Housing and Community Development: $428,000
- Federal Intergovernmental - Education: $12,272,000
Education: $12,031,000
Housing and Community Development: $450,000
Housing and Community Development: $428,000
- General - Interest on Debt: $18,241,000
Interest on Debt: $15,645,000
- Intergovernmental to State - Hospitals: $33,157,000
Elementary and Secondary Education: $81,000
Elementary and Secondary Education: $81,000
- Local Intergovernmental - Education: $37,509,000
Education: $34,404,000
- Long Term Debt - Outstanding Unspecified Public Purpose: $489,062,000
Beginning Outstanding - Unspecified Public Purpose: $456,022,000
Outstanding Unspecified Public Purpose: $362,860,000
Beginning Outstanding - Unspecified Public Purpose: $324,169,000
Issue, Unspecified Public Purpose: $105,695,000
Issue, Unspecified Public Purpose: $84,530,000
Retired Unspecified Public Purpose: $67,004,000
Retired Unspecified Public Purpose: $51,490,000
- Miscellaneous - General Revenue - Other: $28,425,000
Interest Earnings: $4,988,000
Interest Earnings: $2,064,000
General Revenue - Other: $2,037,000
Donations From Private Sources: $447,000
Rents: $414,000
Donations From Private Sources: $302,000
Fines and Forfeits: $36,000
- Other Capital Outlay - Other Higher Education: $573,000
Other Higher Education: $317,000
Elementary and Secondary Education: $174,000
Elementary and Secondary Education: $55,000
- Other Funds - Cash and Securities: $159,972,000
Cash and Securities: $148,790,000
- Short Term Debt Outstanding - Beginning: $33,880,000
- Sinking Funds - Cash and Securities: $470,876,000
Cash and Securities: $449,620,000
- State Intergovernmental - Highways: $53,145,000
Health and Hospitals: $26,660,000
Public Welfare: $25,912,000
Education: $24,075,000
Education: $20,953,000
Other: $20,814,000
Other: $8,530,000
Health and Hospitals: $2,188,000
Highways: $1,697,000
- Tax - Property: $305,500,000
Property: $302,475,000
Other License: $118,000
- Total Salaries and Wages: $28,183,000
: $27,575,000
Monmouth County government finances - Debt in 2020:
- Bond Funds - Cash and Securities: $118,976,000
Cash and Securities: $100,594,000
- Charges - Other: $43,618,000
Higher Education - Other: $31,287,000
Other: $31,017,000
Higher Education - Other: $30,705,000
Solid Waste Management: $29,413,000
Solid Waste Management: $27,300,000
Parks and Recreation: $7,867,000
Parks and Recreation: $7,396,000
Higher Education Auxiliary Enterprises: $4,728,000
Elementary and Secondary Education School Tuition and Transportation: $2,949,000
Higher Education Auxiliary Enterprises: $1,246,000
Regular Highways: $713,000
Elementary and Secondary Education School Lunch: $10,000
Elementary and Secondary Education School Lunch: $4,000
- Construction - Other Higher Education: $4,475,000
Other Higher Education: $3,500,000
- Current Operations - General - Other: $133,309,000
Other Higher Education: $81,781,000
Other Higher Education: $79,373,000
General - Other: $60,556,000
Elementary and Secondary Education: $47,708,000
Elementary and Secondary Education: $47,482,000
Correctional Institutions: $41,659,000
Correctional Institutions: $40,717,000
Solid Waste Management: $32,013,000
Public Welfare - Other: $31,255,000
Public Welfare - Other: $30,767,000
Regular Highways: $29,766,000
Police Protection: $29,261,000
Police Protection: $27,474,000
Judicial and Legal Services: $24,967,000
Judicial and Legal Services: $23,098,000
Public Welfare Institutions: $21,924,000
Parks and Recreation: $18,802,000
Regular Highways: $17,978,000
Central Staff Services: $16,326,000
Central Staff Services: $15,249,000
General Public Buildings: $13,648,000
General Public Buildings: $12,453,000
Financial Administration: $6,650,000
Financial Administration: $5,761,000
Higher Education Auxiliary Enterprises: $5,711,000
Public Welfare Institutions: $4,060,000
Health - Other: $2,990,000
Higher Education Auxiliary Enterprises: $2,169,000
Natural Resources - Other: $1,822,000
Protective Inspection and Regulation - Other: $1,437,000
Parks and Recreation: $1,295,000
Natural Resources - Other: $1,287,000
Health - Other: $1,015,000
Local Fire Protection: $625,000
Local Fire Protection: $575,000
Housing and Community Development: $450,000
Housing and Community Development: $428,000
- Federal Intergovernmental - Education: $12,272,000
Education: $12,031,000
Housing and Community Development: $450,000
Housing and Community Development: $428,000
- General - Interest on Debt: $18,241,000
Interest on Debt: $15,645,000
- Intergovernmental to State - Hospitals: $33,157,000
Elementary and Secondary Education: $81,000
Elementary and Secondary Education: $81,000
- Local Intergovernmental - Education: $37,509,000
Education: $34,404,000
- Long Term Debt - Outstanding Unspecified Public Purpose: $489,062,000
Beginning Outstanding - Unspecified Public Purpose: $456,022,000
Outstanding Unspecified Public Purpose: $362,860,000
Beginning Outstanding - Unspecified Public Purpose: $324,169,000
Issue, Unspecified Public Purpose: $105,695,000
Issue, Unspecified Public Purpose: $84,530,000
Retired Unspecified Public Purpose: $67,004,000
Retired Unspecified Public Purpose: $51,490,000
- Miscellaneous - General Revenue - Other: $28,425,000
Interest Earnings: $4,988,000
Interest Earnings: $2,064,000
General Revenue - Other: $2,037,000
Donations From Private Sources: $447,000
Rents: $414,000
Donations From Private Sources: $302,000
Fines and Forfeits: $36,000
- Other Capital Outlay - Other Higher Education: $573,000
Other Higher Education: $317,000
Elementary and Secondary Education: $174,000
Elementary and Secondary Education: $55,000
- Other Funds - Cash and Securities: $159,972,000
Cash and Securities: $148,790,000
- Short Term Debt Outstanding - Beginning: $33,880,000
- Sinking Funds - Cash and Securities: $470,876,000
Cash and Securities: $449,620,000
- State Intergovernmental - Highways: $53,145,000
Health and Hospitals: $26,660,000
Public Welfare: $25,912,000
Education: $24,075,000
Education: $20,953,000
Other: $20,814,000
Other: $8,530,000
Health and Hospitals: $2,188,000
Highways: $1,697,000
- Tax - Property: $305,500,000
Property: $302,475,000
Other License: $118,000
- Total Salaries and Wages: $28,183,000
: $27,575,000
Monmouth County government finances - Cash and Securities in 2020:
- Bond Funds - Cash and Securities: $118,976,000
Cash and Securities: $100,594,000
- Charges - Other: $43,618,000
Higher Education - Other: $31,287,000
Other: $31,017,000
Higher Education - Other: $30,705,000
Solid Waste Management: $29,413,000
Solid Waste Management: $27,300,000
Parks and Recreation: $7,867,000
Parks and Recreation: $7,396,000
Higher Education Auxiliary Enterprises: $4,728,000
Elementary and Secondary Education School Tuition and Transportation: $2,949,000
Higher Education Auxiliary Enterprises: $1,246,000
Regular Highways: $713,000
Elementary and Secondary Education School Lunch: $10,000
Elementary and Secondary Education School Lunch: $4,000
- Construction - Other Higher Education: $4,475,000
Other Higher Education: $3,500,000
- Current Operations - General - Other: $133,309,000
Other Higher Education: $81,781,000
Other Higher Education: $79,373,000
General - Other: $60,556,000
Elementary and Secondary Education: $47,708,000
Elementary and Secondary Education: $47,482,000
Correctional Institutions: $41,659,000
Correctional Institutions: $40,717,000
Solid Waste Management: $32,013,000
Public Welfare - Other: $31,255,000
Public Welfare - Other: $30,767,000
Regular Highways: $29,766,000
Police Protection: $29,261,000
Police Protection: $27,474,000
Judicial and Legal Services: $24,967,000
Judicial and Legal Services: $23,098,000
Public Welfare Institutions: $21,924,000
Parks and Recreation: $18,802,000
Regular Highways: $17,978,000
Central Staff Services: $16,326,000
Central Staff Services: $15,249,000
General Public Buildings: $13,648,000
General Public Buildings: $12,453,000
Financial Administration: $6,650,000
Financial Administration: $5,761,000
Higher Education Auxiliary Enterprises: $5,711,000
Public Welfare Institutions: $4,060,000
Health - Other: $2,990,000
Higher Education Auxiliary Enterprises: $2,169,000
Natural Resources - Other: $1,822,000
Protective Inspection and Regulation - Other: $1,437,000
Parks and Recreation: $1,295,000
Natural Resources - Other: $1,287,000
Health - Other: $1,015,000
Local Fire Protection: $625,000
Local Fire Protection: $575,000
Housing and Community Development: $450,000
Housing and Community Development: $428,000
- Federal Intergovernmental - Education: $12,272,000
Education: $12,031,000
Housing and Community Development: $450,000
Housing and Community Development: $428,000
- General - Interest on Debt: $18,241,000
Interest on Debt: $15,645,000
- Intergovernmental to State - Hospitals: $33,157,000
Elementary and Secondary Education: $81,000
Elementary and Secondary Education: $81,000
- Local Intergovernmental - Education: $37,509,000
Education: $34,404,000
- Long Term Debt - Outstanding Unspecified Public Purpose: $489,062,000
Beginning Outstanding - Unspecified Public Purpose: $456,022,000
Outstanding Unspecified Public Purpose: $362,860,000
Beginning Outstanding - Unspecified Public Purpose: $324,169,000
Issue, Unspecified Public Purpose: $105,695,000
Issue, Unspecified Public Purpose: $84,530,000
Retired Unspecified Public Purpose: $67,004,000
Retired Unspecified Public Purpose: $51,490,000
- Miscellaneous - General Revenue - Other: $28,425,000
Interest Earnings: $4,988,000
Interest Earnings: $2,064,000
General Revenue - Other: $2,037,000
Donations From Private Sources: $447,000
Rents: $414,000
Donations From Private Sources: $302,000
Fines and Forfeits: $36,000
- Other Capital Outlay - Other Higher Education: $573,000
Other Higher Education: $317,000
Elementary and Secondary Education: $174,000
Elementary and Secondary Education: $55,000
- Other Funds - Cash and Securities: $159,972,000
Cash and Securities: $148,790,000
- Short Term Debt Outstanding - Beginning: $33,880,000
- Sinking Funds - Cash and Securities: $470,876,000
Cash and Securities: $449,620,000
- State Intergovernmental - Highways: $53,145,000
Health and Hospitals: $26,660,000
Public Welfare: $25,912,000
Education: $24,075,000
Education: $20,953,000
Other: $20,814,000
Other: $8,530,000
Health and Hospitals: $2,188,000
Highways: $1,697,000
- Tax - Property: $305,500,000
Property: $302,475,000
Other License: $118,000
- Total Salaries and Wages: $28,183,000
: $27,575,000
Supplemental Security Income (SSI) in 2006:
- Total number of recipients: 6,926
- Number of aged recipients: 1,393
- Number of blind and disabled recipients: 5,533
- Number of recipients under 18: 823
- Number of recipients between 18 and 64: 3,972
- Number of recipients older than 64: 2,131
- Number of recipients also receiving OASDI: 2,521
- Amount of payments (thousands of dollars): 3,098
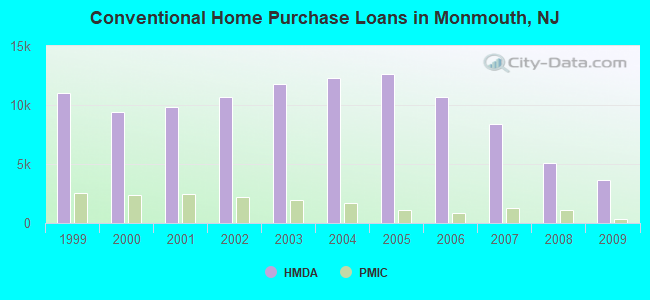
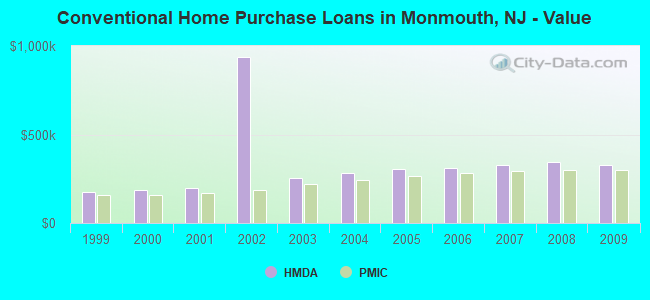
| Home Mortgage Disclosure Act Aggregated Statistics For Year 2009 (Based on 141 full tracts) | ||||||||||||||
| A) FHA, FSA/RHS & VA Home Purchase Loans | B) Conventional Home Purchase Loans | C) Refinancings | D) Home Improvement Loans | E) Loans on Dwellings For 5+ Families | F) Non-occupant Loans on < 5 Family Dwellings (A B C & D) | G) Loans On Manufactured Home Dwelling (A B C & D) | ||||||||
|---|---|---|---|---|---|---|---|---|---|---|---|---|---|---|
| Number | Average Value | Number | Average Value | Number | Average Value | Number | Average Value | Number | Average Value | Number | Average Value | Number | Average Value | |
| LOANS ORIGINATED | 1,739 | $284,221 | 3,682 | $329,173 | 19,270 | $295,514 | 956 | $159,596 | 23 | $2,865,304 | 1,505 | $347,654 | 24 | $65,333 |
| APPLICATIONS APPROVED, NOT ACCEPTED | 166 | $296,054 | 476 | $345,023 | 1,699 | $299,685 | 131 | $160,977 | 3 | $1,129,000 | 143 | $375,462 | 7 | $41,429 |
| APPLICATIONS DENIED | 351 | $275,678 | 624 | $330,054 | 6,366 | $327,726 | 633 | $98,325 | 3 | $645,000 | 612 | $359,284 | 22 | $49,909 |
| APPLICATIONS WITHDRAWN | 258 | $280,329 | 555 | $326,407 | 4,081 | $305,387 | 196 | $180,520 | 3 | $4,780,000 | 292 | $318,616 | 3 | $41,000 |
| FILES CLOSED FOR INCOMPLETENESS | 75 | $283,200 | 134 | $388,455 | 1,072 | $325,045 | 51 | $169,882 | 0 | $0 | 70 | $525,171 | 3 | $54,667 |
| Private Mortgage Insurance Companies Aggregated Statistics For Year 2009 (Based on 130 full tracts) | ||||||
| A) Conventional Home Purchase Loans | B) Refinancings | C) Non-occupant Loans on < 5 Family Dwellings (A & B) | ||||
|---|---|---|---|---|---|---|
| Number | Average Value | Number | Average Value | Number | Average Value | |
| LOANS ORIGINATED | 381 | $299,782 | 190 | $323,795 | 7 | $319,000 |
| APPLICATIONS APPROVED, NOT ACCEPTED | 169 | $329,491 | 117 | $344,684 | 4 | $340,000 |
| APPLICATIONS DENIED | 73 | $306,548 | 96 | $351,198 | 3 | $380,667 |
| APPLICATIONS WITHDRAWN | 31 | $369,355 | 31 | $328,290 | 1 | $415,000 |
| FILES CLOSED FOR INCOMPLETENESS | 14 | $328,000 | 6 | $1,253,500 | 2 | $260,500 |
| Most common first names in Monmouth County, NJ among deceased individuals | ||
| Name | Count | Lived (average) |
|---|---|---|
| John | 5,238 | 74.1 years |
| Mary | 4,419 | 80.8 years |
| William | 3,883 | 74.8 years |
| Joseph | 3,429 | 75.3 years |
| Helen | 2,485 | 80.5 years |
| James | 2,483 | 72.5 years |
| Margaret | 2,334 | 79.9 years |
| George | 2,326 | 75.4 years |
| Charles | 2,297 | 75.5 years |
| Robert | 2,221 | 69.9 years |
| Most common last names in Monmouth County, NJ among deceased individuals | ||
| Last name | Count | Lived (average) |
|---|---|---|
| Smith | 1,305 | 76.2 years |
| Johnson | 779 | 74.6 years |
| Brown | 715 | 75.4 years |
| Miller | 564 | 77.1 years |
| Williams | 561 | 72.3 years |
| Jones | 525 | 74.8 years |
| White | 444 | 75.6 years |
| Wilson | 388 | 75.2 years |
| Davis | 381 | 74.0 years |
| Anderson | 367 | 76.7 years |
| Businesses in Monmouth County, NJ | ||||
| Name | Count | Name | Count | |
|---|---|---|---|---|
| 7-Eleven | 34 | Justice | 3 | |
| A&P | 5 | KFC | 4 | |
| ALDI | 3 | Kincaid | 1 | |
| ALDO | 4 | Kmart | 4 | |
| AMF Bowling | 1 | Kohl's | 4 | |
| AT&T | 10 | Kroger | 1 | |
| Abercrombie & Fitch | 2 | La Quinta | 1 | |
| Abercrombie Kids | 2 | La-Z-Boy | 3 | |
| Ace Hardware | 1 | Lane Bryant | 2 | |
| Advance Auto Parts | 3 | Lane Furniture | 11 | |
| Aeropostale | 4 | LensCrafters | 2 | |
| Aerosoles | 2 | Levi Strauss & Co. | 1 | |
| American Eagle Outfitters | 2 | Long John Silver's | 1 | |
| Ann Taylor | 8 | Lowe's | 3 | |
| Apple Store | 1 | Macy's | 3 | |
| Applebee's | 6 | Marriott | 5 | |
| Arby's | 3 | Marshalls | 3 | |
| Audi | 1 | MasterBrand Cabinets | 70 | |
| AutoZone | 3 | McDonald's | 22 | |
| Avenue | 1 | Men's Wearhouse | 3 | |
| BMW | 2 | Motherhood Maternity | 8 | |
| Baja Fresh Mexican Grill | 1 | New Balance | 13 | |
| Bakers | 1 | New York & Co | 2 | |
| Banana Republic | 4 | Nike | 12 | |
| Barnes & Noble | 3 | Nissan | 4 | |
| Baskin-Robbins | 12 | Nordstrom | 1 | |
| Bath & Body Works | 3 | OfficeMax | 1 | |
| Bebe | 1 | Old Navy | 2 | |
| Bed Bath & Beyond | 5 | Olive Garden | 2 | |
| Blockbuster | 6 | Outback | 1 | |
| Brooks Brothers | 2 | Outback Steakhouse | 1 | |
| Brookstone | 1 | Pac Sun | 3 | |
| Budget Car Rental | 5 | Panda Express | 1 | |
| Buffalo Wild Wings | 1 | Panera Bread | 5 | |
| Burger King | 13 | Papa John's Pizza | 4 | |
| CVS | 16 | Pathmark | 2 | |
| Cache | 1 | Payless | 9 | |
| Casual Male XL | 1 | Penske | 6 | |
| Charlotte Russe | 3 | PetSmart | 4 | |
| Chevrolet | 3 | Pier 1 Imports | 4 | |
| Chick-Fil-A | 2 | Pizza Hut | 5 | |
| Chico's | 3 | Popeyes | 1 | |
| Chipotle | 2 | Pottery Barn | 1 | |
| Cinnabon | 2 | Pottery Barn Kids | 1 | |
| Circle K | 1 | Qdoba Mexican Grill | 1 | |
| Clarks | 3 | Quiznos | 3 | |
| Cold Stone Creamery | 2 | RadioShack | 12 | |
| Coldwater Creek | 2 | Raymour & Flanigan | 2 | |
| Comfort Inn | 2 | Red Lobster | 1 | |
| Costco | 1 | Red Roof Inn | 1 | |
| Curves | 2 | Rite Aid | 17 | |
| DHL | 4 | Rodeway Inn | 1 | |
| Dairy Queen | 6 | Ruby Tuesday | 4 | |
| Decora Cabinetry | 27 | Rue21 | 1 | |
| Domino's Pizza | 11 | Ryder Rental & Truck Leasing | 1 | |
| DressBarn | 4 | SONIC Drive-In | 1 | |
| Dressbarn | 4 | Sam's Club | 1 | |
| Dunkin Donuts | 61 | Sears | 10 | |
| Econo Lodge | 1 | Sephora | 2 | |
| Eddie Bauer | 2 | Sheraton | 1 | |
| Express | 2 | Skechers USA | 2 | |
| Extended Stay America | 1 | Soma Intimates | 1 | |
| Famous Footwear | 6 | Spencer Gifts | 2 | |
| Fashion Bug | 2 | Sprint Nextel | 6 | |
| FedEx | 145 | Staples | 8 | |
| Finish Line | 2 | Starbucks | 13 | |
| Firestone Complete Auto Care | 5 | Stop & Shop | 8 | |
| Foot Locker | 3 | Subaru | 2 | |
| Ford | 6 | Subway | 19 | |
| Forever 21 | 2 | T-Mobile | 24 | |
| GNC | 17 | T.G.I. Driday's | 3 | |
| GameStop | 14 | T.J.Maxx | 3 | |
| Gap | 5 | Taco Bell | 6 | |
| Goodwill | 9 | Talbots | 4 | |
| Gymboree | 4 | Target | 4 | |
| H&M | 1 | The Cheesecake Factory | 1 | |
| H&R Block | 15 | The Limited | 2 | |
| Haagen-Dazs | 2 | The Room Place | 3 | |
| Harmon Face Values | 4 | Toyota | 2 | |
| Hilton | 1 | Toys"R"Us | 8 | |
| Holiday Inn | 3 | Trader Joe's | 1 | |
| Hollister Co. | 2 | True Value | 8 | |
| Home Depot | 6 | U-Haul | 24 | |
| Honda | 1 | UPS | 165 | |
| Hot Topic | 2 | Urban Outfitters | 1 | |
| Houlihan's | 1 | Verizon Wireless | 9 | |
| Hyundai | 2 | Victoria's Secret | 5 | |
| IHOP | 4 | Volkswagen | 3 | |
| IZOD | 2 | Walgreens | 14 | |
| J. Jill | 2 | Walmart | 4 | |
| J.Crew | 4 | Wendy's | 12 | |
| JCPenney | 2 | Wet Seal | 2 | |
| JoS. A. Bank | 4 | White Castle | 2 | |
| Johnny Rockets | 2 | Whole Foods Market | 1 | |
| Jones New York | 6 | YMCA | 10 | |
| Journeys | 3 | |||
Monmouth County on our top lists:
- #13 on the list of "Top 101 counties with the lowest number of infant deaths per 1000 residents 2007-2013 (pop. 50,000+)"
- #16 on the list of "Top 101 counties with the lowest percentage of residents that keep firearms around their homes"
- #26 on the list of "Top 101 counties with the lowest percentage of residents relocating to foreign countries in 2011"
- #33 on the list of "Top 101 counties with the largest decrease in the number of births per 1000 residents 2000-2006 to 2007-2013 (pop 50,000+)"
- #39 on the list of "Top 101 counties with the highest percentage of residents that visited a dentist within the past year"
- #41 on the list of "Top 101 counties with the best general health status score of residents (1-5), 3 years of data"
- #42 on the list of "Top 101 counties with the most Orthodox adherents"
- #42 on the list of "Top 101 counties with the most Orthodox adherents (pop. 50,000+)"
- #44 on the list of "Top 101 counties with the largest decrease in the number of infant deaths per 1000 residents 2000-2006 to 2007-2013 (pop. 50,000+)"
- #49 on the list of "Top 101 counties with the most Catholic adherents"
- #49 on the list of "Top 101 counties with the most Catholic adherents (pop. 50,000+)"
- #66 on the list of "Top 101 counties with the most Mainline Protestant congregations"
- #66 on the list of "Top 101 counties with the most Mainline Protestant congregations (pop. 50,000+)"
- #67 on the list of "Top 101 counties with the lowest percentage of residents relocating to foreign countries in 2011 (pop. 50,000+)"
- #67 on the list of "Top 101 counties with the most Orthodox congregations (pop. 50,000+)"
- #71 on the list of "Top 101 counties with the lowest number of births per 1000 residents 2007-2013"
- #71 on the list of "Top 101 counties with the lowest number of births per 1000 residents 2007-2013 (pop 50,000+)"
- #72 on the list of "Top 101 counties with the most Orthodox congregations"
- #73 on the list of "Top 101 counties with the most Catholic congregations"
- #73 on the list of "Top 101 counties with the most Catholic congregations (pop. 50,000+)"