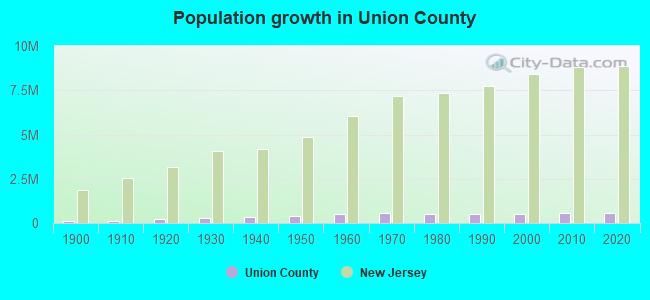
Union County, New Jersey (NJ)
County owner-occupied free and clear houses and condos in 2010: 30,576
County owner-occupied houses and condos in 2000: 114,688
Renter-occupied apartments: 75,275 (it was 71,436 in 2000)
| % of renters here: | 38% |
| State: | 35% |
Land area: 103 sq. mi.
Water area: 2.2 sq. mi.
Population density: 5517 people per square mile (very high).
Industries providing employment: Educational, health and social services (21.3%), Professional, scientific, management, administrative, and waste management services (12.8%), Transportation and warehousing,and utilities (10.6%).
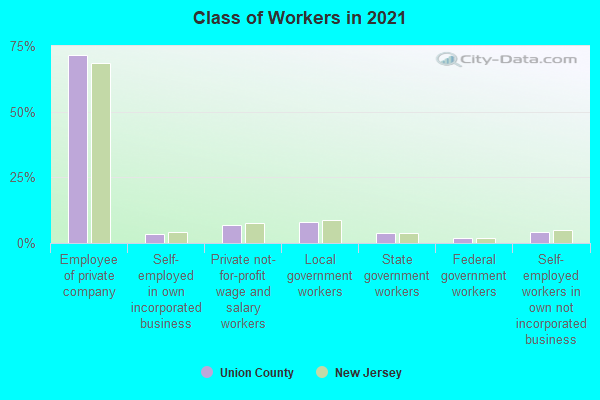
Type of workers:
- Private wage or salary: 81%
- Government: 15%
- Self-employed, not incorporated: 4%
- Unpaid family work: 0%
- OSM Map
- General Map
- Google Map
- MSN Map

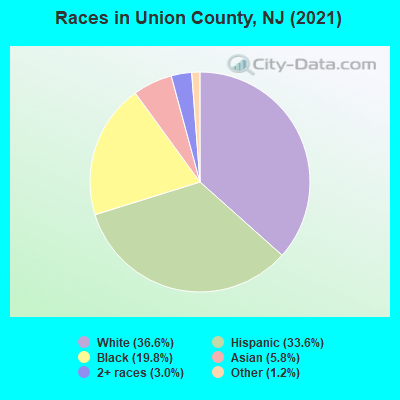
- 206,96236.3%White Non-Hispanic Alone
- 193,93434.0%Hispanic or Latino
- 110,50619.4%Black Non-Hispanic Alone
- 31,7745.6%Asian alone
- 17,2703.0%Two or more races
- 9,2731.6%Some other race alone
- 960.02%Native Hawaiian and Other
Pacific Islander alone
| Median resident age: | 39.4 years |
| New Jersey median age: | 40.4 years |
| Males: 281,970 | |
| Females: 287,845 |

 | So... which of the cities in Union County would y'all consider North (NUC) and Central Jersey (SUC)? (46 replies) |
| NJ Essex or Union County apartments (7 replies) |
| Clark/Union County, how do finished basements impact property taxes? (6 replies) |
| NJ Real Estate Market. (125 replies) |
| What can $400k get me in Union County? (3 replies) |
| Official regions of NJ 2024 (13 replies) |
| Union County: | 2.0 people |
| New Jersey: | 3 people |
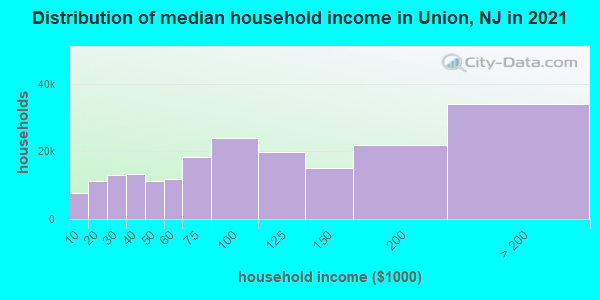
Estimated median household income in 2022: $98,028 ($55,339 in 1999)
| This county: | $98,028 |
| New Jersey: | $96,346 |
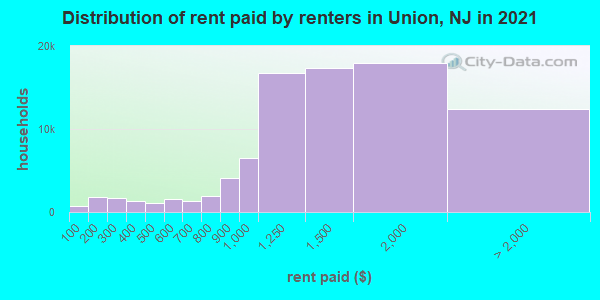
Median contract rent in 2022 for apartments: $1,434 (lower quartile is $1,090, upper quartile is $1,873)
| This county: | $1434 |
| State: | $1399 |
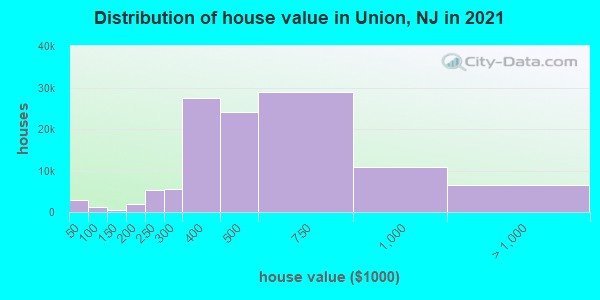
Estimated median house or condo value in 2022: $499,700 (it was $185,200 in 2000)
| Union: | $499,700 |
| New Jersey: | $428,900 |
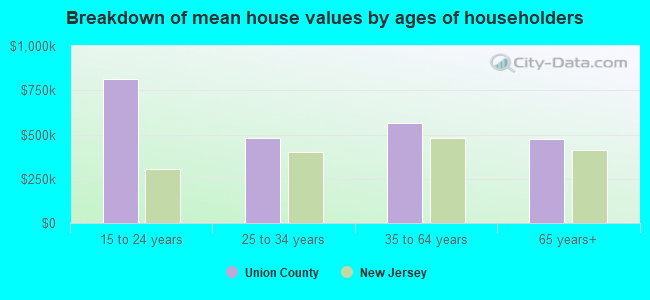
Mean price in 2022:
Median monthly housing costs for homes and condos with a mortgage: $2,883Detached houses: $596,477
Here: $596,477 State: $537,591 Townhouses or other attached units: $609,757
Here: $609,757 State: $381,113 In 2-unit structures: $452,159
Here: $452,159 State: $444,476 In 3-to-4-unit structures: $316,757
Here: $316,757 State: $457,463 In 5-or-more-unit structures: $383,498
Here: $383,498 State: $368,745 Mobile homes: $54,657
Here: $54,657 State: $119,788
Median monthly housing costs for units without a mortgage: $1,285
Institutionalized population: 4,209
Crime in 2020 (reported by the sheriff's office or county police, not the county total):
- Murders: 0
- Rapes: 0
- Robberies: 0
- Assaults: 0
- Burglaries: 0
- Thefts: 0
- Auto thefts: 0
Crime in 2019 (reported by the sheriff's office or county police, not the county total):
- Murders: 0
- Rapes: 0
- Robberies: 0
- Assaults: 0
- Burglaries: 0
- Thefts: 0
- Auto thefts: 0
Health of residents in Union County based on CDC Behavioral Risk Factor Surveillance System Survey Questionnaires from 2003 to 2012:
General health status score of residents in this county from 1 (poor) to 5 (excellent) is 3.5. This is about average.70.2% of residents exercised in the past month. This is less than average.
41.6% of residents smoked 100+ cigarettes in their lives. This is about average.
73.1% of adult residents drank alcohol in the past 30 days. This is about average.
75.6% of residents visited a dentist within the past year. This is about average.
Average weight of males is 190 pounds. This is about average.
Average weight of females is 163 pounds. This is about average.
8.9% of residents keep firearms around their homes. This is less than average.
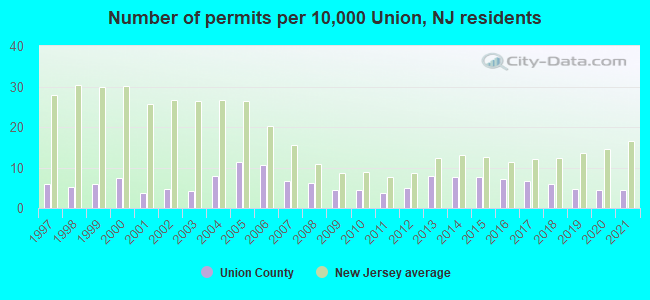
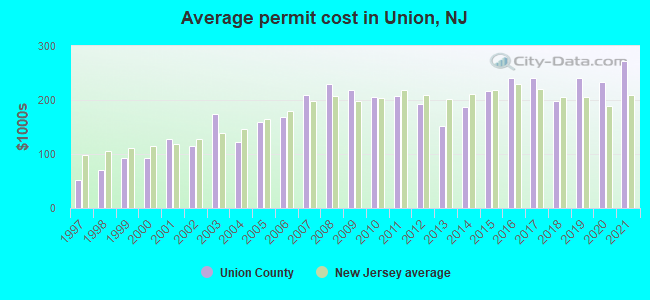
Single-family new house construction building permits:
- 2022: 237 buildings, average cost: $252,200
- 2021: 230 buildings, average cost: $272,900
- 2020: 232 buildings, average cost: $233,700
- 2019: 243 buildings, average cost: $241,100
- 2018: 305 buildings, average cost: $198,600
- 2017: 343 buildings, average cost: $239,500
- 2016: 370 buildings, average cost: $240,800
- 2015: 399 buildings, average cost: $216,100
- 2014: 406 buildings, average cost: $187,300
- 2013: 418 buildings, average cost: $151,700
- 2012: 256 buildings, average cost: $192,200
- 2011: 198 buildings, average cost: $206,800
- 2010: 228 buildings, average cost: $205,900
- 2009: 234 buildings, average cost: $217,800
- 2008: 323 buildings, average cost: $230,000
- 2007: 350 buildings, average cost: $210,100
- 2006: 549 buildings, average cost: $169,300
- 2005: 599 buildings, average cost: $159,800
- 2004: 411 buildings, average cost: $123,200
- 2003: 213 buildings, average cost: $174,700
- 2002: 247 buildings, average cost: $114,700
- 2001: 196 buildings, average cost: $127,900
- 2000: 387 buildings, average cost: $92,900
- 1999: 313 buildings, average cost: $93,400
- 1998: 265 buildings, average cost: $71,000
- 1997: 308 buildings, average cost: $51,400
Median real estate property taxes paid for housing units with mortgages in 2022: $10,001 (2.0%)
Median real estate property taxes paid for housing units with no mortgage in 2022: $10,001 (2.0%)
| Union County: | 9.5% |
| New Jersey: | 9.7% |
Median age of residents in 2022: 39.4 years old
(Males: 37.8 years old, Females: 40.7 years old)
(Median age for: White residents: 46.3 years old, Black residents: 40.3 years old, American Indian residents: 32.7 years old, Asian residents: 40.9 years old, Hispanic or Latino residents: 33.8 years old, Other race residents: 33.3 years old)
Area name: Newark, NJ HUD Metro FMR Area
Fair market rent in 2006 for a 1-bedroom apartment in Union County is $879 a month.
Fair market rent for a 2-bedroom apartment is $1004 a month.
Fair market rent for a 3-bedroom apartment is $1202 a month.
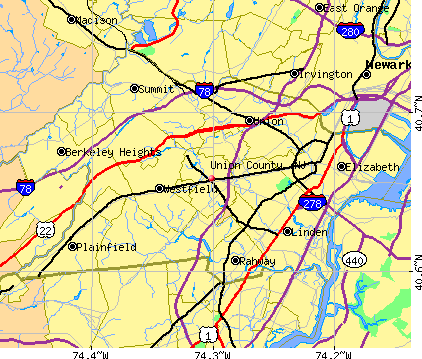
Cities in this county include: Elizabeth, Union, Plainfield, Linden, Westfield, Rahway, Scotch Plains, Cranford, Hillside, Roselle.
2023 air pollution in Union County:
Carbon Monoxide: 0.399 ppm (standard limit: 9 ppm). Above U.S. average.
Nitrogen Dioxide: 0.02 ppm (standard limit: 0.053 ppm). Significanly above U.S. average.
Particulate Matter (PM2.5) Annual: 12.4 µg/m3(standard limit: 15.0 µg/m3). Above U.S. average.
Sulfur Oxides Annual: 0.001 ppm (standard limit: 0.03 ppm). Near U.S. average.
Neighboring counties: Lee County, Iowa  , Westchester County, New York
  .
.
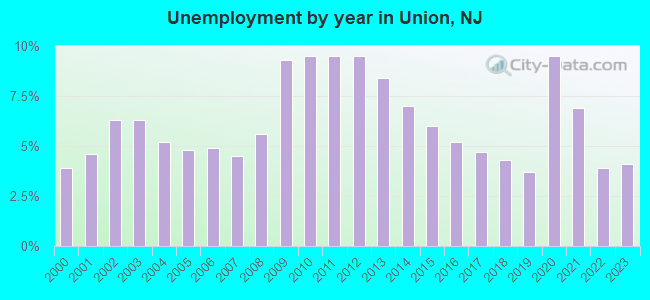
| Here: | 4.7% |
| New Jersey: | 4.5% |
Current college students: 28,216
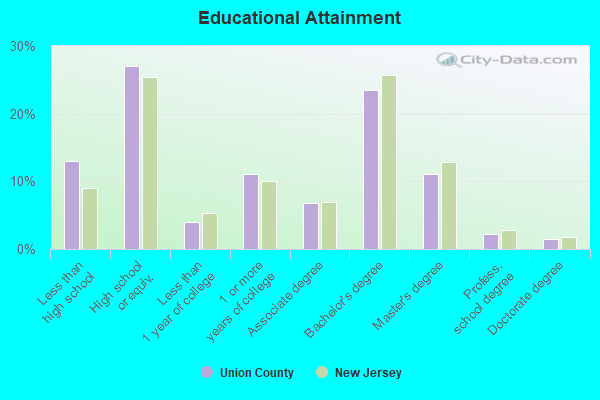
People 25 years of age or older with a high school degree or higher: 84.9%
People 25 years of age or older with a bachelor's degree or higher: 39.0%
Number of foreign born residents: 189,086 (49.7% naturalized citizens)
| Union County: | 33.2% |
| Whole state: | 23.5% |
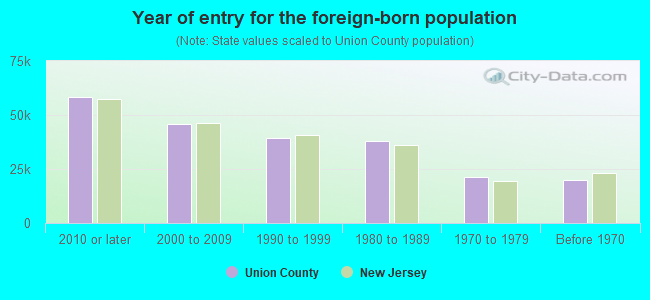
- Year of entry for the foreign-born population
- 70,5732010 or later
- 44,0342000 to 2009
- 36,9861990 to 1999
- 37,7341980 to 1989
- 21,3611970 to 1979
- 19,928Before 1970
Mean travel time to work (commute): minutes
Percentage of county residents living and working in this county: 90.0%
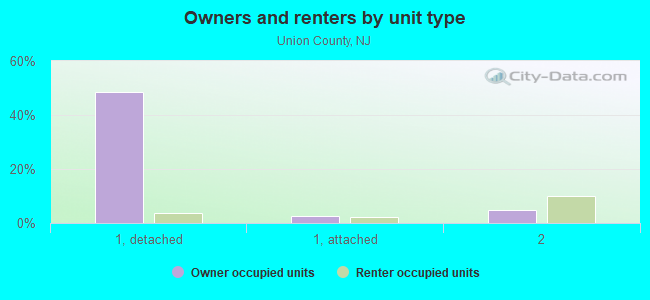
Housing units in structures:
- One, detached: 103,842
- One, attached: 11,835
- Two: 35,534
- 3 or 4: 15,464
- 5 to 9: 6,604
- 10 to 19: 8,975
- 20 to 49: 13,790
- 50 or more: 15,234
- Mobile homes: 628
Housing units in Union County with a mortgage: 74,856 (6,313 second mortgage, 38 home equity loan, 5,550 both second mortgage and home equity loan)
Houses without a mortgage: 3,197
| Here: | 96.1% with mortgage |
| State: | 95.9% with mortgage |
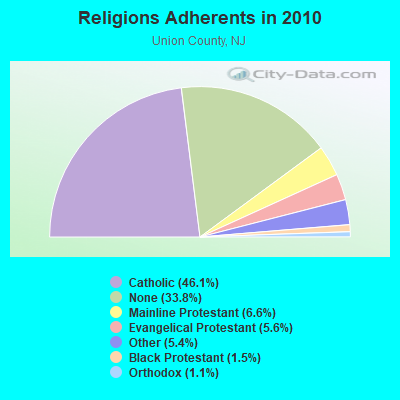
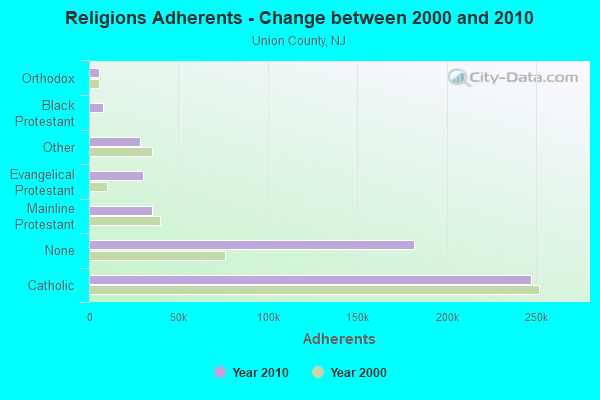
Religion statistics for Union County
| Religion | Adherents | Congregations |
|---|---|---|
| Catholic | 247,240 | 44 |
| Mainline Protestant | 35,313 | 109 |
| Evangelical Protestant | 30,123 | 129 |
| Other | 28,707 | 52 |
| Black Protestant | 7,858 | 38 |
| Orthodox | 5,717 | 10 |
| None | 181,541 | - |
Source: Clifford Grammich, Kirk Hadaway, Richard Houseal, Dale E.Jones, Alexei Krindatch, Richie Stanley and Richard H.Taylor. 2012. 2010 U.S.Religion Census: Religious Congregations & Membership Study. Association of Statisticians of American Religious Bodies. Jones, Dale E., et al. 2002. Congregations and Membership in the United States 2000. Nashville, TN: Glenmary Research Center.
Food Environment Statistics:
| Union County: | 2.97 / 10,000 pop. |
| State: | 2.90 / 10,000 pop. |
| Here: | 0.04 / 10,000 pop. |
| New Jersey: | 0.06 / 10,000 pop. |
| This county: | 1.80 / 10,000 pop. |
| New Jersey: | 1.76 / 10,000 pop. |
| Union County: | 0.75 / 10,000 pop. |
| New Jersey: | 0.81 / 10,000 pop. |
| This county: | 7.38 / 10,000 pop. |
| State: | 7.15 / 10,000 pop. |
| Union County: | 8.3% |
| New Jersey: | 8.3% |
| Union County: | 21.1% |
| State: | 23.3% |
| Here: | 21.4% |
| State: | 18.0% |
Agriculture in Union County:
Average size of farms: 10 acresAverage value of agricultural products sold per farm: $374,975
Average value of crops sold per acre for harvested cropland: $64684.33
The value of nursery, greenhouse, floriculture, and sod as a percentage of the total market value of agricultural products sold: 97.78%
The value of livestock, poultry, and their products as a percentage of the total market value of agricultural products sold: 0.33%
Average total farm production expenses per farm: $166,634
Harvested cropland as a percentage of land in farms: 57.14%
Irrigated harvested cropland as a percentage of land in farms: 43.27%
Average market value of all machinery and equipment per farm: $63,259
The percentage of farms operated by a family or individual: 66.67%
Average age of principal farm operators: 62 years
Average number of cattle and calves per 100 acres of all land in farms: 26.37
Earthquake activity:
Union County-area historical earthquake activity is significantly above New Jersey state average. It is 68% smaller than the overall U.S. average.On 8/23/2011 at 17:51:04, a magnitude 5.8 (5.8 MW, Depth: 3.7 mi, Class: Moderate, Intensity: VI - VII) earthquake occurred 272.0 miles away from Union County center
On 10/7/1983 at 10:18:46, a magnitude 5.3 (5.1 MB, 5.3 LG, 5.1 ML) earthquake occurred 227.9 miles away from the county center
On 1/16/1994 at 01:49:16, a magnitude 4.6 (4.6 MB, 4.6 LG, Depth: 3.1 mi, Class: Light, Intensity: IV - V) earthquake occurred 94.1 miles away from the county center
On 4/20/2002 at 10:50:47, a magnitude 5.3 (5.3 ML, Depth: 3.0 mi) earthquake occurred 268.4 miles away from the county center
On 4/20/2002 at 10:50:47, a magnitude 5.2 (5.2 MB, 4.2 MS, 5.2 MW, 5.0 MW) earthquake occurred 266.5 miles away from Union County center
On 1/16/1994 at 00:42:43, a magnitude 4.2 (4.2 MB, 4.0 LG, Depth: 3.1 mi) earthquake occurred 92.6 miles away from the county center
Magnitude types: regional Lg-wave magnitude (LG), body-wave magnitude (MB), local magnitude (ML), surface-wave magnitude (MS), moment magnitude (MW)
Most recent natural disasters:
- New Jersey Covid-19 Pandemic, Incident Period: January 20, 2020, Major Disaster (Presidential) Declared DR-4488-NJ: March 25, 2020, FEMA Id: 4488, Natural disaster type: Other
- New Jersey Severe Winter Storm and Snowstorm, Incident Period: January 22, 2016 to January 24, 2016, Major Disaster (Presidential) Declared DR-4264: March 14, 2016, FEMA Id: 4264, Natural disaster type: Snowstorm, Winter Storm
- New Jersey Hurricane Sandy, Incident Period: October 26, 2012 to November 08, 2012, Emergency Declared EM-3354: October 28, 2012, FEMA Id: 3354, Natural disaster type: Hurricane
- New Jersey Hurricane Sandy, Incident Period: October 26, 2012 to November 08, 2012, Major Disaster (Presidential) Declared DR-4086: October 30, 2012, FEMA Id: 4086, Natural disaster type: Hurricane
- New Jersey Severe Storm, Incident Period: October 29, 2011, Major Disaster (Presidential) Declared DR-4048: November 30, 2011, FEMA Id: 4048, Natural disaster type: Storm
- New Jersey Hurricane Irene, Incident Period: August 27, 2011 to September 05, 2011, Major Disaster (Presidential) Declared DR-4021: August 31, 2011, FEMA Id: 4021, Natural disaster type: Hurricane
- New Jersey Hurricane Irene, Incident Period: August 26, 2011 to September 05, 2011, Emergency Declared EM-3332: August 27, 2011, FEMA Id: 3332, Natural disaster type: Hurricane
- New Jersey Severe Winter Storm and Snowstorm, Incident Period: December 26, 2010 to December 27, 2010, Major Disaster (Presidential) Declared DR-1954: February 04, 2011, FEMA Id: 1954, Natural disaster type: Snowstorm, Winter Storm
- New Jersey Severe Storms and Flooding, Incident Period: March 12, 2010 to April 15, 2010, Major Disaster (Presidential) Declared DR-1897: April 02, 2010, FEMA Id: 1897, Natural disaster type: Storm, Flood
- New Jersey Severe Storms and Inland and Coastal Flooding, Incident Period: April 14, 2007 to April 20, 2007, Major Disaster (Presidential) Declared DR-1694: April 26, 2007, FEMA Id: 1694, Natural disaster type: Storm, Flood
- 17 other natural disasters have been reported since 1953.
The number of natural disasters in Union County (27) is a lot greater than the US average (15).
Major Disasters (Presidential) Declared: 17
Emergencies Declared: 10
Causes of natural disasters: Floods: 7, Hurricanes: 7, Storms: 6, Heavy Rains: 4, Snowstorms: 3, Blizzards: 2, Water Shortages: 2, Winter Storms: 2, Power Outage: 1, Tornado: 1, Wind: 1, Other: 3 (Note: some incidents may be assigned to more than one category).
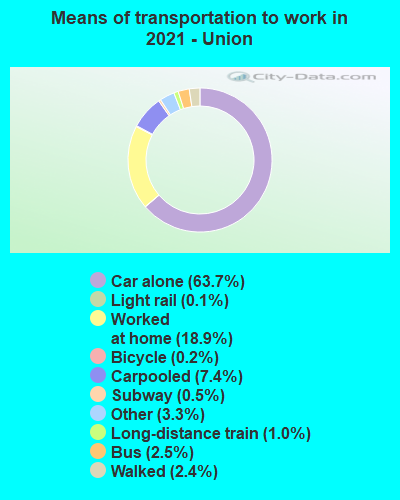
Means of transportation to work:
- Drove a car alone: 161,309 (64.6%)
- Carpooled: 22,511 (9.0%)
- Bus: 7,356 (2.9%)
- Subway or elevated rail: 802 (0.3%)
- Long-distance train or commuter rail: 2,234 (0.9%)
- Taxicab, motorcycle, or other means: 7,373 (3.0%)
- Bicycle: 1,169 (0.5%)
- Walked: 7,339 (2.9%)
- Worked at home: 39,600 (15.9%)
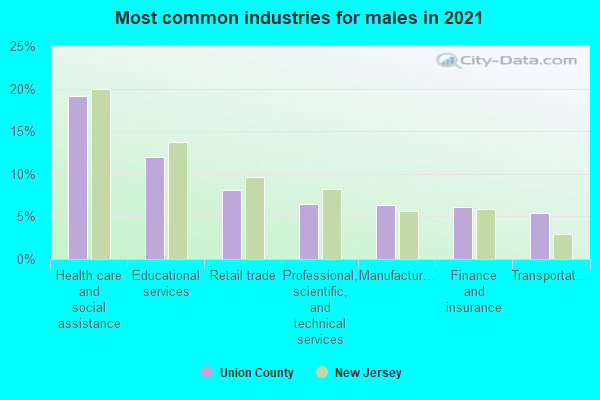
- Health care and social assistance (18%)
- Educational services (12%)
- Retail trade (9%)
- Manufacturing (6%)
- Finance and insurance (6%)
- Other services, except public administration (5%)
- Professional, scientific, and technical services (5%)
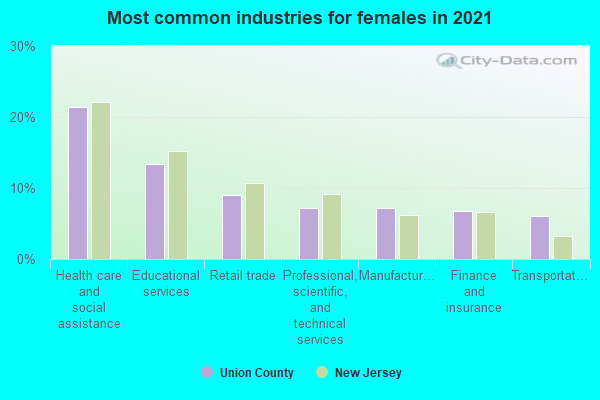
- Health care and social assistance (22%)
- Educational services (14%)
- Retail trade (11%)
- Manufacturing (7%)
- Finance and insurance (7%)
- Other services, except public administration (6%)
- Professional, scientific, and technical services (6%)
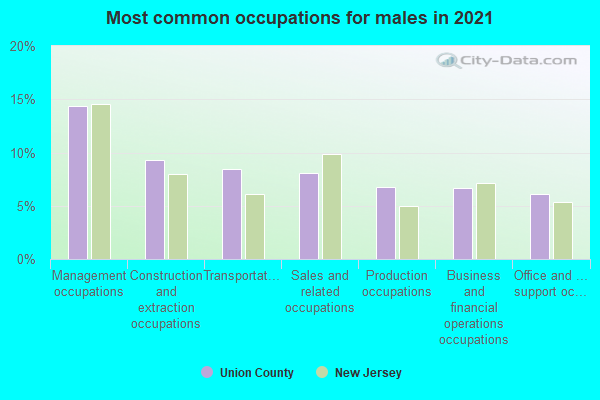
- Management occupations (12%)
- Construction and extraction occupations (11%)
- Transportation occupations (10%)
- Sales and related occupations (8%)
- Office and administrative support occupations (7%)
- Business and financial operations occupations (6%)
- Material moving occupations (6%)
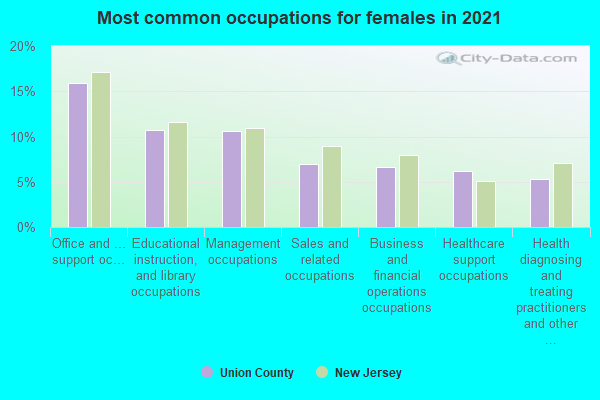
- Office and administrative support occupations (17%)
- Educational instruction, and library occupations (10%)
- Management occupations (9%)
- Sales and related occupations (9%)
- Health diagnosing and treating practitioners and other technical occupations (7%)
- Business and financial operations occupations (7%)
- Healthcare support occupations (6%)
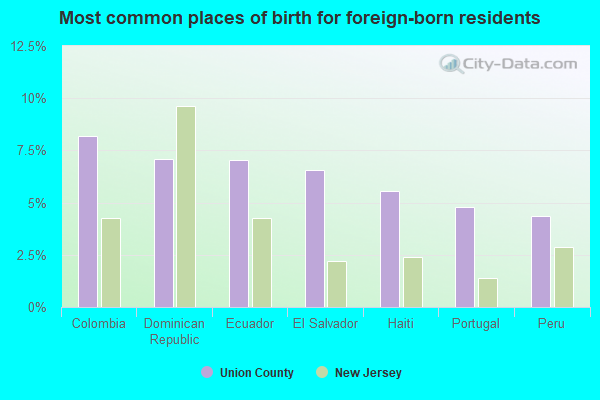
- Colombia (9%)
- Dominican Republic (8%)
- Ecuador (8%)
- El Salvador (7%)
- Haiti (6%)
- Guatemala (4%)
- Portugal (4%)
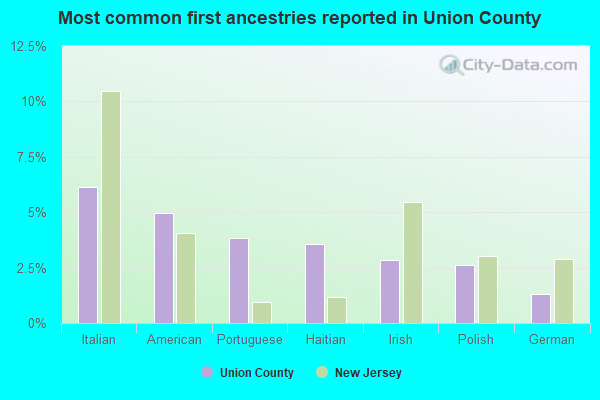
- Italian (6%)
- American (5%)
- Haitian (4%)
- Portuguese (4%)
- Irish (3%)
- Polish (3%)
- Brazilian (2%)
People in group quarters in Union County, New Jersey in 2010:
- 2,591 people in nursing facilities/skilled-nursing facilities
- 1,266 people in college/university student housing
- 866 people in local jails and other municipal confinement facilities
- 493 people in other noninstitutional facilities
- 365 people in emergency and transitional shelters (with sleeping facilities) for people experiencing homelessness
- 267 people in hospitals with patients who have no usual home elsewhere
- 231 people in federal detention centers
- 216 people in group homes intended for adults
- 215 people in residential treatment centers for adults
- 125 people in mental (psychiatric) hospitals and psychiatric units in other hospitals
- 59 people in residential treatment centers for juveniles (non-correctional)
- 36 people in workers' group living quarters and job corps centers
- 29 people in correctional facilities intended for juveniles
- 21 people in in-patient hospice facilities
- 19 people in group homes for juveniles (non-correctional)
- 4 people in maritime/merchant vessels
People in group quarters in Union County, New Jersey in 2000:
- 2,705 people in nursing homes
- 1,445 people in local jails and other confinement facilities (including police lockups)
- 1,105 people in college dormitories (includes college quarters off campus)
- 939 people in other noninstitutional group quarters
- 299 people in wards in general hospitals for patients who have no usual home elsewhere
- 272 people in other types of correctional institutions
- 245 people in religious group quarters
- 210 people in other nonhousehold living situations
- 151 people in mental (psychiatric) hospitals or wards
- 145 people in homes for the mentally retarded
- 72 people in homes or halfway houses for drug/alcohol abuse
- 60 people in short-term care, detention or diagnostic centers for delinquent children
- 43 people in homes for the mentally ill
- 41 people in other group homes
- 36 people in unknown juvenile institutions
- 32 people in hospitals/wards and hospices for chronically ill
- 28 people in hospices or homes for chronically ill
- 7 people in homes for abused, dependent, and neglected children
- 4 people in other hospitals or wards for chronically ill
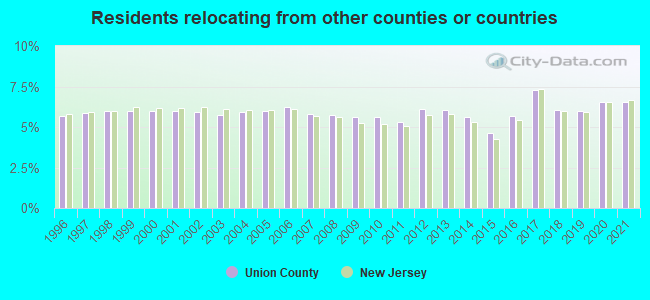
6.55% of this county's 2021 resident taxpayers lived in other counties in 2020 ($90,395 average adjusted gross income)
| Here: | 6.55% |
| New Jersey average: | 6.70% |
0.02% of residents moved from foreign countries ($49 average AGI)
Union County: 0.02% New Jersey average: 0.01%
3.98% relocated from other counties in New Jersey ($57,889 average AGI)
2.56% relocated from other states ($32,457 average AGI)
Union County: 2.56% New Jersey average: 2.98%
Top counties from which taxpayers relocated into this county between 2020 and 2021:
| from Essex County, NJ | |
| from Hudson County, NJ | |
| from Middlesex County, NJ | |
| from Kings County, NY | |
| from New York County, NY | |
| from Somerset County, NJ | |
| from Queens County, NY |
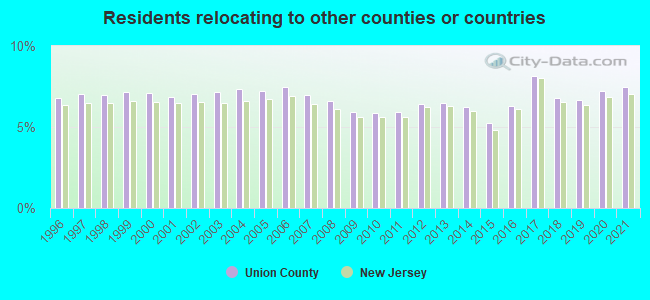
7.45% of this county's 2020 resident taxpayers moved to other counties in 2021 ($103,155 average adjusted gross income)
| Here: | 7.45% |
| New Jersey average: | 7.02% |
0.01% of residents moved to foreign countries ($81 average AGI)
Union County: 0.01% New Jersey average: 0.02%
4.68% relocated to other counties in New Jersey ($53,809 average AGI)
2.76% relocated to other states ($49,265 average AGI)
Union County: 2.76% New Jersey average: 3.32%
Top counties to which taxpayers relocated from this county between 2020 and 2021:
| to Middlesex County, NJ | |
| to Essex County, NJ | |
| to Somerset County, NJ | |
| to Hudson County, NJ | |
| to Morris County, NJ | |
| to Ocean County, NJ | |
| to Monmouth County, NJ |
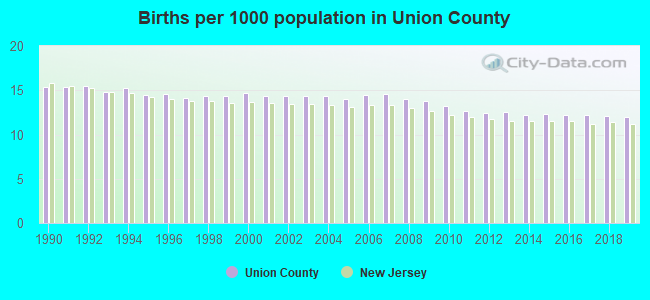
Births per 1000 population from 1990 to 1999: 14.8
Births per 1000 population from 2000 to 2009: 14.3
Births per 1000 population from 2010 to 2022: 10.4
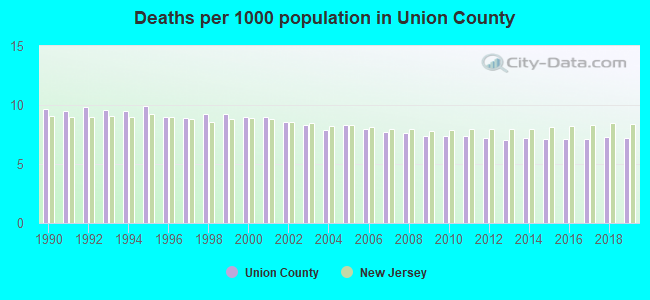
Deaths per 1000 population from 1990 to 1999: 9.4
Deaths per 1000 population from 2000 to 2009: 8.2
Deaths per 1000 population from 2010 to 2020: 7.5
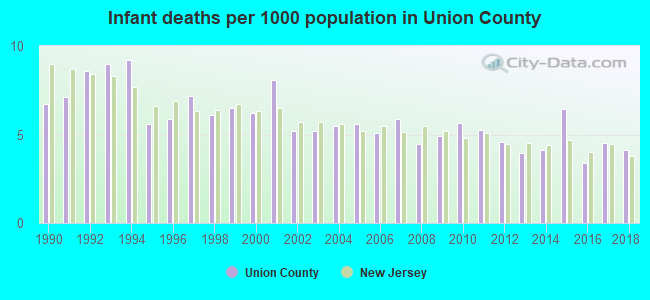
Infant deaths per 1000 live births from 1990 to 1999: 7.2
Infant deaths per 1000 live births from 2000 to 2009: 5.6
Infant deaths per 1000 live births from 2010 to 2021: 4.4
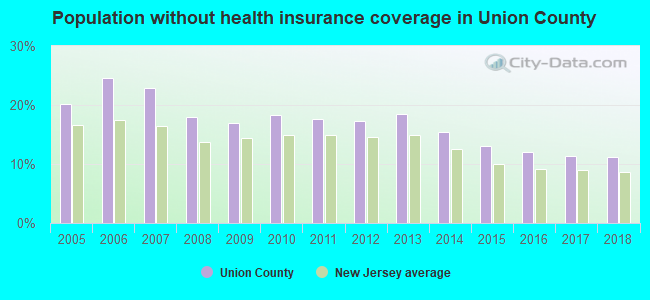
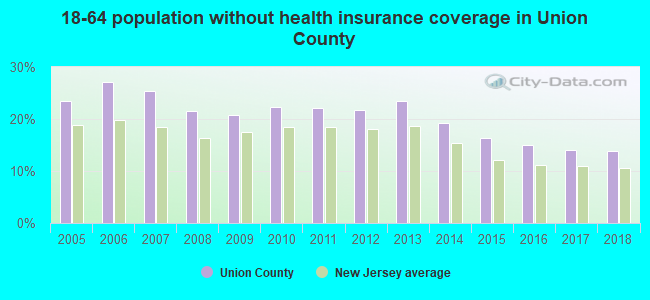
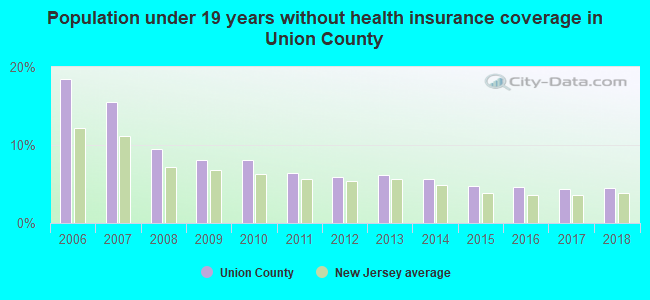
Persons under 19 years old without health insurance coverage in 2018: 4.5%
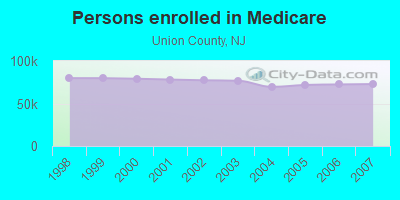
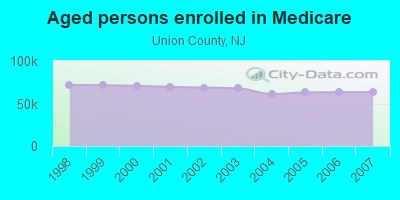
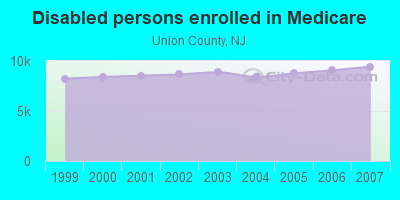
Persons enrolled in hospital insurance and/or supplemental medical insurance (Medicare) in July 1, 2007: 72,856 (63,423 aged, 9,433 disabled)
Children under 18 without health insurance coverage in 2007: 21,809 (16%)
Most common underlying causes of death in Union County, New Jersey in 1999 - 2019:
- Atherosclerotic heart disease (6,901)
- Acute myocardial infarction, unspecified (5,906)
- Bronchus or lung, unspecified - Malignant neoplasms (4,493)
- Stroke, not specified as haemorrhage or infarction (2,593)
- Septicaemia, unspecified (2,484)
- Unspecified dementia (2,412)
- Chronic obstructive pulmonary disease, unspecified (2,312)
- Alzheimer disease, unspecified (2,011)
- Pneumonia, unspecified (1,874)
- Unspecified diabetes mellitus, without complications (1,824)
Population without health insurance coverage in 2000: 13%
Children under 18 without health insurance coverage in 2000: 9%
Short term general hospital admissions per 100,000 population in 2004: 8,885
Short term general hospital beds per 100,000 population in 2004: 212
Emergency room visits per 100,000 population in 2004: 30,703
General practice office based MDs per 100,000 population in 2005: 1,369
Medical specialist MDs per 100,000 population in 2005: 770
Dentists per 100,000 population in 1998: 23
Total births per 100,000 population, July 2005 - July 2006 : 73
Total deaths per 100,000 population, July 2005 - July 2006: 86
Limited-service eating places per 100,000 population in 2005 : 14
Beer, wine & liquor stores per 100,000 population in 2005: 1
EPA green book nonattainment status in 2004-2006: 1
Suicides per 1,000,000 population from 2000 to 2006: 53.5. This is less than state average.
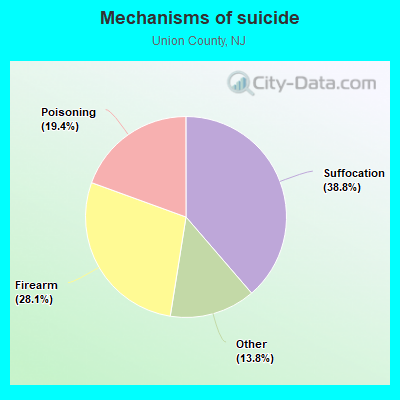
- Suffocation - 20.7
- Firearm - 15.0
- Poisoning - 10.4
- Other - 7.4
Household type by relationship:
Households: 569,815- Male householders: 101,866 (18,956 living alone), Female householders: 100,709 (25,849 living alone)
103,482 spouses (102,332 opposite-sex spouses), 18,972 unmarried partners, (17,823 opposite-sex unmarried partners), 181,318 children (173,670 natural, 2,074 adopted, 5,574 stepchildren), 9,128 grandchildren, 8,058 brothers or sisters, 11,440 parents, 219 foster children, 15,739 other relatives, 13,828 non-relatives
- In group quarters: 5,056
Size of family households: 47,866 2-persons, 33,171 3-persons, 35,936 4-persons, 17,291 5-persons, 7,002 6-persons, 4,341 7-or-more-persons.
Size of nonfamily households: 44,805 1-person, 10,604 2-persons, 978 3-persons, 176 4-persons, 282 5-persons, 123 6-persons.
78,221 married couples with children.
39,308 single-parent households (14,930 men, 24,378 women).
53.4% of residents of Union speak English at home.
29.4% of residents speak Spanish at home (44% speak English very well, 17% speak English well, 22% speak English not well, 17% don't speak English at all).
11.9% of residents speak other Indo-European language at home (61% speak English very well, 20% speak English well, 12% speak English not well, 6% don't speak English at all).
3.2% of residents speak Asian or Pacific Island language at home (75% speak English very well, 19% speak English well, 5% speak English not well, 1% don't speak English at all).
2.1% of residents speak other language at home (69% speak English very well, 19% speak English well, 12% speak English not well).
In fiscal year 2004:
Federal Government expenditure: $2,745,978,000 ($5,162 per capita)
Department of Defense expenditure: $111,887,000
Federal direct payments to individuals for retirement and disability: $1,120,102,000
Federal other direct payments to individuals: $730,403,000
Federal direct payments not to individuals: $9,176,000
Federal grants: $515,329,000
Federal procurement contracts: $172,711,000 ($96,786,000 Department of Defense)
Federal salaries and wages: $198,258,000 ($3,713,000 Department of Defense)
Federal Government direct loans: $39,665,000
Federal guaranteed/insured loans: $501,722,000
Federal Government insurance: $743,554,000
Population change from April 1, 2000 to July 1, 2005:
Births: 40,075| Here: | 75 per 1000 residents |
| State: | 69 per 1000 residents |
Deaths: 23,434
| Here: | 44 per 1000 residents |
| State: | 44 per 1000 residents |
Net international migration: +24,019
| Here: | +45 per 1000 residents |
| State: | +33 per 1000 residents |
Net internal migration: -30,692
| Here: | |
| State: |
Total withdrawal of fresh water for public supply: 17.76 millions of gallons per day (72% from ground, 28% from surface)
| Here: | 7.0 |
| State: | 6.8 |
| Here: | 4.1 |
| State: | 3.9 |
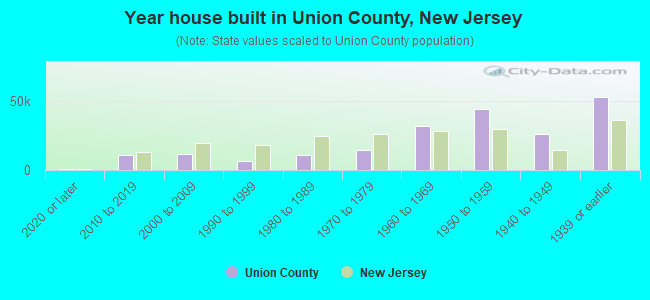
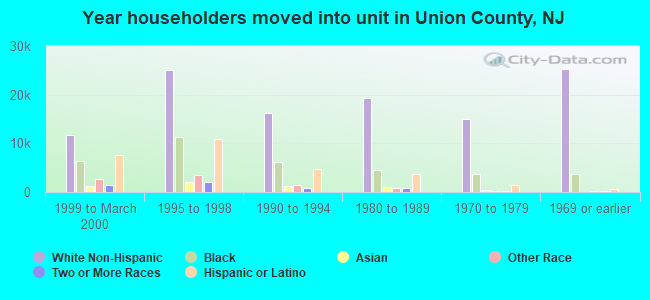
- Year house built in Union County, New Jersey
- 2,7742020 or later
- 16,5852010 to 2019
- 12,7732000 to 2009
- 7,6491990 to 1999
- 11,6451980 to 1989
- 16,3431970 to 1979
- 26,9051960 to 1969
- 45,6711950 to 1959
- 24,7251940 to 1949
- 46,8361939 or earlier
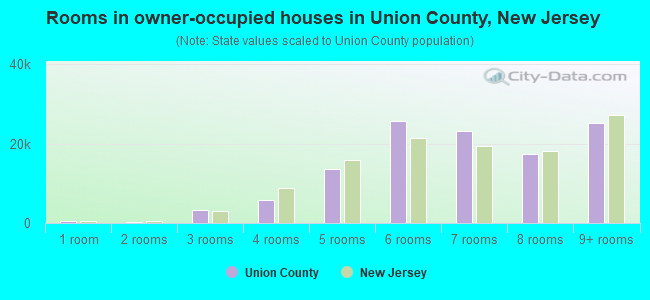
- Rooms in owner-occupied houses in Union County, New Jersey
- 1271 room
- 4192 rooms
- 2,0823 rooms
- 7,2324 rooms
- 14,2015 rooms
- 22,0786 rooms
- 23,0707 rooms
- 18,9078 rooms
- 27,3979+ rooms
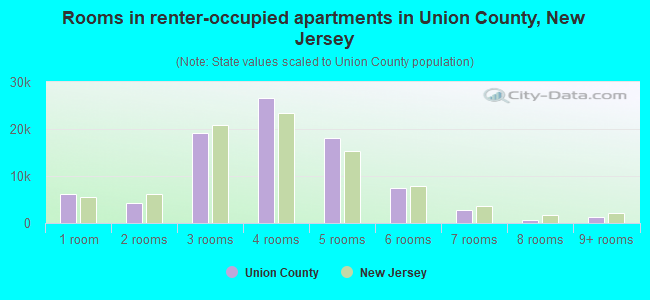
- Rooms in renter-occupied apartments in Union County, New Jersey
- 5,0281 room
- 5,9772 rooms
- 19,5603 rooms
- 20,9584 rooms
- 20,7565 rooms
- 9,0006 rooms
- 3,9777 rooms
- 9628 rooms
- 8449+ rooms
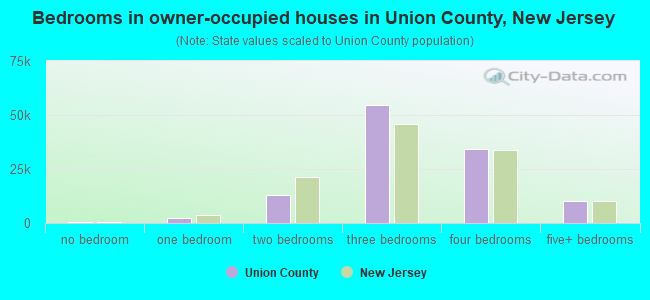
- Bedrooms in owner-occupied houses in Union County, New Jersey
- 222no bedroom
- 2,1571 bedroom
- 15,3642 bedrooms
- 50,3943 bedrooms
- 35,2354 bedrooms
- 12,1415+ bedrooms
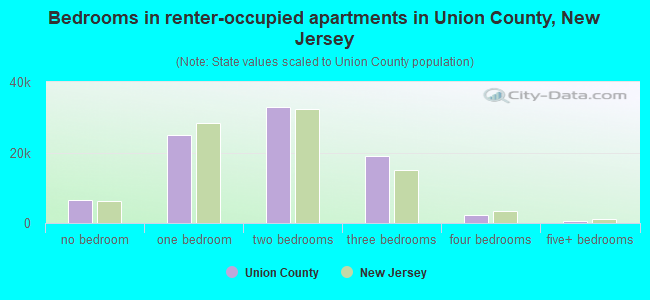
- Bedrooms in renter-occupied apartments in Union County, New Jersey
- 5,028no bedroom
- 25,3721 bedroom
- 32,4412 bedrooms
- 20,0873 bedrooms
- 3,3334 bedrooms
- 8015+ bedrooms
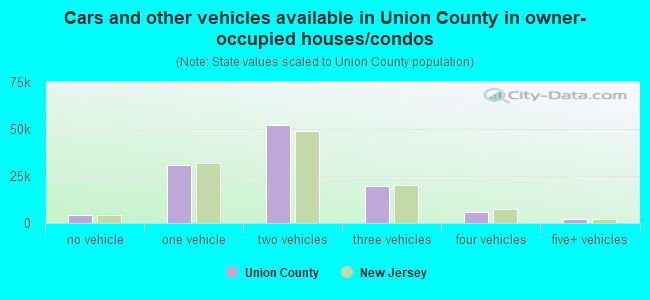
- Cars and other vehicles available in Union County in owner-occupied houses/condos
- 4,438no vehicle
- 31,2941 vehicle
- 49,5112 vehicles
- 19,6743 vehicles
- 8,1894 vehicles
- 2,4075+ vehicles
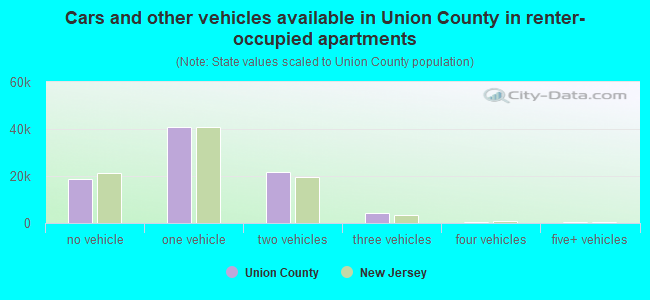
- Cars and other vehicles available in Union County in renter-occupied apartments
- 16,625no vehicle
- 43,0541 vehicle
- 22,5932 vehicles
- 4,1503 vehicles
- 2864 vehicles
- 3545+ vehicles
89.5% of Union County residents lived in the same house 1 years ago.
Out of people who lived in different houses, 35% lived in this county.
Out of people who lived in different counties, 62% lived in New Jersey.
| Union County: | 89.5% |
| State average: | 90.4% |
Place of birth for U.S.-born residents:
- This state: 267,606
- Other state: 100,020
- Northeast: 71,998
- Midwest: 5,796
- South: 19,143
- West: 3,083
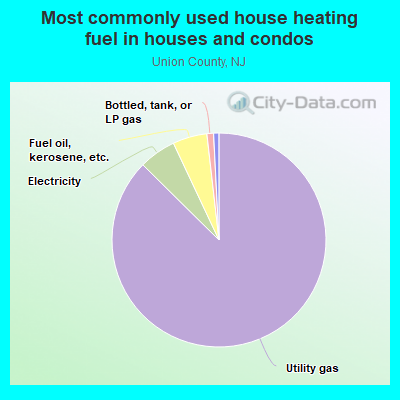
- 85.6%Utility gas
- 5.7%Electricity
- 5.5%Fuel oil, kerosene, etc.
- 2.4%Bottled, tank, or LP gas
- 0.2%Other fuel
- 0.2%No fuel used
- 0.2%Wood
- 0.2%Coal or coke
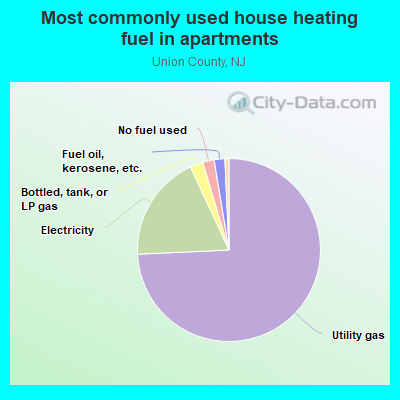
- 75.4%Utility gas
- 18.9%Electricity
- 2.1%Bottled, tank, or LP gas
- 1.9%Fuel oil, kerosene, etc.
- 1.4%No fuel used
- 0.3%Other fuel
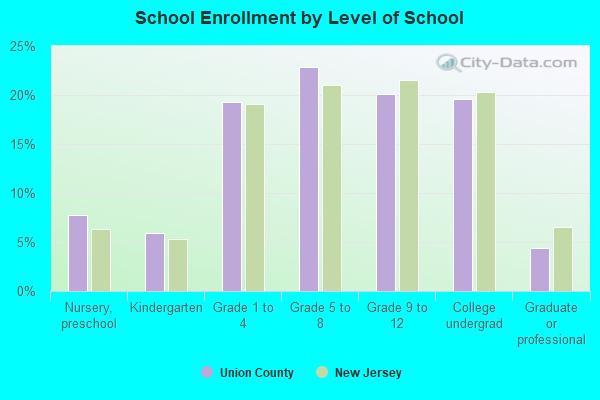
Private vs. public school enrollment:
| Here: | 4.9% |
| New Jersey: | 12.3% |
| Here: | 11.1% |
| New Jersey: | 13.1% |
| Here: | 32.3% |
| New Jersey: | 33.2% |
Union County government finances - Expenditure in 2018:
- Assistance and Subsidies - Public Welfare, Federal Categorical Assistance Programs: $10,417,000
Public Welfare, Cash Assistance Programs - Other: $4,796,000
- Bond Funds - Cash and Securities: $98,156,000
Cash and Securities: $92,599,000
- Charges - Higher Education - Other: $28,003,000
Higher Education - Other: $27,088,000
Hospital Public: $15,248,000
Hospital Public: $13,275,000
Elementary and Secondary Education School Tuition and Transportation: $11,524,000
Other: $7,589,000
Parks and Recreation: $6,544,000
Parks and Recreation: $6,229,000
Housing and Community Development: $5,669,000
Other: $5,182,000
Housing and Community Development: $4,403,000
Elementary and Secondary Education School Tuition and Transportation: $405,000
Elementary and Secondary Education School Lunch: $395,000
Elementary and Secondary Education School Lunch: $336,000
Elementary and Secondary Education - Other: $150,000
Elementary and Secondary Education - Other: $109,000
- Construction - Other Higher Education: $5,500,000
Elementary and Secondary Education: $1,407,000
Other Higher Education: $1,188,000
Elementary and Secondary Education: $227,000
- Current Operations - General - Other: $213,799,000
General - Other: $86,579,000
Other Higher Education: $77,268,000
Other Higher Education: $73,065,000
Elementary and Secondary Education: $54,396,000
Elementary and Secondary Education: $49,408,000
Public Welfare - Other: $42,094,000
Police Protection: $35,466,000
Correctional Institutions: $35,259,000
Correctional Institutions: $34,869,000
Public Welfare - Other: $33,175,000
Police Protection: $31,001,000
Judicial and Legal Services: $24,934,000
Judicial and Legal Services: $23,540,000
Regular Highways: $17,831,000
Parks and Recreation: $13,286,000
General Public Buildings: $13,252,000
Parks and Recreation: $12,592,000
General Public Buildings: $12,585,000
Hospitals: $11,417,000
Central Staff Services: $8,868,000
Central Staff Services: $6,055,000
Financial Administration: $5,752,000
Financial Administration: $5,016,000
Housing and Community Development: $3,173,000
Health - Other: $2,765,000
Housing and Community Development: $2,696,000
Regular Highways: $2,478,000
Health - Other: $1,238,000
Corrections - Other: $888,000
Natural Resources - Other: $49,000
Natural Resources - Other: $47,000
- Federal Intergovernmental - Education: $4,446,000
Housing and Community Development: $4,322,000
Education: $3,946,000
Housing and Community Development: $782,000
Other: $124,000
- General - Interest on Debt: $26,690,000
Interest on Debt: $12,224,000
- Intergovernmental to State - Hospitals: $42,753,000
Elementary and Secondary Education: $46,000
Elementary and Secondary Education: $46,000
- Local Intergovernmental - Education: $49,759,000
Education: $39,749,000
- Long Term Debt - Beginning Outstanding - Unspecified Public Purpose: $673,314,000
Outstanding Unspecified Public Purpose: $625,134,000
Beginning Outstanding - Unspecified Public Purpose: $448,215,000
Outstanding Unspecified Public Purpose: $415,826,000
Retired Unspecified Public Purpose: $101,776,000
Issue, Unspecified Public Purpose: $53,595,000
Outstanding Nonguaranteed - Industrial Revenue: $44,499,000
Beginning Outstanding - Public Debt for Private Purpose: $44,499,000
Beginning Outstanding - Public Debt for Private Purpose: $44,499,000
Outstanding Nonguaranteed - Industrial Revenue: $44,499,000
Retired Unspecified Public Purpose: $39,489,000
Issue, Unspecified Public Purpose: $7,100,000
- Miscellaneous - Interest Earnings: $13,661,000
Interest Earnings: $10,917,000
General Revenue - Other: $7,475,000
General Revenue - Other: $5,279,000
Fines and Forfeits: $2,942,000
Fines and Forfeits: $2,926,000
Rents: $657,000
Rents: $475,000
Donations From Private Sources: $409,000
Donations From Private Sources: $366,000
- Other Capital Outlay - Elementary and Secondary Education: $3,887,000
Elementary and Secondary Education: $3,865,000
Other Higher Education: $833,000
Other Higher Education: $769,000
- Other Funds - Cash and Securities: $265,887,000
Cash and Securities: $171,255,000
- Short Term Debt Outstanding - End of Fiscal Year: $90,000,000
Beginning: $60,000,000
End of Fiscal Year: $2,158,000
Beginning: $326,000
- Sinking Funds - Cash and Securities: $44,499,000
Cash and Securities: $44,499,000
- State Intergovernmental - Education: $26,081,000
Education: $20,425,000
Other: $17,748,000
Other: $15,358,000
Public Welfare: $7,256,000
Health and Hospitals: $3,299,000
Highways: $1,082,000
General Local Government Support: $243,000
Highways: $146,000
- Tax - Property: $367,295,000
Property: $354,770,000
Documentary and Stock Transfer: $5,892,000
Documentary and Stock Transfer: $5,483,000
Other License: $204,000
- Total Salaries and Wages: $32,541,000
: $29,380,000
Union County government finances - Revenue in 2018:
- Assistance and Subsidies - Public Welfare, Federal Categorical Assistance Programs: $10,417,000
Public Welfare, Cash Assistance Programs - Other: $4,796,000
- Bond Funds - Cash and Securities: $98,156,000
Cash and Securities: $92,599,000
- Charges - Higher Education - Other: $28,003,000
Higher Education - Other: $27,088,000
Hospital Public: $15,248,000
Hospital Public: $13,275,000
Elementary and Secondary Education School Tuition and Transportation: $11,524,000
Other: $7,589,000
Parks and Recreation: $6,544,000
Parks and Recreation: $6,229,000
Housing and Community Development: $5,669,000
Other: $5,182,000
Housing and Community Development: $4,403,000
Elementary and Secondary Education School Tuition and Transportation: $405,000
Elementary and Secondary Education School Lunch: $395,000
Elementary and Secondary Education School Lunch: $336,000
Elementary and Secondary Education - Other: $150,000
Elementary and Secondary Education - Other: $109,000
- Construction - Other Higher Education: $5,500,000
Elementary and Secondary Education: $1,407,000
Other Higher Education: $1,188,000
Elementary and Secondary Education: $227,000
- Current Operations - General - Other: $213,799,000
General - Other: $86,579,000
Other Higher Education: $77,268,000
Other Higher Education: $73,065,000
Elementary and Secondary Education: $54,396,000
Elementary and Secondary Education: $49,408,000
Public Welfare - Other: $42,094,000
Police Protection: $35,466,000
Correctional Institutions: $35,259,000
Correctional Institutions: $34,869,000
Public Welfare - Other: $33,175,000
Police Protection: $31,001,000
Judicial and Legal Services: $24,934,000
Judicial and Legal Services: $23,540,000
Regular Highways: $17,831,000
Parks and Recreation: $13,286,000
General Public Buildings: $13,252,000
Parks and Recreation: $12,592,000
General Public Buildings: $12,585,000
Hospitals: $11,417,000
Central Staff Services: $8,868,000
Central Staff Services: $6,055,000
Financial Administration: $5,752,000
Financial Administration: $5,016,000
Housing and Community Development: $3,173,000
Health - Other: $2,765,000
Housing and Community Development: $2,696,000
Regular Highways: $2,478,000
Health - Other: $1,238,000
Corrections - Other: $888,000
Natural Resources - Other: $49,000
Natural Resources - Other: $47,000
- Federal Intergovernmental - Education: $4,446,000
Housing and Community Development: $4,322,000
Education: $3,946,000
Housing and Community Development: $782,000
Other: $124,000
- General - Interest on Debt: $26,690,000
Interest on Debt: $12,224,000
- Intergovernmental to State - Hospitals: $42,753,000
Elementary and Secondary Education: $46,000
Elementary and Secondary Education: $46,000
- Local Intergovernmental - Education: $49,759,000
Education: $39,749,000
- Long Term Debt - Beginning Outstanding - Unspecified Public Purpose: $673,314,000
Outstanding Unspecified Public Purpose: $625,134,000
Beginning Outstanding - Unspecified Public Purpose: $448,215,000
Outstanding Unspecified Public Purpose: $415,826,000
Retired Unspecified Public Purpose: $101,776,000
Issue, Unspecified Public Purpose: $53,595,000
Outstanding Nonguaranteed - Industrial Revenue: $44,499,000
Beginning Outstanding - Public Debt for Private Purpose: $44,499,000
Beginning Outstanding - Public Debt for Private Purpose: $44,499,000
Outstanding Nonguaranteed - Industrial Revenue: $44,499,000
Retired Unspecified Public Purpose: $39,489,000
Issue, Unspecified Public Purpose: $7,100,000
- Miscellaneous - Interest Earnings: $13,661,000
Interest Earnings: $10,917,000
General Revenue - Other: $7,475,000
General Revenue - Other: $5,279,000
Fines and Forfeits: $2,942,000
Fines and Forfeits: $2,926,000
Rents: $657,000
Rents: $475,000
Donations From Private Sources: $409,000
Donations From Private Sources: $366,000
- Other Capital Outlay - Elementary and Secondary Education: $3,887,000
Elementary and Secondary Education: $3,865,000
Other Higher Education: $833,000
Other Higher Education: $769,000
- Other Funds - Cash and Securities: $265,887,000
Cash and Securities: $171,255,000
- Short Term Debt Outstanding - End of Fiscal Year: $90,000,000
Beginning: $60,000,000
End of Fiscal Year: $2,158,000
Beginning: $326,000
- Sinking Funds - Cash and Securities: $44,499,000
Cash and Securities: $44,499,000
- State Intergovernmental - Education: $26,081,000
Education: $20,425,000
Other: $17,748,000
Other: $15,358,000
Public Welfare: $7,256,000
Health and Hospitals: $3,299,000
Highways: $1,082,000
General Local Government Support: $243,000
Highways: $146,000
- Tax - Property: $367,295,000
Property: $354,770,000
Documentary and Stock Transfer: $5,892,000
Documentary and Stock Transfer: $5,483,000
Other License: $204,000
- Total Salaries and Wages: $32,541,000
: $29,380,000
Union County government finances - Debt in 2018:
- Assistance and Subsidies - Public Welfare, Federal Categorical Assistance Programs: $10,417,000
Public Welfare, Cash Assistance Programs - Other: $4,796,000
- Bond Funds - Cash and Securities: $98,156,000
Cash and Securities: $92,599,000
- Charges - Higher Education - Other: $28,003,000
Higher Education - Other: $27,088,000
Hospital Public: $15,248,000
Hospital Public: $13,275,000
Elementary and Secondary Education School Tuition and Transportation: $11,524,000
Other: $7,589,000
Parks and Recreation: $6,544,000
Parks and Recreation: $6,229,000
Housing and Community Development: $5,669,000
Other: $5,182,000
Housing and Community Development: $4,403,000
Elementary and Secondary Education School Tuition and Transportation: $405,000
Elementary and Secondary Education School Lunch: $395,000
Elementary and Secondary Education School Lunch: $336,000
Elementary and Secondary Education - Other: $150,000
Elementary and Secondary Education - Other: $109,000
- Construction - Other Higher Education: $5,500,000
Elementary and Secondary Education: $1,407,000
Other Higher Education: $1,188,000
Elementary and Secondary Education: $227,000
- Current Operations - General - Other: $213,799,000
General - Other: $86,579,000
Other Higher Education: $77,268,000
Other Higher Education: $73,065,000
Elementary and Secondary Education: $54,396,000
Elementary and Secondary Education: $49,408,000
Public Welfare - Other: $42,094,000
Police Protection: $35,466,000
Correctional Institutions: $35,259,000
Correctional Institutions: $34,869,000
Public Welfare - Other: $33,175,000
Police Protection: $31,001,000
Judicial and Legal Services: $24,934,000
Judicial and Legal Services: $23,540,000
Regular Highways: $17,831,000
Parks and Recreation: $13,286,000
General Public Buildings: $13,252,000
Parks and Recreation: $12,592,000
General Public Buildings: $12,585,000
Hospitals: $11,417,000
Central Staff Services: $8,868,000
Central Staff Services: $6,055,000
Financial Administration: $5,752,000
Financial Administration: $5,016,000
Housing and Community Development: $3,173,000
Health - Other: $2,765,000
Housing and Community Development: $2,696,000
Regular Highways: $2,478,000
Health - Other: $1,238,000
Corrections - Other: $888,000
Natural Resources - Other: $49,000
Natural Resources - Other: $47,000
- Federal Intergovernmental - Education: $4,446,000
Housing and Community Development: $4,322,000
Education: $3,946,000
Housing and Community Development: $782,000
Other: $124,000
- General - Interest on Debt: $26,690,000
Interest on Debt: $12,224,000
- Intergovernmental to State - Hospitals: $42,753,000
Elementary and Secondary Education: $46,000
Elementary and Secondary Education: $46,000
- Local Intergovernmental - Education: $49,759,000
Education: $39,749,000
- Long Term Debt - Beginning Outstanding - Unspecified Public Purpose: $673,314,000
Outstanding Unspecified Public Purpose: $625,134,000
Beginning Outstanding - Unspecified Public Purpose: $448,215,000
Outstanding Unspecified Public Purpose: $415,826,000
Retired Unspecified Public Purpose: $101,776,000
Issue, Unspecified Public Purpose: $53,595,000
Outstanding Nonguaranteed - Industrial Revenue: $44,499,000
Beginning Outstanding - Public Debt for Private Purpose: $44,499,000
Beginning Outstanding - Public Debt for Private Purpose: $44,499,000
Outstanding Nonguaranteed - Industrial Revenue: $44,499,000
Retired Unspecified Public Purpose: $39,489,000
Issue, Unspecified Public Purpose: $7,100,000
- Miscellaneous - Interest Earnings: $13,661,000
Interest Earnings: $10,917,000
General Revenue - Other: $7,475,000
General Revenue - Other: $5,279,000
Fines and Forfeits: $2,942,000
Fines and Forfeits: $2,926,000
Rents: $657,000
Rents: $475,000
Donations From Private Sources: $409,000
Donations From Private Sources: $366,000
- Other Capital Outlay - Elementary and Secondary Education: $3,887,000
Elementary and Secondary Education: $3,865,000
Other Higher Education: $833,000
Other Higher Education: $769,000
- Other Funds - Cash and Securities: $265,887,000
Cash and Securities: $171,255,000
- Short Term Debt Outstanding - End of Fiscal Year: $90,000,000
Beginning: $60,000,000
End of Fiscal Year: $2,158,000
Beginning: $326,000
- Sinking Funds - Cash and Securities: $44,499,000
Cash and Securities: $44,499,000
- State Intergovernmental - Education: $26,081,000
Education: $20,425,000
Other: $17,748,000
Other: $15,358,000
Public Welfare: $7,256,000
Health and Hospitals: $3,299,000
Highways: $1,082,000
General Local Government Support: $243,000
Highways: $146,000
- Tax - Property: $367,295,000
Property: $354,770,000
Documentary and Stock Transfer: $5,892,000
Documentary and Stock Transfer: $5,483,000
Other License: $204,000
- Total Salaries and Wages: $32,541,000
: $29,380,000
Union County government finances - Cash and Securities in 2018:
- Assistance and Subsidies - Public Welfare, Federal Categorical Assistance Programs: $10,417,000
Public Welfare, Cash Assistance Programs - Other: $4,796,000
- Bond Funds - Cash and Securities: $98,156,000
Cash and Securities: $92,599,000
- Charges - Higher Education - Other: $28,003,000
Higher Education - Other: $27,088,000
Hospital Public: $15,248,000
Hospital Public: $13,275,000
Elementary and Secondary Education School Tuition and Transportation: $11,524,000
Other: $7,589,000
Parks and Recreation: $6,544,000
Parks and Recreation: $6,229,000
Housing and Community Development: $5,669,000
Other: $5,182,000
Housing and Community Development: $4,403,000
Elementary and Secondary Education School Tuition and Transportation: $405,000
Elementary and Secondary Education School Lunch: $395,000
Elementary and Secondary Education School Lunch: $336,000
Elementary and Secondary Education - Other: $150,000
Elementary and Secondary Education - Other: $109,000
- Construction - Other Higher Education: $5,500,000
Elementary and Secondary Education: $1,407,000
Other Higher Education: $1,188,000
Elementary and Secondary Education: $227,000
- Current Operations - General - Other: $213,799,000
General - Other: $86,579,000
Other Higher Education: $77,268,000
Other Higher Education: $73,065,000
Elementary and Secondary Education: $54,396,000
Elementary and Secondary Education: $49,408,000
Public Welfare - Other: $42,094,000
Police Protection: $35,466,000
Correctional Institutions: $35,259,000
Correctional Institutions: $34,869,000
Public Welfare - Other: $33,175,000
Police Protection: $31,001,000
Judicial and Legal Services: $24,934,000
Judicial and Legal Services: $23,540,000
Regular Highways: $17,831,000
Parks and Recreation: $13,286,000
General Public Buildings: $13,252,000
Parks and Recreation: $12,592,000
General Public Buildings: $12,585,000
Hospitals: $11,417,000
Central Staff Services: $8,868,000
Central Staff Services: $6,055,000
Financial Administration: $5,752,000
Financial Administration: $5,016,000
Housing and Community Development: $3,173,000
Health - Other: $2,765,000
Housing and Community Development: $2,696,000
Regular Highways: $2,478,000
Health - Other: $1,238,000
Corrections - Other: $888,000
Natural Resources - Other: $49,000
Natural Resources - Other: $47,000
- Federal Intergovernmental - Education: $4,446,000
Housing and Community Development: $4,322,000
Education: $3,946,000
Housing and Community Development: $782,000
Other: $124,000
- General - Interest on Debt: $26,690,000
Interest on Debt: $12,224,000
- Intergovernmental to State - Hospitals: $42,753,000
Elementary and Secondary Education: $46,000
Elementary and Secondary Education: $46,000
- Local Intergovernmental - Education: $49,759,000
Education: $39,749,000
- Long Term Debt - Beginning Outstanding - Unspecified Public Purpose: $673,314,000
Outstanding Unspecified Public Purpose: $625,134,000
Beginning Outstanding - Unspecified Public Purpose: $448,215,000
Outstanding Unspecified Public Purpose: $415,826,000
Retired Unspecified Public Purpose: $101,776,000
Issue, Unspecified Public Purpose: $53,595,000
Outstanding Nonguaranteed - Industrial Revenue: $44,499,000
Beginning Outstanding - Public Debt for Private Purpose: $44,499,000
Beginning Outstanding - Public Debt for Private Purpose: $44,499,000
Outstanding Nonguaranteed - Industrial Revenue: $44,499,000
Retired Unspecified Public Purpose: $39,489,000
Issue, Unspecified Public Purpose: $7,100,000
- Miscellaneous - Interest Earnings: $13,661,000
Interest Earnings: $10,917,000
General Revenue - Other: $7,475,000
General Revenue - Other: $5,279,000
Fines and Forfeits: $2,942,000
Fines and Forfeits: $2,926,000
Rents: $657,000
Rents: $475,000
Donations From Private Sources: $409,000
Donations From Private Sources: $366,000
- Other Capital Outlay - Elementary and Secondary Education: $3,887,000
Elementary and Secondary Education: $3,865,000
Other Higher Education: $833,000
Other Higher Education: $769,000
- Other Funds - Cash and Securities: $265,887,000
Cash and Securities: $171,255,000
- Short Term Debt Outstanding - End of Fiscal Year: $90,000,000
Beginning: $60,000,000
End of Fiscal Year: $2,158,000
Beginning: $326,000
- Sinking Funds - Cash and Securities: $44,499,000
Cash and Securities: $44,499,000
- State Intergovernmental - Education: $26,081,000
Education: $20,425,000
Other: $17,748,000
Other: $15,358,000
Public Welfare: $7,256,000
Health and Hospitals: $3,299,000
Highways: $1,082,000
General Local Government Support: $243,000
Highways: $146,000
- Tax - Property: $367,295,000
Property: $354,770,000
Documentary and Stock Transfer: $5,892,000
Documentary and Stock Transfer: $5,483,000
Other License: $204,000
- Total Salaries and Wages: $32,541,000
: $29,380,000
Supplemental Security Income (SSI) in 2006:
- Total number of recipients: 9,110
- Number of aged recipients: 2,253
- Number of blind and disabled recipients: 6,857
- Number of recipients under 18: 1,397
- Number of recipients between 18 and 64: 4,340
- Number of recipients older than 64: 3,373
- Number of recipients also receiving OASDI: 2,844
- Amount of payments (thousands of dollars): 4,144
| Home Mortgage Disclosure Act Aggregated Statistics For Year 2009 (Based on 106 full tracts) | ||||||||||||||
| A) FHA, FSA/RHS & VA Home Purchase Loans | B) Conventional Home Purchase Loans | C) Refinancings | D) Home Improvement Loans | E) Loans on Dwellings For 5+ Families | F) Non-occupant Loans on < 5 Family Dwellings (A B C & D) | G) Loans On Manufactured Home Dwelling (A B C & D) | ||||||||
|---|---|---|---|---|---|---|---|---|---|---|---|---|---|---|
| Number | Average Value | Number | Average Value | Number | Average Value | Number | Average Value | Number | Average Value | Number | Average Value | Number | Average Value | |
| LOANS ORIGINATED | 1,678 | $267,042 | 2,035 | $338,549 | 9,418 | $303,400 | 433 | $150,229 | 46 | $2,933,609 | 281 | $203,630 | 1 | $165,000 |
| APPLICATIONS APPROVED, NOT ACCEPTED | 177 | $254,531 | 238 | $326,655 | 1,020 | $277,006 | 82 | $98,220 | 4 | $1,881,250 | 44 | $217,909 | 1 | $10,000 |
| APPLICATIONS DENIED | 463 | $254,462 | 401 | $288,135 | 3,901 | $289,841 | 491 | $90,155 | 9 | $573,222 | 231 | $204,126 | 6 | $161,500 |
| APPLICATIONS WITHDRAWN | 375 | $244,232 | 300 | $307,650 | 2,348 | $287,458 | 97 | $149,320 | 7 | $1,354,714 | 107 | $227,636 | 0 | $0 |
| FILES CLOSED FOR INCOMPLETENESS | 207 | $251,116 | 83 | $274,554 | 743 | $305,560 | 42 | $120,762 | 1 | $500,000 | 27 | $211,481 | 0 | $0 |
| Private Mortgage Insurance Companies Aggregated Statistics For Year 2009 (Based on 98 full tracts) | ||||||
| A) Conventional Home Purchase Loans | B) Refinancings | C) Non-occupant Loans on < 5 Family Dwellings (A & B) | ||||
|---|---|---|---|---|---|---|
| Number | Average Value | Number | Average Value | Number | Average Value | |
| LOANS ORIGINATED | 314 | $315,401 | 134 | $345,179 | 0 | $0 |
| APPLICATIONS APPROVED, NOT ACCEPTED | 121 | $302,926 | 76 | $342,605 | 5 | $243,400 |
| APPLICATIONS DENIED | 52 | $301,250 | 61 | $326,754 | 0 | $0 |
| APPLICATIONS WITHDRAWN | 37 | $300,622 | 24 | $330,542 | 0 | $0 |
| FILES CLOSED FOR INCOMPLETENESS | 15 | $303,467 | 7 | $291,429 | 1 | $203,000 |
| Most common first names in Union County, NJ among deceased individuals | ||
| Name | Count | Lived (average) |
|---|---|---|
| John | 5,798 | 74.5 years |
| Mary | 5,474 | 80.7 years |
| Joseph | 4,115 | 74.8 years |
| William | 3,716 | 74.2 years |
| Anna | 3,170 | 82.2 years |
| Helen | 2,854 | 79.6 years |
| George | 2,342 | 75.2 years |
| Frank | 2,259 | 75.5 years |
| Charles | 2,235 | 74.9 years |
| James | 2,223 | 72.0 years |
| Most common last names in Union County, NJ among deceased individuals | ||
| Last name | Count | Lived (average) |
|---|---|---|
| Smith | 979 | 75.3 years |
| Brown | 650 | 72.9 years |
| Williams | 650 | 72.0 years |
| Johnson | 634 | 72.5 years |
| Miller | 591 | 77.1 years |
| Jones | 531 | 71.9 years |
| Davis | 394 | 72.7 years |
| Taylor | 321 | 74.6 years |
| Wilson | 292 | 74.8 years |
| Thomas | 277 | 72.5 years |
| Businesses in Union County, NJ | ||||
| Name | Count | Name | Count | |
|---|---|---|---|---|
| 7-Eleven | 23 | Jones New York | 6 | |
| A&P | 4 | Journeys | 1 | |
| ALDI | 2 | Justice | 2 | |
| ALDO | 1 | KFC | 5 | |
| AT&T | 7 | Knights Inn | 2 | |
| Ace Hardware | 1 | Kohl's | 1 | |
| Advance Auto Parts | 5 | Lane Bryant | 1 | |
| Aeropostale | 1 | Lane Furniture | 1 | |
| Aerosoles | 2 | LensCrafters | 1 | |
| American Eagle Outfitters | 1 | Levi Strauss & Co. | 1 | |
| Ann Taylor | 2 | Lowe's | 1 | |
| Applebee's | 3 | Macy's | 1 | |
| Ashley Furniture | 1 | Marriott | 3 | |
| AutoZone | 2 | Marshalls | 3 | |
| Avenue | 2 | MasterBrand Cabinets | 25 | |
| BMW | 1 | McDonald's | 15 | |
| Bally Total Fitness | 2 | Men's Wearhouse | 1 | |
| Banana Republic | 2 | Motherhood Maternity | 2 | |
| Barnes & Noble | 2 | New Balance | 8 | |
| Baskin-Robbins | 6 | New York & Co | 1 | |
| Bath & Body Works | 1 | Nike | 4 | |
| Bed Bath & Beyond | 2 | Nissan | 2 | |
| Best Western | 3 | Office Depot | 1 | |
| Blockbuster | 4 | Old Navy | 2 | |
| Brooks Brothers | 2 | Olive Garden | 1 | |
| Burger King | 13 | Outback | 1 | |
| CVS | 17 | Outback Steakhouse | 1 | |
| Casual Male XL | 2 | Panera Bread | 2 | |
| Catherines | 1 | Papa John's Pizza | 2 | |
| Charlotte Russe | 1 | Pathmark | 3 | |
| Chevrolet | 1 | Payless | 7 | |
| Chico's | 1 | Penske | 2 | |
| Chipotle | 1 | PetSmart | 1 | |
| Cinnabon | 1 | Pier 1 Imports | 1 | |
| Circle K | 2 | Pizza Hut | 5 | |
| Clarks | 1 | Popeyes | 4 | |
| Cold Stone Creamery | 2 | Qdoba Mexican Grill | 1 | |
| Coldwater Creek | 1 | Quiznos | 5 | |
| Costco | 1 | RadioShack | 9 | |
| Curves | 6 | Red Lobster | 1 | |
| DHL | 4 | Rite Aid | 6 | |
| Dairy Queen | 5 | Rodeway Inn | 1 | |
| Deb | 1 | Ruby Tuesday | 2 | |
| Domino's Pizza | 11 | SONIC Drive-In | 1 | |
| DressBarn | 4 | Sam's Club | 1 | |
| Dressbarn | 4 | Sears | 4 | |
| Dunkin Donuts | 45 | Skechers USA | 2 | |
| Econo Lodge | 1 | Sprint Nextel | 5 | |
| Extended Stay America | 1 | Staples | 2 | |
| Famous Footwear | 2 | Starbucks | 7 | |
| Fashion Bug | 1 | Stop & Shop | 4 | |
| FedEx | 90 | Subaru | 1 | |
| Finish Line | 1 | Subway | 18 | |
| Firestone Complete Auto Care | 3 | T-Mobile | 1 | |
| Foot Locker | 3 | T.G.I. Driday's | 2 | |
| Ford | 1 | T.J.Maxx | 1 | |
| Forever 21 | 1 | Taco Bell | 5 | |
| GNC | 8 | Target | 3 | |
| GameStop | 10 | The Room Place | 5 | |
| Gap | 3 | Toyota | 2 | |
| Goodwill | 4 | Toys"R"Us | 4 | |
| Gymboree | 1 | Trader Joe's | 1 | |
| H&M | 1 | Travelodge | 1 | |
| H&R Block | 11 | True Value | 6 | |
| Harmon Face Values | 1 | U-Haul | 17 | |
| Haworth | 2 | UPS | 97 | |
| Hilton | 4 | Verizon Wireless | 6 | |
| Holiday Inn | 3 | Victoria's Secret | 2 | |
| Home Depot | 4 | Volkswagen | 3 | |
| Honda | 2 | Walgreens | 9 | |
| Hot Topic | 1 | Walmart | 2 | |
| Hyundai | 1 | Wendy's | 8 | |
| IHOP | 3 | White Castle | 4 | |
| IKEA | 1 | Wine & Spirits | 1 | |
| JoS. A. Bank | 2 | YMCA | 14 | |
| Johnny Rockets | 1 | |||
Union County on our top lists:
- #15 on the list of "Top 101 counties with the lowest percentage of residents that keep firearms around their homes"
- #17 on the list of "Top 101 counties with the largest decrease in the number of deaths per 1000 residents 2000-2006 to 2007-2013 (pop. 50,000+)"
- #47 on the list of "Top 101 counties with the most Orthodox adherents"
- #47 on the list of "Top 101 counties with the most Orthodox adherents (pop. 50,000+)"
- #53 on the list of "Top 101 counties with the most Catholic adherents"
- #53 on the list of "Top 101 counties with the most Catholic adherents (pop. 50,000+)"
- #58 on the list of "Top 101 counties with the lowest percentage of residents that drank alcohol in the past 30 days"
- #63 on the list of "Top 101 counties with the lowest percentage of residents that smoked 100+ cigarettes in their lives"
- #65 on the list of "Top 101 counties with the most Orthodox congregations"
- #65 on the list of "Top 101 counties with the most Orthodox congregations (pop. 50,000+)"
- #73 on the list of "Top 101 counties with the lowest number of infant deaths per 1000 residents 2007-2013 (pop. 50,000+)"
- #75 on the list of "Top 101 counties with highest percentage of residents voting for Obama (Democrat) in the 2012 Presidential Election (pop. 50,000+)"
- #79 on the list of "Top 101 counties with the highest average weight of females"
- #81 on the list of "Top 101 counties with the most Catholic congregations (pop. 50,000+)"
- #82 on the list of "Top 101 counties with the most Catholic congregations"
- #86 on the list of "Top 101 counties with the highest percentage of residents that visited a dentist within the past year"
- #88 on the list of "Top 101 counties with the lowest percentage of residents that exercised in the past month"
- #90 on the list of "Top 101 counties with the highest carbon monoxide air pollution readings in 2012 (ppm)"
- #93 on the list of "Top 101 counties with the most Black Protestant congregations (pop. 50,000+)"
- #95 on the list of "Top 101 counties with the largest decrease in the number of infant deaths per 1000 residents 2000-2006 to 2007-2013 (pop. 50,000+)"