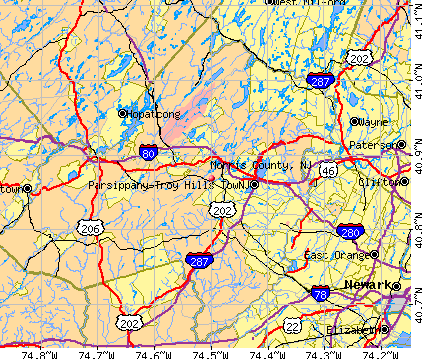
Morris County, New Jersey (NJ)
County owner-occupied free and clear houses and condos in 2010: 35,155
County owner-occupied houses and condos in 2000: 128,990
Renter-occupied apartments: 45,218 (it was 40,721 in 2000)
| % of renters here: | 24% |
| State: | 35% |
Land area: 469 sq. mi.
Water area: 12.3 sq. mi.
Population density: 1090 people per square mile (very high).
Industries providing employment: Educational, health and social services (23.1%), Professional, scientific, management, administrative, and waste management services (17.1%), Manufacturing (12.7%), Finance, insurance, real estate, and rental and leasing (10.1%).
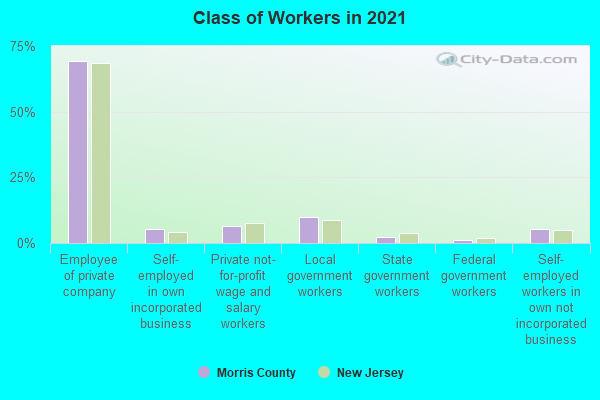
Type of workers:
- Private wage or salary: 83%
- Government: 13%
- Self-employed, not incorporated: 4%
- Unpaid family work: 0%
- OSM Map
- General Map
- Google Map
- MSN Map

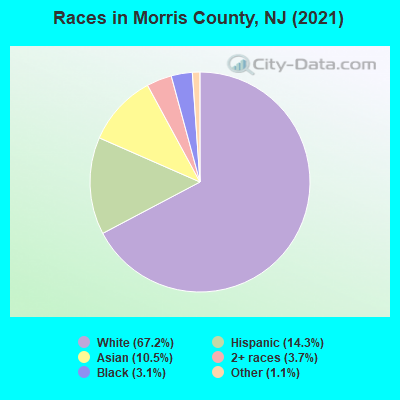
- 340,00266.5%White Non-Hispanic Alone
- 76,01614.9%Hispanic or Latino
- 57,04311.2%Asian alone
- 18,7253.7%Two or more races
- 15,9403.1%Black Non-Hispanic Alone
- 3,2700.6%Some other race alone
- 1550.03%American Indian and Alaska Native alone
| Median resident age: | 42.4 years |
| New Jersey median age: | 40.4 years |
| Males: 254,000 | |
| Females: 257,151 |

 | Bergen County Morris County - Planning to buy a house (70 replies) |
| What other state gives off a western Morris County vibe? (12 replies) |
| NJ Real Estate Market. (125 replies) |
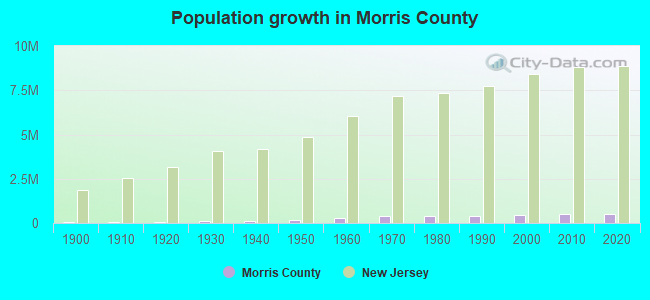
| Why is Morris County's population not growing? (30 replies) |
| Legit Morris County HVAC Company (3 replies) |
| Which areas in Morris County for apartments? (5 replies) |
| Morris County: | 2.0 people |
| New Jersey: | 3 people |
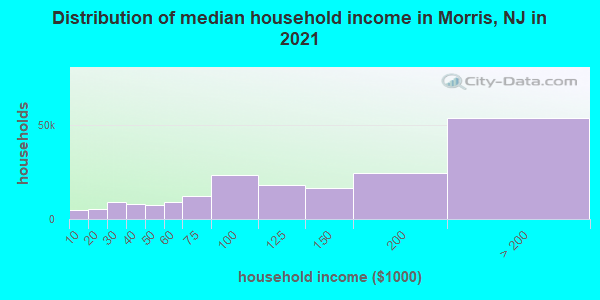
Estimated median household income in 2022: $131,795 ($77,340 in 1999)
| This county: | $131,795 |
| New Jersey: | $96,346 |
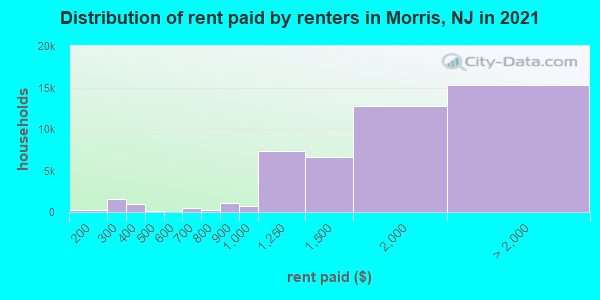
Median contract rent in 2022 for apartments: $1,623 (lower quartile is $1,274, upper quartile is $2,095)
| This county: | $1623 |
| State: | $1399 |
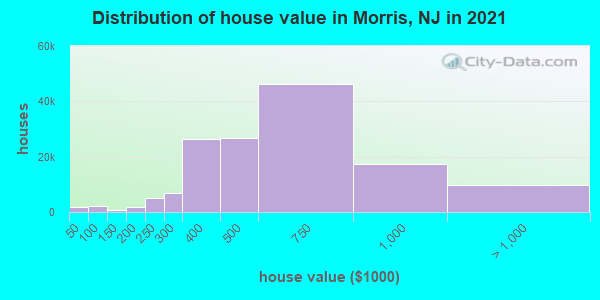
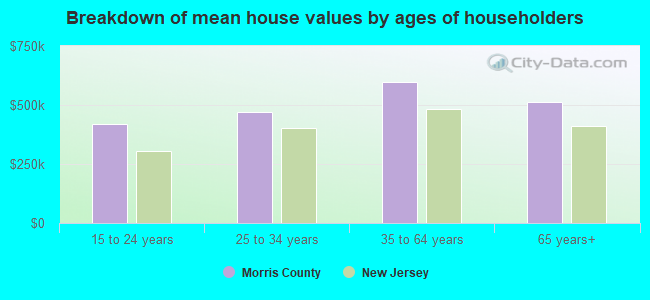
Estimated median house or condo value in 2022: $546,600 (it was $250,400 in 2000)
| Morris: | $546,600 |
| New Jersey: | $428,900 |
Mean price in 2022:
Median monthly housing costs for homes and condos with a mortgage: $3,023Detached houses: $664,752
Here: $664,752 State: $537,591 Townhouses or other attached units: $475,118
Here: $475,118 State: $381,113 In 2-unit structures: $385,608
Here: $385,608 State: $444,476 In 3-to-4-unit structures: $439,830
Here: $439,830 State: $457,463 In 5-or-more-unit structures: $288,279
Here: $288,279 State: $368,745 Mobile homes: $259,618
Here: $259,618 State: $119,788
Median monthly housing costs for units without a mortgage: $1,253
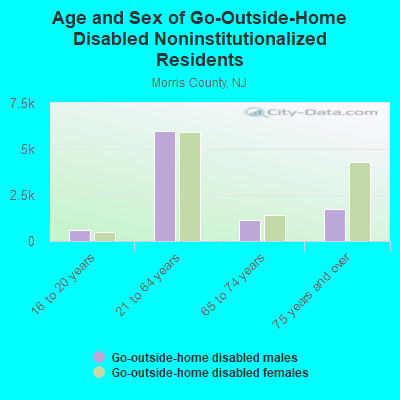
Institutionalized population: 3,743
Crime in 2020 (reported by the sheriff's office or county police, not the county total):
- Murders: 0
- Rapes: 0
- Robberies: 0
- Assaults: 0
- Burglaries: 0
- Thefts: 0
- Auto thefts: 0
Crime in 2019 (reported by the sheriff's office or county police, not the county total):
- Murders: 0
- Rapes: 0
- Robberies: 0
- Assaults: 0
- Burglaries: 0
- Thefts: 0
- Auto thefts: 0
Health of residents in Morris County based on CDC Behavioral Risk Factor Surveillance System Survey Questionnaires from 2003 to 2012:
General health status score of residents in this county from 1 (poor) to 5 (excellent) is 3.8. This is significantly better than average.77.3% of residents exercised in the past month. This is about average.
44.7% of residents smoked 100+ cigarettes in their lives. This is about average.
81.9% of adult residents drank alcohol in the past 30 days. This is more than average.
82.8% of residents visited a dentist within the past year. This is more than average.
Average weight of males is 192 pounds. This is about average.
Average weight of females is 157 pounds. This is about average.
12.3% of residents keep firearms around their homes. This is less than average.
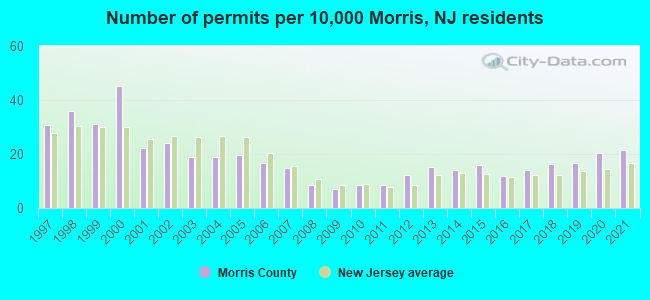
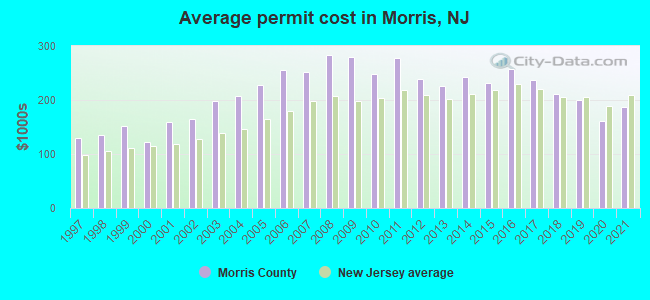
Single-family new house construction building permits:
- 2022: 843 buildings, average cost: $213,500
- 2021: 1011 buildings, average cost: $186,700
- 2020: 964 buildings, average cost: $161,000
- 2019: 787 buildings, average cost: $199,800
- 2018: 771 buildings, average cost: $210,500
- 2017: 658 buildings, average cost: $236,600
- 2016: 556 buildings, average cost: $258,200
- 2015: 743 buildings, average cost: $230,600
- 2014: 658 buildings, average cost: $243,100
- 2013: 716 buildings, average cost: $225,000
- 2012: 577 buildings, average cost: $238,600
- 2011: 398 buildings, average cost: $276,500
- 2010: 409 buildings, average cost: $248,000
- 2009: 328 buildings, average cost: $278,900
- 2008: 402 buildings, average cost: $283,500
- 2007: 688 buildings, average cost: $252,100
- 2006: 791 buildings, average cost: $256,200
- 2005: 927 buildings, average cost: $227,500
- 2004: 888 buildings, average cost: $208,400
- 2003: 885 buildings, average cost: $198,000
- 2002: 1128 buildings, average cost: $164,800
- 2001: 1038 buildings, average cost: $160,300
- 2000: 2122 buildings, average cost: $122,800
- 1999: 1460 buildings, average cost: $151,400
- 1998: 1687 buildings, average cost: $135,100
- 1997: 1449 buildings, average cost: $129,600
Median real estate property taxes paid for housing units with mortgages in 2022: $10,001 (1.8%)
Median real estate property taxes paid for housing units with no mortgage in 2022: $10,000 (2.0%)
| Morris County: | 4.1% |
| New Jersey: | 9.7% |
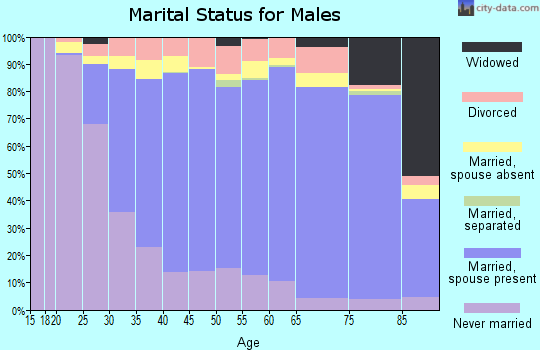
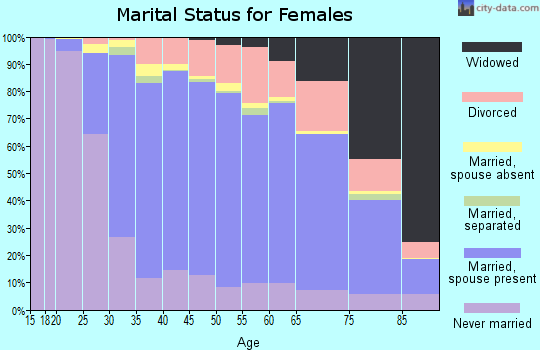
Median age of residents in 2022: 42.4 years old
(Males: 41.1 years old, Females: 43.8 years old)
(Median age for: White residents: 46.9 years old, Black residents: 41.1 years old, American Indian residents: 39.8 years old, Asian residents: 39.3 years old, Hispanic or Latino residents: 35.7 years old, Other race residents: 35.8 years old)
Area name: Newark, NJ HUD Metro FMR Area
Fair market rent in 2006 for a 1-bedroom apartment in Morris County is $879 a month.
Fair market rent for a 2-bedroom apartment is $1004 a month.
Fair market rent for a 3-bedroom apartment is $1202 a month.
Cities in this county include: Morristown, Dover, Madison, Succasunna-Kenvil, Lincoln Park, Kinnelon, Succasunna, White Meadow Lake, Florham Park, Boonton.
2023 air pollution in Morris County:
Nitrogen Dioxide: 0.00 ppm (standard limit: 0.053 ppm). Below U.S. average.
Ozone (1-hour): 0.037 ppm (standard limit: 0.12 ppm). Near U.S. average.
Sulfur Oxides Annual: 0.001 ppm (standard limit: 0.03 ppm). Near U.S. average.
Neighboring counties: Adams County, Indiana  , Andrew County, Missouri , Clarion County, Pennsylvania , Rich County, Utah , Greene County, Pennsylvania , Nodaway County, Missouri , Scotts Bluff County, Nebraska , Union County, Iowa .
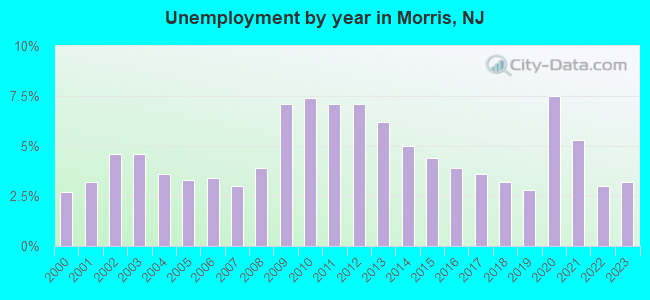
| Here: | 3.6% |
| New Jersey: | 4.5% |
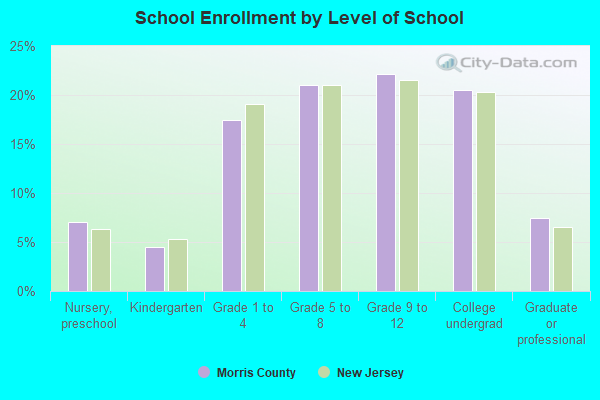
Current college students: 25,292
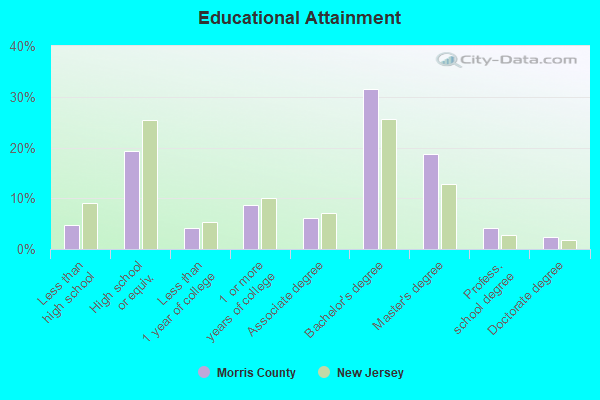
People 25 years of age or older with a high school degree or higher: 96.1%
People 25 years of age or older with a bachelor's degree or higher: 58.9%
Number of foreign born residents: 96,486 (66.3% naturalized citizens)
| Morris County: | 18.9% |
| Whole state: | 23.5% |
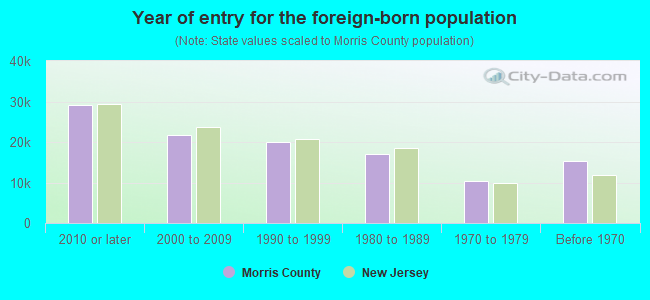
- Year of entry for the foreign-born population
- 25,1522010 or later
- 24,1032000 to 2009
- 17,8931990 to 1999
- 17,0651980 to 1989
- 10,4781970 to 1979
- 15,400Before 1970
Mean travel time to work (commute): minutes
Percentage of county residents living and working in this county: 94.2%
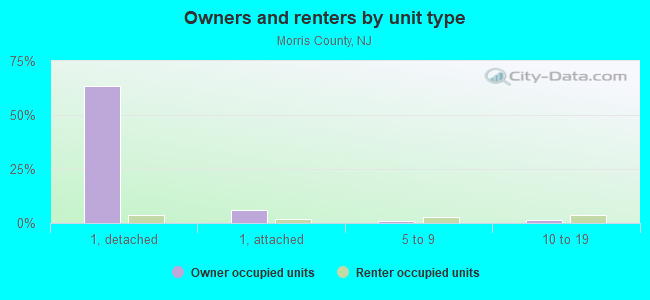
Housing units in structures:
- One, detached: 129,367
- One, attached: 17,406
- Two: 7,339
- 3 or 4: 7,750
- 5 to 9: 7,816
- 10 to 19: 9,666
- 20 to 49: 9,328
- 50 or more: 9,637
- Mobile homes: 661
Housing units in Morris County with a mortgage: 97,002 (11,978 second mortgage, 104 home equity loan, 11,529 both second mortgage and home equity loan)
Houses without a mortgage: 3,887
| Here: | 97.0% with mortgage |
| State: | 95.9% with mortgage |
Religion statistics for Morris County
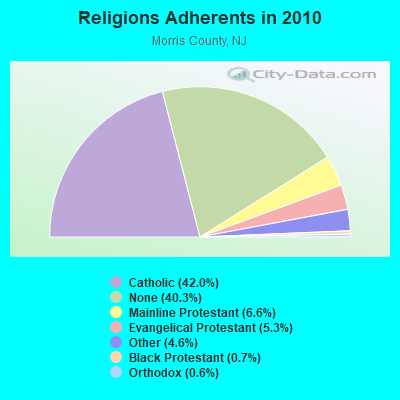
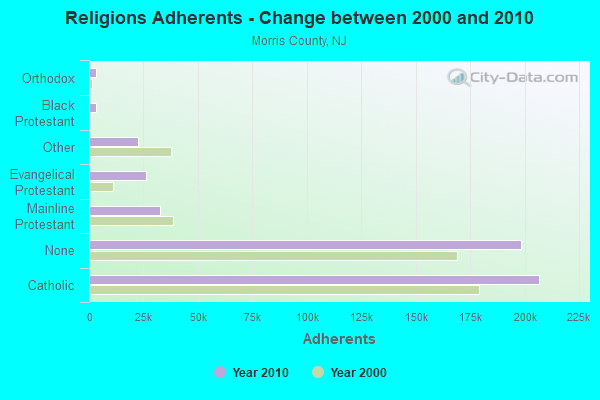
| Religion | Adherents | Congregations |
|---|---|---|
| Catholic | 206,700 | 49 |
| Mainline Protestant | 32,353 | 111 |
| Evangelical Protestant | 25,971 | 94 |
| Other | 22,414 | 43 |
| Black Protestant | 3,281 | 7 |
| Orthodox | 3,145 | 6 |
| None | 198,412 | - |
Source: Clifford Grammich, Kirk Hadaway, Richard Houseal, Dale E.Jones, Alexei Krindatch, Richie Stanley and Richard H.Taylor. 2012. 2010 U.S.Religion Census: Religious Congregations & Membership Study. Association of Statisticians of American Religious Bodies. Jones, Dale E., et al. 2002. Congregations and Membership in the United States 2000. Nashville, TN: Glenmary Research Center.
Food Environment Statistics:
| Morris County: | 2.12 / 10,000 pop. |
| State: | 2.90 / 10,000 pop. |
| Here: | 0.10 / 10,000 pop. |
| New Jersey: | 0.06 / 10,000 pop. |
| This county: | 1.13 / 10,000 pop. |
| New Jersey: | 1.76 / 10,000 pop. |
| Morris County: | 0.88 / 10,000 pop. |
| New Jersey: | 0.81 / 10,000 pop. |
| This county: | 8.80 / 10,000 pop. |
| State: | 7.15 / 10,000 pop. |
| Morris County: | 7.3% |
| New Jersey: | 8.3% |
| Morris County: | 20.4% |
| State: | 23.3% |
| Here: | 20.1% |
| State: | 18.0% |
Agriculture in Morris County:
Average size of farms: 42 acresAverage value of agricultural products sold per farm: $102,897
Average value of crops sold per acre for harvested cropland: $5434.01
The value of nursery, greenhouse, floriculture, and sod as a percentage of the total market value of agricultural products sold: 90.42%
The value of livestock, poultry, and their products as a percentage of the total market value of agricultural products sold: 2.48%
Average total farm production expenses per farm: $84,067
Harvested cropland as a percentage of land in farms: 43.61%
Irrigated harvested cropland as a percentage of land in farms: 12.25%
Average market value of all machinery and equipment per farm: $36,572
The percentage of farms operated by a family or individual: 81.33%
Average age of principal farm operators: 57 years
Average number of cattle and calves per 100 acres of all land in farms: 2.50
Corn for grain: 876 harvested acres
All wheat for grain: 210 harvested acres
Vegetables: 896 harvested acres
Land in orchards: 213 acres
Earthquake activity:
Morris County-area historical earthquake activity is significantly above New Jersey state average. It is 67% smaller than the overall U.S. average.On 8/23/2011 at 17:51:04, a magnitude 5.8 (5.8 MW, Depth: 3.7 mi, Class: Moderate, Intensity: VI - VII) earthquake occurred 274.9 miles away from Morris County center
On 10/7/1983 at 10:18:46, a magnitude 5.3 (5.1 MB, 5.3 LG, 5.1 ML) earthquake occurred 213.6 miles away from the county center
On 1/16/1994 at 01:49:16, a magnitude 4.6 (4.6 MB, 4.6 LG, Depth: 3.1 mi, Class: Light, Intensity: IV - V) earthquake occurred 88.8 miles away from the county center
On 4/20/2002 at 10:50:47, a magnitude 5.3 (5.3 ML, Depth: 3.0 mi) earthquake occurred 255.4 miles away from the county center
On 4/20/2002 at 10:50:47, a magnitude 5.2 (5.2 MB, 4.2 MS, 5.2 MW, 5.0 MW) earthquake occurred 253.5 miles away from Morris County center
On 1/16/1994 at 00:42:43, a magnitude 4.2 (4.2 MB, 4.0 LG, Depth: 3.1 mi) earthquake occurred 87.5 miles away from the county center
Magnitude types: regional Lg-wave magnitude (LG), body-wave magnitude (MB), local magnitude (ML), surface-wave magnitude (MS), moment magnitude (MW)
Most recent natural disasters:
- New Jersey Tropical Storm Isaias, Incident Period: August 4, 2020, Major Disaster (Presidential) Declared DR-4574-NJ: December 11, 2020, FEMA Id: 4574, Natural disaster type: Tropical Storm
- New Jersey Covid-19 Pandemic, Incident Period: January 20, 2020, Major Disaster (Presidential) Declared DR-4488-NJ: March 25, 2020, FEMA Id: 4488, Natural disaster type: Other
- New Jersey Severe Winter Storm And Snowstorm, Incident Period: March 6, 2018 - March 7, 2018, FEMA Id: 4368, Natural disaster type: Snowstorm, Winter Storm
- New Jersey Severe Winter Storm and Snowstorm, Incident Period: January 22, 2016 to January 24, 2016, Major Disaster (Presidential) Declared DR-4264: March 14, 2016, FEMA Id: 4264, Natural disaster type: Snowstorm, Winter Storm
- New Jersey Hurricane Sandy, Incident Period: October 26, 2012 to November 08, 2012, Emergency Declared EM-3354: October 28, 2012, FEMA Id: 3354, Natural disaster type: Hurricane
- New Jersey Hurricane Sandy, Incident Period: October 26, 2012 to November 08, 2012, Major Disaster (Presidential) Declared DR-4086: October 30, 2012, FEMA Id: 4086, Natural disaster type: Hurricane
- New Jersey Severe Storm, Incident Period: October 29, 2011, Major Disaster (Presidential) Declared DR-4048: November 30, 2011, FEMA Id: 4048, Natural disaster type: Storm
- New Jersey Hurricane Irene, Incident Period: August 27, 2011 to September 05, 2011, Major Disaster (Presidential) Declared DR-4021: August 31, 2011, FEMA Id: 4021, Natural disaster type: Hurricane
- New Jersey Hurricane Irene, Incident Period: August 26, 2011 to September 05, 2011, Emergency Declared EM-3332: August 27, 2011, FEMA Id: 3332, Natural disaster type: Hurricane
- New Jersey Severe Winter Storm and Snowstorm, Incident Period: December 26, 2010 to December 27, 2010, Major Disaster (Presidential) Declared DR-1954: February 04, 2011, FEMA Id: 1954, Natural disaster type: Snowstorm, Winter Storm
- 19 other natural disasters have been reported since 1953.
The number of natural disasters in Morris County (29) is a lot greater than the US average (15).
Major Disasters (Presidential) Declared: 19
Emergencies Declared: 9
Causes of natural disasters: Floods: 8, Hurricanes: 7, Storms: 7, Snowstorms: 4, Heavy Rains: 3, Winter Storms: 3, Blizzards: 2, Water Shortages: 2, Mudslide: 1, Tornado: 1, Tropical Storm: 1, Wind: 1, Other: 3 (Note: some incidents may be assigned to more than one category).
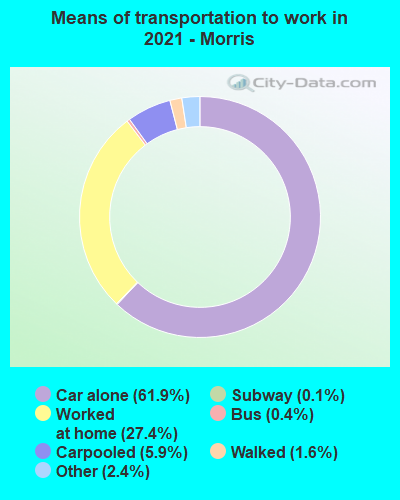
Means of transportation to work:
- Drove a car alone: 214,633 (68.5%)
- Carpooled: 19,473 (6.2%)
- Bus: 1,550 (0.5%)
- Subway or elevated rail: 452 (0.1%)
- Long-distance train or commuter rail: 1,166 (0.4%)
- Taxicab, motorcycle, or other means: 5,479 (1.7%)
- Bicycle: 248 (0.1%)
- Walked: 6,158 (2.0%)
- Worked at home: 64,125 (20.5%)
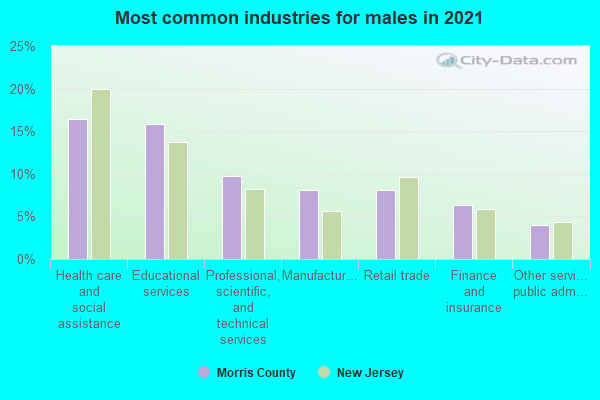
- Educational services (16%)
- Health care and social assistance (15%)
- Manufacturing (10%)
- Professional, scientific, and technical services (10%)
- Retail trade (9%)
- Finance and insurance (5%)
- Other services, except public administration (5%)

- Educational services (18%)
- Health care and social assistance (17%)
- Manufacturing (11%)
- Professional, scientific, and technical services (11%)
- Retail trade (10%)
- Finance and insurance (6%)
- Other services, except public administration (5%)
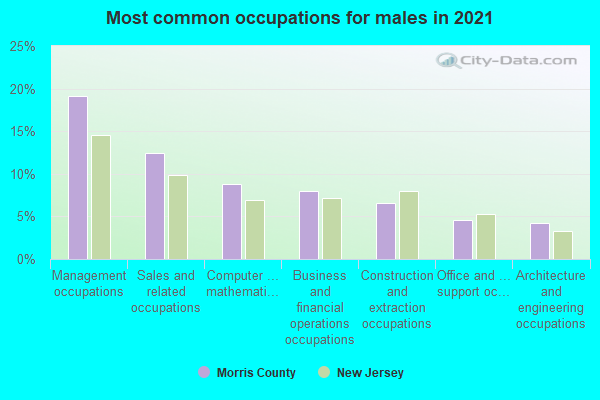
- Management occupations (19%)
- Business and financial operations occupations (10%)
- Sales and related occupations (9%)
- Computer and mathematical occupations (8%)
- Construction and extraction occupations (5%)
- Office and administrative support occupations (5%)
- Architecture and engineering occupations (4%)
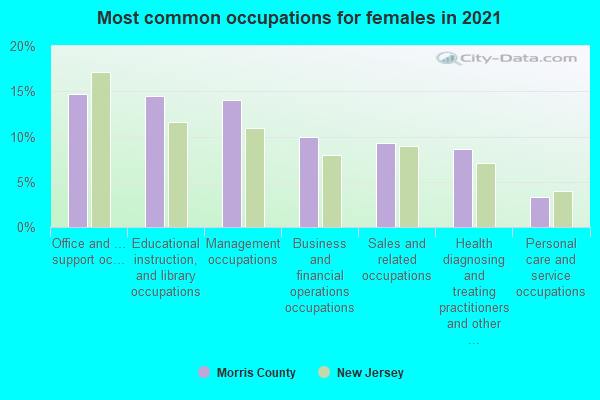
- Office and administrative support occupations (15%)
- Educational instruction, and library occupations (13%)
- Management occupations (13%)
- Business and financial operations occupations (10%)
- Sales and related occupations (9%)
- Health diagnosing and treating practitioners and other technical occupations (7%)
- Personal care and service occupations (4%)
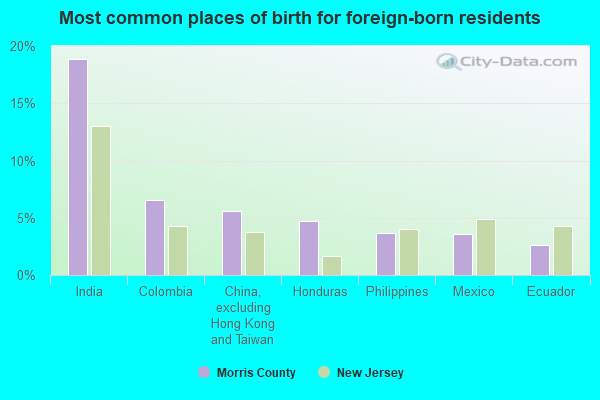
- India (19%)
- Colombia (8%)
- China, excluding Hong Kong and Taiwan (5%)
- Honduras (4%)
- Mexico (4%)
- Philippines (3%)
- Dominican Republic (3%)
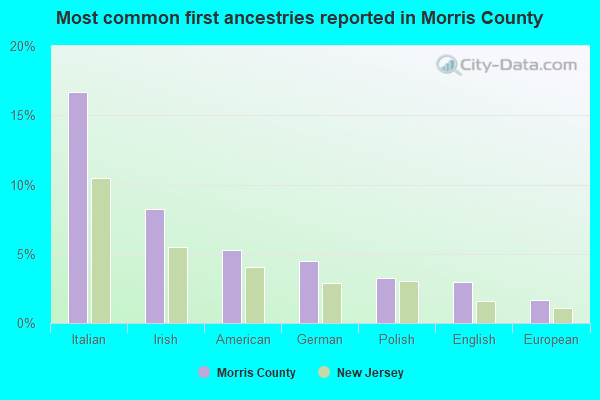
- Italian (16%)
- Irish (8%)
- American (5%)
- German (4%)
- Polish (4%)
- English (3%)
- European (1%)
People in group quarters in Morris County, New Jersey in 2010:
- 3,529 people in college/university student housing
- 2,628 people in nursing facilities/skilled-nursing facilities
- 804 people in other noninstitutional facilities
- 483 people in mental (psychiatric) hospitals and psychiatric units in other hospitals
- 411 people in local jails and other municipal confinement facilities
- 372 people in group homes intended for adults
- 161 people in workers' group living quarters and job corps centers
- 158 people in emergency and transitional shelters (with sleeping facilities) for people experiencing homelessness
- 99 people in residential treatment centers for adults
- 84 people in residential treatment centers for juveniles (non-correctional)
- 58 people in residential schools for people with disabilities
- 27 people in group homes for juveniles (non-correctional)
- 27 people in correctional facilities intended for juveniles
- 25 people in hospitals with patients who have no usual home elsewhere
People in group quarters in Morris County, New Jersey in 2000:
- 3,220 people in nursing homes
- 2,840 people in college dormitories (includes college quarters off campus)
- 683 people in religious group quarters
- 619 people in mental (psychiatric) hospitals or wards
- 580 people in other noninstitutional group quarters
- 284 people in local jails and other confinement facilities (including police lockups)
- 248 people in homes for the mentally retarded
- 176 people in homes for the mentally ill
- 126 people in other nonhousehold living situations
- 123 people in hospitals or wards for drug/alcohol abuse
- 75 people in unknown juvenile institutions
- 67 people in residential treatment centers for emotionally disturbed children
- 59 people in orthopedic wards and institutions for the physically handicapped
- 27 people in agriculture workers' dormitories on farms
- 23 people in homes or halfway houses for drug/alcohol abuse
- 15 people in short-term care, detention or diagnostic centers for delinquent children
- 10 people in military barracks, etc.
- 10 people in homes for the physically handicapped
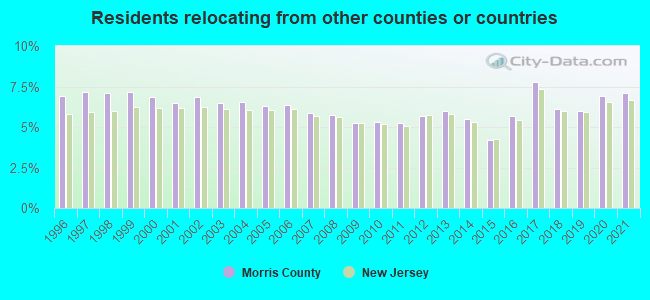
7.08% of this county's 2021 resident taxpayers lived in other counties in 2020 ($125,306 average adjusted gross income)
| Here: | 7.08% |
| New Jersey average: | 6.70% |
10 or fewer of this county's residents moved from foreign countries.
4.66% relocated from other counties in New Jersey ($76,674 average AGI)
2.42% relocated from other states ($48,632 average AGI)
Morris County: 2.42% New Jersey average: 2.98%
Top counties from which taxpayers relocated into this county between 2020 and 2021:
| from Essex County, NJ | |
| from Passaic County, NJ | |
| from Bergen County, NJ | |
| from Hudson County, NJ | |
| from Sussex County, NJ | |
| from Union County, NJ | |
| from New York County, NY |
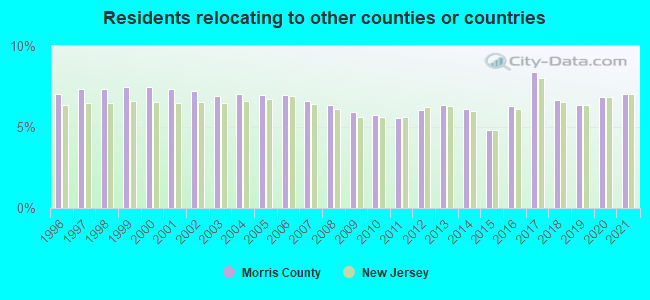
7.05% of this county's 2020 resident taxpayers moved to other counties in 2021 ($142,356 average adjusted gross income)
| Here: | 7.05% |
| New Jersey average: | 7.02% |
0.01% of residents moved to foreign countries ($178 average AGI)
Morris County: 0.01% New Jersey average: 0.02%
3.59% relocated to other counties in New Jersey ($58,182 average AGI)
3.45% relocated to other states ($83,996 average AGI)
Morris County: 3.45% New Jersey average: 3.32%
Top counties to which taxpayers relocated from this county between 2020 and 2021:
| to Sussex County, NJ | |
| to Essex County, NJ | |
| to Somerset County, NJ | |
| to Passaic County, NJ | |
| to Hudson County, NJ | |
| to Warren County, NJ | |
| to Bergen County, NJ |
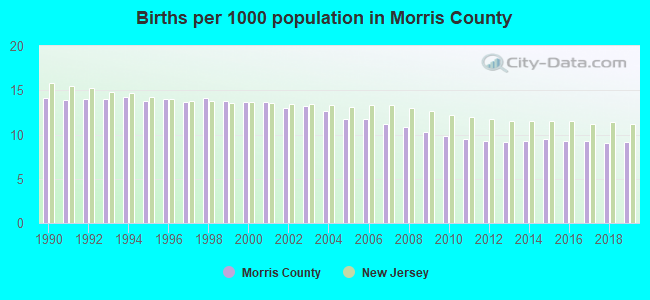
Births per 1000 population from 1990 to 1999: 14.0
Births per 1000 population from 2000 to 2009: 12.2
Births per 1000 population from 2010 to 2022: 7.9
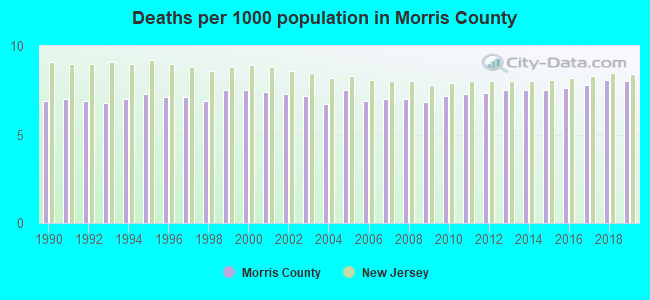
Deaths per 1000 population from 1990 to 1999: 7.0
Deaths per 1000 population from 2000 to 2009: 7.1
Deaths per 1000 population from 2010 to 2020: 7.8
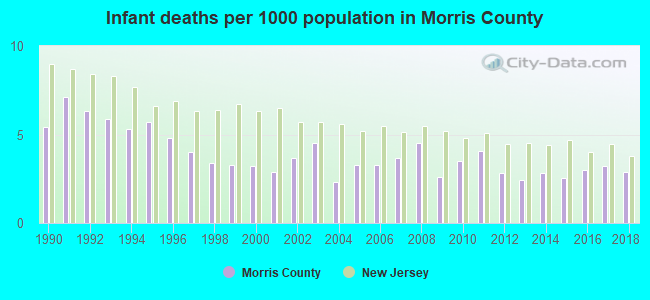
Infant deaths per 1000 live births from 1990 to 1999: 5.1
Infant deaths per 1000 live births from 2000 to 2009: 3.4
Infant deaths per 1000 live births from 2010 to 2021: 2.8
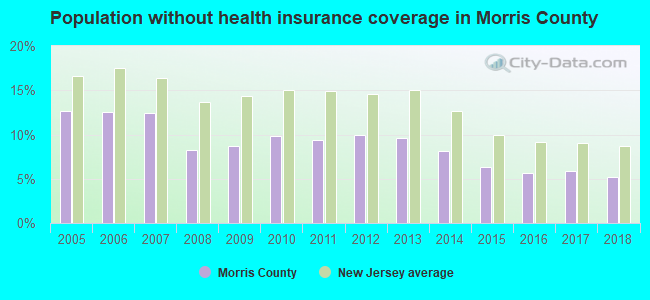
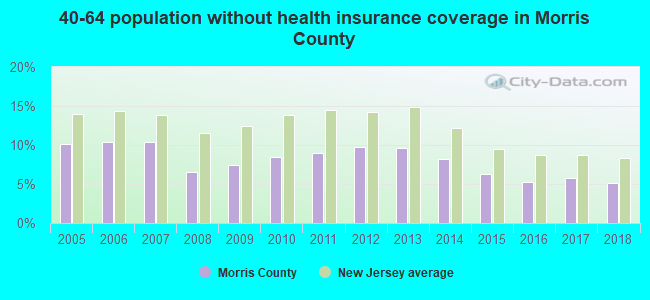
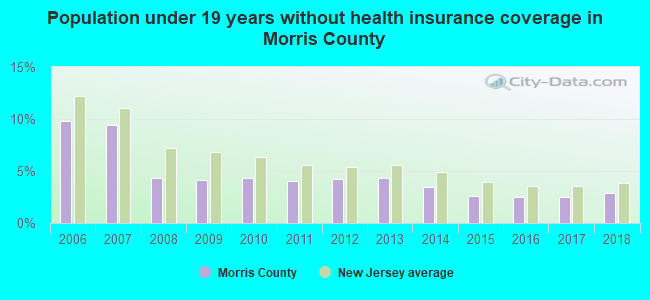
Persons under 19 years old without health insurance coverage in 2018: 2.9%
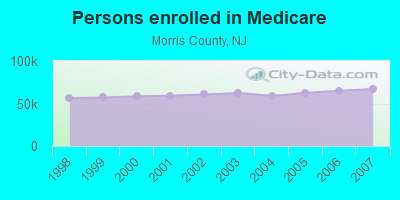
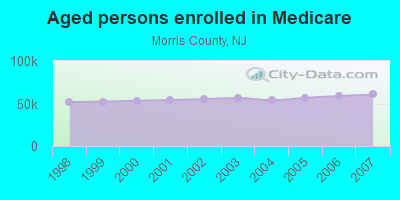
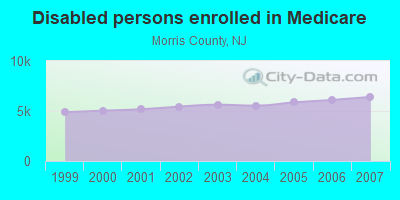
Persons enrolled in hospital insurance and/or supplemental medical insurance (Medicare) in July 1, 2007: 66,998 (60,590 aged, 6,408 disabled)
Children under 18 without health insurance coverage in 2007: 8,836 (7%)
Most common underlying causes of death in Morris County, New Jersey in 1999 - 2019:
- Atherosclerotic heart disease (6,657)
- Bronchus or lung, unspecified - Malignant neoplasms (4,330)
- Acute myocardial infarction, unspecified (4,056)
- Unspecified dementia (2,991)
- Chronic obstructive pulmonary disease, unspecified (2,253)
- Congestive heart failure (2,134)
- Stroke, not specified as haemorrhage or infarction (2,115)
- Alzheimer disease, unspecified (2,043)
- Atherosclerotic cardiovascular disease, so described (1,982)
- Septicaemia, unspecified (1,645)
Population without health insurance coverage in 2000: 9%
Children under 18 without health insurance coverage in 2000: 7%
Short term general hospital admissions per 100,000 population in 2004: 13,424
Short term general hospital beds per 100,000 population in 2004: 310
Emergency room visits per 100,000 population in 2004: 36,793
General practice office based MDs per 100,000 population in 2005: 1,191
Medical specialist MDs per 100,000 population in 2005: 669
Dentists per 100,000 population in 1998: 18
Total births per 100,000 population, July 2005 - July 2006 : 87
Total deaths per 100,000 population, July 2005 - July 2006: 111
Limited-service eating places per 100,000 population in 2005 : 22
Beer, wine & liquor stores per 100,000 population in 2005: 1
Suicides per 1,000,000 population from 2000 to 2006: 56.4. This is less than state average.
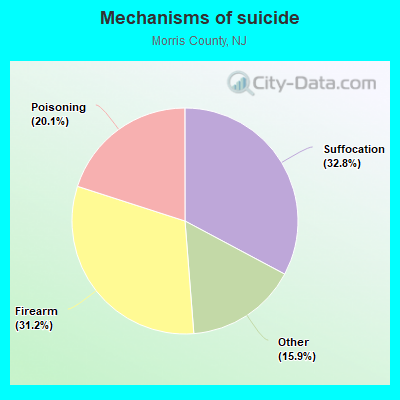
- Suffocation - 18.5
- Firearm - 17.6
- Poisoning - 11.3
- Other - 9.0
Household type by relationship:
Households: 511,151- Male householders: 102,075 (18,020 living alone), Female householders: 92,066 (27,700 living alone)
116,125 spouses (115,259 opposite-sex spouses), 10,406 unmarried partners, (10,138 opposite-sex unmarried partners), 152,451 children (147,849 natural, 1,533 adopted, 3,069 stepchildren), 5,228 grandchildren, 4,731 brothers or sisters, 6,289 parents, 152 foster children, 6,074 other relatives, 6,959 non-relatives
- In group quarters: 8,595
Size of family households: 54,812 2-persons, 32,207 3-persons, 33,356 4-persons, 10,903 5-persons, 3,637 6-persons, 2,314 7-or-more-persons.
Size of nonfamily households: 45,720 1-person, 10,916 2-persons, 187 3-persons, 89 4-persons.
86,153 married couples with children.
11,017 single-parent households (2,460 men, 8,557 women).
74.6% of residents of Morris speak English at home.
10.4% of residents speak Spanish at home (57% speak English very well, 19% speak English well, 17% speak English not well, 6% don't speak English at all).
8.5% of residents speak other Indo-European language at home (74% speak English very well, 16% speak English well, 9% speak English not well, 1% don't speak English at all).
5.5% of residents speak Asian or Pacific Island language at home (75% speak English very well, 15% speak English well, 8% speak English not well, 1% don't speak English at all).
1.0% of residents speak other language at home (76% speak English very well, 24% speak English well).
In fiscal year 2004:
Federal Government expenditure: $2,112,289,000 ($4,327 per capita)
Department of Defense expenditure: $364,578,000
Federal direct payments to individuals for retirement and disability: $978,594,000
Federal other direct payments to individuals: $433,294,000
Federal direct payments not to individuals: $3,097,000
Federal grants: $210,748,000
Federal procurement contracts: $229,689,000 ($171,691,000 Department of Defense)
Federal salaries and wages: $256,867,000 ($165,701,000 Department of Defense)
Federal Government direct loans: $19,337,000
Federal guaranteed/insured loans: $159,368,000
Federal Government insurance: $707,010,000
Population change from April 1, 2000 to July 1, 2005:
Births: 32,631| Here: | 67 per 1000 residents |
| State: | 69 per 1000 residents |
Deaths: 17,882
| Here: | 36 per 1000 residents |
| State: | 44 per 1000 residents |
Net international migration: +14,947
| Here: | +30 per 1000 residents |
| State: | +33 per 1000 residents |
Net internal migration: -8,825
| Here: | |
| State: |
Total withdrawal of fresh water for public supply: 102.95 millions of gallons per day (47% from ground, 53% from surface)
| Here: | 7.4 |
| State: | 6.8 |
| Here: | 3.7 |
| State: | 3.9 |
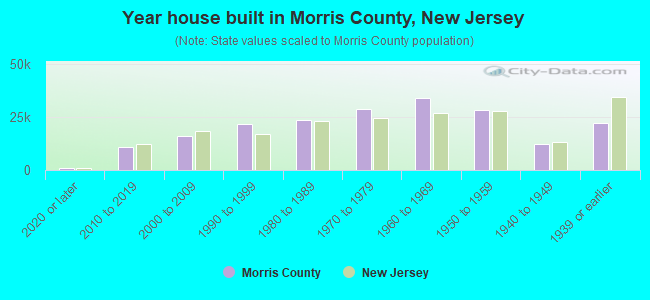
- Year house built in Morris County, New Jersey
- 1,3512020 or later
- 8,5012010 to 2019
- 18,1892000 to 2009
- 21,4391990 to 1999
- 26,3001980 to 1989
- 25,8731970 to 1979
- 30,9271960 to 1969
- 27,9381950 to 1959
- 12,5361940 to 1949
- 25,9161939 or earlier
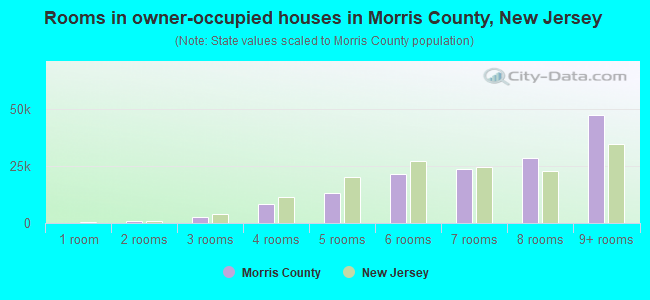
- Rooms in owner-occupied houses in Morris County, New Jersey
- 1081 room
- 7002 rooms
- 3,4663 rooms
- 8,4664 rooms
- 14,4425 rooms
- 23,2656 rooms
- 23,6537 rooms
- 23,3188 rooms
- 48,0799+ rooms
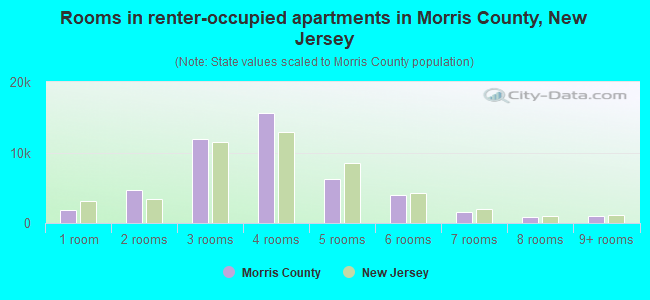
- Rooms in renter-occupied apartments in Morris County, New Jersey
- 3,9461 room
- 5,0942 rooms
- 12,7943 rooms
- 13,2454 rooms
- 6,1975 rooms
- 2,5516 rooms
- 1,9797 rooms
- 1,0098 rooms
- 1,8299+ rooms
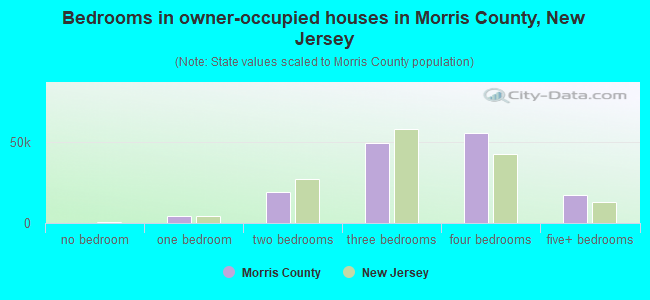
- Bedrooms in owner-occupied houses in Morris County, New Jersey
- 249no bedroom
- 4,7641 bedroom
- 20,5042 bedrooms
- 49,3143 bedrooms
- 53,1194 bedrooms
- 17,5475+ bedrooms
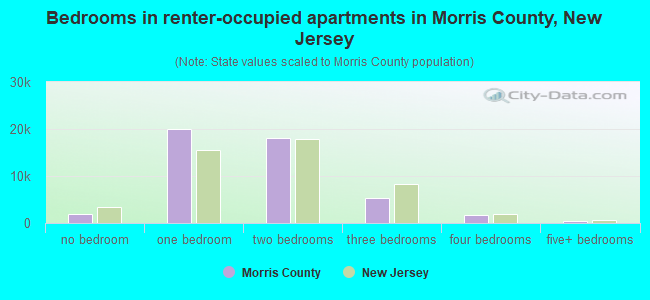
- Bedrooms in renter-occupied apartments in Morris County, New Jersey
- 4,135no bedroom
- 21,3981 bedroom
- 16,4152 bedrooms
- 4,2943 bedrooms
- 1,8454 bedrooms
- 5575+ bedrooms
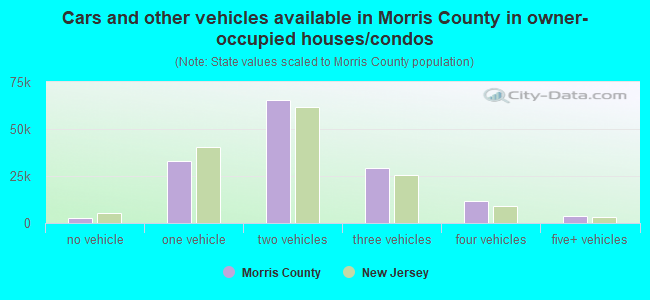
- Cars and other vehicles available in Morris County in owner-occupied houses/condos
- 2,655no vehicle
- 32,1881 vehicle
- 69,0452 vehicles
- 27,2013 vehicles
- 10,6274 vehicles
- 3,7815+ vehicles
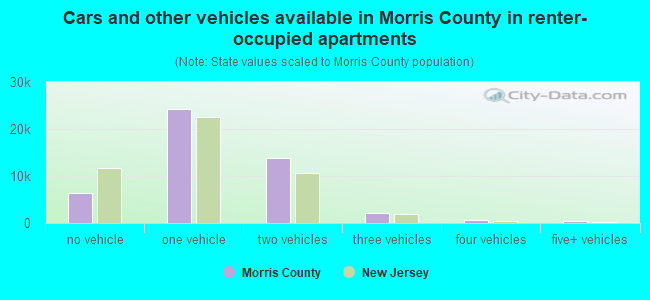
- Cars and other vehicles available in Morris County in renter-occupied apartments
- 7,606no vehicle
- 22,1191 vehicle
- 15,6572 vehicles
- 2,0593 vehicles
- 8684 vehicles
- 3355+ vehicles
90.3% of Morris County residents lived in the same house 1 years ago.
Out of people who lived in different houses, 30% lived in this county.
Out of people who lived in different counties, 69% lived in New Jersey.
| Morris County: | 90.3% |
| State average: | 90.4% |
Place of birth for U.S.-born residents:
- This state: 291,499
- Other state: 115,592
- Northeast: 79,956
- Midwest: 12,637
- South: 14,750
- West: 8,249
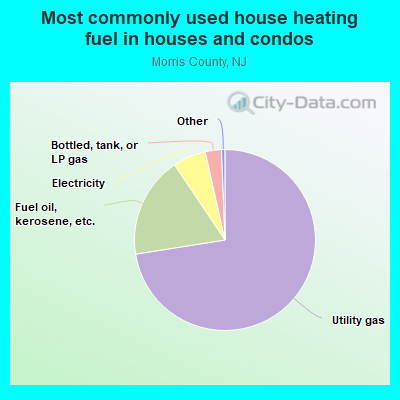
- 74.3%Utility gas
- 15.4%Fuel oil, kerosene, etc.
- 6.5%Electricity
- 2.9%Bottled, tank, or LP gas
- 0.4%Wood
- 0.3%Solar energy
- 0.1%No fuel used
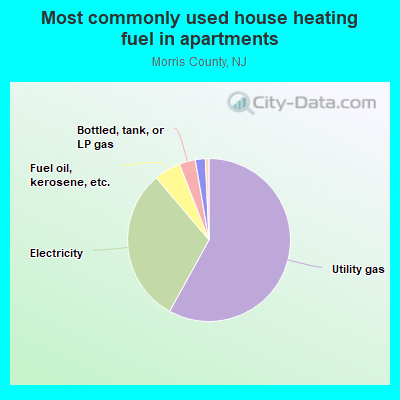
- 61.3%Utility gas
- 26.0%Electricity
- 6.6%Fuel oil, kerosene, etc.
- 2.4%Bottled, tank, or LP gas
- 2.0%No fuel used
- 1.5%Other fuel
- 0.2%Solar energy
- 0.1%Wood
Private vs. public school enrollment:
| Here: | 9.9% |
| New Jersey: | 12.3% |
| Here: | 15.1% |
| New Jersey: | 13.1% |
| Here: | 41.0% |
| New Jersey: | 33.2% |
Morris County government finances - Expenditure in 2020:
- Assistance and Subsidies - Public Welfare, Federal Categorical Assistance Programs: $6,485,000
Public Welfare, Federal Categorical Assistance Programs: $5,220,000
Public Welfare, Cash Assistance Programs - Other: $3,772,000
Public Welfare, Cash Assistance Programs - Other: $3,040,000
- Bond Funds - Cash and Securities: $2,246,000
Cash and Securities: $2,122,000
- Charges - Solid Waste Management: $49,825,000
Solid Waste Management: $37,807,000
Higher Education - Other: $34,069,000
Higher Education - Other: $30,949,000
Parks and Recreation: $13,954,000
Parks and Recreation: $13,675,000
Higher Education Auxiliary Enterprises: $3,129,000
Higher Education Auxiliary Enterprises: $2,459,000
Elementary and Secondary Education - Other: $588,000
Elementary and Secondary Education - Other: $553,000
Elementary and Secondary Education School Tuition and Transportation: $449,000
Elementary and Secondary Education School Tuition and Transportation: $340,000
Other: $176,000
Elementary and Secondary Education School Lunch: $164,000
Elementary and Secondary Education School Lunch: $120,000
- Construction - Regular Highways: $11,528,000
Other Higher Education: $9,353,000
Regular Highways: $9,180,000
General Public Buildings: $7,493,000
General Public Buildings: $6,502,000
Elementary and Secondary Education: $2,265,000
Other Higher Education: $1,428,000
Solid Waste Management: $1,422,000
Parks and Recreation: $831,000
Correctional Institutions: $734,000
Elementary and Secondary Education: $728,000
Natural Resources - Other: $696,000
Judicial and Legal Services: $631,000
Public Welfare Institutions: $616,000
Parks and Recreation: $542,000
Public Welfare - Other: $487,000
Central Staff Services: $417,000
Police Protection: $296,000
Local Fire Protection: $170,000
Central Staff Services: $123,000
Natural Resources - Other: $54,000
Public Welfare Institutions: $52,000
Public Welfare - Other: $31,000
Judicial and Legal Services: $21,000
- Current Operations - General - Other: $86,935,000
General - Other: $78,953,000
Other Higher Education: $59,893,000
Other Higher Education: $58,617,000
Parks and Recreation: $43,872,000
Solid Waste Management: $37,338,000
Solid Waste Management: $36,195,000
Regular Highways: $29,861,000
Public Welfare Institutions: $23,495,000
Correctional Institutions: $22,634,000
Elementary and Secondary Education: $22,483,000
Regular Highways: $21,941,000
Elementary and Secondary Education: $21,218,000
Correctional Institutions: $21,180,000
Police Protection: $21,179,000
Central Staff Services: $20,023,000
Central Staff Services: $19,736,000
Police Protection: $19,252,000
Public Welfare Institutions: $19,019,000
Judicial and Legal Services: $17,770,000
Judicial and Legal Services: $17,237,000
Health - Other: $15,532,000
Housing and Community Development: $14,097,000
Parks and Recreation: $13,975,000
Health - Other: $13,447,000
Public Welfare - Other: $8,751,000
Public Welfare - Other: $8,224,000
General Public Buildings: $6,667,000
Financial Administration: $6,552,000
General Public Buildings: $6,268,000
Financial Administration: $6,249,000
Libraries: $3,835,000
Libraries: $3,606,000
Higher Education Auxiliary Enterprises: $2,779,000
Public Welfare, Vendor Payments for Other Purposes: $2,746,000
Protective Inspection and Regulation - Other: $2,443,000
Protective Inspection and Regulation - Other: $2,392,000
Public Welfare, Vendor Payments for Other Purposes: $2,358,000
Higher Education Auxiliary Enterprises: $2,210,000
Housing and Community Development: $1,783,000
Natural Resources - Other: $1,149,000
Public Welfare, Vendor Payments for Medical Care: $1,000,000
Public Welfare, Vendor Payments for Medical Care: $1,000,000
Natural Resources - Other: $791,000
Hospitals: $789,000
Hospitals: $789,000
- Federal Intergovernmental - Education: $3,094,000
Housing and Community Development: $2,835,000
Housing and Community Development: $2,152,000
Education: $698,000
- General - Interest on Debt: $17,339,000
Interest on Debt: $13,133,000
- Intergovernmental to Local - Other - Housing and Community Development: $1,070,000
Other - General - Other: $987,000
Other - General - Other: $893,000
Other - Housing and Community Development: $492,000
Other - Health - Other: $390,000
Other - Health - Other: $325,000
Other - Elementary and Secondary Education: $114,000
Other - Elementary and Secondary Education: $73,000
- Intergovernmental to State - Hospitals: $3,927,000
Hospitals: $3,869,000
General - Other: $388,000
General - Other: $106,000
Elementary and Secondary Education: $58,000
- Local Intergovernmental - Other: $47,252,000
Other: $30,280,000
Education: $24,072,000
Education: $12,553,000
Transit Utilities: $675,000
Transit Utilities: $675,000
Health and Hospitals: $603,000
Health and Hospitals: $470,000
Highways: $97,000
Public Welfare: $27,000
- Long Term Debt - Outstanding Unspecified Public Purpose: $446,821,000
Beginning Outstanding - Unspecified Public Purpose: $417,320,000
Beginning Outstanding - Unspecified Public Purpose: $361,525,000
Outstanding Unspecified Public Purpose: $351,818,000
Issue, Unspecified Public Purpose: $95,147,000
Retired Unspecified Public Purpose: $65,646,000
Retired Unspecified Public Purpose: $44,648,000
Issue, Unspecified Public Purpose: $34,943,000
- Miscellaneous - General Revenue - Other: $79,892,000
General Revenue - Other: $71,024,000
Sale of Property: $34,943,000
Sale of Property: $32,522,000
Interest Earnings: $5,903,000
Fines and Forfeits: $4,083,000
Fines and Forfeits: $3,896,000
Rents: $2,100,000
Interest Earnings: $2,070,000
Donations From Private Sources: $687,000
Rents: $666,000
Donations From Private Sources: $303,000
- Other Capital Outlay - Central Staff Services: $3,808,000
Police Protection: $2,355,000
Central Staff Services: $2,320,000
Police Protection: $1,806,000
Parks and Recreation: $1,241,000
Parks and Recreation: $1,050,000
Other Higher Education: $924,000
Public Welfare Institutions: $750,000
Other Higher Education: $734,000
Regular Highways: $666,000
Financial Administration: $623,000
Judicial and Legal Services: $282,000
Elementary and Secondary Education: $228,000
Transit Utilities: $201,000
Public Welfare - Other: $172,000
Transit Utilities: $135,000
Elementary and Secondary Education: $133,000
Health - Other: $103,000
Regular Highways: $74,000
Local Fire Protection: $67,000
Libraries: $66,000
General Public Building: $57,000
Correctional Institutions: $45,000
Correctional Institutions: $43,000
Judicial and Legal Services: $24,000
Health - Other: $23,000
Financial Administration: $7,000
General Public Building: $5,000
Libraries: $4,000
- Other Funds - Cash and Securities: $311,258,000
Cash and Securities: $298,698,000
- Short Term Debt Outstanding - End of Fiscal Year: $34,000
Beginning: $33,000
End of Fiscal Year: $31,000
Beginning: $30,000
- State Intergovernmental - Health and Hospitals: $21,469,000
Other: $17,582,000
Education: $17,421,000
Education: $16,971,000
Other: $14,690,000
Highways: $12,519,000
Public Welfare: $12,026,000
Public Welfare: $10,599,000
Highways: $10,110,000
Transit Utilities: $2,319,000
Transit Utilities: $1,641,000
Health and Hospitals: $451,000
General Local Government Support: $423,000
General Local Government Support: $229,000
- Tax - Property: $251,575,000
Property: $242,222,000
- Total Salaries and Wages: $105,944,000
: $98,969,000
Morris County government finances - Revenue in 2020:
- Assistance and Subsidies - Public Welfare, Federal Categorical Assistance Programs: $6,485,000
Public Welfare, Federal Categorical Assistance Programs: $5,220,000
Public Welfare, Cash Assistance Programs - Other: $3,772,000
Public Welfare, Cash Assistance Programs - Other: $3,040,000
- Bond Funds - Cash and Securities: $2,246,000
Cash and Securities: $2,122,000
- Charges - Solid Waste Management: $49,825,000
Solid Waste Management: $37,807,000
Higher Education - Other: $34,069,000
Higher Education - Other: $30,949,000
Parks and Recreation: $13,954,000
Parks and Recreation: $13,675,000
Higher Education Auxiliary Enterprises: $3,129,000
Higher Education Auxiliary Enterprises: $2,459,000
Elementary and Secondary Education - Other: $588,000
Elementary and Secondary Education - Other: $553,000
Elementary and Secondary Education School Tuition and Transportation: $449,000
Elementary and Secondary Education School Tuition and Transportation: $340,000
Other: $176,000
Elementary and Secondary Education School Lunch: $164,000
Elementary and Secondary Education School Lunch: $120,000
- Construction - Regular Highways: $11,528,000
Other Higher Education: $9,353,000
Regular Highways: $9,180,000
General Public Buildings: $7,493,000
General Public Buildings: $6,502,000
Elementary and Secondary Education: $2,265,000
Other Higher Education: $1,428,000
Solid Waste Management: $1,422,000
Parks and Recreation: $831,000
Correctional Institutions: $734,000
Elementary and Secondary Education: $728,000
Natural Resources - Other: $696,000
Judicial and Legal Services: $631,000
Public Welfare Institutions: $616,000
Parks and Recreation: $542,000
Public Welfare - Other: $487,000
Central Staff Services: $417,000
Police Protection: $296,000
Local Fire Protection: $170,000
Central Staff Services: $123,000
Natural Resources - Other: $54,000
Public Welfare Institutions: $52,000
Public Welfare - Other: $31,000
Judicial and Legal Services: $21,000
- Current Operations - General - Other: $86,935,000
General - Other: $78,953,000
Other Higher Education: $59,893,000
Other Higher Education: $58,617,000
Parks and Recreation: $43,872,000
Solid Waste Management: $37,338,000
Solid Waste Management: $36,195,000
Regular Highways: $29,861,000
Public Welfare Institutions: $23,495,000
Correctional Institutions: $22,634,000
Elementary and Secondary Education: $22,483,000
Regular Highways: $21,941,000
Elementary and Secondary Education: $21,218,000
Correctional Institutions: $21,180,000
Police Protection: $21,179,000
Central Staff Services: $20,023,000
Central Staff Services: $19,736,000
Police Protection: $19,252,000
Public Welfare Institutions: $19,019,000
Judicial and Legal Services: $17,770,000
Judicial and Legal Services: $17,237,000
Health - Other: $15,532,000
Housing and Community Development: $14,097,000
Parks and Recreation: $13,975,000
Health - Other: $13,447,000
Public Welfare - Other: $8,751,000
Public Welfare - Other: $8,224,000
General Public Buildings: $6,667,000
Financial Administration: $6,552,000
General Public Buildings: $6,268,000
Financial Administration: $6,249,000
Libraries: $3,835,000
Libraries: $3,606,000
Higher Education Auxiliary Enterprises: $2,779,000
Public Welfare, Vendor Payments for Other Purposes: $2,746,000
Protective Inspection and Regulation - Other: $2,443,000
Protective Inspection and Regulation - Other: $2,392,000
Public Welfare, Vendor Payments for Other Purposes: $2,358,000
Higher Education Auxiliary Enterprises: $2,210,000
Housing and Community Development: $1,783,000
Natural Resources - Other: $1,149,000
Public Welfare, Vendor Payments for Medical Care: $1,000,000
Public Welfare, Vendor Payments for Medical Care: $1,000,000
Natural Resources - Other: $791,000
Hospitals: $789,000
Hospitals: $789,000
- Federal Intergovernmental - Education: $3,094,000
Housing and Community Development: $2,835,000
Housing and Community Development: $2,152,000
Education: $698,000
- General - Interest on Debt: $17,339,000
Interest on Debt: $13,133,000
- Intergovernmental to Local - Other - Housing and Community Development: $1,070,000
Other - General - Other: $987,000
Other - General - Other: $893,000
Other - Housing and Community Development: $492,000
Other - Health - Other: $390,000
Other - Health - Other: $325,000
Other - Elementary and Secondary Education: $114,000
Other - Elementary and Secondary Education: $73,000
- Intergovernmental to State - Hospitals: $3,927,000
Hospitals: $3,869,000
General - Other: $388,000
General - Other: $106,000
Elementary and Secondary Education: $58,000
- Local Intergovernmental - Other: $47,252,000
Other: $30,280,000
Education: $24,072,000
Education: $12,553,000
Transit Utilities: $675,000
Transit Utilities: $675,000
Health and Hospitals: $603,000
Health and Hospitals: $470,000
Highways: $97,000
Public Welfare: $27,000
- Long Term Debt - Outstanding Unspecified Public Purpose: $446,821,000
Beginning Outstanding - Unspecified Public Purpose: $417,320,000
Beginning Outstanding - Unspecified Public Purpose: $361,525,000
Outstanding Unspecified Public Purpose: $351,818,000
Issue, Unspecified Public Purpose: $95,147,000
Retired Unspecified Public Purpose: $65,646,000
Retired Unspecified Public Purpose: $44,648,000
Issue, Unspecified Public Purpose: $34,943,000
- Miscellaneous - General Revenue - Other: $79,892,000
General Revenue - Other: $71,024,000
Sale of Property: $34,943,000
Sale of Property: $32,522,000
Interest Earnings: $5,903,000
Fines and Forfeits: $4,083,000
Fines and Forfeits: $3,896,000
Rents: $2,100,000
Interest Earnings: $2,070,000
Donations From Private Sources: $687,000
Rents: $666,000
Donations From Private Sources: $303,000
- Other Capital Outlay - Central Staff Services: $3,808,000
Police Protection: $2,355,000
Central Staff Services: $2,320,000
Police Protection: $1,806,000
Parks and Recreation: $1,241,000
Parks and Recreation: $1,050,000
Other Higher Education: $924,000
Public Welfare Institutions: $750,000
Other Higher Education: $734,000
Regular Highways: $666,000
Financial Administration: $623,000
Judicial and Legal Services: $282,000
Elementary and Secondary Education: $228,000
Transit Utilities: $201,000
Public Welfare - Other: $172,000
Transit Utilities: $135,000
Elementary and Secondary Education: $133,000
Health - Other: $103,000
Regular Highways: $74,000
Local Fire Protection: $67,000
Libraries: $66,000
General Public Building: $57,000
Correctional Institutions: $45,000
Correctional Institutions: $43,000
Judicial and Legal Services: $24,000
Health - Other: $23,000
Financial Administration: $7,000
General Public Building: $5,000
Libraries: $4,000
- Other Funds - Cash and Securities: $311,258,000
Cash and Securities: $298,698,000
- Short Term Debt Outstanding - End of Fiscal Year: $34,000
Beginning: $33,000
End of Fiscal Year: $31,000
Beginning: $30,000
- State Intergovernmental - Health and Hospitals: $21,469,000
Other: $17,582,000
Education: $17,421,000
Education: $16,971,000
Other: $14,690,000
Highways: $12,519,000
Public Welfare: $12,026,000
Public Welfare: $10,599,000
Highways: $10,110,000
Transit Utilities: $2,319,000
Transit Utilities: $1,641,000
Health and Hospitals: $451,000
General Local Government Support: $423,000
General Local Government Support: $229,000
- Tax - Property: $251,575,000
Property: $242,222,000
- Total Salaries and Wages: $105,944,000
: $98,969,000
Morris County government finances - Debt in 2020:
- Assistance and Subsidies - Public Welfare, Federal Categorical Assistance Programs: $6,485,000
Public Welfare, Federal Categorical Assistance Programs: $5,220,000
Public Welfare, Cash Assistance Programs - Other: $3,772,000
Public Welfare, Cash Assistance Programs - Other: $3,040,000
- Bond Funds - Cash and Securities: $2,246,000
Cash and Securities: $2,122,000
- Charges - Solid Waste Management: $49,825,000
Solid Waste Management: $37,807,000
Higher Education - Other: $34,069,000
Higher Education - Other: $30,949,000
Parks and Recreation: $13,954,000
Parks and Recreation: $13,675,000
Higher Education Auxiliary Enterprises: $3,129,000
Higher Education Auxiliary Enterprises: $2,459,000
Elementary and Secondary Education - Other: $588,000
Elementary and Secondary Education - Other: $553,000
Elementary and Secondary Education School Tuition and Transportation: $449,000
Elementary and Secondary Education School Tuition and Transportation: $340,000
Other: $176,000
Elementary and Secondary Education School Lunch: $164,000
Elementary and Secondary Education School Lunch: $120,000
- Construction - Regular Highways: $11,528,000
Other Higher Education: $9,353,000
Regular Highways: $9,180,000
General Public Buildings: $7,493,000
General Public Buildings: $6,502,000
Elementary and Secondary Education: $2,265,000
Other Higher Education: $1,428,000
Solid Waste Management: $1,422,000
Parks and Recreation: $831,000
Correctional Institutions: $734,000
Elementary and Secondary Education: $728,000
Natural Resources - Other: $696,000
Judicial and Legal Services: $631,000
Public Welfare Institutions: $616,000
Parks and Recreation: $542,000
Public Welfare - Other: $487,000
Central Staff Services: $417,000
Police Protection: $296,000
Local Fire Protection: $170,000
Central Staff Services: $123,000
Natural Resources - Other: $54,000
Public Welfare Institutions: $52,000
Public Welfare - Other: $31,000
Judicial and Legal Services: $21,000
- Current Operations - General - Other: $86,935,000
General - Other: $78,953,000
Other Higher Education: $59,893,000
Other Higher Education: $58,617,000
Parks and Recreation: $43,872,000
Solid Waste Management: $37,338,000
Solid Waste Management: $36,195,000
Regular Highways: $29,861,000
Public Welfare Institutions: $23,495,000
Correctional Institutions: $22,634,000
Elementary and Secondary Education: $22,483,000
Regular Highways: $21,941,000
Elementary and Secondary Education: $21,218,000
Correctional Institutions: $21,180,000
Police Protection: $21,179,000
Central Staff Services: $20,023,000
Central Staff Services: $19,736,000
Police Protection: $19,252,000
Public Welfare Institutions: $19,019,000
Judicial and Legal Services: $17,770,000
Judicial and Legal Services: $17,237,000
Health - Other: $15,532,000
Housing and Community Development: $14,097,000
Parks and Recreation: $13,975,000
Health - Other: $13,447,000
Public Welfare - Other: $8,751,000
Public Welfare - Other: $8,224,000
General Public Buildings: $6,667,000
Financial Administration: $6,552,000
General Public Buildings: $6,268,000
Financial Administration: $6,249,000
Libraries: $3,835,000
Libraries: $3,606,000
Higher Education Auxiliary Enterprises: $2,779,000
Public Welfare, Vendor Payments for Other Purposes: $2,746,000
Protective Inspection and Regulation - Other: $2,443,000
Protective Inspection and Regulation - Other: $2,392,000
Public Welfare, Vendor Payments for Other Purposes: $2,358,000
Higher Education Auxiliary Enterprises: $2,210,000
Housing and Community Development: $1,783,000
Natural Resources - Other: $1,149,000
Public Welfare, Vendor Payments for Medical Care: $1,000,000
Public Welfare, Vendor Payments for Medical Care: $1,000,000
Natural Resources - Other: $791,000
Hospitals: $789,000
Hospitals: $789,000
- Federal Intergovernmental - Education: $3,094,000
Housing and Community Development: $2,835,000
Housing and Community Development: $2,152,000
Education: $698,000
- General - Interest on Debt: $17,339,000
Interest on Debt: $13,133,000
- Intergovernmental to Local - Other - Housing and Community Development: $1,070,000
Other - General - Other: $987,000
Other - General - Other: $893,000
Other - Housing and Community Development: $492,000
Other - Health - Other: $390,000
Other - Health - Other: $325,000
Other - Elementary and Secondary Education: $114,000
Other - Elementary and Secondary Education: $73,000
- Intergovernmental to State - Hospitals: $3,927,000
Hospitals: $3,869,000
General - Other: $388,000
General - Other: $106,000
Elementary and Secondary Education: $58,000
- Local Intergovernmental - Other: $47,252,000
Other: $30,280,000
Education: $24,072,000
Education: $12,553,000
Transit Utilities: $675,000
Transit Utilities: $675,000
Health and Hospitals: $603,000
Health and Hospitals: $470,000
Highways: $97,000
Public Welfare: $27,000
- Long Term Debt - Outstanding Unspecified Public Purpose: $446,821,000
Beginning Outstanding - Unspecified Public Purpose: $417,320,000
Beginning Outstanding - Unspecified Public Purpose: $361,525,000
Outstanding Unspecified Public Purpose: $351,818,000
Issue, Unspecified Public Purpose: $95,147,000
Retired Unspecified Public Purpose: $65,646,000
Retired Unspecified Public Purpose: $44,648,000
Issue, Unspecified Public Purpose: $34,943,000
- Miscellaneous - General Revenue - Other: $79,892,000
General Revenue - Other: $71,024,000
Sale of Property: $34,943,000
Sale of Property: $32,522,000
Interest Earnings: $5,903,000
Fines and Forfeits: $4,083,000
Fines and Forfeits: $3,896,000
Rents: $2,100,000
Interest Earnings: $2,070,000
Donations From Private Sources: $687,000
Rents: $666,000
Donations From Private Sources: $303,000
- Other Capital Outlay - Central Staff Services: $3,808,000
Police Protection: $2,355,000
Central Staff Services: $2,320,000
Police Protection: $1,806,000
Parks and Recreation: $1,241,000
Parks and Recreation: $1,050,000
Other Higher Education: $924,000
Public Welfare Institutions: $750,000
Other Higher Education: $734,000
Regular Highways: $666,000
Financial Administration: $623,000
Judicial and Legal Services: $282,000
Elementary and Secondary Education: $228,000
Transit Utilities: $201,000
Public Welfare - Other: $172,000
Transit Utilities: $135,000
Elementary and Secondary Education: $133,000
Health - Other: $103,000
Regular Highways: $74,000
Local Fire Protection: $67,000
Libraries: $66,000
General Public Building: $57,000
Correctional Institutions: $45,000
Correctional Institutions: $43,000
Judicial and Legal Services: $24,000
Health - Other: $23,000
Financial Administration: $7,000
General Public Building: $5,000
Libraries: $4,000
- Other Funds - Cash and Securities: $311,258,000
Cash and Securities: $298,698,000
- Short Term Debt Outstanding - End of Fiscal Year: $34,000
Beginning: $33,000
End of Fiscal Year: $31,000
Beginning: $30,000
- State Intergovernmental - Health and Hospitals: $21,469,000
Other: $17,582,000
Education: $17,421,000
Education: $16,971,000
Other: $14,690,000
Highways: $12,519,000
Public Welfare: $12,026,000
Public Welfare: $10,599,000
Highways: $10,110,000
Transit Utilities: $2,319,000
Transit Utilities: $1,641,000
Health and Hospitals: $451,000
General Local Government Support: $423,000
General Local Government Support: $229,000
- Tax - Property: $251,575,000
Property: $242,222,000
- Total Salaries and Wages: $105,944,000
: $98,969,000
Morris County government finances - Cash and Securities in 2020:
- Assistance and Subsidies - Public Welfare, Federal Categorical Assistance Programs: $6,485,000
Public Welfare, Federal Categorical Assistance Programs: $5,220,000
Public Welfare, Cash Assistance Programs - Other: $3,772,000
Public Welfare, Cash Assistance Programs - Other: $3,040,000
- Bond Funds - Cash and Securities: $2,246,000
Cash and Securities: $2,122,000
- Charges - Solid Waste Management: $49,825,000
Solid Waste Management: $37,807,000
Higher Education - Other: $34,069,000
Higher Education - Other: $30,949,000
Parks and Recreation: $13,954,000
Parks and Recreation: $13,675,000
Higher Education Auxiliary Enterprises: $3,129,000
Higher Education Auxiliary Enterprises: $2,459,000
Elementary and Secondary Education - Other: $588,000
Elementary and Secondary Education - Other: $553,000
Elementary and Secondary Education School Tuition and Transportation: $449,000
Elementary and Secondary Education School Tuition and Transportation: $340,000
Other: $176,000
Elementary and Secondary Education School Lunch: $164,000
Elementary and Secondary Education School Lunch: $120,000
- Construction - Regular Highways: $11,528,000
Other Higher Education: $9,353,000
Regular Highways: $9,180,000
General Public Buildings: $7,493,000
General Public Buildings: $6,502,000
Elementary and Secondary Education: $2,265,000
Other Higher Education: $1,428,000
Solid Waste Management: $1,422,000
Parks and Recreation: $831,000
Correctional Institutions: $734,000
Elementary and Secondary Education: $728,000
Natural Resources - Other: $696,000
Judicial and Legal Services: $631,000
Public Welfare Institutions: $616,000
Parks and Recreation: $542,000
Public Welfare - Other: $487,000
Central Staff Services: $417,000
Police Protection: $296,000
Local Fire Protection: $170,000
Central Staff Services: $123,000
Natural Resources - Other: $54,000
Public Welfare Institutions: $52,000
Public Welfare - Other: $31,000
Judicial and Legal Services: $21,000
- Current Operations - General - Other: $86,935,000
General - Other: $78,953,000
Other Higher Education: $59,893,000
Other Higher Education: $58,617,000
Parks and Recreation: $43,872,000
Solid Waste Management: $37,338,000
Solid Waste Management: $36,195,000
Regular Highways: $29,861,000
Public Welfare Institutions: $23,495,000
Correctional Institutions: $22,634,000
Elementary and Secondary Education: $22,483,000
Regular Highways: $21,941,000
Elementary and Secondary Education: $21,218,000
Correctional Institutions: $21,180,000
Police Protection: $21,179,000
Central Staff Services: $20,023,000
Central Staff Services: $19,736,000
Police Protection: $19,252,000
Public Welfare Institutions: $19,019,000
Judicial and Legal Services: $17,770,000
Judicial and Legal Services: $17,237,000
Health - Other: $15,532,000
Housing and Community Development: $14,097,000
Parks and Recreation: $13,975,000
Health - Other: $13,447,000
Public Welfare - Other: $8,751,000
Public Welfare - Other: $8,224,000
General Public Buildings: $6,667,000
Financial Administration: $6,552,000
General Public Buildings: $6,268,000
Financial Administration: $6,249,000
Libraries: $3,835,000
Libraries: $3,606,000
Higher Education Auxiliary Enterprises: $2,779,000
Public Welfare, Vendor Payments for Other Purposes: $2,746,000
Protective Inspection and Regulation - Other: $2,443,000
Protective Inspection and Regulation - Other: $2,392,000
Public Welfare, Vendor Payments for Other Purposes: $2,358,000
Higher Education Auxiliary Enterprises: $2,210,000
Housing and Community Development: $1,783,000
Natural Resources - Other: $1,149,000
Public Welfare, Vendor Payments for Medical Care: $1,000,000
Public Welfare, Vendor Payments for Medical Care: $1,000,000
Natural Resources - Other: $791,000
Hospitals: $789,000
Hospitals: $789,000
- Federal Intergovernmental - Education: $3,094,000
Housing and Community Development: $2,835,000
Housing and Community Development: $2,152,000
Education: $698,000
- General - Interest on Debt: $17,339,000
Interest on Debt: $13,133,000
- Intergovernmental to Local - Other - Housing and Community Development: $1,070,000
Other - General - Other: $987,000
Other - General - Other: $893,000
Other - Housing and Community Development: $492,000
Other - Health - Other: $390,000
Other - Health - Other: $325,000
Other - Elementary and Secondary Education: $114,000
Other - Elementary and Secondary Education: $73,000
- Intergovernmental to State - Hospitals: $3,927,000
Hospitals: $3,869,000
General - Other: $388,000
General - Other: $106,000
Elementary and Secondary Education: $58,000
- Local Intergovernmental - Other: $47,252,000
Other: $30,280,000
Education: $24,072,000
Education: $12,553,000
Transit Utilities: $675,000
Transit Utilities: $675,000
Health and Hospitals: $603,000
Health and Hospitals: $470,000
Highways: $97,000
Public Welfare: $27,000
- Long Term Debt - Outstanding Unspecified Public Purpose: $446,821,000
Beginning Outstanding - Unspecified Public Purpose: $417,320,000
Beginning Outstanding - Unspecified Public Purpose: $361,525,000
Outstanding Unspecified Public Purpose: $351,818,000
Issue, Unspecified Public Purpose: $95,147,000
Retired Unspecified Public Purpose: $65,646,000
Retired Unspecified Public Purpose: $44,648,000
Issue, Unspecified Public Purpose: $34,943,000
- Miscellaneous - General Revenue - Other: $79,892,000
General Revenue - Other: $71,024,000
Sale of Property: $34,943,000
Sale of Property: $32,522,000
Interest Earnings: $5,903,000
Fines and Forfeits: $4,083,000
Fines and Forfeits: $3,896,000
Rents: $2,100,000
Interest Earnings: $2,070,000
Donations From Private Sources: $687,000
Rents: $666,000
Donations From Private Sources: $303,000
- Other Capital Outlay - Central Staff Services: $3,808,000
Police Protection: $2,355,000
Central Staff Services: $2,320,000
Police Protection: $1,806,000
Parks and Recreation: $1,241,000
Parks and Recreation: $1,050,000
Other Higher Education: $924,000
Public Welfare Institutions: $750,000
Other Higher Education: $734,000
Regular Highways: $666,000
Financial Administration: $623,000
Judicial and Legal Services: $282,000
Elementary and Secondary Education: $228,000
Transit Utilities: $201,000
Public Welfare - Other: $172,000
Transit Utilities: $135,000
Elementary and Secondary Education: $133,000
Health - Other: $103,000
Regular Highways: $74,000
Local Fire Protection: $67,000
Libraries: $66,000
General Public Building: $57,000
Correctional Institutions: $45,000
Correctional Institutions: $43,000
Judicial and Legal Services: $24,000
Health - Other: $23,000
Financial Administration: $7,000
General Public Building: $5,000
Libraries: $4,000
- Other Funds - Cash and Securities: $311,258,000
Cash and Securities: $298,698,000
- Short Term Debt Outstanding - End of Fiscal Year: $34,000
Beginning: $33,000
End of Fiscal Year: $31,000
Beginning: $30,000
- State Intergovernmental - Health and Hospitals: $21,469,000
Other: $17,582,000
Education: $17,421,000
Education: $16,971,000
Other: $14,690,000
Highways: $12,519,000
Public Welfare: $12,026,000
Public Welfare: $10,599,000
Highways: $10,110,000
Transit Utilities: $2,319,000
Transit Utilities: $1,641,000
Health and Hospitals: $451,000
General Local Government Support: $423,000
General Local Government Support: $229,000
- Tax - Property: $251,575,000
Property: $242,222,000
- Total Salaries and Wages: $105,944,000
: $98,969,000
Supplemental Security Income (SSI) in 2006:
- Total number of recipients: 3,766
- Number of aged recipients: 1,447
- Number of blind and disabled recipients: 2,319
- Number of recipients under 18: 206
- Number of recipients between 18 and 64: 1,737
- Number of recipients older than 64: 1,823
- Number of recipients also receiving OASDI: 1,073
- Amount of payments (thousands of dollars): 1,595
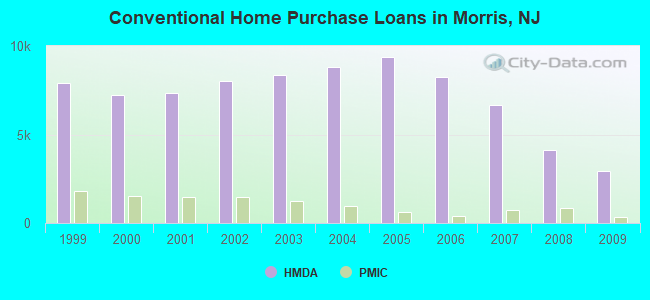
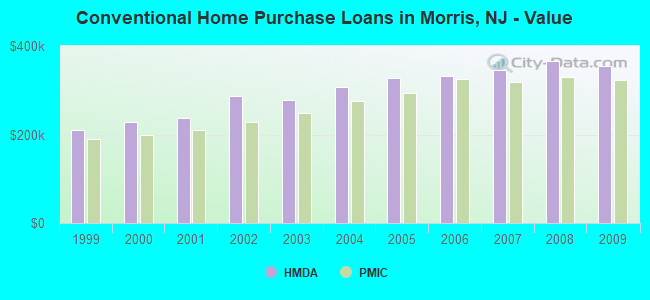
| Home Mortgage Disclosure Act Aggregated Statistics For Year 2009 (Based on 99 full tracts) | ||||||||||||||
| A) FHA, FSA/RHS & VA Home Purchase Loans | B) Conventional Home Purchase Loans | C) Refinancings | D) Home Improvement Loans | E) Loans on Dwellings For 5+ Families | F) Non-occupant Loans on < 5 Family Dwellings (A B C & D) | G) Loans On Manufactured Home Dwelling (A B C & D) | ||||||||
|---|---|---|---|---|---|---|---|---|---|---|---|---|---|---|
| Number | Average Value | Number | Average Value | Number | Average Value | Number | Average Value | Number | Average Value | Number | Average Value | Number | Average Value | |
| LOANS ORIGINATED | 1,087 | $319,132 | 2,960 | $354,366 | 15,015 | $313,788 | 633 | $169,646 | 19 | $2,972,684 | 287 | $267,875 | 3 | $68,000 |
| APPLICATIONS APPROVED, NOT ACCEPTED | 101 | $309,762 | 352 | $363,952 | 1,243 | $320,935 | 90 | $105,378 | 1 | $2,500,000 | 40 | $295,550 | 2 | $63,000 |
| APPLICATIONS DENIED | 193 | $290,637 | 439 | $347,141 | 4,407 | $330,420 | 405 | $113,351 | 2 | $354,000 | 177 | $252,175 | 4 | $60,000 |
| APPLICATIONS WITHDRAWN | 189 | $325,910 | 391 | $356,105 | 2,701 | $328,311 | 115 | $170,791 | 2 | $571,000 | 69 | $263,797 | 2 | $117,500 |
| FILES CLOSED FOR INCOMPLETENESS | 70 | $287,829 | 121 | $359,595 | 777 | $330,704 | 32 | $159,125 | 0 | $0 | 16 | $240,375 | 0 | $0 |
| Private Mortgage Insurance Companies Aggregated Statistics For Year 2009 (Based on 95 full tracts) | ||||||
| A) Conventional Home Purchase Loans | B) Refinancings | C) Non-occupant Loans on < 5 Family Dwellings (A & B) | ||||
|---|---|---|---|---|---|---|
| Number | Average Value | Number | Average Value | Number | Average Value | |
| LOANS ORIGINATED | 361 | $323,745 | 193 | $342,622 | 2 | $241,000 |
| APPLICATIONS APPROVED, NOT ACCEPTED | 110 | $324,545 | 94 | $351,553 | 1 | $270,000 |
| APPLICATIONS DENIED | 69 | $301,739 | 90 | $343,322 | 2 | $279,000 |
| APPLICATIONS WITHDRAWN | 49 | $311,061 | 26 | $340,923 | 0 | $0 |
| FILES CLOSED FOR INCOMPLETENESS | 20 | $277,200 | 3 | $396,667 | 0 | $0 |
| Most common first names in Morris County, NJ among deceased individuals | ||
| Name | Count | Lived (average) |
|---|---|---|
| Mary | 2,360 | 81.8 years |
| John | 2,262 | 75.4 years |
| William | 1,591 | 75.5 years |
| Joseph | 1,294 | 75.5 years |
| Helen | 1,169 | 81.7 years |
| Anna | 1,076 | 83.3 years |
| Margaret | 1,050 | 81.1 years |
| Robert | 1,023 | 72.6 years |
| George | 963 | 76.5 years |
| James | 950 | 72.6 years |
| Most common last names in Morris County, NJ among deceased individuals | ||
| Last name | Count | Lived (average) |
|---|---|---|
| Smith | 532 | 77.3 years |
| Miller | 279 | 78.1 years |
| Johnson | 239 | 79.0 years |
| Brown | 213 | 75.3 years |
| Williams | 187 | 76.0 years |
| Jones | 161 | 77.3 years |
| Anderson | 150 | 76.6 years |
| Murphy | 140 | 77.9 years |
| Taylor | 138 | 76.1 years |
| White | 124 | 79.1 years |
| Businesses in Morris County, NJ | ||||
| Name | Count | Name | Count | |
|---|---|---|---|---|
| 7-Eleven | 6 | J. Jill | 2 | |
| A&P | 2 | J.Crew | 2 | |
| ALDI | 1 | JCPenney | 1 | |
| ALDO | 1 | JoS. A. Bank | 3 | |
| AT&T | 7 | Jones New York | 3 | |
| Abercrombie & Fitch | 1 | Journeys | 1 | |
| Abercrombie Kids | 1 | Justice | 3 | |
| Ace Hardware | 1 | KFC | 3 | |
| Advance Auto Parts | 2 | Kmart | 1 | |
| Aeropostale | 2 | Kohl's | 2 | |
| Aerosoles | 2 | Lane Bryant | 2 | |
| American Eagle Outfitters | 1 | Lane Furniture | 4 | |
| Ann Taylor | 3 | LensCrafters | 1 | |
| Apple Store | 1 | Long John Silver's | 1 | |
| Applebee's | 3 | Lowe's | 2 | |
| Arby's | 1 | Macy's | 2 | |
| Ashley Furniture | 1 | Marriott | 1 | |
| Audi | 1 | Marshalls | 1 | |
| AutoZone | 2 | MasterBrand Cabinets | 25 | |
| BMW | 2 | McDonald's | 10 | |
| Bakers | 1 | Men's Wearhouse | 2 | |
| Banana Republic | 2 | Motherhood Maternity | 3 | |
| Barnes & Noble | 2 | New Balance | 1 | |
| Baskin-Robbins | 5 | New York & Co | 1 | |
| Bath & Body Works | 2 | Nike | 8 | |
| Bed Bath & Beyond | 3 | Nissan | 2 | |
| Best Cellars | 1 | Old Navy | 1 | |
| Best Western | 2 | Olive Garden | 1 | |
| Blockbuster | 5 | Outback | 2 | |
| Brookstone | 1 | Outback Steakhouse | 2 | |
| Burger King | 7 | Pac Sun | 1 | |
| CVS | 8 | Panera Bread | 5 | |
| Cache | 1 | Papa John's Pizza | 2 | |
| Casual Male XL | 1 | Pathmark | 2 | |
| Century 21 | 1 | Payless | 4 | |
| Charlotte Russe | 1 | Penske | 2 | |
| Chevrolet | 3 | PetSmart | 2 | |
| Chico's | 2 | Pier 1 Imports | 4 | |
| Cinnabon | 1 | Pizza Hut | 2 | |
| Circle K | 1 | Popeyes | 1 | |
| Clarks | 1 | Qdoba Mexican Grill | 2 | |
| Cold Stone Creamery | 3 | Quality | 1 | |
| Coldwater Creek | 1 | Quiznos | 2 | |
| Comfort Suites | 1 | RadioShack | 5 | |
| Costco | 1 | Red Lobster | 1 | |
| Cracker Barrel | 1 | Red Robin | 1 | |
| Curves | 4 | Rite Aid | 7 | |
| DHL | 3 | Ruby Tuesday | 1 | |
| Dairy Queen | 4 | Sam's Club | 1 | |
| Days Inn | 1 | Sears | 2 | |
| Deb | 1 | Sephora | 1 | |
| Decora Cabinetry | 8 | Spencer Gifts | 1 | |
| Domino's Pizza | 6 | Sprint Nextel | 4 | |
| DressBarn | 2 | Staples | 6 | |
| Dressbarn | 3 | Starbucks | 10 | |
| Dunkin Donuts | 33 | Stop & Shop | 3 | |
| Eddie Bauer | 2 | Subaru | 1 | |
| Express | 1 | Subway | 21 | |
| Extended Stay America | 1 | T-Mobile | 14 | |
| Famous Footwear | 2 | T.G.I. Driday's | 1 | |
| Fashion Bug | 1 | T.J.Maxx | 2 | |
| FedEx | 90 | Taco Bell | 1 | |
| Firestone Complete Auto Care | 1 | Talbots | 3 | |
| Foot Locker | 1 | Target | 2 | |
| Ford | 4 | The Room Place | 1 | |
| Forever 21 | 1 | Toyota | 2 | |
| GNC | 9 | Toys"R"Us | 5 | |
| GameStop | 7 | Trader Joe's | 1 | |
| Gap | 3 | True Value | 4 | |
| Goodwill | 7 | U-Haul | 10 | |
| Gymboree | 2 | UPS | 108 | |
| H&M | 1 | Verizon Wireless | 8 | |
| H&R Block | 6 | Victoria's Secret | 1 | |
| Haagen-Dazs | 1 | Volkswagen | 1 | |
| Harmon Face Values | 3 | Walgreens | 8 | |
| Hilton | 2 | Walmart | 5 | |
| Holiday Inn | 3 | Wendy's | 6 | |
| Hollister Co. | 1 | Westin | 1 | |
| Home Depot | 3 | Wet Seal | 1 | |
| Honda | 1 | White Castle | 1 | |
| Hot Topic | 1 | Whole Foods Market | 1 | |
| Hyatt | 2 | World Gym | 1 | |
| Hyundai | 1 | YMCA | 2 | |
| IHOP | 2 | |||
Morris County on our top lists:
- #4 on the list of "Top 101 counties with the largest decrease in the number of births per 1000 residents 2000-2006 to 2007-2013 (pop 50,000+)"
- #8 on the list of "Top 101 counties with the lowest number of infant deaths per 1000 residents 2007-2013 (pop. 50,000+)"
- #10 on the list of "Top 101 counties with the highest percentage of residents that visited a dentist within the past year"
- #11 on the list of "Top 101 counties with the largest decrease in the number of infant deaths per 1000 residents 2000-2006 to 2007-2013 (pop. 50,000+)"
- #12 on the list of "Top 101 counties with the best general health status score of residents (1-5), 3 years of data"
- #29 on the list of "Top 101 counties with the largest number of people without health insurance coverage in 2000 (pop. 50,000+)"
- #31 on the list of "Top 101 counties with the lowest percentage of residents that keep firearms around their homes"
- #44 on the list of "Top 101 counties with the highest ground withdrawal of fresh water for public supply"
- #44 on the list of "Top 101 counties with the highest ground withdrawal of fresh water for public supply (pop. 50,000+)"
- #46 on the list of "Top 101 counties with the lowest number of births per 1000 residents 2007-2013"
- #46 on the list of "Top 101 counties with the lowest number of births per 1000 residents 2007-2013 (pop 50,000+)"
- #46 on the list of "Top 101 counties with the largest number of children under 18 without health insurance coverage in 2000 (pop. 50,000+)"
- #59 on the list of "Top 101 counties with the lowest Sulfur Oxides Annual air pollution readings in 2012 (µg/m3)"
- #67 on the list of "Top 101 counties with the most Catholic adherents"
- #67 on the list of "Top 101 counties with the most Catholic adherents (pop. 50,000+)"
- #71 on the list of "Top 101 counties with the most Catholic congregations"
- #71 on the list of "Top 101 counties with the most Catholic congregations (pop. 50,000+)"
- #79 on the list of "Top 101 counties with the highest total withdrawal of fresh water for public supply (pop. 50,000+)"
- #80 on the list of "Top 101 counties with the most Orthodox adherents"
- #80 on the list of "Top 101 counties with the most Orthodox adherents (pop. 50,000+)"