Somerset County, New Jersey (NJ)
County owner-occupied free and clear houses and condos in 2010: 21,434
County owner-occupied houses and condos in 2000: 84,153
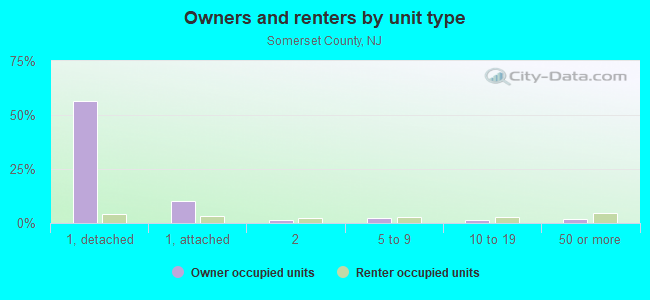
Renter-occupied apartments: 27,329 (it was 24,831 in 2000)
| % of renters here: | 23% |
| State: | 35% |
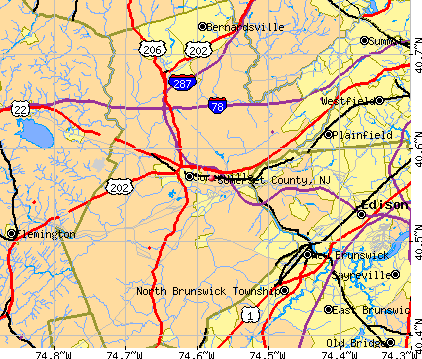
Land area: 305 sq. mi.
Water area: 0.4 sq. mi.
Population density: 1138 people per square mile (very high).
Industries providing employment: Professional, scientific, management, administrative, and waste management services (20.6%), Educational, health and social services (20.1%), Manufacturing (14.3%).
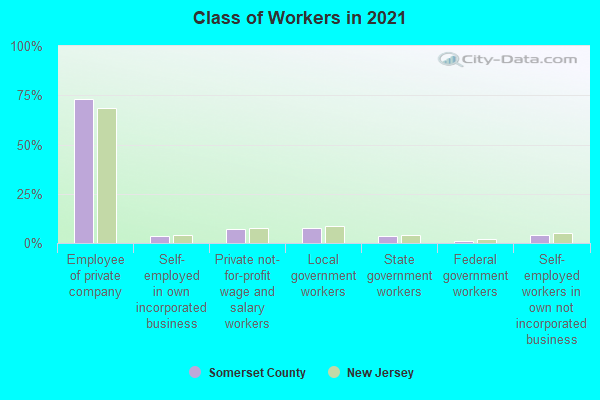
Type of workers:
- Private wage or salary: 84%
- Government: 12%
- Self-employed, not incorporated: 4%
- Unpaid family work: 0%
- OSM Map
- General Map
- Google Map
- MSN Map

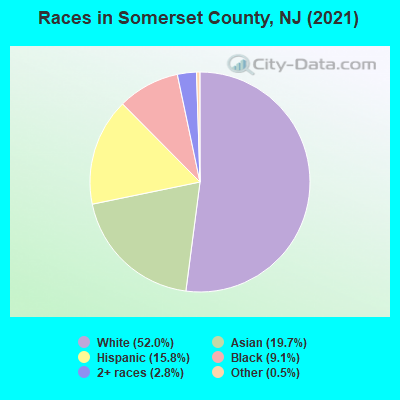
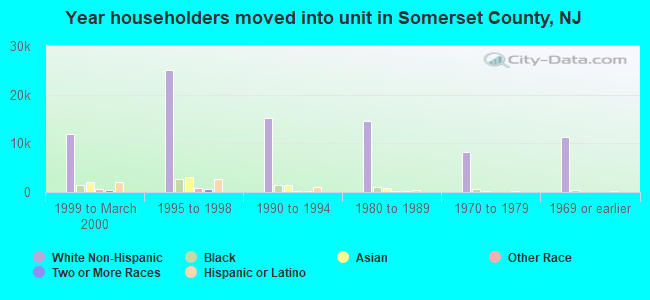
- 174,00750.2%White Non-Hispanic Alone
- 68,27119.7%Asian alone
- 56,77816.4%Hispanic or Latino
- 30,2348.7%Black Non-Hispanic Alone
- 16,2784.7%Two or more races
- 1,2320.4%Some other race alone
- 750.02%American Indian and Alaska Native alone
| Median resident age: | 42.5 years |
| New Jersey median age: | 40.4 years |
| Males: 171,390 | |
| Females: 175,485 |

 | NJ Real Estate Market. (125 replies) |
| It's been 9 months. Where is NJ Recreational Marijuana? (245 replies) |
| NJ Cities/Large Suburbs, Ranked (56 replies) |
| Franklin township, NJ (Somerset) (9 replies) |
| why is housing inventory so damn tight? (41 replies) |
| Water bill in Somerset County? (11 replies) |
| Somerset County: | 2.0 people |
| New Jersey: | 3 people |
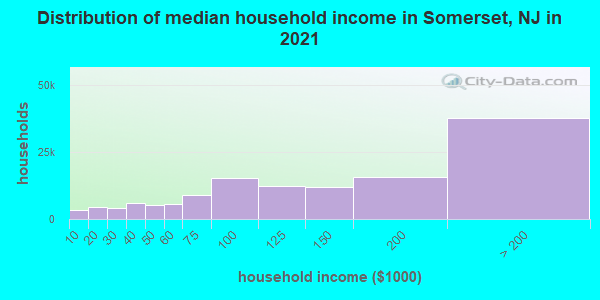
Estimated median household income in 2022: $135,577 ($76,933 in 1999)
| This county: | $135,577 |
| New Jersey: | $96,346 |
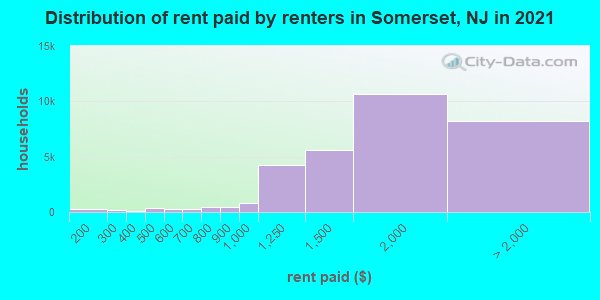
Median contract rent in 2022 for apartments: $1,689 (lower quartile is $1,339, upper quartile is $2,175)
| This county: | $1689 |
| State: | $1399 |
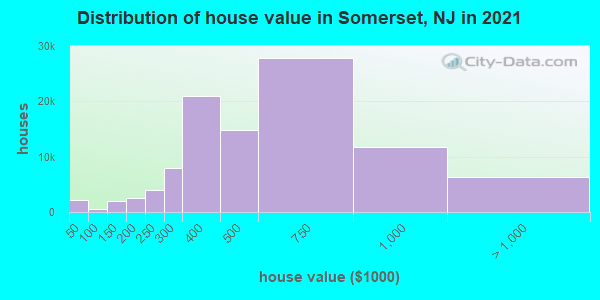
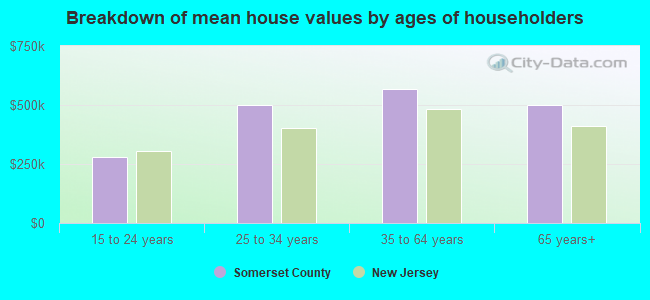
Estimated median house or condo value in 2022: $497,200 (it was $222,400 in 2000)
| Somerset: | $497,200 |
| New Jersey: | $428,900 |
Mean price in 2022:
Median monthly housing costs for homes and condos with a mortgage: $2,844Detached houses: $672,183
Here: $672,183 State: $537,591 Townhouses or other attached units: $368,771
Here: $368,771 State: $381,113 In 2-unit structures: $336,165
Here: $336,165 State: $444,476 In 3-to-4-unit structures: $240,497
Here: $240,497 State: $457,463 In 5-or-more-unit structures: $259,391
Here: $259,391 State: $368,745 Mobile homes: $90,000
Here: $90,000 State: $119,788
Median monthly housing costs for units without a mortgage: $1,272
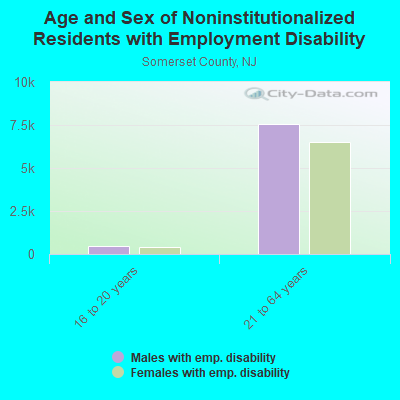
Institutionalized population: 2,523
Crime in 2020 (reported by the sheriff's office or county police, not the county total):
- Murders: 0
- Rapes: 0
- Robberies: 0
- Assaults: 2
- Burglaries: 0
- Thefts: 0
- Auto thefts: 0
Crime in 2019 (reported by the sheriff's office or county police, not the county total):
- Murders: 0
- Rapes: 0
- Robberies: 0
- Assaults: 1
- Burglaries: 0
- Thefts: 1
- Auto thefts: 0
Health of residents in Somerset County based on CDC Behavioral Risk Factor Surveillance System Survey Questionnaires from 2003 to 2012:
General health status score of residents in this county from 1 (poor) to 5 (excellent) is 3.8. This is significantly better than average.77.5% of residents exercised in the past month. This is about average.
40.3% of residents smoked 100+ cigarettes in their lives. This is less than average.
81.2% of adult residents drank alcohol in the past 30 days. This is more than average.
82.8% of residents visited a dentist within the past year. This is more than average.
Average weight of males is 191 pounds. This is about average.
Average weight of females is 155 pounds. This is less than average.
11.6% of residents keep firearms around their homes. This is less than average.
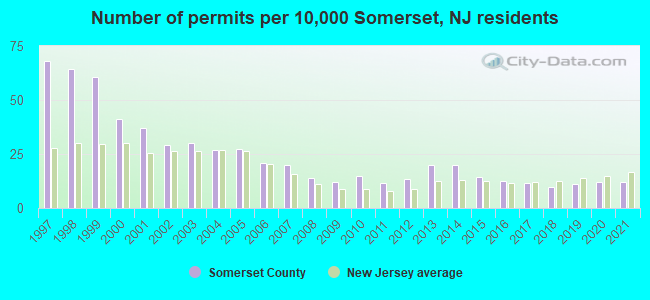
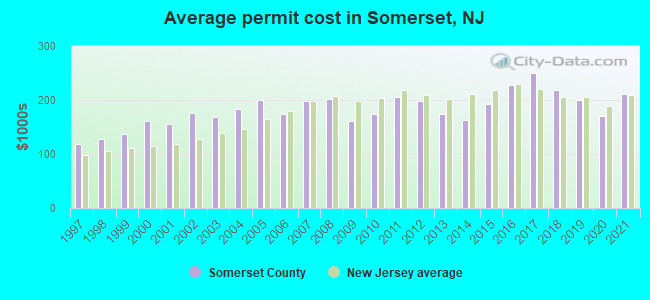
Single-family new house construction building permits:
- 2022: 311 buildings, average cost: $237,600
- 2021: 360 buildings, average cost: $211,000
- 2020: 357 buildings, average cost: $170,400
- 2019: 326 buildings, average cost: $199,600
- 2018: 290 buildings, average cost: $219,200
- 2017: 344 buildings, average cost: $250,300
- 2016: 370 buildings, average cost: $227,200
- 2015: 422 buildings, average cost: $192,200
- 2014: 595 buildings, average cost: $163,000
- 2013: 589 buildings, average cost: $174,500
- 2012: 404 buildings, average cost: $198,800
- 2011: 347 buildings, average cost: $206,200
- 2010: 442 buildings, average cost: $175,400
- 2009: 358 buildings, average cost: $162,200
- 2008: 411 buildings, average cost: $201,000
- 2007: 593 buildings, average cost: $199,200
- 2006: 623 buildings, average cost: $174,600
- 2005: 818 buildings, average cost: $199,700
- 2004: 797 buildings, average cost: $183,900
- 2003: 890 buildings, average cost: $168,800
- 2002: 869 buildings, average cost: $175,500
- 2001: 1103 buildings, average cost: $155,700
- 2000: 1227 buildings, average cost: $161,300
- 1999: 1808 buildings, average cost: $136,800
- 1998: 1910 buildings, average cost: $128,300
- 1997: 2030 buildings, average cost: $119,400
Median real estate property taxes paid for housing units with mortgages in 2022: $9,833 (2.0%)
Median real estate property taxes paid for housing units with no mortgage in 2022: $9,838 (2.0%)
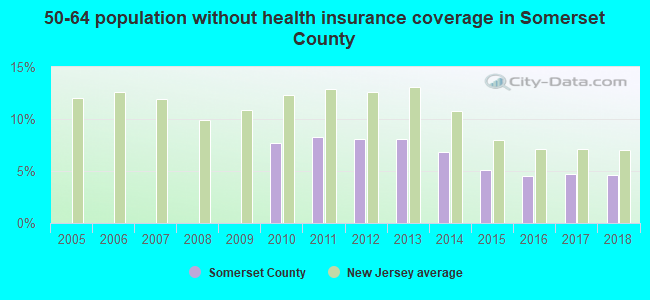
| Somerset County: | 4.9% |
| New Jersey: | 9.7% |
Median age of residents in 2022: 42.5 years old
(Males: 41.5 years old, Females: 43.5 years old)
(Median age for: White residents: 49.7 years old, Black residents: 40.8 years old, American Indian residents: 25.2 years old, Asian residents: 41.7 years old, Hispanic or Latino residents: 33.0 years old, Other race residents: 33.6 years old)
Area name: Middlesex-Somerset-Hunterdon, NJ HUD Metro FMR Area
Fair market rent in 2006 for a 1-bedroom apartment in Somerset County is $1009 a month.
Fair market rent for a 2-bedroom apartment is $1187 a month.
Fair market rent for a 3-bedroom apartment is $1490 a month.
Cities in this county include: Somerset, North Plainfield, Bradley Gardens, Somerville, Martinsville, Manville, Bound Brook, East Franklin, Bernardsville, Raritan.
Neighboring counties: Bedford County, Pennsylvania  , Columbiana County, Ohio , De Witt County, Illinois , Larimer County, Colorado , Phillips County, Colorado , Suffolk County, New York
  , Tipton County, Indiana , Schuyler County, Illinois .
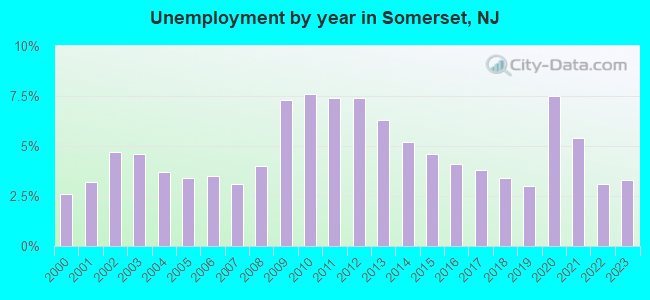
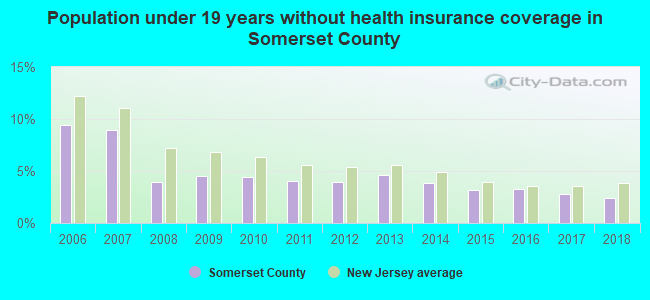
| Here: | 3.8% |
| New Jersey: | 4.5% |
Current college students: 14,627
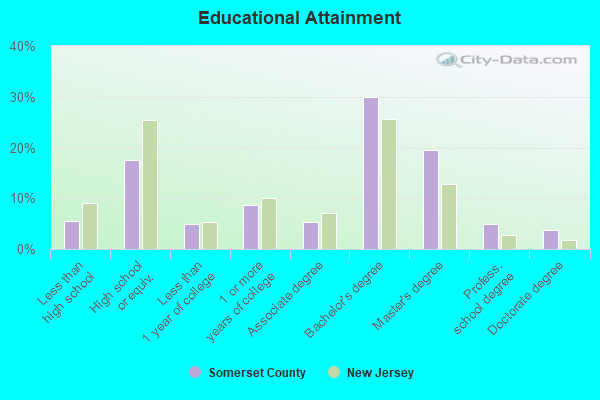
People 25 years of age or older with a high school degree or higher: 94.1%
People 25 years of age or older with a bachelor's degree or higher: 59.4%
Number of foreign born residents: 92,473 (63.6% naturalized citizens)
| Somerset County: | 26.7% |
| Whole state: | 23.5% |
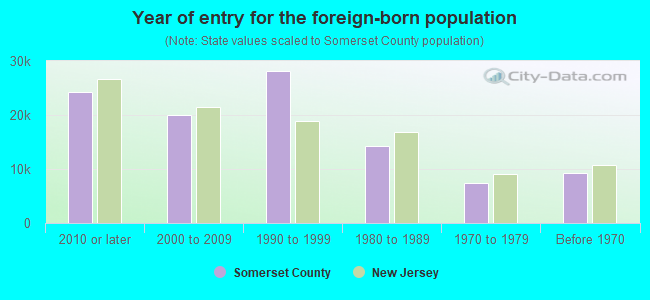
- Year of entry for the foreign-born population
- 26,5742010 or later
- 21,4052000 to 2009
- 20,5311990 to 1999
- 14,3091980 to 1989
- 7,4281970 to 1979
- 9,246Before 1970
Mean travel time to work (commute): minutes
Percentage of county residents living and working in this county: 95.5%
Housing units in structures:
- One, detached: 78,524
- One, attached: 21,529
- Two: 5,085
- 3 or 4: 5,812
- 5 to 9: 5,692
- 10 to 19: 6,996
- 20 to 49: 3,264
- 50 or more: 6,341
- Mobile homes: 186
Housing units in Somerset County with a mortgage: 63,780 (6,137 second mortgage, 111 home equity loan, 5,603 both second mortgage and home equity loan)
Houses without a mortgage: 2,370
| Here: | 96.9% with mortgage |
| State: | 95.9% with mortgage |
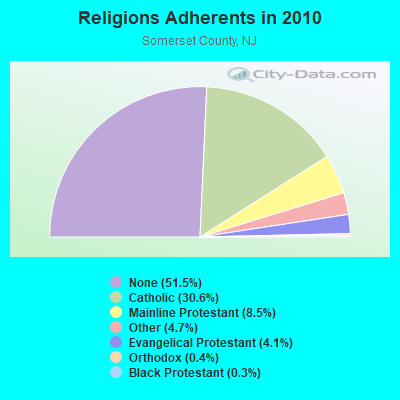
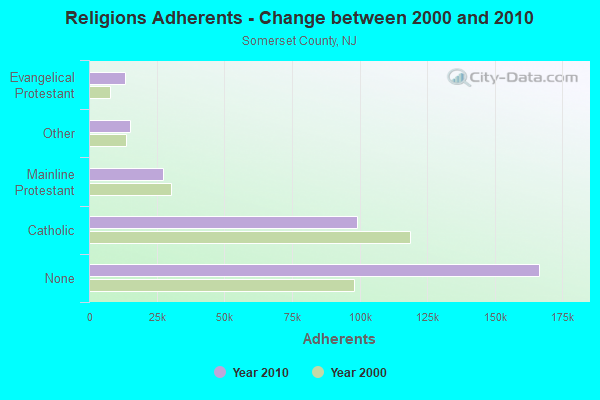
Religion statistics for Somerset County
| Religion | Adherents | Congregations |
|---|---|---|
| Catholic | 98,951 | 29 |
| Mainline Protestant | 27,472 | 68 |
| Other | 15,078 | 33 |
| Evangelical Protestant | 13,158 | 53 |
| Orthodox | 1,200 | 6 |
| Black Protestant | 1,076 | 7 |
| None | 166,509 | - |
Source: Clifford Grammich, Kirk Hadaway, Richard Houseal, Dale E.Jones, Alexei Krindatch, Richie Stanley and Richard H.Taylor. 2012. 2010 U.S.Religion Census: Religious Congregations & Membership Study. Association of Statisticians of American Religious Bodies. Jones, Dale E., et al. 2002. Congregations and Membership in the United States 2000. Nashville, TN: Glenmary Research Center.
Food Environment Statistics:
| Somerset County: | 2.14 / 10,000 pop. |
| State: | 2.90 / 10,000 pop. |
| Here: | 0.09 / 10,000 pop. |
| New Jersey: | 0.06 / 10,000 pop. |
| This county: | 1.65 / 10,000 pop. |
| New Jersey: | 1.76 / 10,000 pop. |
| Somerset County: | 0.56 / 10,000 pop. |
| New Jersey: | 0.81 / 10,000 pop. |
| This county: | 7.96 / 10,000 pop. |
| State: | 7.15 / 10,000 pop. |
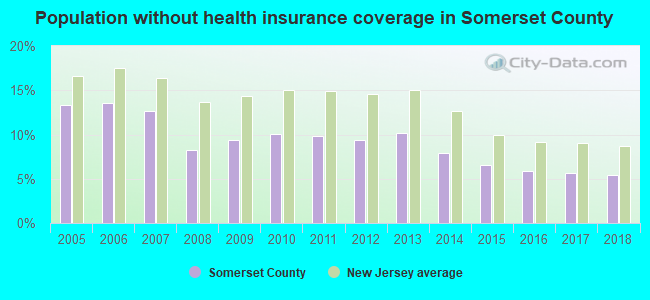
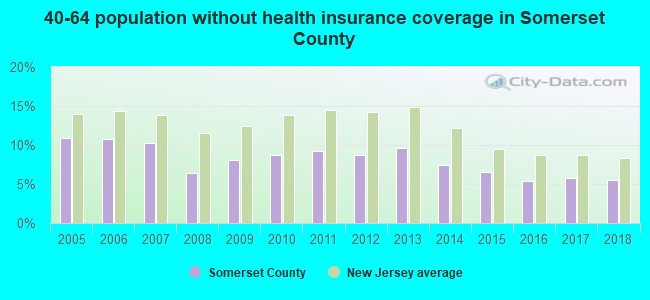
| Somerset County: | 6.7% |
| New Jersey: | 8.3% |
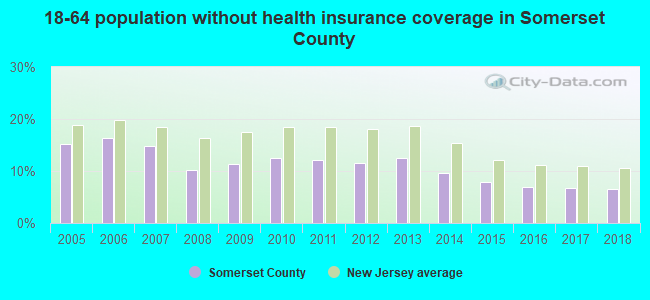
| Somerset County: | 20.4% |
| State: | 23.3% |
| Here: | 24.0% |
| State: | 18.0% |
Agriculture in Somerset County:
Average size of farms: 82 acresAverage value of agricultural products sold per farm: $34,081
Average value of crops sold per acre for harvested cropland: $518.73
The value of nursery, greenhouse, floriculture, and sod as a percentage of the total market value of agricultural products sold: 40.42%
The value of livestock, poultry, and their products as a percentage of the total market value of agricultural products sold: 45.14%
Average total farm production expenses per farm: $32,243
Harvested cropland as a percentage of land in farms: 43.96%
Irrigated harvested cropland as a percentage of land in farms: 1.47%
Average market value of all machinery and equipment per farm: $50,486
The percentage of farms operated by a family or individual: 81.45%
Average age of principal farm operators: 56 years
Average number of cattle and calves per 100 acres of all land in farms: 7.83
Milk cows as a percentage of all cattle and calves: 21.42%
Corn for grain: 1823 harvested acres
All wheat for grain: 2043 harvested acres
Soybeans for beans: 1640 harvested acres
Vegetables: 159 harvested acres
Land in orchards: 166 acres
Earthquake activity:
Somerset County-area historical earthquake activity is significantly above New Jersey state average. It is 68% smaller than the overall U.S. average.On 8/23/2011 at 17:51:04, a magnitude 5.8 (5.8 MW, Depth: 3.7 mi, Class: Moderate, Intensity: VI - VII) earthquake occurred 257.1 miles away from Somerset County center
On 1/16/1994 at 01:49:16, a magnitude 4.6 (4.6 MB, 4.6 LG, Depth: 3.1 mi, Class: Light, Intensity: IV - V) earthquake occurred 78.4 miles away from the county center
On 10/7/1983 at 10:18:46, a magnitude 5.3 (5.1 MB, 5.3 LG, 5.1 ML) earthquake occurred 234.5 miles away from the county center
On 4/20/2002 at 10:50:47, a magnitude 5.3 (5.3 ML, Depth: 3.0 mi) earthquake occurred 276.6 miles away from the county center
On 1/16/1994 at 00:42:43, a magnitude 4.2 (4.2 MB, 4.0 LG, Depth: 3.1 mi) earthquake occurred 76.9 miles away from Somerset County center
On 4/20/2002 at 10:50:47, a magnitude 5.2 (5.2 MB, 4.2 MS, 5.2 MW, 5.0 MW) earthquake occurred 274.7 miles away from the county center
Magnitude types: regional Lg-wave magnitude (LG), body-wave magnitude (MB), local magnitude (ML), surface-wave magnitude (MS), moment magnitude (MW)
Most recent natural disasters:
- New Jersey Covid-19 Pandemic, Incident Period: January 20, 2020, Major Disaster (Presidential) Declared DR-4488-NJ: March 25, 2020, FEMA Id: 4488, Natural disaster type: Other
- New Jersey Severe Winter Storm And Snowstorm, Incident Period: March 6, 2018 - March 7, 2018, FEMA Id: 4368, Natural disaster type: Snowstorm, Winter Storm
- New Jersey Severe Winter Storm and Snowstorm, Incident Period: January 22, 2016 to January 24, 2016, Major Disaster (Presidential) Declared DR-4264: March 14, 2016, FEMA Id: 4264, Natural disaster type: Snowstorm, Winter Storm
- New Jersey Hurricane Sandy, Incident Period: October 26, 2012 to November 08, 2012, Emergency Declared EM-3354: October 28, 2012, FEMA Id: 3354, Natural disaster type: Hurricane
- New Jersey Hurricane Sandy, Incident Period: October 26, 2012 to November 08, 2012, Major Disaster (Presidential) Declared DR-4086: October 30, 2012, FEMA Id: 4086, Natural disaster type: Hurricane
- New Jersey Severe Storm, Incident Period: October 29, 2011, Major Disaster (Presidential) Declared DR-4048: November 30, 2011, FEMA Id: 4048, Natural disaster type: Storm
- New Jersey Hurricane Irene, Incident Period: August 27, 2011 to September 05, 2011, Major Disaster (Presidential) Declared DR-4021: August 31, 2011, FEMA Id: 4021, Natural disaster type: Hurricane
- New Jersey Hurricane Irene, Incident Period: August 26, 2011 to September 05, 2011, Emergency Declared EM-3332: August 27, 2011, FEMA Id: 3332, Natural disaster type: Hurricane
- New Jersey Severe Winter Storm and Snowstorm, Incident Period: December 26, 2010 to December 27, 2010, Major Disaster (Presidential) Declared DR-1954: February 04, 2011, FEMA Id: 1954, Natural disaster type: Snowstorm, Winter Storm
- New Jersey Severe Storms and Flooding, Incident Period: March 12, 2010 to April 15, 2010, Major Disaster (Presidential) Declared DR-1897: April 02, 2010, FEMA Id: 1897, Natural disaster type: Storm, Flood
- 17 other natural disasters have been reported since 1953.
The number of natural disasters in Somerset County (27) is a lot greater than the US average (15).
Major Disasters (Presidential) Declared: 17
Emergencies Declared: 9
Causes of natural disasters: Floods: 7, Hurricanes: 7, Storms: 6, Heavy Rains: 4, Snowstorms: 4, Winter Storms: 3, Blizzards: 2, Water Shortages: 2, Tornado: 1, Wind: 1, Other: 3 (Note: some incidents may be assigned to more than one category).
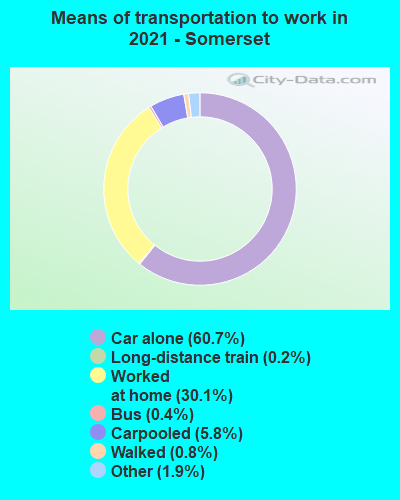
Means of transportation to work:
- Drove a car alone: 131,181 (65.5%)
- Carpooled: 16,021 (8.0%)
- Bus: 469 (0.2%)
- Subway or elevated rail: 133 (0.1%)
- Long-distance train or commuter rail: 52 (0.0%)
- Taxicab, motorcycle, or other means: 4,146 (2.1%)
- Bicycle: 262 (0.1%)
- Walked: 3,558 (1.8%)
- Worked at home: 44,446 (22.2%)
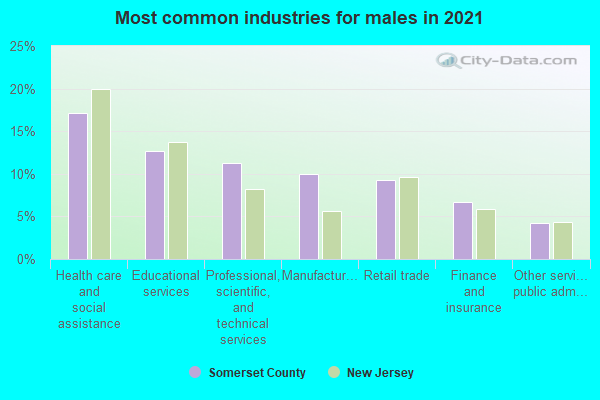
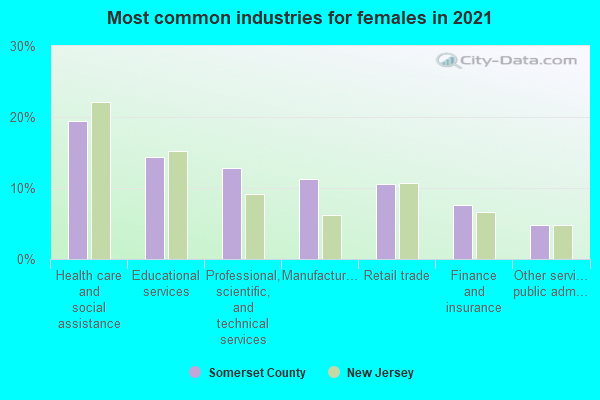
- Health care and social assistance (14%)
- Educational services (12%)
- Professional, scientific, and technical services (11%)
- Manufacturing (11%)
- Retail trade (7%)
- Finance and insurance (7%)
- Other services, except public administration (4%)
- Health care and social assistance (17%)
- Educational services (15%)
- Professional, scientific, and technical services (13%)
- Manufacturing (12%)
- Retail trade (9%)
- Finance and insurance (8%)
- Other services, except public administration (4%)
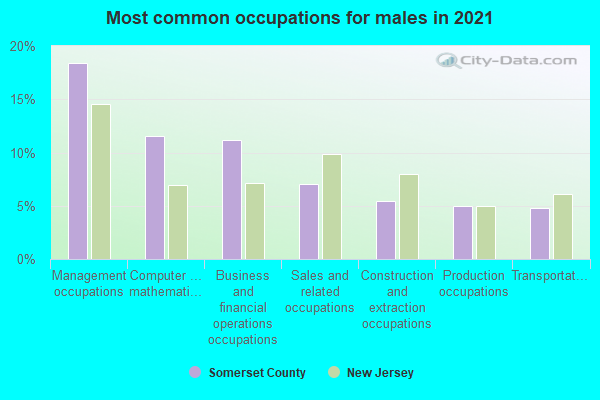
- Management occupations (16%)
- Computer and mathematical occupations (12%)
- Sales and related occupations (10%)
- Business and financial operations occupations (9%)
- Construction and extraction occupations (6%)
- Office and administrative support occupations (5%)
- Production occupations (4%)
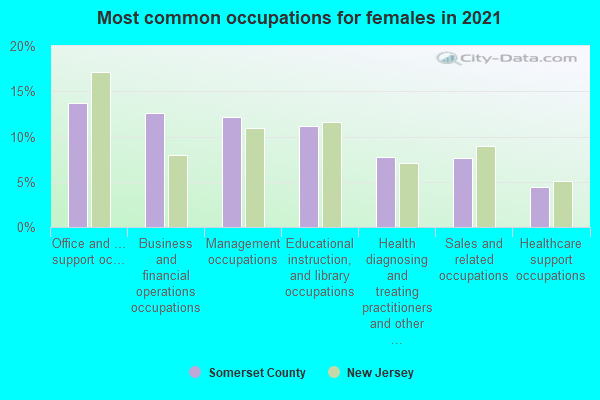
- Management occupations (14%)
- Office and administrative support occupations (13%)
- Business and financial operations occupations (11%)
- Educational instruction, and library occupations (10%)
- Sales and related occupations (8%)
- Health diagnosing and treating practitioners and other technical occupations (8%)
- Computer and mathematical occupations (7%)
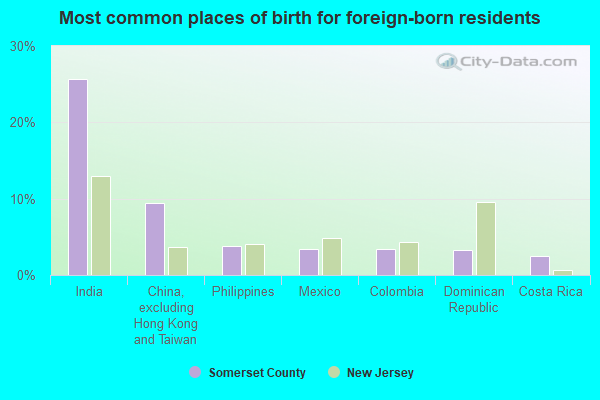
- India (25%)
- China, excluding Hong Kong and Taiwan (9%)
- Colombia (4%)
- Philippines (4%)
- Dominican Republic (4%)
- Costa Rica (3%)
- Mexico (3%)
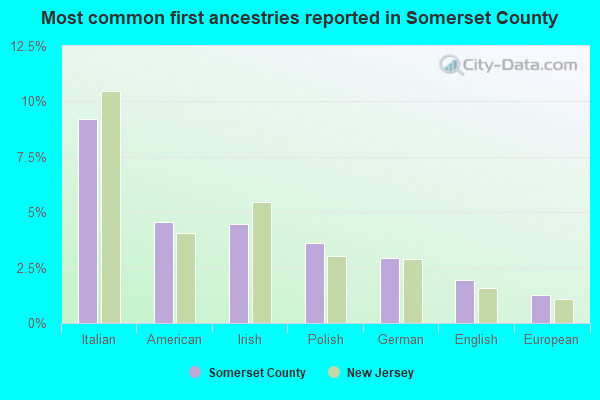
- Italian (9%)
- American (5%)
- Irish (4%)
- Polish (4%)
- German (3%)
- English (2%)
- Portuguese (1%)
People in group quarters in Somerset County, New Jersey in 2010:
- 1,810 people in nursing facilities/skilled-nursing facilities
- 479 people in college/university student housing
- 313 people in group homes intended for adults
- 273 people in local jails and other municipal confinement facilities
- 242 people in residential schools for people with disabilities
- 220 people in other noninstitutional facilities
- 200 people in emergency and transitional shelters (with sleeping facilities) for people experiencing homelessness
- 124 people in residential treatment centers for adults
- 111 people in workers' group living quarters and job corps centers
- 106 people in residential treatment centers for juveniles (non-correctional)
- 71 people in mental (psychiatric) hospitals and psychiatric units in other hospitals
- 21 people in group homes for juveniles (non-correctional)
People in group quarters in Somerset County, New Jersey in 2000:
- 2,103 people in nursing homes
- 460 people in other noninstitutional group quarters
- 308 people in mental (psychiatric) hospitals or wards
- 263 people in local jails and other confinement facilities (including police lockups)
- 213 people in religious group quarters
- 194 people in wards in general hospitals for patients who have no usual home elsewhere
- 178 people in homes for the mentally retarded
- 124 people in residential treatment centers for emotionally disturbed children
- 118 people in other nonhousehold living situations
- 111 people in schools, hospitals, or wards for the intellectually disabled
- 102 people in hospitals or wards for drug/alcohol abuse
- 86 people in orthopedic wards and institutions for the physically handicapped
- 66 people in college dormitories (includes college quarters off campus)
- 65 people in homes for the mentally ill
- 39 people in other group homes
- 31 people in wards in military hospitals for patients who have no usual home elsewhere
- 23 people in homes for the physically handicapped
- 11 people in unknown juvenile institutions
- 10 people in homes or halfway houses for drug/alcohol abuse
- 4 people in agriculture workers' dormitories on farms
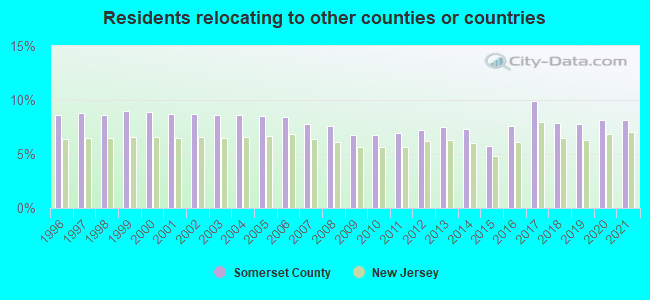
8.25% of this county's 2021 resident taxpayers lived in other counties in 2020 ($109,693 average adjusted gross income)
| Here: | 8.25% |
| New Jersey average: | 6.70% |
10 or fewer of this county's residents moved from foreign countries.
5.73% relocated from other counties in New Jersey ($72,292 average AGI)
2.52% relocated from other states ($37,401 average AGI)
Somerset County: 2.52% New Jersey average: 2.98%

Top counties from which taxpayers relocated into this county between 2020 and 2021:
| from Middlesex County, NJ | |
| from Union County, NJ | |
| from Morris County, NJ | |
| from Essex County, NJ | |
| from Hudson County, NJ | |
| from Hunterdon County, NJ | |
| from New York County, NY |
8.17% of this county's 2020 resident taxpayers moved to other counties in 2021 ($127,879 average adjusted gross income)
| Here: | 8.17% |
| New Jersey average: | 7.02% |
10 or fewer of this county's residents moved to foreign countries.
4.74% relocated to other counties in New Jersey ($61,530 average AGI)
3.44% relocated to other states ($66,348 average AGI)
Somerset County: 3.44% New Jersey average: 3.32%
Top counties to which taxpayers relocated from this county between 2020 and 2021:
| to Middlesex County, NJ | |
| to Hunterdon County, NJ | |
| to Union County, NJ | |
| to Morris County, NJ | |
| to Mercer County, NJ | |
| to Ocean County, NJ | |
| to Hudson County, NJ |
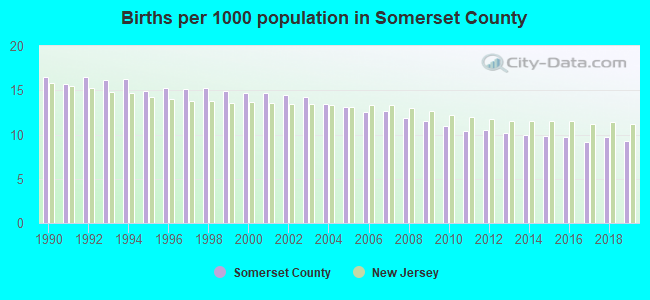
Births per 1000 population from 1990 to 1999: 15.7
Births per 1000 population from 2000 to 2009: 13.3
Births per 1000 population from 2010 to 2022: 8.3
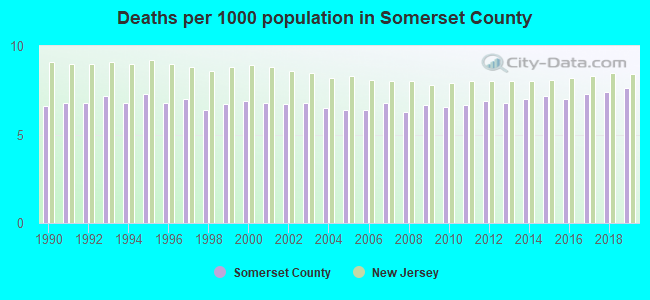
Deaths per 1000 population from 1990 to 1999: 6.8
Deaths per 1000 population from 2000 to 2009: 6.6
Deaths per 1000 population from 2010 to 2020: 7.2
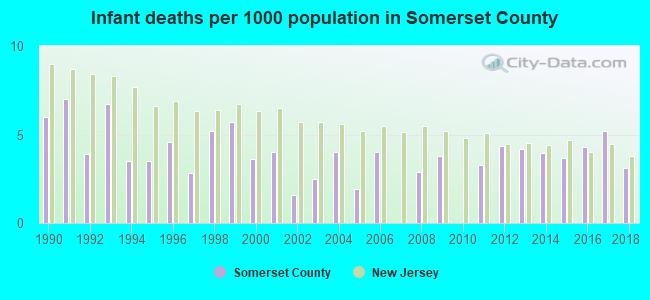
Infant deaths per 1000 live births from 1990 to 1999: 4.9
Infant deaths per 1000 live births from 2000 to 2009: 2.8
Infant deaths per 1000 live births from 2010 to 2021: 3.2
Persons under 19 years old without health insurance coverage in 2018: 2.4%
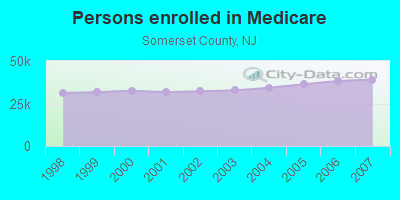
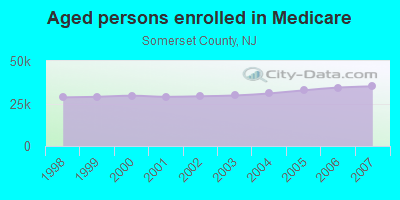
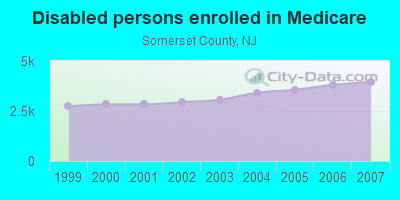
Persons enrolled in hospital insurance and/or supplemental medical insurance (Medicare) in July 1, 2007: 39,041 (35,082 aged, 3,959 disabled)
Children under 18 without health insurance coverage in 2007: 6,035 (7%)
Most common underlying causes of death in Somerset County, New Jersey in 1999 - 2019:
- Atherosclerotic heart disease (3,909)
- Bronchus or lung, unspecified - Malignant neoplasms (2,370)
- Acute myocardial infarction, unspecified (2,294)
- Unspecified dementia (1,886)
- Chronic obstructive pulmonary disease, unspecified (1,369)
- Stroke, not specified as haemorrhage or infarction (1,326)
- Alzheimer disease, unspecified (1,127)
- Congestive heart failure (1,069)
- Pneumonia, unspecified (1,056)
- Septicaemia, unspecified (1,006)
Population without health insurance coverage in 2000: 9%
Children under 18 without health insurance coverage in 2000: 7%
Short term general hospital admissions per 100,000 population in 2004: 8,140
Short term general hospital beds per 100,000 population in 2004: 185
Emergency room visits per 100,000 population in 2004: 22,627
General practice office based MDs per 100,000 population in 2005: 1,275
Medical specialist MDs per 100,000 population in 2005: 611
Dentists per 100,000 population in 1998: 14
Total births per 100,000 population, July 2005 - July 2006 : 83
Total deaths per 100,000 population, July 2005 - July 2006: 88
Limited-service eating places per 100,000 population in 2005 : 26
Beer, wine & liquor stores per 100,000 population in 2005: 1
Suicides per 1,000,000 population from 2000 to 2006: 58.8. This is less than state average.
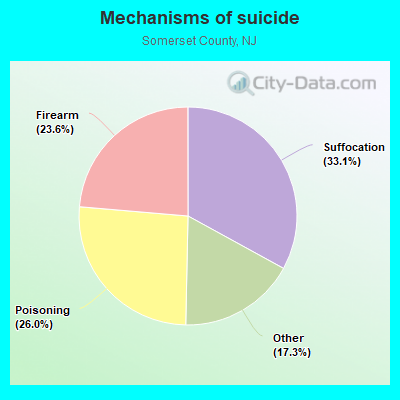
- Suffocation - 19.4
- Poisoning - 15.3
- Firearm - 13.9
- Other - 10.2
Household type by relationship:
Households: 346,875- Male householders: 64,610 (11,401 living alone), Female householders: 65,568 (18,489 living alone)
78,493 spouses (77,982 opposite-sex spouses), 6,575 unmarried partners, (6,331 opposite-sex unmarried partners), 105,019 children (100,761 natural, 1,992 adopted, 2,266 stepchildren), 5,410 grandchildren, 2,164 brothers or sisters, 6,462 parents, 284 foster children, 4,309 other relatives, 3,705 non-relatives
- In group quarters: 4,276
Size of family households: 36,467 2-persons, 24,706 3-persons, 21,163 4-persons, 7,711 5-persons, 2,252 6-persons, 2,281 7-or-more-persons.
Size of nonfamily households: 29,890 1-person, 5,053 2-persons, 542 3-persons, 113 4-persons.
56,765 married couples with children.
10,818 single-parent households (3,127 men, 7,691 women).
65.4% of residents of Somerset speak English at home.
12.1% of residents speak Spanish at home (55% speak English very well, 24% speak English well, 14% speak English not well, 7% don't speak English at all).
12.0% of residents speak other Indo-European language at home (80% speak English very well, 14% speak English well, 5% speak English not well, 1% don't speak English at all).
8.9% of residents speak Asian or Pacific Island language at home (72% speak English very well, 20% speak English well, 6% speak English not well, 1% don't speak English at all).
1.7% of residents speak other language at home (81% speak English very well, 15% speak English well, 4% speak English not well).
In fiscal year 2004:
Federal Government expenditure: $1,138,636,000 ($3,595 per capita)
Department of Defense expenditure: $61,219,000
Federal direct payments to individuals for retirement and disability: $569,588,000
Federal other direct payments to individuals: $221,738,000
Federal direct payments not to individuals: $1,325,000
Federal grants: $140,306,000
Federal procurement contracts: $92,316,000 ($44,110,000 Department of Defense)
Federal salaries and wages: $113,363,000 ($6,969,000 Department of Defense)
Federal Government direct loans: $221,000
Federal guaranteed/insured loans: $210,399,000
Federal Government insurance: $485,888,000
Population change from April 1, 2000 to July 1, 2005:
Births: 22,824| Here: | 71 per 1000 residents |
| State: | 69 per 1000 residents |
Deaths: 10,816
| Here: | 34 per 1000 residents |
| State: | 44 per 1000 residents |
Net international migration: +11,830
| Here: | +37 per 1000 residents |
| State: | +33 per 1000 residents |
Net internal migration: -918
| Here: | |
| State: |
Total withdrawal of fresh water for public supply: 142.22 millions of gallons per day (6% from ground, 94% from surface)
| Here: | 7.2 |
| State: | 6.8 |
| Here: | 4.0 |
| State: | 3.9 |
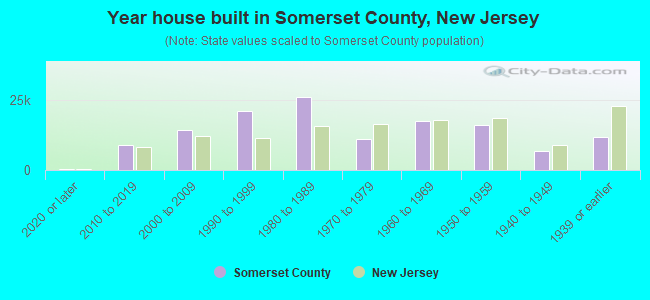
- Year house built in Somerset County, New Jersey
- 8552020 or later
- 7,9772010 to 2019
- 13,3132000 to 2009
- 22,4421990 to 1999
- 27,8781980 to 1989
- 11,4731970 to 1979
- 17,3681960 to 1969
- 12,5631950 to 1959
- 6,3971940 to 1949
- 13,1631939 or earlier
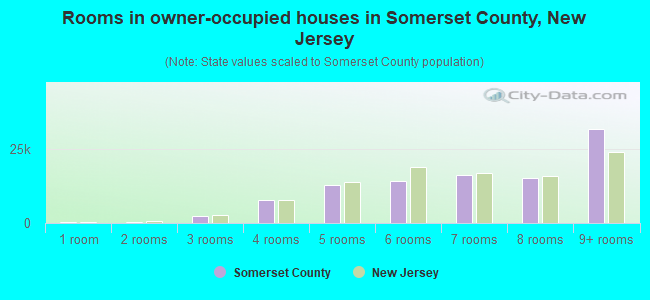
- Rooms in owner-occupied houses in Somerset County, New Jersey
- 4631 room
- 1372 rooms
- 2,3353 rooms
- 8,5914 rooms
- 12,8905 rooms
- 15,8556 rooms
- 14,6897 rooms
- 13,9608 rooms
- 31,4129+ rooms
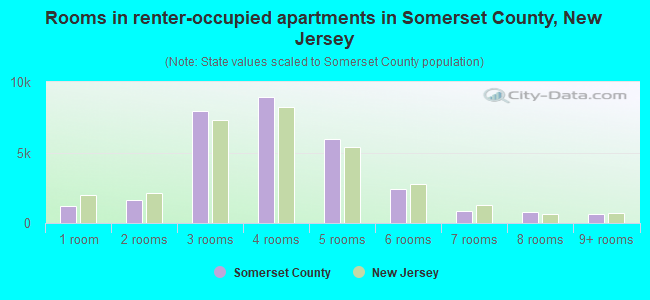
- Rooms in renter-occupied apartments in Somerset County, New Jersey
- 2,2501 room
- 1,6142 rooms
- 6,9273 rooms
- 8,2574 rooms
- 4,7415 rooms
- 2,6696 rooms
- 1,7057 rooms
- 7238 rooms
- 9609+ rooms
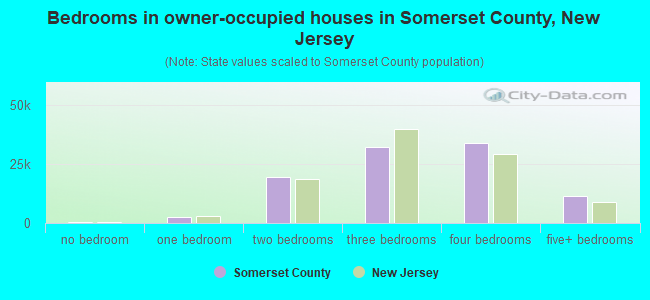
- Bedrooms in owner-occupied houses in Somerset County, New Jersey
- 463no bedroom
- 2,5361 bedroom
- 19,9772 bedrooms
- 33,3553 bedrooms
- 31,5144 bedrooms
- 12,4875+ bedrooms
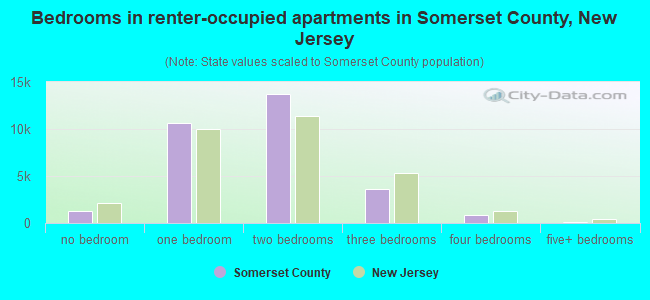
- Bedrooms in renter-occupied apartments in Somerset County, New Jersey
- 2,250no bedroom
- 7,5041 bedroom
- 14,6172 bedrooms
- 4,0413 bedrooms
- 9304 bedrooms
- 5045+ bedrooms
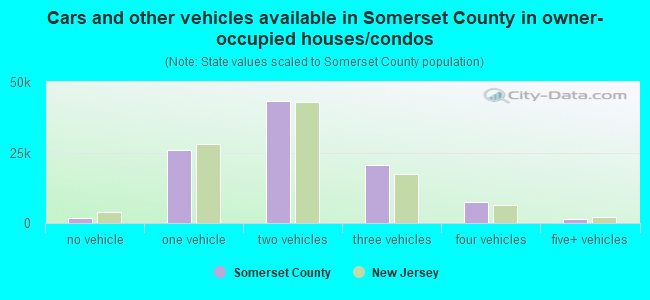
- Cars and other vehicles available in Somerset County in owner-occupied houses/condos
- 1,407no vehicle
- 25,1251 vehicle
- 46,5322 vehicles
- 17,5513 vehicles
- 7,4314 vehicles
- 2,2865+ vehicles
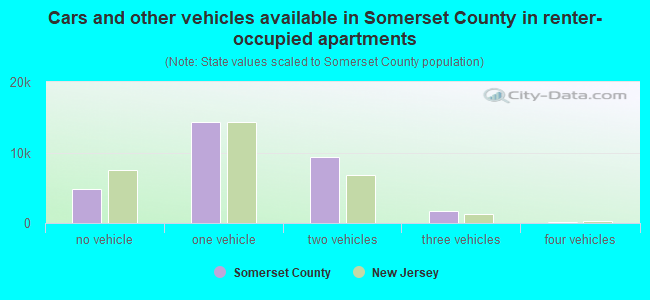
- Cars and other vehicles available in Somerset County in renter-occupied apartments
- 3,441no vehicle
- 14,2991 vehicle
- 9,6942 vehicles
- 1,9533 vehicles
- 4594 vehicles
- 05+ vehicles
90.1% of Somerset County residents lived in the same house 1 years ago.
Out of people who lived in different houses, 34% lived in this county.
Out of people who lived in different counties, 68% lived in New Jersey.
| Somerset County: | 90.1% |
| State average: | 90.4% |
Place of birth for U.S.-born residents:
- This state: 178,086
- Other state: 72,043
- Northeast: 50,653
- Midwest: 5,538
- South: 12,595
- West: 3,257
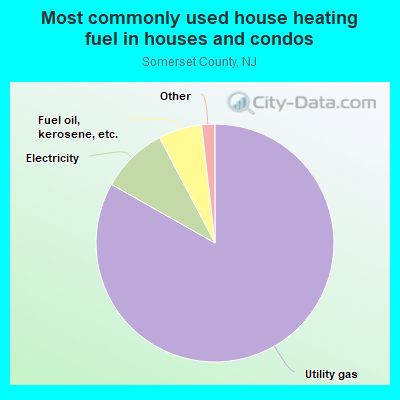
- 84.6%Utility gas
- 8.8%Electricity
- 4.2%Fuel oil, kerosene, etc.
- 2.0%Bottled, tank, or LP gas
- 0.2%No fuel used
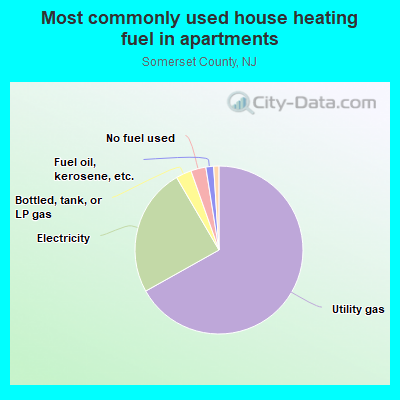
- 66.4%Utility gas
- 28.1%Electricity
- 2.4%Fuel oil, kerosene, etc.
- 1.0%Bottled, tank, or LP gas
- 1.0%No fuel used
- 0.8%Other fuel
- 0.2%Solar energy
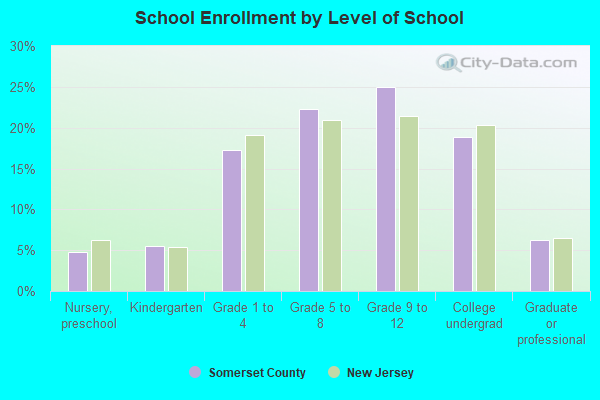
Private vs. public school enrollment:
| Here: | 12.9% |
| New Jersey: | 12.3% |
| Here: | 12.7% |
| New Jersey: | 13.1% |
| Here: | 34.0% |
| New Jersey: | 33.2% |

Somerset County government finances - Expenditure in 2018:
- Assistance and Subsidies - Public Welfare, Federal Categorical Assistance Programs: $3,874,000
Public Welfare, Federal Categorical Assistance Programs: $3,627,000
- Bond Funds - Cash and Securities: $19,199,000
Cash and Securities: $18,559,000
- Charges - Higher Education - Other: $22,224,000
Other: $5,058,000
Other: $4,691,000
Higher Education Auxiliary Enterprises: $1,842,000
Higher Education - Other: $1,097,000
Elementary and Secondary Education School Lunch: $87,000
Elementary and Secondary Education School Lunch: $87,000
Higher Education Auxiliary Enterprises: $22,000
Elementary and Secondary Education - Other: $16,000
Elementary and Secondary Education - Other: $15,000
- Construction - General - Other: $18,229,000
General - Other: $11,719,000
Elementary and Secondary Education: $2,830,000
Elementary and Secondary Education: $1,819,000
Other Higher Education: $1,798,000
Other Higher Education: $1,470,000
- Current Operations - General - Other: $61,755,000
Other Higher Education: $58,410,000
General - Other: $55,568,000
Other Higher Education: $55,233,000
Health - Other: $34,879,000
Health - Other: $31,384,000
Elementary and Secondary Education: $16,431,000
Elementary and Secondary Education: $16,178,000
Correctional Institutions: $13,619,000
Correctional Institutions: $12,254,000
Regular Highways: $11,032,000
Regular Highways: $9,927,000
Parks and Recreation: $8,042,000
Parks and Recreation: $7,237,000
Higher Education Auxiliary Enterprises: $2,980,000
Higher Education Auxiliary Enterprises: $2,742,000
Central Staff Services: $2,018,000
Central Staff Services: $1,816,000
- Federal Intergovernmental - Education: $3,131,000
Education: $1,064,000
- General - Interest on Debt: $3,562,000
Interest on Debt: $3,418,000
- Intergovernmental to Local - Other - Elementary and Secondary Education: $20,000
Other - Elementary and Secondary Education: $19,000
- Intergovernmental to State - Hospitals: $4,079,000
Hospitals: $2,496,000
Elementary and Secondary Education: $20,000
Elementary and Secondary Education: $20,000
- Local Intergovernmental - Education: $15,493,000
Education: $982,000
- Long Term Debt - Beginning Outstanding - Unspecified Public Purpose: $283,121,000
Outstanding Unspecified Public Purpose: $248,926,000
Beginning Outstanding - Unspecified Public Purpose: $214,630,000
Outstanding Unspecified Public Purpose: $180,334,000
Retired Unspecified Public Purpose: $34,296,000
Retired Unspecified Public Purpose: $34,296,000
Beginning Outstanding - Public Debt for Private Purpose: $13,000,000
Outstanding Nonguaranteed - Industrial Revenue: $12,500,000
Beginning Outstanding - Public Debt for Private Purpose: $12,000,000
Outstanding Nonguaranteed - Industrial Revenue: $11,500,000
Retired Nonguaranteed - Public Debt for Private Purpose: $500,000
Retired Nonguaranteed - Public Debt for Private Purpose: $500,000
- Miscellaneous - General Revenue - Other: $83,399,000
General Revenue - Other: $65,815,000
Donations From Private Sources: $1,979,000
Interest Earnings: $52,000
Interest Earnings: $1,000
- Other Capital Outlay - Other Higher Education: $1,629,000
Other Higher Education: $1,247,000
Elementary and Secondary Education: $427,000
Elementary and Secondary Education: $218,000
- Other Funds - Cash and Securities: $69,946,000
Cash and Securities: $67,615,000
- Short Term Debt Outstanding - Beginning: $101,000
Beginning: $101,000
End of Fiscal Year: $101,000
- Sinking Funds - Cash and Securities: $21,178,000
Cash and Securities: $20,473,000
- State Intergovernmental - Education: $16,205,000
Education: $16,134,000
Other: $15,744,000
Other: $15,675,000
- Tax - Property: $193,251,000
Property: $189,167,000
- Total Salaries and Wages: $48,443,000
: $46,771,000
Somerset County government finances - Revenue in 2018:
- Assistance and Subsidies - Public Welfare, Federal Categorical Assistance Programs: $3,874,000
Public Welfare, Federal Categorical Assistance Programs: $3,627,000
- Bond Funds - Cash and Securities: $19,199,000
Cash and Securities: $18,559,000
- Charges - Higher Education - Other: $22,224,000
Other: $5,058,000
Other: $4,691,000
Higher Education Auxiliary Enterprises: $1,842,000
Higher Education - Other: $1,097,000
Elementary and Secondary Education School Lunch: $87,000
Elementary and Secondary Education School Lunch: $87,000
Higher Education Auxiliary Enterprises: $22,000
Elementary and Secondary Education - Other: $16,000
Elementary and Secondary Education - Other: $15,000
- Construction - General - Other: $18,229,000
General - Other: $11,719,000
Elementary and Secondary Education: $2,830,000
Elementary and Secondary Education: $1,819,000
Other Higher Education: $1,798,000
Other Higher Education: $1,470,000
- Current Operations - General - Other: $61,755,000
Other Higher Education: $58,410,000
General - Other: $55,568,000
Other Higher Education: $55,233,000
Health - Other: $34,879,000
Health - Other: $31,384,000
Elementary and Secondary Education: $16,431,000
Elementary and Secondary Education: $16,178,000
Correctional Institutions: $13,619,000
Correctional Institutions: $12,254,000
Regular Highways: $11,032,000
Regular Highways: $9,927,000
Parks and Recreation: $8,042,000
Parks and Recreation: $7,237,000
Higher Education Auxiliary Enterprises: $2,980,000
Higher Education Auxiliary Enterprises: $2,742,000
Central Staff Services: $2,018,000
Central Staff Services: $1,816,000
- Federal Intergovernmental - Education: $3,131,000
Education: $1,064,000
- General - Interest on Debt: $3,562,000
Interest on Debt: $3,418,000
- Intergovernmental to Local - Other - Elementary and Secondary Education: $20,000
Other - Elementary and Secondary Education: $19,000
- Intergovernmental to State - Hospitals: $4,079,000
Hospitals: $2,496,000
Elementary and Secondary Education: $20,000
Elementary and Secondary Education: $20,000
- Local Intergovernmental - Education: $15,493,000
Education: $982,000
- Long Term Debt - Beginning Outstanding - Unspecified Public Purpose: $283,121,000
Outstanding Unspecified Public Purpose: $248,926,000
Beginning Outstanding - Unspecified Public Purpose: $214,630,000
Outstanding Unspecified Public Purpose: $180,334,000
Retired Unspecified Public Purpose: $34,296,000
Retired Unspecified Public Purpose: $34,296,000
Beginning Outstanding - Public Debt for Private Purpose: $13,000,000
Outstanding Nonguaranteed - Industrial Revenue: $12,500,000
Beginning Outstanding - Public Debt for Private Purpose: $12,000,000
Outstanding Nonguaranteed - Industrial Revenue: $11,500,000
Retired Nonguaranteed - Public Debt for Private Purpose: $500,000
Retired Nonguaranteed - Public Debt for Private Purpose: $500,000
- Miscellaneous - General Revenue - Other: $83,399,000
General Revenue - Other: $65,815,000
Donations From Private Sources: $1,979,000
Interest Earnings: $52,000
Interest Earnings: $1,000
- Other Capital Outlay - Other Higher Education: $1,629,000
Other Higher Education: $1,247,000
Elementary and Secondary Education: $427,000
Elementary and Secondary Education: $218,000
- Other Funds - Cash and Securities: $69,946,000
Cash and Securities: $67,615,000
- Short Term Debt Outstanding - Beginning: $101,000
Beginning: $101,000
End of Fiscal Year: $101,000
- Sinking Funds - Cash and Securities: $21,178,000
Cash and Securities: $20,473,000
- State Intergovernmental - Education: $16,205,000
Education: $16,134,000
Other: $15,744,000
Other: $15,675,000
- Tax - Property: $193,251,000
Property: $189,167,000
- Total Salaries and Wages: $48,443,000
: $46,771,000
Somerset County government finances - Debt in 2018:
- Assistance and Subsidies - Public Welfare, Federal Categorical Assistance Programs: $3,874,000
Public Welfare, Federal Categorical Assistance Programs: $3,627,000
- Bond Funds - Cash and Securities: $19,199,000
Cash and Securities: $18,559,000
- Charges - Higher Education - Other: $22,224,000
Other: $5,058,000
Other: $4,691,000
Higher Education Auxiliary Enterprises: $1,842,000
Higher Education - Other: $1,097,000
Elementary and Secondary Education School Lunch: $87,000
Elementary and Secondary Education School Lunch: $87,000
Higher Education Auxiliary Enterprises: $22,000
Elementary and Secondary Education - Other: $16,000
Elementary and Secondary Education - Other: $15,000
- Construction - General - Other: $18,229,000
General - Other: $11,719,000
Elementary and Secondary Education: $2,830,000
Elementary and Secondary Education: $1,819,000
Other Higher Education: $1,798,000
Other Higher Education: $1,470,000
- Current Operations - General - Other: $61,755,000
Other Higher Education: $58,410,000
General - Other: $55,568,000
Other Higher Education: $55,233,000
Health - Other: $34,879,000
Health - Other: $31,384,000
Elementary and Secondary Education: $16,431,000
Elementary and Secondary Education: $16,178,000
Correctional Institutions: $13,619,000
Correctional Institutions: $12,254,000
Regular Highways: $11,032,000
Regular Highways: $9,927,000
Parks and Recreation: $8,042,000
Parks and Recreation: $7,237,000
Higher Education Auxiliary Enterprises: $2,980,000
Higher Education Auxiliary Enterprises: $2,742,000
Central Staff Services: $2,018,000
Central Staff Services: $1,816,000
- Federal Intergovernmental - Education: $3,131,000
Education: $1,064,000
- General - Interest on Debt: $3,562,000
Interest on Debt: $3,418,000
- Intergovernmental to Local - Other - Elementary and Secondary Education: $20,000
Other - Elementary and Secondary Education: $19,000
- Intergovernmental to State - Hospitals: $4,079,000
Hospitals: $2,496,000
Elementary and Secondary Education: $20,000
Elementary and Secondary Education: $20,000
- Local Intergovernmental - Education: $15,493,000
Education: $982,000
- Long Term Debt - Beginning Outstanding - Unspecified Public Purpose: $283,121,000
Outstanding Unspecified Public Purpose: $248,926,000
Beginning Outstanding - Unspecified Public Purpose: $214,630,000
Outstanding Unspecified Public Purpose: $180,334,000
Retired Unspecified Public Purpose: $34,296,000
Retired Unspecified Public Purpose: $34,296,000
Beginning Outstanding - Public Debt for Private Purpose: $13,000,000
Outstanding Nonguaranteed - Industrial Revenue: $12,500,000
Beginning Outstanding - Public Debt for Private Purpose: $12,000,000
Outstanding Nonguaranteed - Industrial Revenue: $11,500,000
Retired Nonguaranteed - Public Debt for Private Purpose: $500,000
Retired Nonguaranteed - Public Debt for Private Purpose: $500,000
- Miscellaneous - General Revenue - Other: $83,399,000
General Revenue - Other: $65,815,000
Donations From Private Sources: $1,979,000
Interest Earnings: $52,000
Interest Earnings: $1,000
- Other Capital Outlay - Other Higher Education: $1,629,000
Other Higher Education: $1,247,000
Elementary and Secondary Education: $427,000
Elementary and Secondary Education: $218,000
- Other Funds - Cash and Securities: $69,946,000
Cash and Securities: $67,615,000
- Short Term Debt Outstanding - Beginning: $101,000
Beginning: $101,000
End of Fiscal Year: $101,000
- Sinking Funds - Cash and Securities: $21,178,000
Cash and Securities: $20,473,000
- State Intergovernmental - Education: $16,205,000
Education: $16,134,000
Other: $15,744,000
Other: $15,675,000
- Tax - Property: $193,251,000
Property: $189,167,000
- Total Salaries and Wages: $48,443,000
: $46,771,000
Somerset County government finances - Cash and Securities in 2018:
- Assistance and Subsidies - Public Welfare, Federal Categorical Assistance Programs: $3,874,000
Public Welfare, Federal Categorical Assistance Programs: $3,627,000
- Bond Funds - Cash and Securities: $19,199,000
Cash and Securities: $18,559,000
- Charges - Higher Education - Other: $22,224,000
Other: $5,058,000
Other: $4,691,000
Higher Education Auxiliary Enterprises: $1,842,000
Higher Education - Other: $1,097,000
Elementary and Secondary Education School Lunch: $87,000
Elementary and Secondary Education School Lunch: $87,000
Higher Education Auxiliary Enterprises: $22,000
Elementary and Secondary Education - Other: $16,000
Elementary and Secondary Education - Other: $15,000
- Construction - General - Other: $18,229,000
General - Other: $11,719,000
Elementary and Secondary Education: $2,830,000
Elementary and Secondary Education: $1,819,000
Other Higher Education: $1,798,000
Other Higher Education: $1,470,000
- Current Operations - General - Other: $61,755,000
Other Higher Education: $58,410,000
General - Other: $55,568,000
Other Higher Education: $55,233,000
Health - Other: $34,879,000
Health - Other: $31,384,000
Elementary and Secondary Education: $16,431,000
Elementary and Secondary Education: $16,178,000
Correctional Institutions: $13,619,000
Correctional Institutions: $12,254,000
Regular Highways: $11,032,000
Regular Highways: $9,927,000
Parks and Recreation: $8,042,000
Parks and Recreation: $7,237,000
Higher Education Auxiliary Enterprises: $2,980,000
Higher Education Auxiliary Enterprises: $2,742,000
Central Staff Services: $2,018,000
Central Staff Services: $1,816,000
- Federal Intergovernmental - Education: $3,131,000
Education: $1,064,000
- General - Interest on Debt: $3,562,000
Interest on Debt: $3,418,000
- Intergovernmental to Local - Other - Elementary and Secondary Education: $20,000
Other - Elementary and Secondary Education: $19,000
- Intergovernmental to State - Hospitals: $4,079,000
Hospitals: $2,496,000
Elementary and Secondary Education: $20,000
Elementary and Secondary Education: $20,000
- Local Intergovernmental - Education: $15,493,000
Education: $982,000
- Long Term Debt - Beginning Outstanding - Unspecified Public Purpose: $283,121,000
Outstanding Unspecified Public Purpose: $248,926,000
Beginning Outstanding - Unspecified Public Purpose: $214,630,000
Outstanding Unspecified Public Purpose: $180,334,000
Retired Unspecified Public Purpose: $34,296,000
Retired Unspecified Public Purpose: $34,296,000
Beginning Outstanding - Public Debt for Private Purpose: $13,000,000
Outstanding Nonguaranteed - Industrial Revenue: $12,500,000
Beginning Outstanding - Public Debt for Private Purpose: $12,000,000
Outstanding Nonguaranteed - Industrial Revenue: $11,500,000
Retired Nonguaranteed - Public Debt for Private Purpose: $500,000
Retired Nonguaranteed - Public Debt for Private Purpose: $500,000
- Miscellaneous - General Revenue - Other: $83,399,000
General Revenue - Other: $65,815,000
Donations From Private Sources: $1,979,000
Interest Earnings: $52,000
Interest Earnings: $1,000
- Other Capital Outlay - Other Higher Education: $1,629,000
Other Higher Education: $1,247,000
Elementary and Secondary Education: $427,000
Elementary and Secondary Education: $218,000
- Other Funds - Cash and Securities: $69,946,000
Cash and Securities: $67,615,000
- Short Term Debt Outstanding - Beginning: $101,000
Beginning: $101,000
End of Fiscal Year: $101,000
- Sinking Funds - Cash and Securities: $21,178,000
Cash and Securities: $20,473,000
- State Intergovernmental - Education: $16,205,000
Education: $16,134,000
Other: $15,744,000
Other: $15,675,000
- Tax - Property: $193,251,000
Property: $189,167,000
- Total Salaries and Wages: $48,443,000
: $46,771,000
Supplemental Security Income (SSI) in 2006:
- Total number of recipients: 2,370
- Number of aged recipients: 820
- Number of blind and disabled recipients: 1,550
- Number of recipients under 18: 270
- Number of recipients between 18 and 64: 1,059
- Number of recipients older than 64: 1,041
- Number of recipients also receiving OASDI: 649
- Amount of payments (thousands of dollars): 1,035
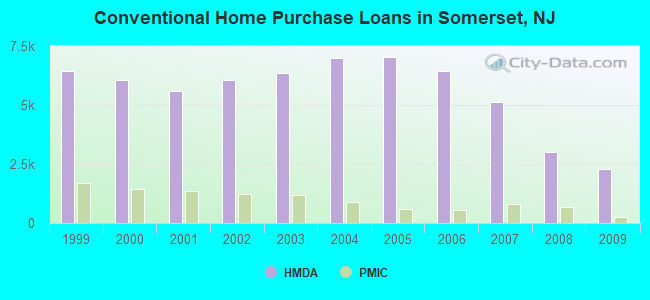
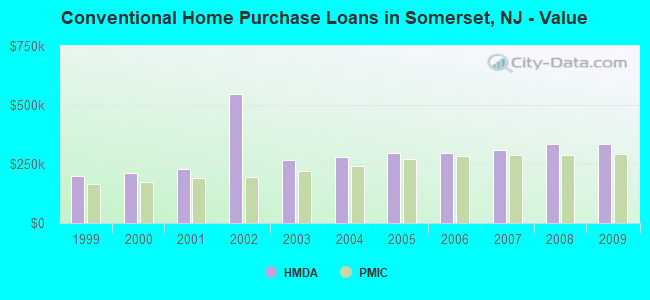
| Home Mortgage Disclosure Act Aggregated Statistics For Year 2009 (Based on 62 full tracts) | ||||||||||||||
| A) FHA, FSA/RHS & VA Home Purchase Loans | B) Conventional Home Purchase Loans | C) Refinancings | D) Home Improvement Loans | E) Loans on Dwellings For 5+ Families | F) Non-occupant Loans on < 5 Family Dwellings (A B C & D) | G) Loans On Manufactured Home Dwelling (A B C & D) | ||||||||
|---|---|---|---|---|---|---|---|---|---|---|---|---|---|---|
| Number | Average Value | Number | Average Value | Number | Average Value | Number | Average Value | Number | Average Value | Number | Average Value | Number | Average Value | |
| LOANS ORIGINATED | 1,003 | $272,620 | 2,268 | $335,496 | 10,469 | $304,730 | 392 | $155,931 | 9 | $2,668,000 | 215 | $248,656 | 4 | $115,500 |
| APPLICATIONS APPROVED, NOT ACCEPTED | 71 | $261,817 | 267 | $378,610 | 930 | $303,103 | 64 | $110,531 | 2 | $712,000 | 24 | $210,708 | 1 | $137,000 |
| APPLICATIONS DENIED | 152 | $265,579 | 323 | $336,409 | 3,122 | $310,689 | 240 | $96,738 | 2 | $12,000 | 133 | $201,331 | 14 | $105,643 |
| APPLICATIONS WITHDRAWN | 112 | $280,411 | 334 | $348,147 | 2,048 | $300,617 | 84 | $150,548 | 2 | $299,500 | 61 | $207,443 | 1 | $235,000 |
| FILES CLOSED FOR INCOMPLETENESS | 53 | $258,189 | 73 | $370,164 | 493 | $310,114 | 26 | $140,115 | 0 | $0 | 12 | $258,083 | 0 | $0 |
| Private Mortgage Insurance Companies Aggregated Statistics For Year 2009 (Based on 59 full tracts) | ||||||
| A) Conventional Home Purchase Loans | B) Refinancings | C) Non-occupant Loans on < 5 Family Dwellings (A & B) | ||||
|---|---|---|---|---|---|---|
| Number | Average Value | Number | Average Value | Number | Average Value | |
| LOANS ORIGINATED | 260 | $292,181 | 145 | $320,897 | 0 | $0 |
| APPLICATIONS APPROVED, NOT ACCEPTED | 81 | $301,074 | 89 | $331,090 | 2 | $203,500 |
| APPLICATIONS DENIED | 47 | $313,106 | 43 | $304,465 | 2 | $136,000 |
| APPLICATIONS WITHDRAWN | 15 | $293,400 | 29 | $341,069 | 0 | $0 |
| FILES CLOSED FOR INCOMPLETENESS | 12 | $427,583 | 8 | $355,375 | 0 | $0 |
| Most common first names in Somerset County, NJ among deceased individuals | ||
| Name | Count | Lived (average) |
|---|---|---|
| John | 1,239 | 73.8 years |
| Mary | 1,151 | 80.2 years |
| Joseph | 876 | 73.7 years |
| William | 615 | 73.0 years |
| Anna | 602 | 81.6 years |
| Helen | 510 | 80.4 years |
| George | 469 | 73.2 years |
| Charles | 423 | 73.5 years |
| Margaret | 405 | 79.5 years |
| Frank | 401 | 75.5 years |
| Most common last names in Somerset County, NJ among deceased individuals | ||
| Last name | Count | Lived (average) |
|---|---|---|
| Smith | 171 | 75.6 years |
| Johnson | 100 | 72.2 years |
| Jones | 93 | 71.9 years |
| Miller | 81 | 74.2 years |
| Brown | 78 | 72.6 years |
| Williams | 77 | 71.4 years |
| Davis | 54 | 71.9 years |
| Moore | 51 | 74.9 years |
| Thompson | 51 | 74.9 years |
| Hall | 50 | 76.1 years |
| Businesses in Somerset County, NJ | ||||
| Name | Count | Name | Count | |
|---|---|---|---|---|
| 7-Eleven | 6 | J. Jill | 1 | |
| A&P | 1 | J.Crew | 1 | |
| ALDO | 1 | JoS. A. Bank | 1 | |
| AT&T | 6 | Jones New York | 6 | |
| Abercrombie & Fitch | 1 | Journeys | 1 | |
| Abercrombie Kids | 1 | Justice | 2 | |
| Advance Auto Parts | 2 | KFC | 5 | |
| Aeropostale | 1 | Kmart | 3 | |
| American Eagle Outfitters | 1 | Kohl's | 2 | |
| Ann Taylor | 2 | Kroger | 1 | |
| Apple Store | 1 | La Quinta | 1 | |
| Applebee's | 2 | La-Z-Boy | 1 | |
| Arby's | 2 | Lane Bryant | 1 | |
| Audi | 1 | Lane Furniture | 1 | |
| AutoZone | 3 | LensCrafters | 2 | |
| Avenue | 1 | Lowe's | 1 | |
| BMW | 1 | Macy's | 1 | |
| Baja Fresh Mexican Grill | 1 | Marriott | 5 | |
| Banana Republic | 1 | Marshalls | 2 | |
| Barnes & Noble | 1 | MasterBrand Cabinets | 24 | |
| Baskin-Robbins | 5 | McDonald's | 8 | |
| Bath & Body Works | 1 | Men's Wearhouse | 2 | |
| Bed Bath & Beyond | 2 | Motherhood Maternity | 2 | |
| Blockbuster | 3 | New Balance | 6 | |
| Brooks Brothers | 1 | New York & Co | 1 | |
| Brookstone | 1 | Nike | 7 | |
| Budget Car Rental | 1 | Nissan | 2 | |
| Buffalo Wild Wings | 1 | Office Depot | 1 | |
| Burger King | 8 | Old Country Buffet | 1 | |
| Buybuy BABY | 1 | Old Navy | 2 | |
| CVS | 5 | Olive Garden | 1 | |
| Cache | 1 | Pac Sun | 1 | |
| Casual Male XL | 1 | Panera Bread | 3 | |
| Chevrolet | 2 | Payless | 5 | |
| Chico's | 1 | Penske | 4 | |
| Chipotle | 1 | PetSmart | 2 | |
| Clarks | 1 | Pier 1 Imports | 2 | |
| Coldwater Creek | 1 | Pizza Hut | 3 | |
| Costco | 1 | Pottery Barn | 1 | |
| Crate & Barrel | 1 | Quiznos | 3 | |
| Curves | 1 | RadioShack | 7 | |
| DHL | 1 | Raymour & Flanigan | 2 | |
| Dairy Queen | 3 | Red Lobster | 1 | |
| Days Inn | 2 | Rite Aid | 9 | |
| Decora Cabinetry | 2 | Ruby Tuesday | 2 | |
| Domino's Pizza | 3 | Sears | 5 | |
| DressBarn | 3 | Sephora | 1 | |
| Dressbarn | 3 | Skechers USA | 1 | |
| Dunkin Donuts | 27 | Soma Intimates | 1 | |
| Econo Lodge | 1 | Spencer Gifts | 1 | |
| Eddie Bauer | 1 | Sprint Nextel | 2 | |
| Express | 1 | Staples | 3 | |
| Extended Stay America | 1 | Starbucks | 7 | |
| Famous Footwear | 1 | Stop & Shop | 6 | |
| Fashion Bug | 1 | Subaru | 1 | |
| FedEx | 71 | Subway | 20 | |
| Foot Locker | 3 | Super 8 | 1 | |
| Ford | 2 | T-Mobile | 12 | |
| Forever 21 | 1 | T.G.I. Driday's | 2 | |
| GNC | 9 | T.J.Maxx | 2 | |
| GameStop | 6 | Taco Bell | 2 | |
| Gap | 1 | Talbots | 1 | |
| Goodwill | 3 | Target | 2 | |
| Gymboree | 1 | The Cheesecake Factory | 1 | |
| H&R Block | 6 | The Limited | 1 | |
| Haagen-Dazs | 1 | The Room Place | 2 | |
| Harmon Face Values | 1 | Toys"R"Us | 3 | |
| Haworth | 1 | True Value | 2 | |
| Hilton | 4 | U-Haul | 8 | |
| Holiday Inn | 6 | UPS | 79 | |
| Hollister Co. | 1 | Verizon Wireless | 4 | |
| Home Depot | 3 | Victoria's Secret | 1 | |
| Honda | 2 | Volkswagen | 2 | |
| Hot Topic | 1 | Walgreens | 6 | |
| Houlihan's | 1 | Walmart | 3 | |
| Howard Johnson | 1 | Wendy's | 7 | |
| Hyatt | 2 | Wet Seal | 1 | |
| Hyundai | 1 | White Castle | 1 | |
| IHOP | 4 | YMCA | 6 | |
Somerset County on our top lists:
- #12 on the list of "Top 101 counties with the highest percentage of residents that visited a dentist within the past year"
- #16 on the list of "Top 101 counties with the best general health status score of residents (1-5), 3 years of data"
- #16 on the list of "Top 101 counties with the largest decrease in the number of births per 1000 residents 2000-2006 to 2007-2013 (pop 50,000+)"
- #27 on the list of "Top 101 counties with the lowest percentage of residents that keep firearms around their homes"
- #34 on the list of "Top 101 counties with the largest number of children under 18 without health insurance coverage in 2000 (pop. 50,000+)"
- #36 on the list of "Top 101 counties with the largest number of people without health insurance coverage in 2000 (pop. 50,000+)"
- #41 on the list of "Top 101 counties with the highest surface withdrawal of fresh water for public supply (pop. 50,000+)"
- #42 on the list of "Top 101 counties with the highest surface withdrawal of fresh water for public supply"
- #57 on the list of "Top 101 counties with the highest total withdrawal of fresh water for public supply (pop. 50,000+)"
- #58 on the list of "Top 101 counties with the highest total withdrawal of fresh water for public supply"
- #59 on the list of "Top 101 counties with the lowest average weight of females"
- #65 on the list of "Top 101 counties with the lowest percentage of residents that smoked 100+ cigarettes in their lives"