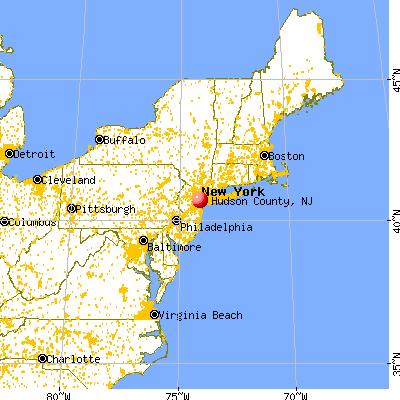
Hudson County, New Jersey (NJ)
County owner-occupied free and clear houses and condos in 2010: 19,278
County owner-occupied houses and condos in 2000: 70,658
Renter-occupied apartments: 167,374 (it was 159,888 in 2000)
| % of renters here: | 69% |
| State: | 35% |
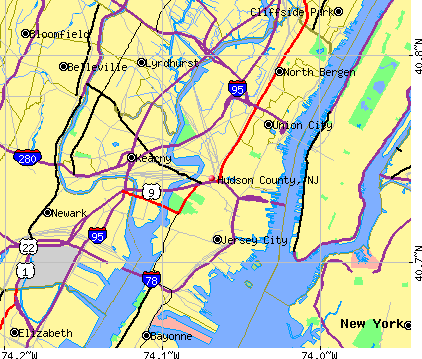
Land area: 47 sq. mi.
Water area: 15.7 sq. mi.
Population density: 15065 people per square mile (very high).
Industries providing employment: Educational, health and social services (19.2%), Professional, scientific, management, administrative, and waste management services (18.3%), Finance, insurance, real estate, and rental and leasing (13.6%), Retail trade (10.1%).
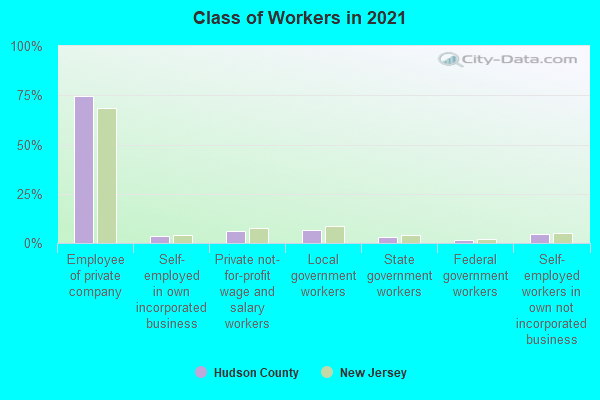
Type of workers:
- Private wage or salary: 84%
- Government: 11%
- Self-employed, not incorporated: 4%
- Unpaid family work: 0%
- OSM Map
- General Map
- Google Map
- MSN Map

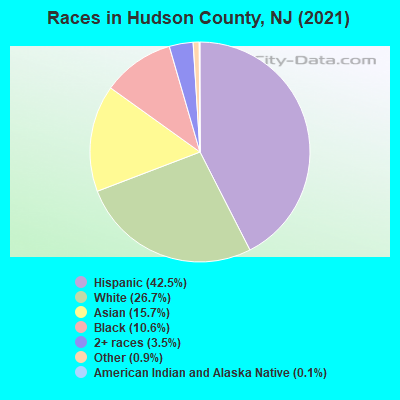
- 298,08142.4%Hispanic or Latino
- 188,06426.7%White Non-Hispanic Alone
- 110,61315.7%Asian alone
- 75,29410.7%Black Non-Hispanic Alone
- 23,2183.3%Two or more races
- 6,8461.0%Some other race alone
- 1,1220.2%American Indian and Alaska Native alone
- 1280.02%Native Hawaiian and Other
Pacific Islander alone
| Median resident age: | 35.9 years |
| New Jersey median age: | 40.4 years |
| Males: 351,645 | |
| Females: 351,721 |

 | Hudson County has to be the worst county in all of America to drive in (45 replies) |
| New Jersey Walkable towns (86 replies) |
| Is New Jersey considered a Mid-Atlantic State? (107 replies) |
| It's been 9 months. Where is NJ Recreational Marijuana? (245 replies) |
| The 3 regions of NJ (broken up into 8 total sub-regions) (33 replies) |
| Real estate-Covid 19-Early numbers (81 replies) |
| Hudson County: | 2.0 people |
| New Jersey: | 3 people |
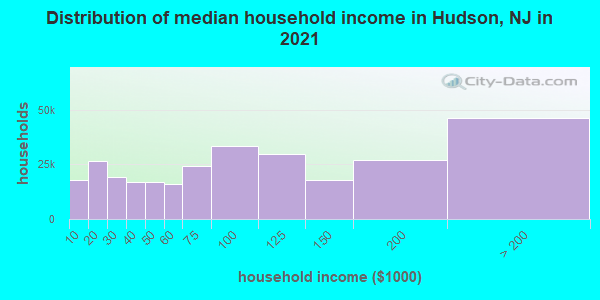
Estimated median household income in 2022: $83,056 ($40,293 in 1999)
| This county: | $83,056 |
| New Jersey: | $96,346 |
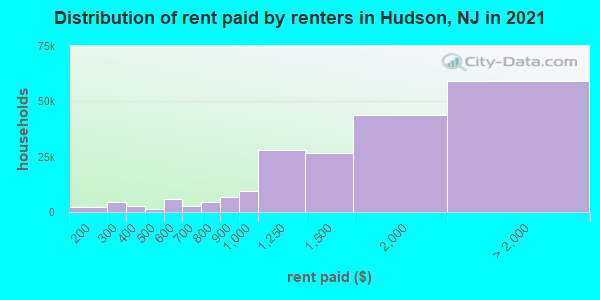
Median contract rent in 2022 for apartments: $1,619 (lower quartile is $1,091, upper quartile is $2,347)
| This county: | $1619 |
| State: | $1399 |
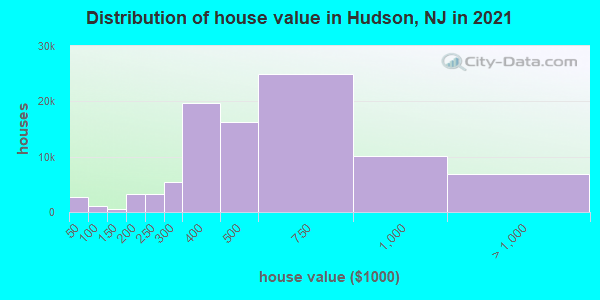
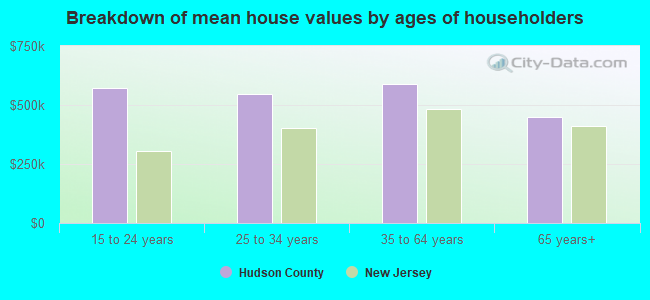
Estimated median house or condo value in 2022: $526,200 (it was $162,800 in 2000)
| Hudson: | $526,200 |
| New Jersey: | $428,900 |
Mean price in 2022:
Median monthly housing costs for homes and condos with a mortgage: $2,925Detached houses: $572,994
Here: $572,994 State: $537,591 Townhouses or other attached units: $722,635
Here: $722,635 State: $381,113 In 2-unit structures: $538,672
Here: $538,672 State: $444,476 In 3-to-4-unit structures: $735,837
Here: $735,837 State: $457,463 In 5-or-more-unit structures: $615,734
Here: $615,734 State: $368,745 Mobile homes: $412,613
Here: $412,613 State: $119,788
Median monthly housing costs for units without a mortgage: $1,168
Institutionalized population: 5,036
Crime in 2020 (reported by the sheriff's office or county police, not the county total):
- Murders: 0
- Rapes: 0
- Robberies: 0
- Assaults: 0
- Burglaries: 0
- Thefts: 0
- Auto thefts: 0
Crime in 2019 (reported by the sheriff's office or county police, not the county total):
- Murders: 0
- Rapes: 0
- Robberies: 0
- Assaults: 0
- Burglaries: 0
- Thefts: 0
- Auto thefts: 0
Health of residents in Hudson County based on CDC Behavioral Risk Factor Surveillance System Survey Questionnaires from 2003 to 2012:
General health status score of residents in this county from 1 (poor) to 5 (excellent) is 3.3. This is worse than average.66.4% of residents exercised in the past month. This is less than average.
41.2% of residents smoked 100+ cigarettes in their lives. This is about average.
71.8% of adult residents drank alcohol in the past 30 days. This is about average.
66.6% of residents visited a dentist within the past year. This is less than average.
Average weight of males is 188 pounds. This is less than average.
Average weight of females is 160 pounds. This is about average.
4.8% of residents keep firearms around their homes. This is less than average.
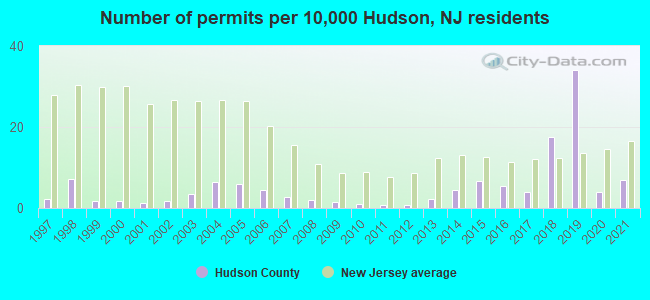
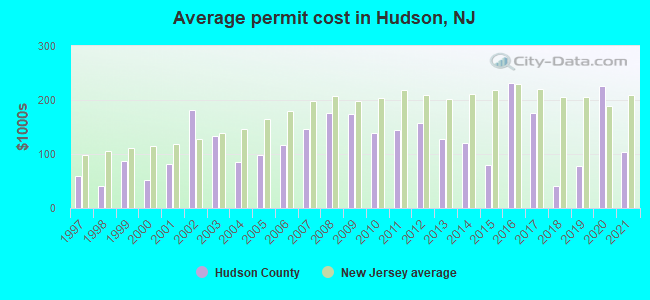
Single-family new house construction building permits:
- 2022: 355 buildings, average cost: $149,400
- 2021: 416 buildings, average cost: $102,600
- 2020: 235 buildings, average cost: $225,800
- 2019: 2070 buildings, average cost: $77,300
- 2018: 1065 buildings, average cost: $40,000
- 2017: 243 buildings, average cost: $176,100
- 2016: 338 buildings, average cost: $231,800
- 2015: 400 buildings, average cost: $79,800
- 2014: 272 buildings, average cost: $120,600
- 2013: 130 buildings, average cost: $127,700
- 2012: 46 buildings, average cost: $158,000
- 2011: 45 buildings, average cost: $145,300
- 2010: 55 buildings, average cost: $138,400
- 2009: 84 buildings, average cost: $174,400
- 2008: 115 buildings, average cost: $176,200
- 2007: 161 buildings, average cost: $146,800
- 2006: 277 buildings, average cost: $116,400
- 2005: 361 buildings, average cost: $98,500
- 2004: 386 buildings, average cost: $84,700
- 2003: 215 buildings, average cost: $133,700
- 2002: 99 buildings, average cost: $181,100
- 2001: 68 buildings, average cost: $81,700
- 2000: 98 buildings, average cost: $52,100
- 1999: 112 buildings, average cost: $86,900
- 1998: 431 buildings, average cost: $41,000
- 1997: 136 buildings, average cost: $60,100
Median real estate property taxes paid for housing units with mortgages in 2022: $8,911 (1.6%)
Median real estate property taxes paid for housing units with no mortgage in 2022: $8,565 (1.8%)
| Hudson County: | 14.4% |
| New Jersey: | 9.7% |
Median age of residents in 2022: 35.9 years old
(Males: 35.4 years old, Females: 36.6 years old)
(Median age for: White residents: 37.6 years old, Black residents: 33.5 years old, American Indian residents: 38.5 years old, Asian residents: 34.5 years old, Hispanic or Latino residents: 36.8 years old, Other race residents: 36.0 years old)
Area name: Jersey City, NJ HUD Metro FMR Area
Fair market rent in 2006 for a 1-bedroom apartment in Hudson County is $934 a month.
Fair market rent for a 2-bedroom apartment is $1090 a month.
Fair market rent for a 3-bedroom apartment is $1321 a month.
Cities in this county include: Jersey City, Union City, Bayonne, West New York, Kearny, Hoboken, Secaucus, Harrison, Guttenberg, East Newark.
2023 air pollution in Hudson County:
Carbon Monoxide: 0.511 ppm (standard limit: 9 ppm). Significanly above U.S. average.
Nitrogen Dioxide: 0.02 ppm (standard limit: 0.053 ppm). Significanly above U.S. average.
Ozone (1-hour): 0.026 ppm (standard limit: 0.12 ppm). Below U.S. average.
Particulate Matter (PM2.5) Annual: 8.5 µg/m3(standard limit: 15.0 µg/m3). Near U.S. average.
Sulfur Oxides Annual: 0.001 ppm (standard limit: 0.03 ppm). Near U.S. average.
Neighboring counties: Armstrong County, Pennsylvania  , Salt Lake County, Utah , Lebanon County, Pennsylvania , Johnson County, Nebraska , Morrow County, Ohio , Phelps County, Nebraska , Richland County, Ohio .
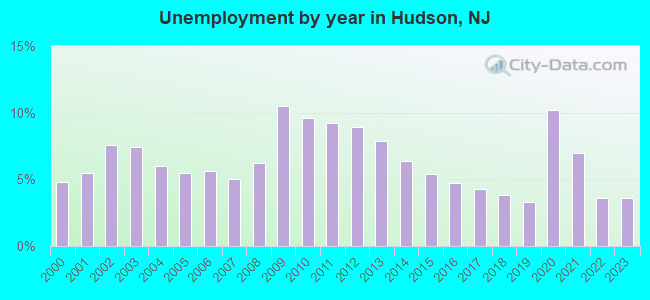
| Here: | 4.5% |
| New Jersey: | 4.5% |
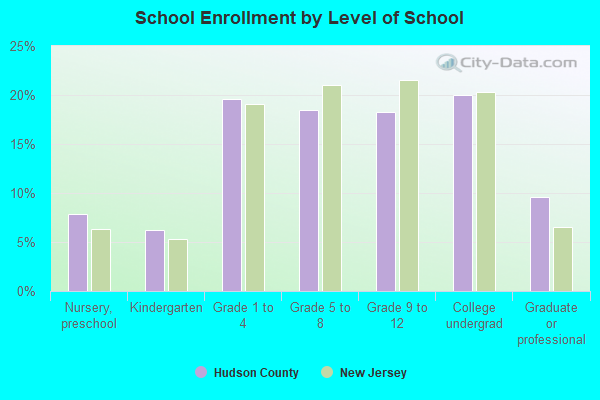
Current college students: 41,431
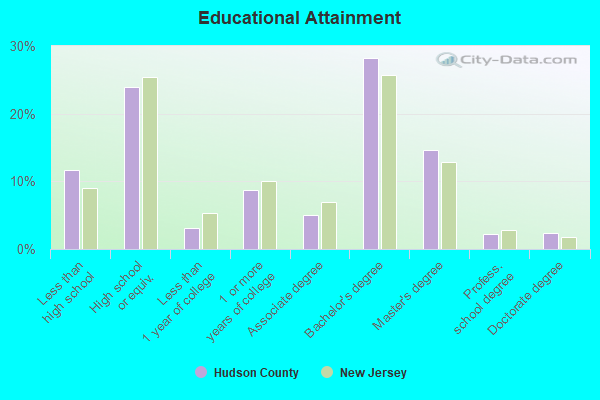
People 25 years of age or older with a high school degree or higher: 86.7%
People 25 years of age or older with a bachelor's degree or higher: 47.9%
Number of foreign born residents: 293,588 (51.9% naturalized citizens)
| Hudson County: | 41.7% |
| Whole state: | 23.5% |
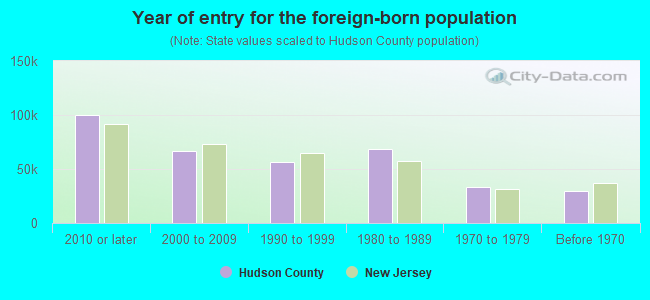
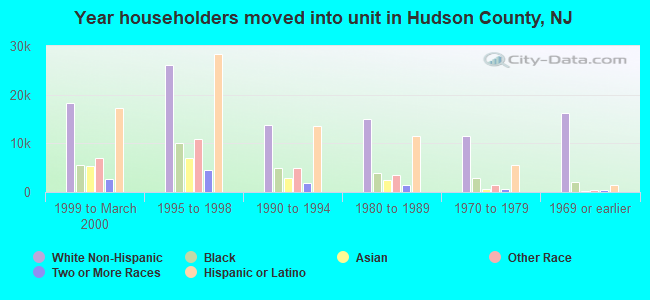
- Year of entry for the foreign-born population
- 117,0382010 or later
- 63,5792000 to 2009
- 49,3901990 to 1999
- 68,7561980 to 1989
- 33,7461970 to 1979
- 29,513Before 1970
Mean travel time to work (commute): # minutes
Percentage of county residents living and working in this county: 73.5%

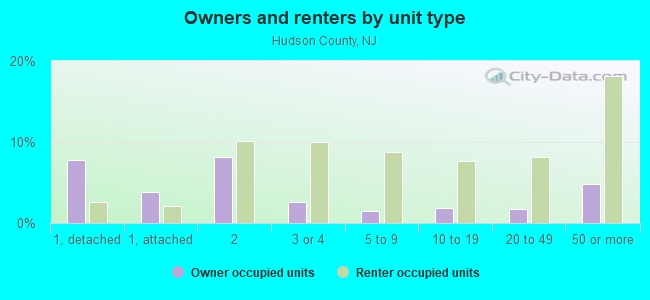
Housing units in structures:
- One, detached: 31,933
- One, attached: 20,460
- Two: 59,759
- 3 or 4: 39,505
- 5 to 9: 34,387
- 10 to 19: 26,088
- 20 to 49: 30,748
- 50 or more: 76,584
- Mobile homes: 150
Housing units in Hudson County with a mortgage: 63,644 (5,202 second mortgage, 248 home equity loan, 4,250 both second mortgage and home equity loan)
Houses without a mortgage: 846
| Here: | 6.9% with mortgage |
| State: | 95.9% with mortgage |
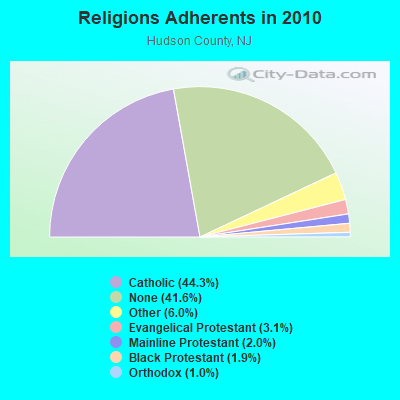
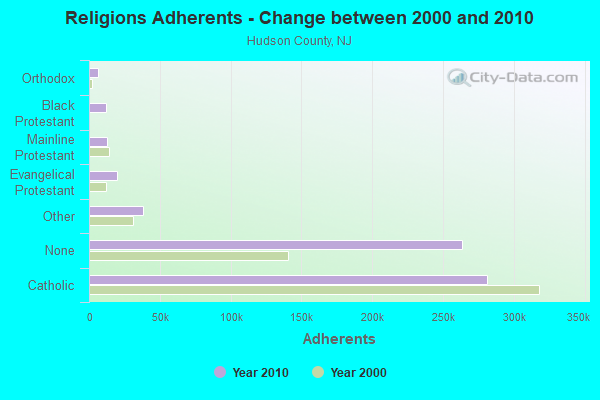
Religion statistics for Hudson County
| Religion | Adherents | Congregations |
|---|---|---|
| Catholic | 280,930 | 53 |
| Other | 38,322 | 63 |
| Evangelical Protestant | 19,890 | 133 |
| Mainline Protestant | 12,853 | 93 |
| Black Protestant | 12,308 | 26 |
| Orthodox | 6,318 | 12 |
| None | 263,645 | - |
Source: Clifford Grammich, Kirk Hadaway, Richard Houseal, Dale E.Jones, Alexei Krindatch, Richie Stanley and Richard H.Taylor. 2012. 2010 U.S.Religion Census: Religious Congregations & Membership Study. Association of Statisticians of American Religious Bodies. Jones, Dale E., et al. 2002. Congregations and Membership in the United States 2000. Nashville, TN: Glenmary Research Center.
Food Environment Statistics:
| Hudson County: | 4.34 / 10,000 pop. |
| State: | 2.90 / 10,000 pop. |
| Here: | 0.03 / 10,000 pop. |
| New Jersey: | 0.06 / 10,000 pop. |
| This county: | 2.03 / 10,000 pop. |
| New Jersey: | 1.76 / 10,000 pop. |
| Hudson County: | 0.49 / 10,000 pop. |
| New Jersey: | 0.81 / 10,000 pop. |
| This county: | 6.23 / 10,000 pop. |
| State: | 7.15 / 10,000 pop. |
| Hudson County: | 7.8% |
| New Jersey: | 8.3% |
| Hudson County: | 22.8% |
| State: | 23.3% |
| Here: | 23.7% |
| State: | 18.0% |
Agriculture in Hudson County:
The value of nursery, greenhouse, floriculture, and sod as a percentage of the total market value of agricultural products sold: 0.00%The value of livestock, poultry, and their products as a percentage of the total market value of agricultural products sold: 0.00%
The percentage of farms operated by a family or individual: 0.00%
Average age of principal farm operators: 0 years
Earthquake activity:
Hudson County-area historical earthquake activity is significantly above New Jersey state average. It is 69% smaller than the overall U.S. average.On 8/23/2011 at 17:51:04, a magnitude 5.8 (5.8 MW, Depth: 3.7 mi, Class: Moderate, Intensity: VI - VII) earthquake occurred 284.8 miles away from Hudson County center
On 10/7/1983 at 10:18:46, a magnitude 5.3 (5.1 MB, 5.3 LG, 5.1 ML) earthquake occurred 222.6 miles away from the county center
On 1/16/1994 at 01:49:16, a magnitude 4.6 (4.6 MB, 4.6 LG, Depth: 3.1 mi, Class: Light, Intensity: IV - V) earthquake occurred 107.3 miles away from the county center
On 4/20/2002 at 10:50:47, a magnitude 5.3 (5.3 ML, Depth: 3.0 mi) earthquake occurred 261.6 miles away from the county center
On 4/20/2002 at 10:50:47, a magnitude 5.2 (5.2 MB, 4.2 MS, 5.2 MW, 5.0 MW) earthquake occurred 259.8 miles away from Hudson County center
On 1/16/1994 at 00:42:43, a magnitude 4.2 (4.2 MB, 4.0 LG, Depth: 3.1 mi) earthquake occurred 105.8 miles away from the county center
Magnitude types: regional Lg-wave magnitude (LG), body-wave magnitude (MB), local magnitude (ML), surface-wave magnitude (MS), moment magnitude (MW)
Most recent natural disasters:
- New Jersey Covid-19 Pandemic, Incident Period: January 20, 2020, Major Disaster (Presidential) Declared DR-4488-NJ: March 25, 2020, FEMA Id: 4488, Natural disaster type: Other
- New Jersey Severe Winter Storm and Snowstorm, Incident Period: January 22, 2016 to January 24, 2016, Major Disaster (Presidential) Declared DR-4264: March 14, 2016, FEMA Id: 4264, Natural disaster type: Snowstorm, Winter Storm
- New Jersey Hurricane Sandy, Incident Period: October 26, 2012 to November 08, 2012, Emergency Declared EM-3354: October 28, 2012, FEMA Id: 3354, Natural disaster type: Hurricane
- New Jersey Hurricane Sandy, Incident Period: October 26, 2012 to November 08, 2012, Major Disaster (Presidential) Declared DR-4086: October 30, 2012, FEMA Id: 4086, Natural disaster type: Hurricane
- New Jersey Hurricane Irene, Incident Period: August 27, 2011 to September 05, 2011, Major Disaster (Presidential) Declared DR-4021: August 31, 2011, FEMA Id: 4021, Natural disaster type: Hurricane
- New Jersey Hurricane Irene, Incident Period: August 26, 2011 to September 05, 2011, Emergency Declared EM-3332: August 27, 2011, FEMA Id: 3332, Natural disaster type: Hurricane
- New Jersey Severe Winter Storm and Snowstorm, Incident Period: December 26, 2010 to December 27, 2010, Major Disaster (Presidential) Declared DR-1954: February 04, 2011, FEMA Id: 1954, Natural disaster type: Snowstorm, Winter Storm
- New Jersey Severe Storms and Inland and Coastal Flooding, Incident Period: April 14, 2007 to April 20, 2007, Major Disaster (Presidential) Declared DR-1694: April 26, 2007, FEMA Id: 1694, Natural disaster type: Storm, Flood
- New Jersey Hurricane Katrina Evacuation, Incident Period: August 29, 2005 to October 01, 2005, Emergency Declared EM-3257: September 19, 2005, FEMA Id: 3257, Natural disaster type: Hurricane
- New Jersey Power Outage, Incident Period: August 14, 2003 to August 16, 2003, Emergency Declared EM-3188: September 23, 2003, FEMA Id: 3188, Natural disaster type: Power Outage
- 11 other natural disasters have been reported since 1953.
The number of natural disasters in Hudson County (21) is greater than the US average (15).
Major Disasters (Presidential) Declared: 11
Emergencies Declared: 10
Causes of natural disasters: Hurricanes: 6, Floods: 4, Snowstorms: 3, Storms: 3, Blizzards: 2, Heavy Rains: 2, Water Shortages: 2, Winter Storms: 2, Power Outage: 1, Other: 3 (Note: some incidents may be assigned to more than one category).
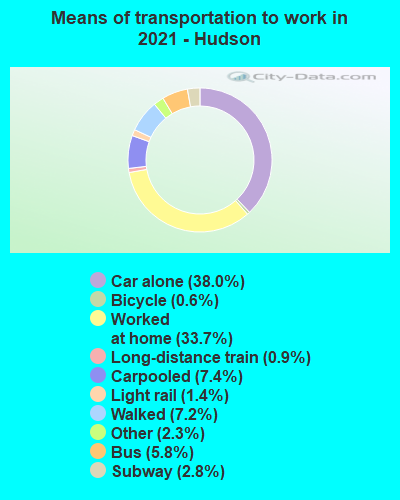
Means of transportation to work:
- Drove a car alone: 137,456 (42.3%)
- Carpooled: 24,071 (7.4%)
- Bus: 23,708 (7.3%)
- Subway or elevated rail: 14,088 (4.3%)
- Long-distance train or commuter rail: 6,861 (2.1%)
- Light rail, streetcar or trolley: 7,775 (2.4%)
- Ferryboat: 558 (0.2%)
- Taxicab, motorcycle, or other means: 8,210 (2.5%)
- Bicycle: 1,601 (0.5%)
- Walked: 24,316 (7.5%)
- Worked at home: 76,149 (23.4%)
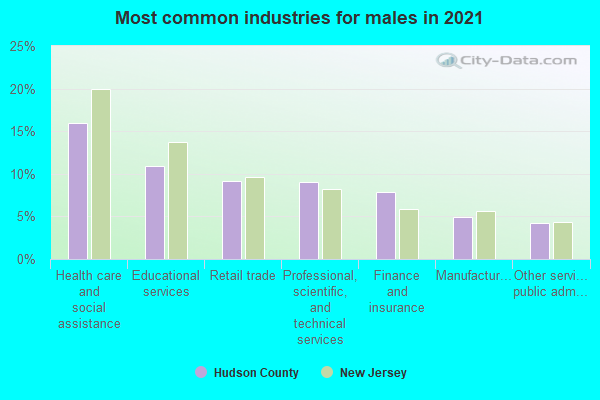
- Health care and social assistance (15%)
- Professional, scientific, and technical services (12%)
- Educational services (10%)
- Finance and insurance (8%)
- Retail trade (8%)
- Manufacturing (5%)
- Other services, except public administration (4%)

- Health care and social assistance (18%)
- Professional, scientific, and technical services (14%)
- Educational services (12%)
- Finance and insurance (10%)
- Retail trade (9%)
- Manufacturing (5%)
- Other services, except public administration (4%)
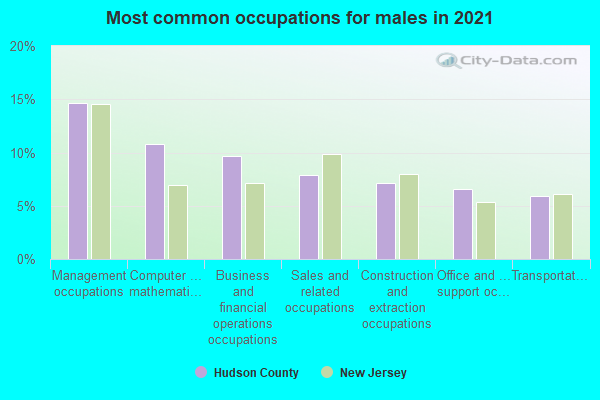
- Management occupations (13%)
- Business and financial operations occupations (10%)
- Computer and mathematical occupations (10%)
- Construction and extraction occupations (8%)
- Sales and related occupations (8%)
- Transportation occupations (7%)
- Office and administrative support occupations (7%)
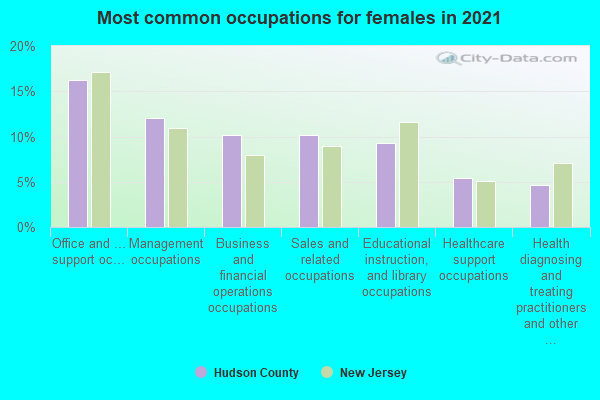
- Office and administrative support occupations (14%)
- Management occupations (12%)
- Business and financial operations occupations (12%)
- Educational instruction, and library occupations (9%)
- Sales and related occupations (8%)
- Healthcare support occupations (7%)
- Health diagnosing and treating practitioners and other technical occupations (5%)
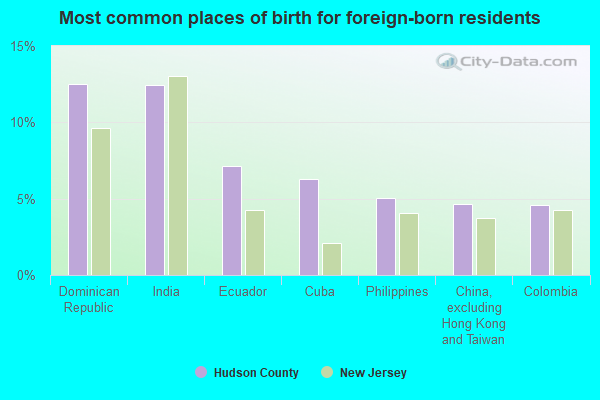
- Dominican Republic (13%)
- India (12%)
- Ecuador (7%)
- Cuba (6%)
- Colombia (5%)
- Philippines (5%)
- China, excluding Hong Kong and Taiwan (5%)
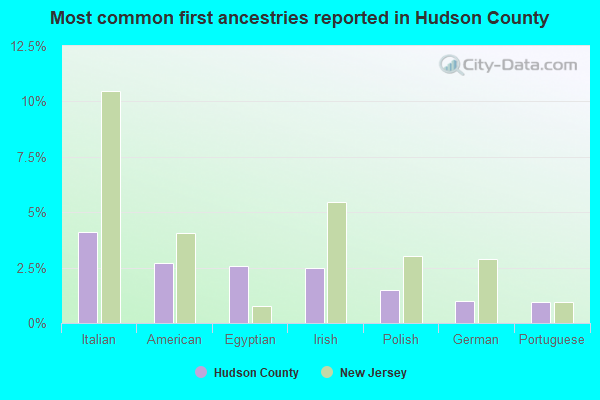
- Italian (4%)
- Irish (3%)
- Egyptian (3%)
- American (3%)
- Polish (2%)
- German (1%)
- Portuguese (1%)
People in group quarters in Hudson County, New Jersey in 2010:
- 2,503 people in college/university student housing
- 2,403 people in nursing facilities/skilled-nursing facilities
- 1,843 people in local jails and other municipal confinement facilities
- 808 people in other noninstitutional facilities
- 631 people in emergency and transitional shelters (with sleeping facilities) for people experiencing homelessness
- 525 people in correctional facilities intended for juveniles
- 237 people in residential treatment centers for juveniles (non-correctional)
- 237 people in residential treatment centers for adults
- 131 people in group homes intended for adults
- 32 people in workers' group living quarters and job corps centers
- 28 people in group homes for juveniles (non-correctional)
People in group quarters in Hudson County, New Jersey in 2000:
- 2,428 people in nursing homes
- 1,792 people in college dormitories (includes college quarters off campus)
- 1,700 people in local jails and other confinement facilities (including police lockups)
- 816 people in other noninstitutional group quarters
- 501 people in other types of correctional institutions
- 427 people in religious group quarters
- 324 people in mental (psychiatric) hospitals or wards
- 321 people in homes or halfway houses for drug/alcohol abuse
- 320 people in state prisons
- 212 people in other nonhousehold living situations
- 200 people in hospitals/wards and hospices for chronically ill
- 200 people in other hospitals or wards for chronically ill
- 150 people in halfway houses
- 87 people in short-term care, detention or diagnostic centers for delinquent children
- 66 people in homes for the mentally ill
- 37 people in homes for the mentally retarded
- 23 people in job corps and vocational training facilities
- 17 people in other group homes
- 10 people in military ships
- 7 people in wards in general hospitals for patients who have no usual home elsewhere
- 6 people in unknown juvenile institutions
- 4 people in homes for abused, dependent, and neglected children
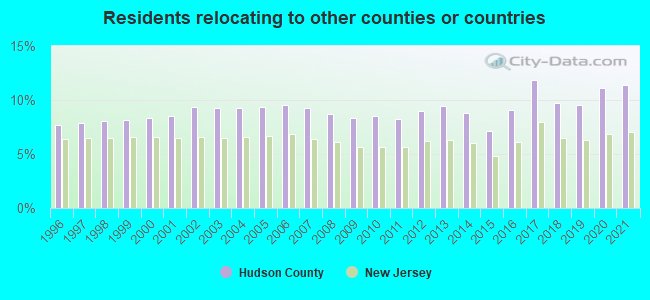
9.63% of this county's 2021 resident taxpayers lived in other counties in 2020 ($98,061 average adjusted gross income)
| Here: | 9.63% |
| New Jersey average: | 6.70% |
0.01% of residents moved from foreign countries ($36 average AGI)
Hudson County: 0.01% New Jersey average: 0.01%
3.21% relocated from other counties in New Jersey ($28,216 average AGI)
6.42% relocated from other states ($69,809 average AGI)
Hudson County: 6.42% New Jersey average: 2.98%

Top counties from which taxpayers relocated into this county between 2020 and 2021:
| from New York County, NY | |
| from Kings County, NY | |
| from Bergen County, NJ | |
| from Queens County, NY | |
| from Essex County, NJ | |
| from Middlesex County, NJ | |
| from Bronx County, NY |
11.41% of this county's 2020 resident taxpayers moved to other counties in 2021 ($127,758 average adjusted gross income)
| Here: | 11.41% |
| New Jersey average: | 7.02% |
0.02% of residents moved to foreign countries ($143 average AGI)
Hudson County: 0.02% New Jersey average: 0.02%
5.56% relocated to other counties in New Jersey ($62,406 average AGI)
5.82% relocated to other states ($65,209 average AGI)
Hudson County: 5.82% New Jersey average: 3.32%
Top counties to which taxpayers relocated from this county between 2020 and 2021:
| to Bergen County, NJ | |
| to Essex County, NJ | |
| to Middlesex County, NJ | |
| to Union County, NJ | |
| to New York County, NY | |
| to Morris County, NJ | |
| to Monmouth County, NJ |
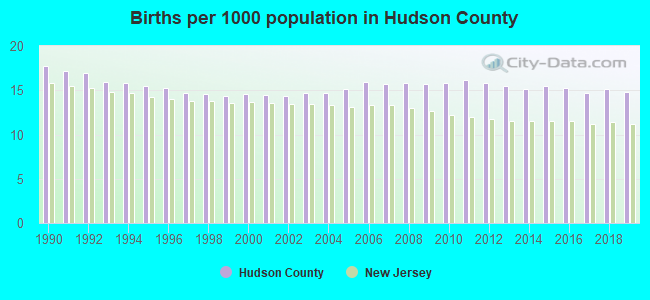
Births per 1000 population from 1990 to 1999: 15.8
Births per 1000 population from 2000 to 2009: 15.1
Births per 1000 population from 2010 to 2022: 12.9
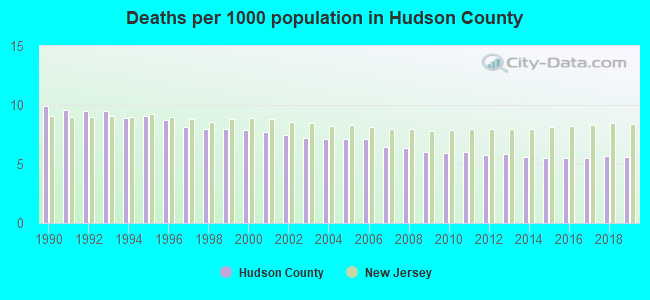
Deaths per 1000 population from 1990 to 1999: 8.9
Deaths per 1000 population from 2000 to 2009: 7.0
Deaths per 1000 population from 2010 to 2020: 6.0
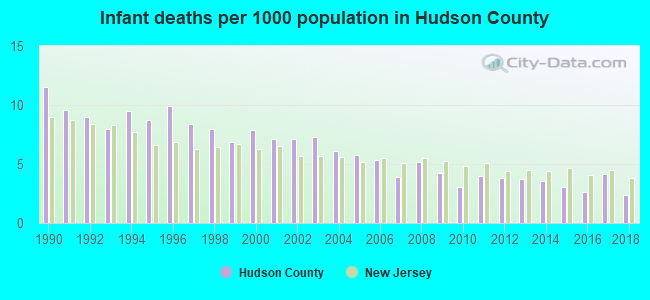
Infant deaths per 1000 live births from 1990 to 1999: 8.9
Infant deaths per 1000 live births from 2000 to 2009: 6.0
Infant deaths per 1000 live births from 2010 to 2021: 3.2
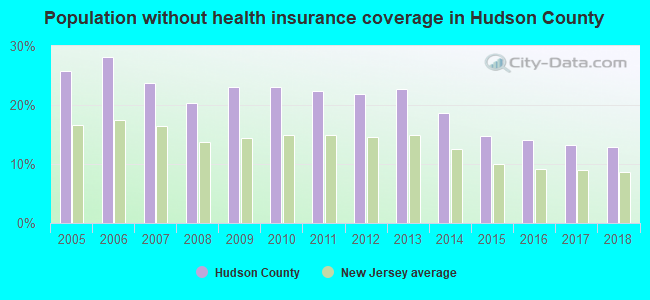
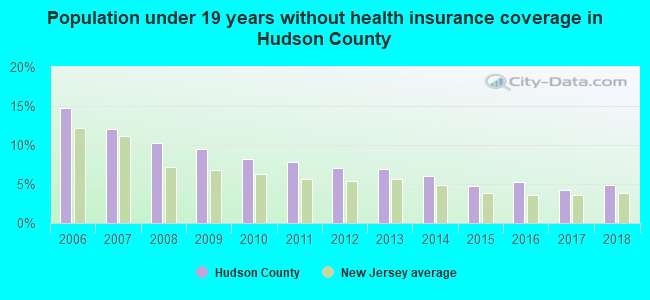
Persons under 19 years old without health insurance coverage in 2018: 4.9%
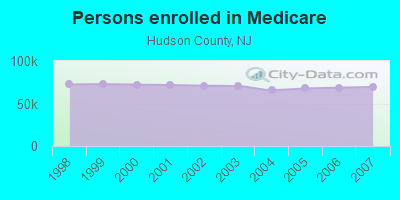
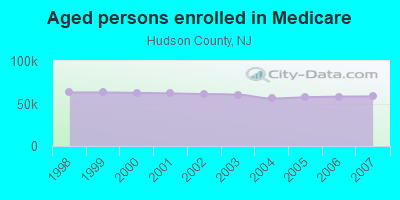
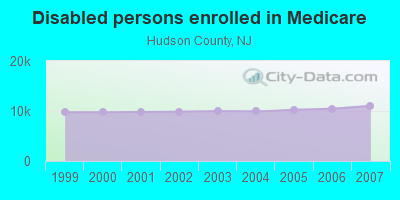
Persons enrolled in hospital insurance and/or supplemental medical insurance (Medicare) in July 1, 2007: 69,444 (58,379 aged, 11,065 disabled)
Children under 18 without health insurance coverage in 2007: 19,313 (15%)
Most common underlying causes of death in Hudson County, New Jersey in 1999 - 2019:
- Atherosclerotic heart disease (8,430)
- Acute myocardial infarction, unspecified (5,389)
- Bronchus or lung, unspecified - Malignant neoplasms (4,477)
- Septicaemia, unspecified (2,675)
- Chronic obstructive pulmonary disease, unspecified (2,446)
- Unspecified diabetes mellitus, without complications (2,422)
- Atherosclerotic cardiovascular disease, so described (2,348)
- Stroke, not specified as haemorrhage or infarction (2,139)
- Colon, unspecified - Malignant neoplasms (1,834)
- Breast, unspecified - Malignant neoplasms (1,645)
Population without health insurance coverage in 2000: 19%
Children under 18 without health insurance coverage in 2000: 13%
Short term general hospital admissions per 100,000 population in 2004: 10,824
Short term general hospital beds per 100,000 population in 2004: 261
Emergency room visits per 100,000 population in 2004: 36,980
General practice office based MDs per 100,000 population in 2005: 1,438
Medical specialist MDs per 100,000 population in 2005: 675
Dentists per 100,000 population in 1998: 30
Total births per 100,000 population, July 2005 - July 2006 : 48
Total deaths per 100,000 population, July 2005 - July 2006: 100
Limited-service eating places per 100,000 population in 2005 : 9
Beer, wine & liquor stores per 100,000 population in 2005: 1
Fitness & recreation sports centers per 100,000 population in 2005: 5,842
EPA green book nonattainment status in 2004-2006: 1
Suicides per 1,000,000 population from 2000 to 2006: 48.8. This is less than state average.
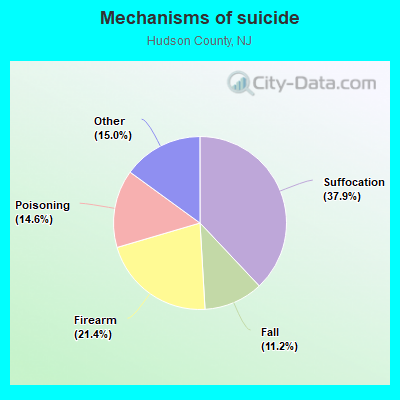
- Suffocation - 18.5
- Firearm - 10.4
- Poisoning - 7.1
- Fall - 5.4
- Other - 7.3
Household type by relationship:
Households: 703,366- Male householders: 156,000 (48,225 living alone), Female householders: 148,526 (52,729 living alone)
105,838 spouses (104,011 opposite-sex spouses), 31,976 unmarried partners, (30,461 opposite-sex unmarried partners), 170,593 children (164,687 natural, 1,890 adopted, 4,016 stepchildren), 14,496 grandchildren, 11,111 brothers or sisters, 15,205 parents, 61 foster children, 13,431 other relatives, 28,180 non-relatives
- In group quarters: 7,949
Size of family households: 68,405 2-persons, 47,354 3-persons, 28,578 4-persons, 14,747 5-persons, 4,990 6-persons, 4,454 7-or-more-persons.
Size of nonfamily households: 100,954 1-person, 28,382 2-persons, 5,271 3-persons, 911 4-persons, 355 5-persons, 65 6-persons, 60 7-or-more-persons.
78,986 married couples with children.
40,426 single-parent households (8,730 men, 31,696 women).
45.0% of residents of Hudson speak English at home.
33.8% of residents speak Spanish at home (51% speak English very well, 19% speak English well, 20% speak English not well, 10% don't speak English at all).
10.2% of residents speak other Indo-European language at home (79% speak English very well, 12% speak English well, 6% speak English not well, 2% don't speak English at all).
7.0% of residents speak Asian or Pacific Island language at home (68% speak English very well, 24% speak English well, 6% speak English not well, 1% don't speak English at all).
4.0% of residents speak other language at home (75% speak English very well, 15% speak English well, 9% speak English not well, 1% don't speak English at all).
In fiscal year 2004:
Federal Government expenditure: $3,499,556,000 ($5,773 per capita)
Department of Defense expenditure: $68,260,000
Federal direct payments to individuals for retirement and disability: $915,279,000
Federal other direct payments to individuals: $770,099,000
Federal direct payments not to individuals: $34,038,000
Federal grants: $1,109,278,000
Federal procurement contracts: $189,743,000 ($44,878,000 Department of Defense)
Federal salaries and wages: $481,118,000 ($9,816,000 Department of Defense)
Federal Government direct loans: $16,983,000
Federal guaranteed/insured loans: $338,191,000
Federal Government insurance: $913,807,000
Population change from April 1, 2000 to July 1, 2005:
Births: 46,285| Here: | 77 per 1000 residents |
| State: | 69 per 1000 residents |
Deaths: 23,316
| Here: | 39 per 1000 residents |
| State: | 44 per 1000 residents |
Net international migration: +49,120
| Here: | +81 per 1000 residents |
| State: | +33 per 1000 residents |
Net internal migration: -76,172
| Here: | |
| State: |
Total withdrawal of fresh water for public supply: 0.00 millions of gallons per day (all from surface)
| Here: | 4.9 |
| State: | 6.8 |
| Here: | 3.5 |
| State: | 3.9 |
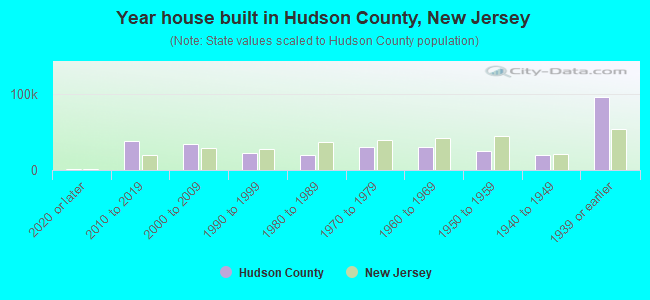
- Year house built in Hudson County, New Jersey
- 5,8242020 or later
- 39,5572010 to 2019
- 34,2572000 to 2009
- 18,4721990 to 1999
- 20,9241980 to 1989
- 28,8861970 to 1979
- 28,3341960 to 1969
- 22,9491950 to 1959
- 23,0511940 to 1949
- 97,3601939 or earlier
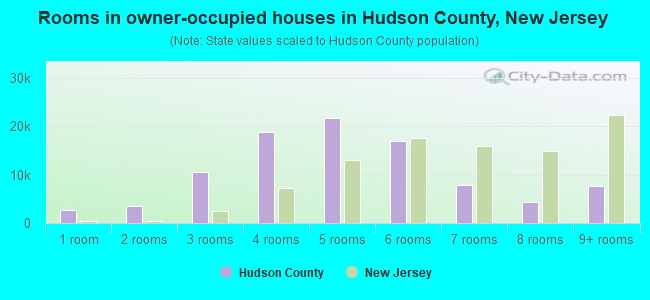
- Rooms in owner-occupied houses in Hudson County, New Jersey
- 1,0981 room
- 3,8992 rooms
- 12,2693 rooms
- 22,5464 rooms
- 21,9155 rooms
- 14,5546 rooms
- 8,2497 rooms
- 5,6358 rooms
- 8,2929+ rooms
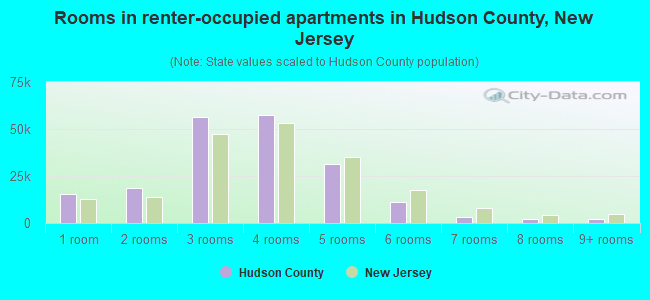
- Rooms in renter-occupied apartments in Hudson County, New Jersey
- 16,8341 room
- 23,0452 rooms
- 61,2823 rooms
- 58,0314 rooms
- 31,6925 rooms
- 9,2786 rooms
- 3,3467 rooms
- 1,3858 rooms
- 1,1769+ rooms
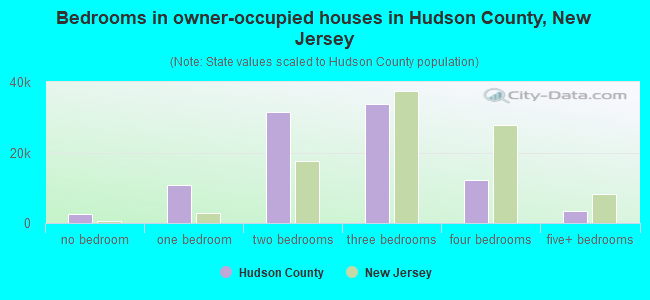
- Bedrooms in owner-occupied houses in Hudson County, New Jersey
- 1,858no bedroom
- 12,8511 bedroom
- 34,9142 bedrooms
- 34,7733 bedrooms
- 9,2844 bedrooms
- 4,7775+ bedrooms
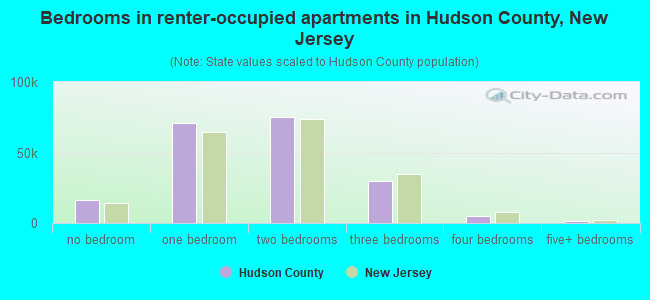
- Bedrooms in renter-occupied apartments in Hudson County, New Jersey
- 18,480no bedroom
- 76,2981 bedroom
- 78,0112 bedrooms
- 29,5793 bedrooms
- 1,9634 bedrooms
- 1,7385+ bedrooms
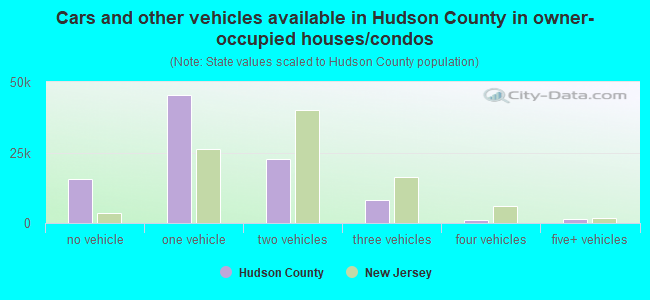
- Cars and other vehicles available in Hudson County in owner-occupied houses/condos
- 12,774no vehicle
- 51,6731 vehicle
- 26,0582 vehicles
- 5,7553 vehicles
- 1,3844 vehicles
- 8135+ vehicles
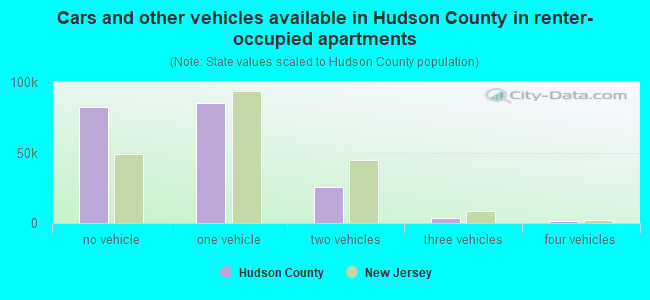
- Cars and other vehicles available in Hudson County in renter-occupied apartments
- 87,438no vehicle
- 93,2251 vehicle
- 21,2942 vehicles
- 3,1153 vehicles
- 8964 vehicles
- 1015+ vehicles
87.1% of Hudson County residents lived in the same house 1 years ago.
Out of people who lived in different houses, 32% lived in this county.
Out of people who lived in different counties, 37% lived in New Jersey.
| Hudson County: | 87.1% |
| State average: | 90.4% |
Place of birth for U.S.-born residents:
- This state: 244,989
- Other state: 139,796
- Northeast: 102,153
- Midwest: 8,872
- South: 20,812
- West: 7,959
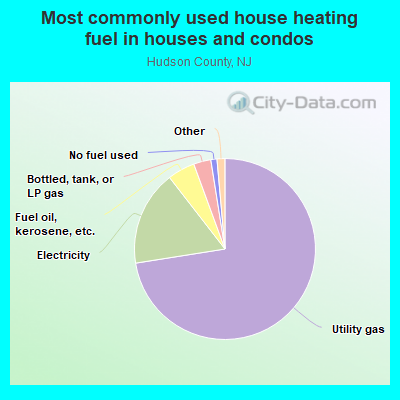
- 75.5%Utility gas
- 17.6%Electricity
- 3.2%Bottled, tank, or LP gas
- 2.1%Fuel oil, kerosene, etc.
- 1.1%No fuel used
- 0.4%Other fuel
- 0.2%Solar energy
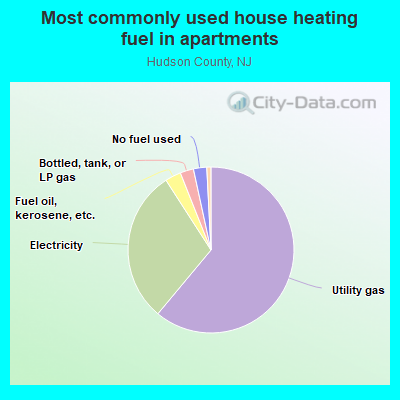
- 59.0%Utility gas
- 32.9%Electricity
- 2.5%No fuel used
- 2.4%Bottled, tank, or LP gas
- 2.2%Fuel oil, kerosene, etc.
- 0.9%Other fuel
Private vs. public school enrollment:
| Here: | 9.6% |
| New Jersey: | 12.3% |
| Here: | 14.3% |
| New Jersey: | 13.1% |
| Here: | 33.9% |
| New Jersey: | 33.2% |
Hudson County government finances - Expenditure in 2018:
- Assistance and Subsidies - Public Welfare, Federal Categorical Assistance Programs: $38,135,000
Public Welfare, Federal Categorical Assistance Programs: $28,749,000
- Bond Funds - Cash and Securities: $88,924,000
Cash and Securities: $72,058,000
- Charges - Solid Waste Management: $43,539,000
Solid Waste Management: $43,379,000
Hospital Public: $27,071,000
Hospital Public: $24,013,000
Other: $17,656,000
Other: $13,957,000
Higher Education - Other: $10,072,000
Higher Education - Other: $8,713,000
Elementary and Secondary Education School Lunch: $944,000
Elementary and Secondary Education School Lunch: $903,000
Higher Education Auxiliary Enterprises: $283,000
Higher Education Auxiliary Enterprises: $145,000
Parks and Recreation: $22,000
Parks and Recreation: $20,000
- Construction - Other Higher Education: $5,732,000
Elementary and Secondary Education: $4,071,000
Other Higher Education: $2,874,000
- Current Operations - General - Other: $134,335,000
Public Welfare - Other: $65,514,000
Elementary and Secondary Education: $64,582,000
Other Higher Education: $63,930,000
Correctional Institutions: $62,428,000
Other Higher Education: $61,954,000
Elementary and Secondary Education: $60,320,000
Correctional Institutions: $55,906,000
Public Welfare - Other: $54,927,000
General - Other: $46,311,000
Solid Waste Management: $33,267,000
Police Protection: $30,687,000
Solid Waste Management: $30,064,000
Judicial and Legal Services: $28,386,000
Judicial and Legal Services: $25,855,000
General Public Buildings: $23,086,000
General Public Buildings: $15,632,000
Hospitals: $14,873,000
Hospitals: $13,282,000
Parks and Recreation: $12,842,000
Financial Administration: $6,258,000
Central Staff Services: $5,188,000
Regular Highways: $5,158,000
Housing and Community Development: $3,910,000
Health - Other: $1,047,000
Health - Other: $1,036,000
Parks and Recreation: $836,000
Central Staff Services: $794,000
Police Protection: $455,000
Regular Highways: $451,000
Higher Education Auxiliary Enterprises: $409,000
Higher Education Auxiliary Enterprises: $397,000
Financial Administration: $379,000
Local Fire Protection: $107,000
Local Fire Protection: $105,000
Housing and Community Development: $38,000
Protective Inspection and Regulation - Other: $30,000
Protective Inspection and Regulation - Other: $13,000
- Federal Intergovernmental - Other: $26,944,000
Education: $8,130,000
Housing and Community Development: $4,889,000
Housing and Community Development: $4,097,000
Other: $3,339,000
Education: $2,207,000
- General - Interest on Debt: $42,243,000
Interest on Debt: $25,270,000
- Intergovernmental to State - Hospitals: $28,749,000
Public Welfare: $6,100,000
Elementary and Secondary Education: $4,000
- Local Intergovernmental - Education: $23,016,000
Education: $17,606,000
Other: $5,576,000
- Long Term Debt - Beginning Outstanding - Unspecified Public Purpose: $1,014,714,000
Outstanding Unspecified Public Purpose: $892,145,000
Beginning Outstanding - Unspecified Public Purpose: $806,968,000
Outstanding Unspecified Public Purpose: $783,050,000
Retired Unspecified Public Purpose: $300,593,000
Retired Unspecified Public Purpose: $212,027,000
Issue, Unspecified Public Purpose: $188,185,000
Issue, Unspecified Public Purpose: $178,023,000
Beginning Outstanding - Public Debt for Private Purpose: $34,130,000
Outstanding Nonguaranteed - Industrial Revenue: $30,830,000
Beginning Outstanding - Public Debt for Private Purpose: $27,530,000
Outstanding Nonguaranteed - Industrial Revenue: $24,230,000
Retired Nonguaranteed - Public Debt for Private Purpose: $3,300,000
Retired Nonguaranteed - Public Debt for Private Purpose: $3,300,000
- Miscellaneous - Interest Earnings: $4,657,000
General Revenue - Other: $3,431,000
Interest Earnings: $3,138,000
General Revenue - Other: $636,000
Donations From Private Sources: $475,000
Donations From Private Sources: $335,000
Fines and Forfeits: $238,000
- Other Capital Outlay - Other Higher Education: $1,526,000
Other Higher Education: $510,000
Elementary and Secondary Education: $64,000
- Other Funds - Cash and Securities: $255,191,000
Cash and Securities: $239,760,000
- Sinking Funds - Cash and Securities: $30,830,000
Cash and Securities: $24,230,000
- State Intergovernmental - Public Welfare: $79,947,000
Education: $55,972,000
Education: $46,661,000
Public Welfare: $37,008,000
Health and Hospitals: $27,051,000
Other: $26,083,000
Health and Hospitals: $26,075,000
- Tax - Property: $374,181,000
Property: $350,544,000
Documentary and Stock Transfer: $12,310,000
Documentary and Stock Transfer: $12,266,000
- Total Salaries and Wages: $40,683,000
: $37,779,000
Hudson County government finances - Revenue in 2018:
- Assistance and Subsidies - Public Welfare, Federal Categorical Assistance Programs: $38,135,000
Public Welfare, Federal Categorical Assistance Programs: $28,749,000
- Bond Funds - Cash and Securities: $88,924,000
Cash and Securities: $72,058,000
- Charges - Solid Waste Management: $43,539,000
Solid Waste Management: $43,379,000
Hospital Public: $27,071,000
Hospital Public: $24,013,000
Other: $17,656,000
Other: $13,957,000
Higher Education - Other: $10,072,000
Higher Education - Other: $8,713,000
Elementary and Secondary Education School Lunch: $944,000
Elementary and Secondary Education School Lunch: $903,000
Higher Education Auxiliary Enterprises: $283,000
Higher Education Auxiliary Enterprises: $145,000
Parks and Recreation: $22,000
Parks and Recreation: $20,000
- Construction - Other Higher Education: $5,732,000
Elementary and Secondary Education: $4,071,000
Other Higher Education: $2,874,000
- Current Operations - General - Other: $134,335,000
Public Welfare - Other: $65,514,000
Elementary and Secondary Education: $64,582,000
Other Higher Education: $63,930,000
Correctional Institutions: $62,428,000
Other Higher Education: $61,954,000
Elementary and Secondary Education: $60,320,000
Correctional Institutions: $55,906,000
Public Welfare - Other: $54,927,000
General - Other: $46,311,000
Solid Waste Management: $33,267,000
Police Protection: $30,687,000
Solid Waste Management: $30,064,000
Judicial and Legal Services: $28,386,000
Judicial and Legal Services: $25,855,000
General Public Buildings: $23,086,000
General Public Buildings: $15,632,000
Hospitals: $14,873,000
Hospitals: $13,282,000
Parks and Recreation: $12,842,000
Financial Administration: $6,258,000
Central Staff Services: $5,188,000
Regular Highways: $5,158,000
Housing and Community Development: $3,910,000
Health - Other: $1,047,000
Health - Other: $1,036,000
Parks and Recreation: $836,000
Central Staff Services: $794,000
Police Protection: $455,000
Regular Highways: $451,000
Higher Education Auxiliary Enterprises: $409,000
Higher Education Auxiliary Enterprises: $397,000
Financial Administration: $379,000
Local Fire Protection: $107,000
Local Fire Protection: $105,000
Housing and Community Development: $38,000
Protective Inspection and Regulation - Other: $30,000
Protective Inspection and Regulation - Other: $13,000
- Federal Intergovernmental - Other: $26,944,000
Education: $8,130,000
Housing and Community Development: $4,889,000
Housing and Community Development: $4,097,000
Other: $3,339,000
Education: $2,207,000
- General - Interest on Debt: $42,243,000
Interest on Debt: $25,270,000
- Intergovernmental to State - Hospitals: $28,749,000
Public Welfare: $6,100,000
Elementary and Secondary Education: $4,000
- Local Intergovernmental - Education: $23,016,000
Education: $17,606,000
Other: $5,576,000
- Long Term Debt - Beginning Outstanding - Unspecified Public Purpose: $1,014,714,000
Outstanding Unspecified Public Purpose: $892,145,000
Beginning Outstanding - Unspecified Public Purpose: $806,968,000
Outstanding Unspecified Public Purpose: $783,050,000
Retired Unspecified Public Purpose: $300,593,000
Retired Unspecified Public Purpose: $212,027,000
Issue, Unspecified Public Purpose: $188,185,000
Issue, Unspecified Public Purpose: $178,023,000
Beginning Outstanding - Public Debt for Private Purpose: $34,130,000
Outstanding Nonguaranteed - Industrial Revenue: $30,830,000
Beginning Outstanding - Public Debt for Private Purpose: $27,530,000
Outstanding Nonguaranteed - Industrial Revenue: $24,230,000
Retired Nonguaranteed - Public Debt for Private Purpose: $3,300,000
Retired Nonguaranteed - Public Debt for Private Purpose: $3,300,000
- Miscellaneous - Interest Earnings: $4,657,000
General Revenue - Other: $3,431,000
Interest Earnings: $3,138,000
General Revenue - Other: $636,000
Donations From Private Sources: $475,000
Donations From Private Sources: $335,000
Fines and Forfeits: $238,000
- Other Capital Outlay - Other Higher Education: $1,526,000
Other Higher Education: $510,000
Elementary and Secondary Education: $64,000
- Other Funds - Cash and Securities: $255,191,000
Cash and Securities: $239,760,000
- Sinking Funds - Cash and Securities: $30,830,000
Cash and Securities: $24,230,000
- State Intergovernmental - Public Welfare: $79,947,000
Education: $55,972,000
Education: $46,661,000
Public Welfare: $37,008,000
Health and Hospitals: $27,051,000
Other: $26,083,000
Health and Hospitals: $26,075,000
- Tax - Property: $374,181,000
Property: $350,544,000
Documentary and Stock Transfer: $12,310,000
Documentary and Stock Transfer: $12,266,000
- Total Salaries and Wages: $40,683,000
: $37,779,000
Hudson County government finances - Debt in 2018:
- Assistance and Subsidies - Public Welfare, Federal Categorical Assistance Programs: $38,135,000
Public Welfare, Federal Categorical Assistance Programs: $28,749,000
- Bond Funds - Cash and Securities: $88,924,000
Cash and Securities: $72,058,000
- Charges - Solid Waste Management: $43,539,000
Solid Waste Management: $43,379,000
Hospital Public: $27,071,000
Hospital Public: $24,013,000
Other: $17,656,000
Other: $13,957,000
Higher Education - Other: $10,072,000
Higher Education - Other: $8,713,000
Elementary and Secondary Education School Lunch: $944,000
Elementary and Secondary Education School Lunch: $903,000
Higher Education Auxiliary Enterprises: $283,000
Higher Education Auxiliary Enterprises: $145,000
Parks and Recreation: $22,000
Parks and Recreation: $20,000
- Construction - Other Higher Education: $5,732,000
Elementary and Secondary Education: $4,071,000
Other Higher Education: $2,874,000
- Current Operations - General - Other: $134,335,000
Public Welfare - Other: $65,514,000
Elementary and Secondary Education: $64,582,000
Other Higher Education: $63,930,000
Correctional Institutions: $62,428,000
Other Higher Education: $61,954,000
Elementary and Secondary Education: $60,320,000
Correctional Institutions: $55,906,000
Public Welfare - Other: $54,927,000
General - Other: $46,311,000
Solid Waste Management: $33,267,000
Police Protection: $30,687,000
Solid Waste Management: $30,064,000
Judicial and Legal Services: $28,386,000
Judicial and Legal Services: $25,855,000
General Public Buildings: $23,086,000
General Public Buildings: $15,632,000
Hospitals: $14,873,000
Hospitals: $13,282,000
Parks and Recreation: $12,842,000
Financial Administration: $6,258,000
Central Staff Services: $5,188,000
Regular Highways: $5,158,000
Housing and Community Development: $3,910,000
Health - Other: $1,047,000
Health - Other: $1,036,000
Parks and Recreation: $836,000
Central Staff Services: $794,000
Police Protection: $455,000
Regular Highways: $451,000
Higher Education Auxiliary Enterprises: $409,000
Higher Education Auxiliary Enterprises: $397,000
Financial Administration: $379,000
Local Fire Protection: $107,000
Local Fire Protection: $105,000
Housing and Community Development: $38,000
Protective Inspection and Regulation - Other: $30,000
Protective Inspection and Regulation - Other: $13,000
- Federal Intergovernmental - Other: $26,944,000
Education: $8,130,000
Housing and Community Development: $4,889,000
Housing and Community Development: $4,097,000
Other: $3,339,000
Education: $2,207,000
- General - Interest on Debt: $42,243,000
Interest on Debt: $25,270,000
- Intergovernmental to State - Hospitals: $28,749,000
Public Welfare: $6,100,000
Elementary and Secondary Education: $4,000
- Local Intergovernmental - Education: $23,016,000
Education: $17,606,000
Other: $5,576,000
- Long Term Debt - Beginning Outstanding - Unspecified Public Purpose: $1,014,714,000
Outstanding Unspecified Public Purpose: $892,145,000
Beginning Outstanding - Unspecified Public Purpose: $806,968,000
Outstanding Unspecified Public Purpose: $783,050,000
Retired Unspecified Public Purpose: $300,593,000
Retired Unspecified Public Purpose: $212,027,000
Issue, Unspecified Public Purpose: $188,185,000
Issue, Unspecified Public Purpose: $178,023,000
Beginning Outstanding - Public Debt for Private Purpose: $34,130,000
Outstanding Nonguaranteed - Industrial Revenue: $30,830,000
Beginning Outstanding - Public Debt for Private Purpose: $27,530,000
Outstanding Nonguaranteed - Industrial Revenue: $24,230,000
Retired Nonguaranteed - Public Debt for Private Purpose: $3,300,000
Retired Nonguaranteed - Public Debt for Private Purpose: $3,300,000
- Miscellaneous - Interest Earnings: $4,657,000
General Revenue - Other: $3,431,000
Interest Earnings: $3,138,000
General Revenue - Other: $636,000
Donations From Private Sources: $475,000
Donations From Private Sources: $335,000
Fines and Forfeits: $238,000
- Other Capital Outlay - Other Higher Education: $1,526,000
Other Higher Education: $510,000
Elementary and Secondary Education: $64,000
- Other Funds - Cash and Securities: $255,191,000
Cash and Securities: $239,760,000
- Sinking Funds - Cash and Securities: $30,830,000
Cash and Securities: $24,230,000
- State Intergovernmental - Public Welfare: $79,947,000
Education: $55,972,000
Education: $46,661,000
Public Welfare: $37,008,000
Health and Hospitals: $27,051,000
Other: $26,083,000
Health and Hospitals: $26,075,000
- Tax - Property: $374,181,000
Property: $350,544,000
Documentary and Stock Transfer: $12,310,000
Documentary and Stock Transfer: $12,266,000
- Total Salaries and Wages: $40,683,000
: $37,779,000
Hudson County government finances - Cash and Securities in 2018:
- Assistance and Subsidies - Public Welfare, Federal Categorical Assistance Programs: $38,135,000
Public Welfare, Federal Categorical Assistance Programs: $28,749,000
- Bond Funds - Cash and Securities: $88,924,000
Cash and Securities: $72,058,000
- Charges - Solid Waste Management: $43,539,000
Solid Waste Management: $43,379,000
Hospital Public: $27,071,000
Hospital Public: $24,013,000
Other: $17,656,000
Other: $13,957,000
Higher Education - Other: $10,072,000
Higher Education - Other: $8,713,000
Elementary and Secondary Education School Lunch: $944,000
Elementary and Secondary Education School Lunch: $903,000
Higher Education Auxiliary Enterprises: $283,000
Higher Education Auxiliary Enterprises: $145,000
Parks and Recreation: $22,000
Parks and Recreation: $20,000
- Construction - Other Higher Education: $5,732,000
Elementary and Secondary Education: $4,071,000
Other Higher Education: $2,874,000
- Current Operations - General - Other: $134,335,000
Public Welfare - Other: $65,514,000
Elementary and Secondary Education: $64,582,000
Other Higher Education: $63,930,000
Correctional Institutions: $62,428,000
Other Higher Education: $61,954,000
Elementary and Secondary Education: $60,320,000
Correctional Institutions: $55,906,000
Public Welfare - Other: $54,927,000
General - Other: $46,311,000
Solid Waste Management: $33,267,000
Police Protection: $30,687,000
Solid Waste Management: $30,064,000
Judicial and Legal Services: $28,386,000
Judicial and Legal Services: $25,855,000
General Public Buildings: $23,086,000
General Public Buildings: $15,632,000
Hospitals: $14,873,000
Hospitals: $13,282,000
Parks and Recreation: $12,842,000
Financial Administration: $6,258,000
Central Staff Services: $5,188,000
Regular Highways: $5,158,000
Housing and Community Development: $3,910,000
Health - Other: $1,047,000
Health - Other: $1,036,000
Parks and Recreation: $836,000
Central Staff Services: $794,000
Police Protection: $455,000
Regular Highways: $451,000
Higher Education Auxiliary Enterprises: $409,000
Higher Education Auxiliary Enterprises: $397,000
Financial Administration: $379,000
Local Fire Protection: $107,000
Local Fire Protection: $105,000
Housing and Community Development: $38,000
Protective Inspection and Regulation - Other: $30,000
Protective Inspection and Regulation - Other: $13,000
- Federal Intergovernmental - Other: $26,944,000
Education: $8,130,000
Housing and Community Development: $4,889,000
Housing and Community Development: $4,097,000
Other: $3,339,000
Education: $2,207,000
- General - Interest on Debt: $42,243,000
Interest on Debt: $25,270,000
- Intergovernmental to State - Hospitals: $28,749,000
Public Welfare: $6,100,000
Elementary and Secondary Education: $4,000
- Local Intergovernmental - Education: $23,016,000
Education: $17,606,000
Other: $5,576,000
- Long Term Debt - Beginning Outstanding - Unspecified Public Purpose: $1,014,714,000
Outstanding Unspecified Public Purpose: $892,145,000
Beginning Outstanding - Unspecified Public Purpose: $806,968,000
Outstanding Unspecified Public Purpose: $783,050,000
Retired Unspecified Public Purpose: $300,593,000
Retired Unspecified Public Purpose: $212,027,000
Issue, Unspecified Public Purpose: $188,185,000
Issue, Unspecified Public Purpose: $178,023,000
Beginning Outstanding - Public Debt for Private Purpose: $34,130,000
Outstanding Nonguaranteed - Industrial Revenue: $30,830,000
Beginning Outstanding - Public Debt for Private Purpose: $27,530,000
Outstanding Nonguaranteed - Industrial Revenue: $24,230,000
Retired Nonguaranteed - Public Debt for Private Purpose: $3,300,000
Retired Nonguaranteed - Public Debt for Private Purpose: $3,300,000
- Miscellaneous - Interest Earnings: $4,657,000
General Revenue - Other: $3,431,000
Interest Earnings: $3,138,000
General Revenue - Other: $636,000
Donations From Private Sources: $475,000
Donations From Private Sources: $335,000
Fines and Forfeits: $238,000
- Other Capital Outlay - Other Higher Education: $1,526,000
Other Higher Education: $510,000
Elementary and Secondary Education: $64,000
- Other Funds - Cash and Securities: $255,191,000
Cash and Securities: $239,760,000
- Sinking Funds - Cash and Securities: $30,830,000
Cash and Securities: $24,230,000
- State Intergovernmental - Public Welfare: $79,947,000
Education: $55,972,000
Education: $46,661,000
Public Welfare: $37,008,000
Health and Hospitals: $27,051,000
Other: $26,083,000
Health and Hospitals: $26,075,000
- Tax - Property: $374,181,000
Property: $350,544,000
Documentary and Stock Transfer: $12,310,000
Documentary and Stock Transfer: $12,266,000
- Total Salaries and Wages: $40,683,000
: $37,779,000
Supplemental Security Income (SSI) in 2006:
- Total number of recipients: 21,424
- Number of aged recipients: 6,176
- Number of blind and disabled recipients: 15,248
- Number of recipients under 18: 2,719
- Number of recipients between 18 and 64: 9,371
- Number of recipients older than 64: 9,334
- Number of recipients also receiving OASDI: 7,369
- Amount of payments (thousands of dollars): 10,160
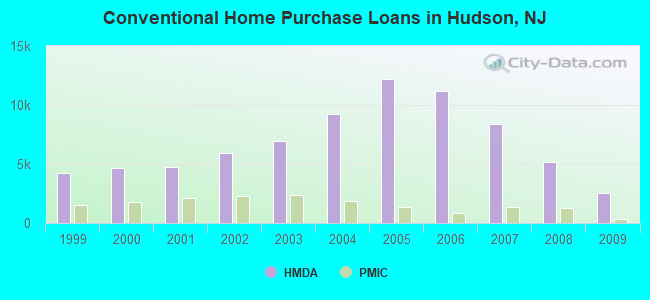
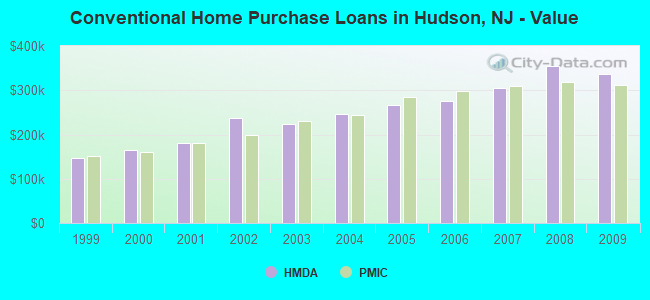
| Home Mortgage Disclosure Act Aggregated Statistics For Year 2009 (Based on 158 full tracts) | ||||||||||||||
| A) FHA, FSA/RHS & VA Home Purchase Loans | B) Conventional Home Purchase Loans | C) Refinancings | D) Home Improvement Loans | E) Loans on Dwellings For 5+ Families | F) Non-occupant Loans on < 5 Family Dwellings (A B C & D) | G) Loans On Manufactured Home Dwelling (A B C & D) | ||||||||
|---|---|---|---|---|---|---|---|---|---|---|---|---|---|---|
| Number | Average Value | Number | Average Value | Number | Average Value | Number | Average Value | Number | Average Value | Number | Average Value | Number | Average Value | |
| LOANS ORIGINATED | 1,136 | $300,805 | 2,502 | $337,699 | 6,503 | $305,838 | 310 | $125,316 | 204 | $2,186,005 | 644 | $287,876 | 2 | $172,500 |
| APPLICATIONS APPROVED, NOT ACCEPTED | 130 | $300,931 | 460 | $377,935 | 936 | $285,567 | 56 | $96,339 | 16 | $653,250 | 100 | $293,100 | 2 | $50,000 |
| APPLICATIONS DENIED | 455 | $302,059 | 842 | $324,305 | 4,575 | $298,263 | 448 | $82,092 | 51 | $905,882 | 645 | $251,588 | 11 | $109,182 |
| APPLICATIONS WITHDRAWN | 303 | $287,191 | 462 | $328,697 | 2,037 | $306,609 | 77 | $161,818 | 22 | $864,409 | 185 | $255,989 | 3 | $240,000 |
| FILES CLOSED FOR INCOMPLETENESS | 144 | $287,944 | 161 | $293,919 | 708 | $301,278 | 40 | $170,650 | 5 | $409,000 | 79 | $249,962 | 0 | $0 |
| Private Mortgage Insurance Companies Aggregated Statistics For Year 2009 (Based on 134 full tracts) | ||||||
| A) Conventional Home Purchase Loans | B) Refinancings | C) Non-occupant Loans on < 5 Family Dwellings (A & B) | ||||
|---|---|---|---|---|---|---|
| Number | Average Value | Number | Average Value | Number | Average Value | |
| LOANS ORIGINATED | 345 | $312,884 | 97 | $311,124 | 4 | $282,250 |
| APPLICATIONS APPROVED, NOT ACCEPTED | 195 | $331,041 | 88 | $345,307 | 1 | $155,000 |
| APPLICATIONS DENIED | 118 | $312,831 | 86 | $346,267 | 2 | $248,000 |
| APPLICATIONS WITHDRAWN | 46 | $290,304 | 34 | $307,412 | 1 | $189,000 |
| FILES CLOSED FOR INCOMPLETENESS | 22 | $384,409 | 6 | $379,833 | 1 | $446,000 |
| Most common first names in Hudson County, NJ among deceased individuals | ||
| Name | Count | Lived (average) |
|---|---|---|
| John | 6,374 | 72.6 years |
| Mary | 5,783 | 79.0 years |
| Joseph | 4,356 | 72.9 years |
| William | 3,598 | 72.0 years |
| Anna | 3,203 | 80.3 years |
| James | 2,715 | 70.0 years |
| Frank | 2,446 | 74.1 years |
| Helen | 2,442 | 77.5 years |
| Margaret | 2,332 | 77.9 years |
| George | 2,226 | 72.7 years |
| Most common last names in Hudson County, NJ among deceased individuals | ||
| Last name | Count | Lived (average) |
|---|---|---|
| Smith | 898 | 72.4 years |
| Rodriguez | 613 | 72.6 years |
| Johnson | 509 | 70.1 years |
| Miller | 500 | 74.3 years |
| Brown | 480 | 72.8 years |
| Williams | 473 | 68.8 years |
| Gonzalez | 471 | 72.5 years |
| Murphy | 382 | 74.8 years |
| Kelly | 373 | 73.8 years |
| Garcia | 366 | 77.5 years |
| Businesses in Hudson County, NJ | ||||
| Name | Count | Name | Count | |
|---|---|---|---|---|
| 7-Eleven | 8 | Kroger | 1 | |
| A&P | 3 | LA Fitness | 1 | |
| ALDO | 2 | La Quinta | 1 | |
| AT&T | 13 | La-Z-Boy | 1 | |
| Ace Hardware | 3 | Lane Furniture | 2 | |
| Advance Auto Parts | 4 | LensCrafters | 1 | |
| Aeropostale | 1 | Little Caesars Pizza | 1 | |
| American Eagle Outfitters | 1 | Lowe's | 2 | |
| Ann Taylor | 1 | Macy's | 1 | |
| Applebee's | 2 | Marriott | 2 | |
| Ashley Furniture | 1 | Marshalls | 3 | |
| Audi | 1 | MasterBrand Cabinets | 16 | |
| AutoZone | 3 | McDonald's | 13 | |
| Avenue | 2 | Motherhood Maternity | 3 | |
| Bakers | 1 | New Balance | 10 | |
| Bally Total Fitness | 1 | New York & Co | 3 | |
| Baskin-Robbins | 11 | Nike | 16 | |
| Bath & Body Works | 2 | Nissan | 1 | |
| Bed Bath & Beyond | 1 | Old Navy | 1 | |
| Ben & Jerry's | 4 | Olive Garden | 1 | |
| Blockbuster | 3 | Outback | 1 | |
| Brookstone | 1 | Outback Steakhouse | 1 | |
| Budget Car Rental | 1 | Panda Express | 1 | |
| Burger King | 11 | Panera Bread | 1 | |
| CVS | 9 | Papa John's Pizza | 4 | |
| Casual Male XL | 1 | Pathmark | 3 | |
| Charlotte Russe | 1 | Payless | 11 | |
| Chevrolet | 1 | Penske | 3 | |
| Chipotle | 1 | PetSmart | 1 | |
| Cinnabon | 2 | Pier 1 Imports | 2 | |
| Cold Stone Creamery | 1 | Pizza Hut | 3 | |
| Curves | 1 | Popeyes | 6 | |
| DHL | 13 | Qdoba Mexican Grill | 1 | |
| Dairy Queen | 1 | Quiznos | 3 | |
| Decora Cabinetry | 2 | RadioShack | 11 | |
| Domino's Pizza | 4 | Ramada | 1 | |
| DressBarn | 2 | Raymour & Flanigan | 2 | |
| Dressbarn | 1 | Red Lobster | 1 | |
| Dunkin Donuts | 45 | Red Roof Inn | 1 | |
| Econo Lodge | 1 | Rite Aid | 15 | |
| Express | 1 | SONIC Drive-In | 1 | |
| Extended Stay America | 1 | Sam's Club | 1 | |
| Fashion Bug | 1 | Sears | 4 | |
| FedEx | 70 | Sephora | 1 | |
| Finish Line | 1 | Sheraton | 1 | |
| Firestone Complete Auto Care | 2 | Spencer Gifts | 1 | |
| Foot Locker | 6 | Sprint Nextel | 5 | |
| Ford | 2 | Staples | 3 | |
| Forever 21 | 1 | Starbucks | 9 | |
| Fredericks Of Hollywood | 1 | Stop & Shop | 2 | |
| GNC | 14 | Subaru | 1 | |
| GameStop | 9 | Subway | 14 | |
| Gap | 1 | T-Mobile | 1 | |
| Gymboree | 1 | T.G.I. Driday's | 1 | |
| H&R Block | 18 | T.J.Maxx | 1 | |
| Hilton | 5 | Taco Bell | 3 | |
| Holiday Inn | 4 | Target | 1 | |
| Hollister Co. | 1 | The Room Place | 2 | |
| Home Depot | 3 | Toyota | 1 | |
| Homestead Studio Suites | 1 | Toys"R"Us | 3 | |
| Honda | 2 | True Value | 8 | |
| Houlihan's | 3 | U-Haul | 6 | |
| Hyatt | 1 | UPS | 104 | |
| Hyundai | 1 | Verizon Wireless | 5 | |
| IHOP | 2 | Victoria's Secret | 1 | |
| JCPenney | 1 | Walgreens | 5 | |
| JoS. A. Bank | 1 | Walmart | 2 | |
| Johnny Rockets | 2 | Wendy's | 5 | |
| Jones New York | 5 | Westin | 1 | |
| Journeys | 1 | Wet Seal | 1 | |
| KFC | 5 | White Castle | 2 | |
| Kmart | 2 | YMCA | 1 | |
| Kohl's | 2 | |||
Hudson County on our top lists:
- #6 on the list of "Top 101 counties with the lowest percentage of residents that keep firearms around their homes"
- #6 on the list of "Top 101 counties with the largest increase in the number of births per 1000 residents 2000-2006 to 2007-2013 (pop 50,000+)"
- #7 on the list of "Top 101 counties with the largest decrease in the number of deaths per 1000 residents 2000-2006 to 2007-2013 (pop. 50,000+)"
- #8 on the list of "Top 101 counties with the highest Nitrogen Dioxide air pollution readings in 2012 (ppm)"
- #18 on the list of "Top 101 counties with the lowest percentage of residents that exercised in the past month"
- #19 on the list of "Top 101 counties with the largest decrease in the number of infant deaths per 1000 residents 2000-2006 to 2007-2013 (pop. 50,000+)"
- #21 on the list of "Top 101 counties with highest percentage of residents voting for Obama (Democrat) in the 2012 Presidential Election (pop. 50,000+)"
- #35 on the list of "Top 101 counties with the lowest number of infant deaths per 1000 residents 2007-2013 (pop. 50,000+)"
- #39 on the list of "Top 101 counties with highest percentage of residents voting for Obama (Democrat) in the 2012 Presidential Election"
- #39 on the list of "Top 101 counties with the most Orthodox congregations"
- #39 on the list of "Top 101 counties with the most Orthodox congregations (pop. 50,000+)"
- #42 on the list of "Top 101 counties with the most Catholic adherents"
- #42 on the list of "Top 101 counties with the most Catholic adherents (pop. 50,000+)"
- #43 on the list of "Top 101 counties with the highest Sulfur Oxides Annual air pollution readings in 2012 (µg/m3)"
- #43 on the list of "Top 101 counties with the most Orthodox adherents"
- #43 on the list of "Top 101 counties with the most Orthodox adherents (pop. 50,000+)"
- #48 on the list of "Top 101 counties with the worst general health status score of residents (1-5), 3 years of data"
- #59 on the list of "Top 101 counties with the most Catholic congregations"
- #60 on the list of "Top 101 counties with the lowest Ozone (1-hour) air pollution readings in 2012 (ppm)"
- #60 on the list of "Top 101 counties with the most Catholic congregations (pop. 50,000+)"