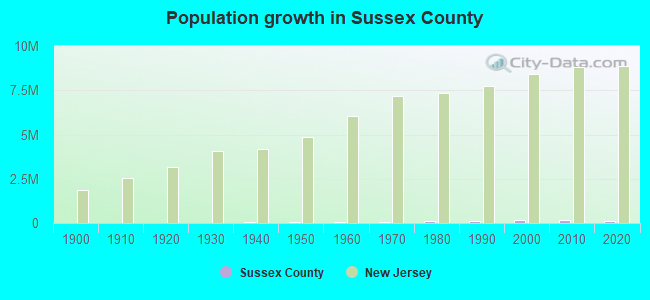
Sussex County, New Jersey (NJ)
County owner-occupied free and clear houses and condos in 2010: 9,666
County owner-occupied houses and condos in 2000: 42,019
Renter-occupied apartments: 8,596 (it was 8,812 in 2000)
| % of renters here: | 17% |
| State: | 35% |
Land area: 521 sq. mi.
Water area: 14.7 sq. mi.
Population density: 280 people per square mile (high).
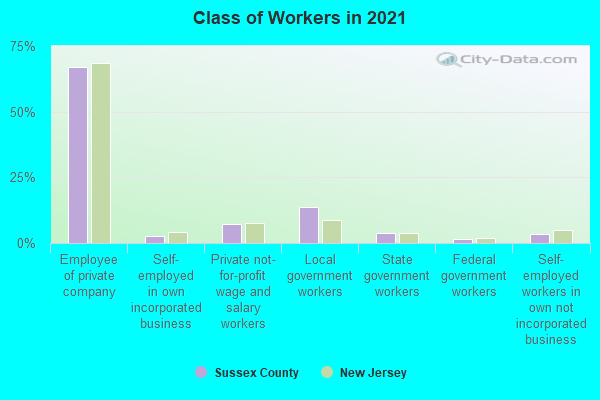
Industries providing employment: Educational, health and social services (23.2%), Professional, scientific, management, administrative, and waste management services (14.1%), Retail trade (11.7%), Manufacturing (10.1%).
Type of workers:
- Private wage or salary: 78%
- Government: 17%
- Self-employed, not incorporated: 5%
- Unpaid family work: 0%
- OSM Map
- General Map
- Google Map
- MSN Map

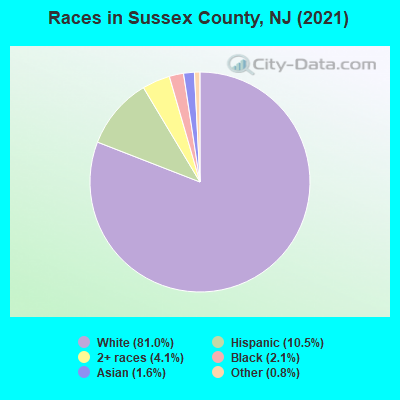
- 117,02580.1%White Non-Hispanic Alone
- 16,88411.6%Hispanic or Latino
- 5,2433.6%Two or more races
- 3,4822.4%Black Non-Hispanic Alone
- 2,4391.7%Asian alone
- 9360.6%Some other race alone
- 750.05%American Indian and Alaska Native alone
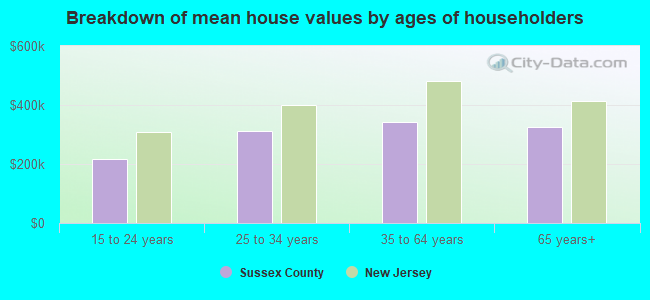
| Median resident age: | 44.0 years |
| New Jersey median age: | 40.4 years |
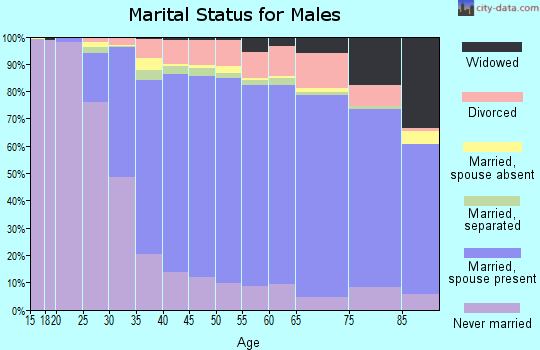
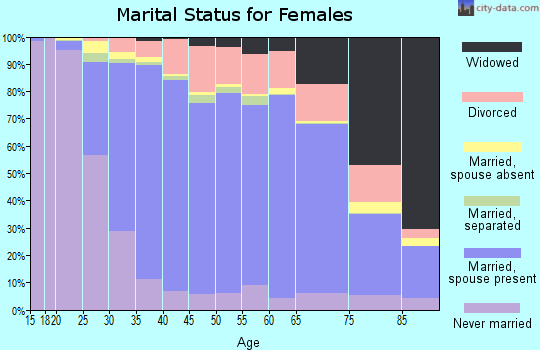
| Males: 73,264 | |
| Females: 72,820 |

 | Hello from the UK (52 replies) |
| Developer Plans Nearly 600 Apartments for Franklin Lakes (92 replies) |
| NJ Covid Vaccine Rollout (1062 replies) |
| Recon - Potential move to NJ (21 replies) |
| NJ Cities/Large Suburbs, Ranked (56 replies) |
| Neighborhoods in other states that are similar to Sussex County neighborhoods? (2 replies) |
| Sussex County: | 2.0 people |
| New Jersey: | 3 people |
Estimated median household income in 2022: $113,640 ($65,266 in 1999)
| This county: | $113,640 |
| New Jersey: | $96,346 |
Median contract rent in 2022 for apartments: $1,359 (lower quartile is $1,099, upper quartile is $1,752)
| This county: | $1359 |
| State: | $1399 |
Estimated median house or condo value in 2022: $352,100 (it was $157,600 in 2000)
| Sussex: | $352,100 |
| New Jersey: | $428,900 |
Mean price in 2022:
Median monthly housing costs for homes and condos with a mortgage: $2,218Detached houses: $383,658
Here: $383,658 State: $537,591 Townhouses or other attached units: $264,605
Here: $264,605 State: $381,113 In 2-unit structures: $319,396
Here: $319,396 State: $444,476 In 3-to-4-unit structures: $222,674
Here: $222,674 State: $457,463 In 5-or-more-unit structures: $176,413
Here: $176,413 State: $368,745 Mobile homes: $37,930
Here: $37,930 State: $119,788
Median monthly housing costs for units without a mortgage: $1,044
Institutionalized population: 1,332
Crime in 2020 (reported by the sheriff's office or county police, not the county total):
- Murders: 0
- Rapes: 0
- Robberies: 0
- Assaults: 0
- Burglaries: 0
- Thefts: 0
- Auto thefts: 0
Crime in 2019 (reported by the sheriff's office or county police, not the county total):
- Murders: 0
- Rapes: 0
- Robberies: 0
- Assaults: 0
- Burglaries: 0
- Thefts: 0
- Auto thefts: 0
Health of residents in Sussex County based on CDC Behavioral Risk Factor Surveillance System Survey Questionnaires from 2003 to 2012:
General health status score of residents in this county from 1 (poor) to 5 (excellent) is 3.6. This is better than average.73.8% of residents exercised in the past month. This is about average.
50.5% of residents smoked 100+ cigarettes in their lives. This is about average.
84.5% of adult residents drank alcohol in the past 30 days. This is more than average.
75.7% of residents visited a dentist within the past year. This is about average.
Average weight of males is 197 pounds. This is about average.
Average weight of females is 155 pounds. This is less than average.
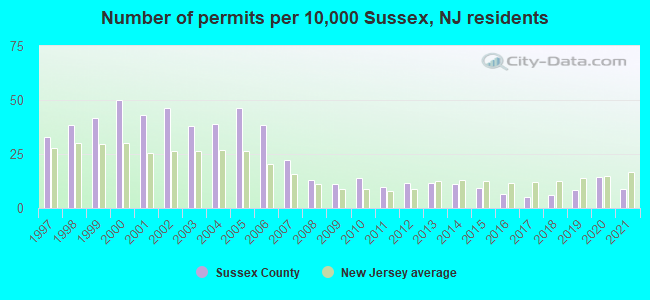
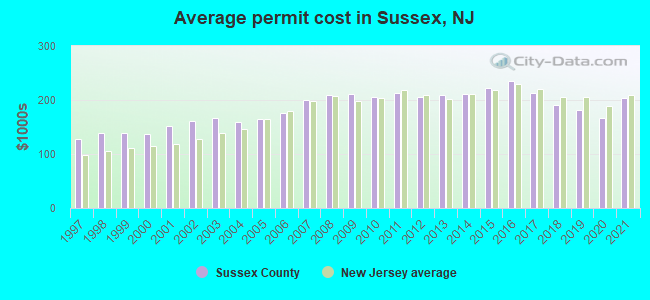
Single-family new house construction building permits:
- 2022: 98 buildings, average cost: $290,500
- 2021: 128 buildings, average cost: $204,200
- 2020: 208 buildings, average cost: $166,700
- 2019: 120 buildings, average cost: $182,400
- 2018: 88 buildings, average cost: $189,500
- 2017: 74 buildings, average cost: $212,500
- 2016: 95 buildings, average cost: $236,100
- 2015: 133 buildings, average cost: $223,200
- 2014: 158 buildings, average cost: $212,100
- 2013: 165 buildings, average cost: $208,900
- 2012: 164 buildings, average cost: $205,800
- 2011: 139 buildings, average cost: $213,100
- 2010: 203 buildings, average cost: $205,800
- 2009: 163 buildings, average cost: $211,300
- 2008: 190 buildings, average cost: $209,900
- 2007: 323 buildings, average cost: $199,900
- 2006: 551 buildings, average cost: $175,800
- 2005: 666 buildings, average cost: $163,900
- 2004: 558 buildings, average cost: $160,400
- 2003: 547 buildings, average cost: $165,500
- 2002: 667 buildings, average cost: $161,700
- 2001: 621 buildings, average cost: $152,300
- 2000: 719 buildings, average cost: $136,600
- 1999: 599 buildings, average cost: $139,000
- 1998: 552 buildings, average cost: $138,600
- 1997: 473 buildings, average cost: $127,200
Median real estate property taxes paid for housing units with mortgages in 2022: $7,940 (2.3%)
Median real estate property taxes paid for housing units with no mortgage in 2022: $7,934 (2.3%)
| Sussex County: | 6.1% |
| New Jersey: | 9.7% |
Median age of residents in 2022: 44.0 years old
(Males: 42.8 years old, Females: 45.3 years old)
(Median age for: White residents: 47.4 years old, Black residents: 40.6 years old, American Indian residents: 66.5 years old, Asian residents: 50.3 years old, Hispanic or Latino residents: 33.4 years old, Other race residents: 34.5 years old)
Area name: Newark, NJ HUD Metro FMR Area
Fair market rent in 2006 for a 1-bedroom apartment in Sussex County is $879 a month.
Fair market rent for a 2-bedroom apartment is $1004 a month.
Fair market rent for a 3-bedroom apartment is $1202 a month.
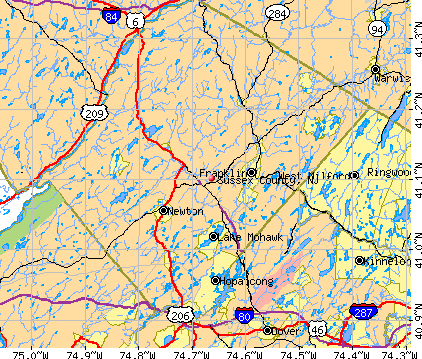
Cities in this county include: Hopatcong, Lake Mohawk, Newton, Franklin, Highland Lake, Stanhope, Hamburg, Ogdensburg, Sussex, Vernon Valley.
Neighboring counties: Jasper County, Indiana  , La Salle County, Illinois , Summit County, Ohio , Van Wert County, Ohio , Wyandot County, Ohio .
| Here: | 4.3% |
| New Jersey: | 4.5% |
Current college students: 6,368
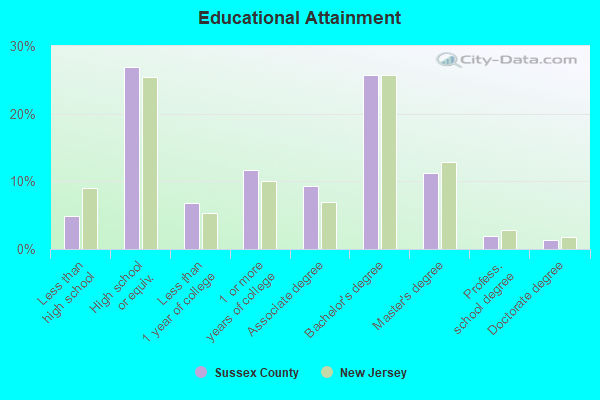
People 25 years of age or older with a high school degree or higher: 95.3%
People 25 years of age or older with a bachelor's degree or higher: 40.2%
Number of foreign born residents: 12,537 (73.4% naturalized citizens)
| Sussex County: | 8.6% |
| Whole state: | 23.5% |
- Year of entry for the foreign-born population
- 2,1732010 or later
- 2,1092000 to 2009
- 2,6621990 to 1999
- 1,3791980 to 1989
- 1,3741970 to 1979
- 3,413Before 1970
Mean travel time to work (commute): # minutes
Percentage of county residents living and working in this county: 95.5%
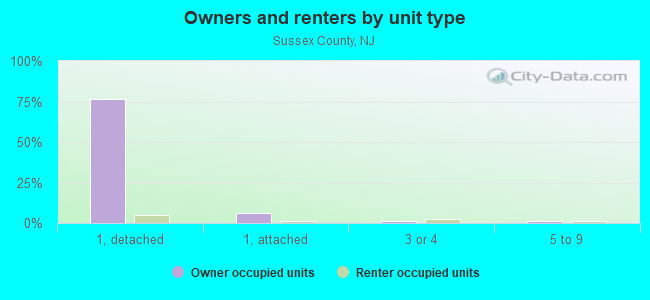
Housing units in structures:
- One, detached: 49,898
- One, attached: 4,059
- Two: 1,646
- 3 or 4: 2,155
- 5 to 9: 1,910
- 10 to 19: 1,528
- 20 to 49: 43
- 50 or more: 1,039
- Mobile homes: 570
Housing units in Sussex County with a mortgage: 33,089 (3,006 second mortgage, 0 home equity loan, 2,882 both second mortgage and home equity loan)
Houses without a mortgage: 2,155
| Here: | 94.3% with mortgage |
| State: | 95.9% with mortgage |
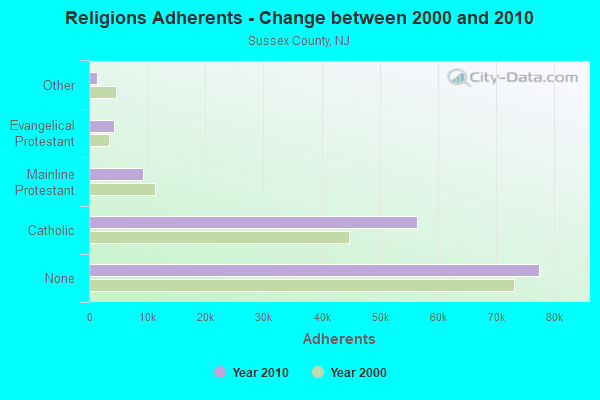
Religion statistics for Sussex County
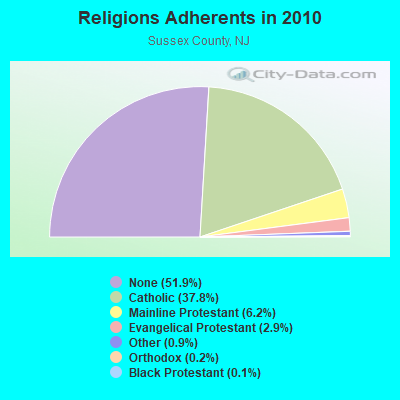
| Religion | Adherents | Congregations |
|---|---|---|
| Catholic | 56,400 | 16 |
| Mainline Protestant | 9,211 | 36 |
| Evangelical Protestant | 4,368 | 31 |
| Other | 1,345 | 12 |
| Orthodox | 300 | 1 |
| Black Protestant | 182 | 1 |
| None | 77,459 | - |
Source: Clifford Grammich, Kirk Hadaway, Richard Houseal, Dale E.Jones, Alexei Krindatch, Richie Stanley and Richard H.Taylor. 2012. 2010 U.S.Religion Census: Religious Congregations & Membership Study. Association of Statisticians of American Religious Bodies. Jones, Dale E., et al. 2002. Congregations and Membership in the United States 2000. Nashville, TN: Glenmary Research Center.
Food Environment Statistics:
| Sussex County: | 1.92 / 10,000 pop. |
| State: | 2.90 / 10,000 pop. |
| This county: | 1.65 / 10,000 pop. |
| New Jersey: | 1.76 / 10,000 pop. |
| Sussex County: | 0.86 / 10,000 pop. |
| New Jersey: | 0.81 / 10,000 pop. |
| This county: | 6.68 / 10,000 pop. |
| State: | 7.15 / 10,000 pop. |
| Sussex County: | 7.8% |
| New Jersey: | 8.3% |
| Sussex County: | 23.7% |
| State: | 23.3% |
| Here: | 15.4% |
| State: | 18.0% |
Agriculture in Sussex County:
Average size of farms: 73 acresAverage value of agricultural products sold per farm: $14,340
Average value of crops sold per acre for harvested cropland: $290.80
The value of nursery, greenhouse, floriculture, and sod as a percentage of the total market value of agricultural products sold: 24.92%
The value of livestock, poultry, and their products as a percentage of the total market value of agricultural products sold: 45.26%
Average total farm production expenses per farm: $18,914
Harvested cropland as a percentage of land in farms: 36.79%
Irrigated harvested cropland as a percentage of land in farms: 2.04%
Average market value of all machinery and equipment per farm: $27,611
The percentage of farms operated by a family or individual: 90.09%
Average age of principal farm operators: 55 years
Average number of cattle and calves per 100 acres of all land in farms: 8.04
Milk cows as a percentage of all cattle and calves: 32.02%
Corn for grain: 1480 harvested acres
All wheat for grain: 122 harvested acres
Soybeans for beans: 103 harvested acres
Vegetables: 870 harvested acres
Land in orchards: 410 acres
Earthquake activity:
Sussex County-area historical earthquake activity is significantly above New Jersey state average. It is 67% smaller than the overall U.S. average.On 8/23/2011 at 17:51:04, a magnitude 5.8 (5.8 MW, Depth: 3.7 mi, Class: Moderate, Intensity: VI - VII) earthquake occurred 281.3 miles away from Sussex County center
On 10/7/1983 at 10:18:46, a magnitude 5.3 (5.1 MB, 5.3 LG, 5.1 ML) earthquake occurred 198.0 miles away from the county center
On 1/16/1994 at 01:49:16, a magnitude 4.6 (4.6 MB, 4.6 LG, Depth: 3.1 mi, Class: Light, Intensity: IV - V) earthquake occurred 89.5 miles away from the county center
On 4/20/2002 at 10:50:47, a magnitude 5.3 (5.3 ML, Depth: 3.0 mi) earthquake occurred 241.1 miles away from the county center
On 4/20/2002 at 10:50:47, a magnitude 5.2 (5.2 MB, 4.2 MS, 5.2 MW, 5.0 MW) earthquake occurred 239.2 miles away from Sussex County center
On 1/16/1994 at 00:42:43, a magnitude 4.2 (4.2 MB, 4.0 LG, Depth: 3.1 mi) earthquake occurred 88.4 miles away from the county center
Magnitude types: regional Lg-wave magnitude (LG), body-wave magnitude (MB), local magnitude (ML), surface-wave magnitude (MS), moment magnitude (MW)
Most recent natural disasters:
- New Jersey Covid-19 Pandemic, Incident Period: January 20, 2020, Major Disaster (Presidential) Declared DR-4488-NJ: March 25, 2020, FEMA Id: 4488, Natural disaster type: Other
- New Jersey Hurricane Sandy, Incident Period: October 26, 2012 to November 08, 2012, Emergency Declared EM-3354: October 28, 2012, FEMA Id: 3354, Natural disaster type: Hurricane
- New Jersey Hurricane Sandy, Incident Period: October 26, 2012 to November 08, 2012, Major Disaster (Presidential) Declared DR-4086: October 30, 2012, FEMA Id: 4086, Natural disaster type: Hurricane
- New Jersey Severe Storm, Incident Period: October 29, 2011, Major Disaster (Presidential) Declared DR-4048: November 30, 2011, FEMA Id: 4048, Natural disaster type: Storm
- New Jersey Remnants of Tropical Storm Lee, Incident Period: September 28, 2011 to October 06, 2011, Major Disaster (Presidential) Declared DR-4039: October 14, 2011, FEMA Id: 4039, Natural disaster type: Tropical Storm
- New Jersey Hurricane Irene, Incident Period: August 27, 2011 to September 05, 2011, Major Disaster (Presidential) Declared DR-4021: August 31, 2011, FEMA Id: 4021, Natural disaster type: Hurricane
- New Jersey Hurricane Irene, Incident Period: August 26, 2011 to September 05, 2011, Emergency Declared EM-3332: August 27, 2011, FEMA Id: 3332, Natural disaster type: Hurricane
- New Jersey Severe Storms and Inland and Coastal Flooding, Incident Period: April 14, 2007 to April 20, 2007, Major Disaster (Presidential) Declared DR-1694: April 26, 2007, FEMA Id: 1694, Natural disaster type: Storm, Flood
- New Jersey Severe Storms and Flooding, Incident Period: June 23, 2006 to July 10, 2006, Major Disaster (Presidential) Declared DR-1653: July 07, 2006, FEMA Id: 1653, Natural disaster type: Storm, Flood
- New Jersey Hurricane Katrina Evacuation, Incident Period: August 29, 2005 to October 01, 2005, Emergency Declared EM-3257: September 19, 2005, FEMA Id: 3257, Natural disaster type: Hurricane
- 13 other natural disasters have been reported since 1953.
The number of natural disasters in Sussex County (23) is greater than the US average (15).
Major Disasters (Presidential) Declared: 14
Emergencies Declared: 9
Causes of natural disasters: Hurricanes: 6, Floods: 5, Storms: 5, Blizzards: 2, Heavy Rains: 2, Water Shortages: 2, Mudslide: 1, Snowstorm: 1, Tornado: 1, Tropical Depression: 1, Tropical Storm: 1, Wind: 1, Other: 3 (Note: some incidents may be assigned to more than one category).
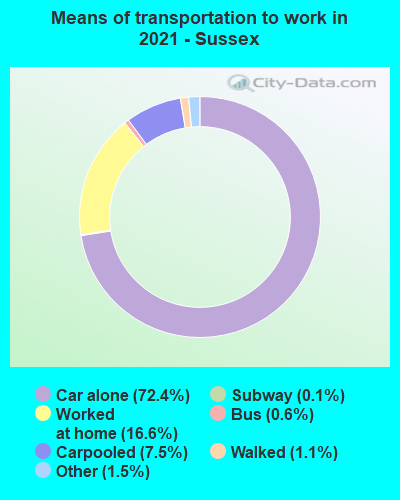
Means of transportation to work:
- Drove a car alone: 31,919 (65.2%)
- Carpooled: 3,966 (8.1%)
- Bus: 128 (0.3%)
- Subway or elevated rail: 38 (0.1%)
- Long-distance train or commuter rail: 6 (0.0%)
- Taxicab, motorcycle, or other means: 839 (1.7%)
- Bicycle: 32 (0.1%)
- Walked: 824 (1.7%)
- Worked at home: 11,937 (24.4%)

- Health care and social assistance (18%)
- Educational services (15%)
- Retail trade (11%)
- Manufacturing (7%)
- Professional, scientific, and technical services (7%)
- Other services, except public administration (5%)
- Finance and insurance (4%)
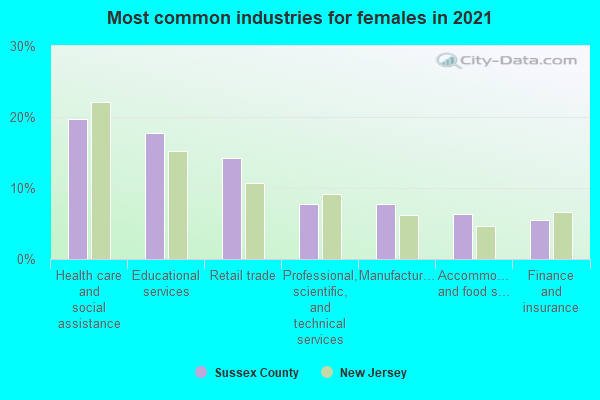
- Health care and social assistance (21%)
- Educational services (17%)
- Retail trade (12%)
- Manufacturing (9%)
- Professional, scientific, and technical services (8%)
- Other services, except public administration (6%)
- Finance and insurance (5%)
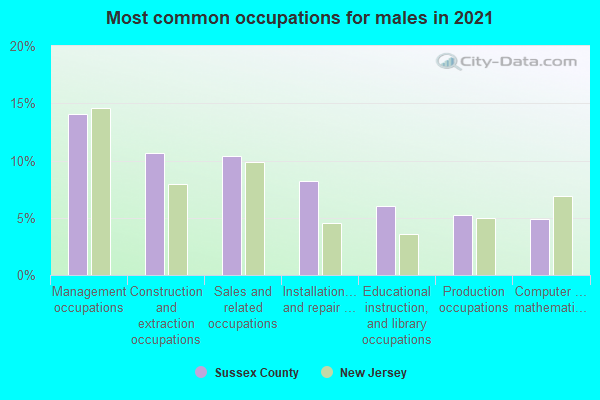
- Management occupations (16%)
- Construction and extraction occupations (12%)
- Sales and related occupations (10%)
- Installation, maintenance, and repair occupations (7%)
- Office and administrative support occupations (7%)
- Production occupations (6%)
- Business and financial operations occupations (5%)
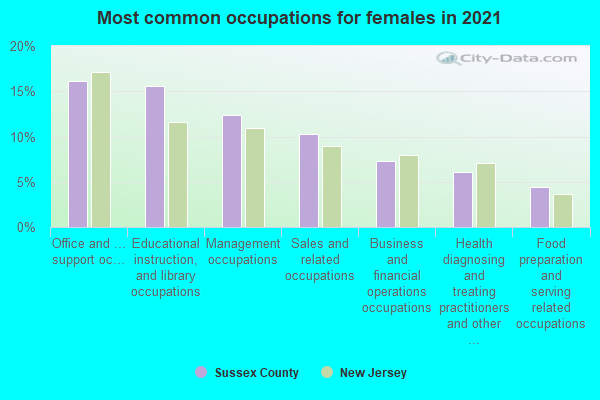
- Office and administrative support occupations (19%)
- Educational instruction, and library occupations (13%)
- Management occupations (12%)
- Sales and related occupations (10%)
- Business and financial operations occupations (7%)
- Health diagnosing and treating practitioners and other technical occupations (7%)
- Healthcare support occupations (5%)
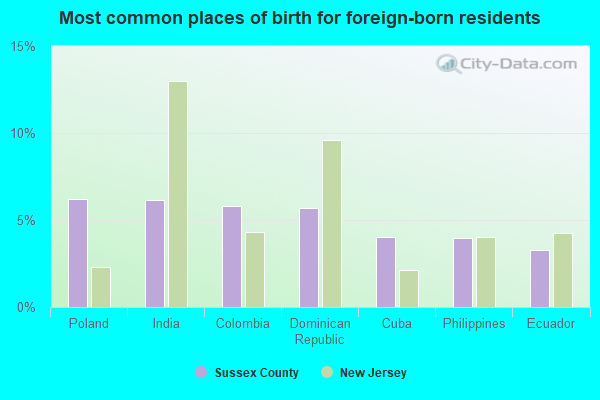
- Colombia (8%)
- Dominican Republic (6%)
- Poland (5%)
- India (5%)
- Cuba (4%)
- Ecuador (4%)
- Germany (3%)
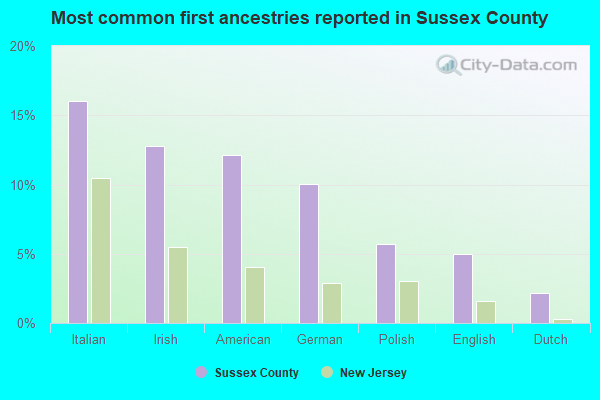
- Italian (16%)
- Irish (12%)
- German (10%)
- American (10%)
- Polish (5%)
- English (5%)
- Dutch (2%)
People in group quarters in Sussex County, New Jersey in 2010:
- 1,093 people in nursing facilities/skilled-nursing facilities
- 174 people in local jails and other municipal confinement facilities
- 170 people in group homes intended for adults
- 152 people in other noninstitutional facilities
- 53 people in residential treatment centers for juveniles (non-correctional)
- 44 people in emergency and transitional shelters (with sleeping facilities) for people experiencing homelessness
- 31 people in residential treatment centers for adults
- 13 people in workers' group living quarters and job corps centers
- 12 people in group homes for juveniles (non-correctional)
People in group quarters in Sussex County, New Jersey in 2000:
- 1,046 people in nursing homes
- 166 people in local jails and other confinement facilities (including police lockups)
- 148 people in homes for the mentally retarded
- 92 people in other noninstitutional group quarters
- 81 people in other group homes
- 70 people in homes for the mentally ill
- 29 people in religious group quarters
- 26 people in homes or halfway houses for drug/alcohol abuse
- 18 people in short-term care, detention or diagnostic centers for delinquent children
- 10 people in unknown juvenile institutions
7.57% of this county's 2021 resident taxpayers lived in other counties in 2020 ($85,868 average adjusted gross income)
| Here: | 7.57% |
| New Jersey average: | 6.70% |
10 or fewer of this county's residents moved from foreign countries.
5.40% relocated from other counties in New Jersey ($60,598 average AGI)
2.17% relocated from other states ($25,270 average AGI)
Sussex County: 2.17% New Jersey average: 2.98%
Top counties from which taxpayers relocated into this county between 2020 and 2021:
| from Morris County, NJ | |
| from Passaic County, NJ | |
| from Bergen County, NJ | |
| from Essex County, NJ | |
| from Hudson County, NJ | |
| from Warren County, NJ | |
| from Orange County, NY |
6.59% of this county's 2020 resident taxpayers moved to other counties in 2021 ($86,516 average adjusted gross income)
| Here: | 6.59% |
| New Jersey average: | 7.02% |
10 or fewer of this county's residents moved to foreign countries.
3.28% relocated to other counties in New Jersey ($40,191 average AGI)
3.31% relocated to other states ($46,324 average AGI)
Sussex County: 3.31% New Jersey average: 3.32%
Top counties to which taxpayers relocated from this county between 2020 and 2021:
| to Morris County, NJ | |
| to Warren County, NJ | |
| to Passaic County, NJ | |
| to Bergen County, NJ | |
| to Pike County, PA | |
| to Ocean County, NJ | |
| to Hudson County, NJ |
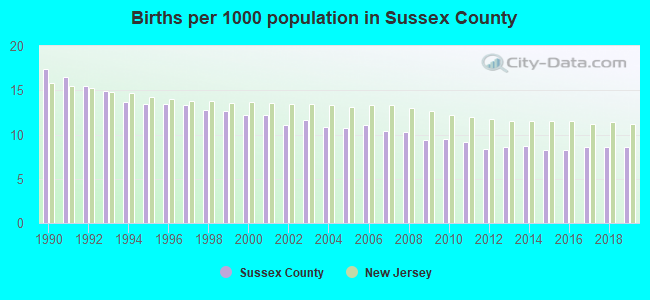
Births per 1000 population from 1990 to 1999: 14.4
Births per 1000 population from 2000 to 2009: 11.0
Births per 1000 population from 2010 to 2022: 7.4
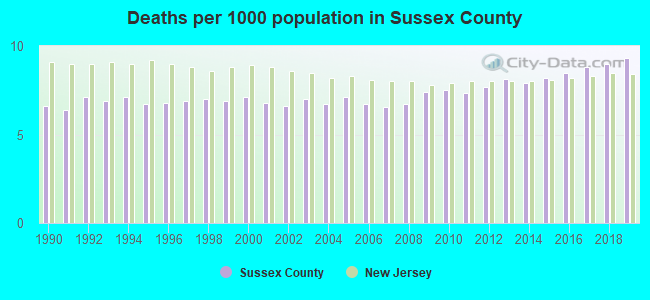
Deaths per 1000 population from 1990 to 1999: 6.8
Deaths per 1000 population from 2000 to 2009: 6.9
Deaths per 1000 population from 2010 to 2020: 8.5
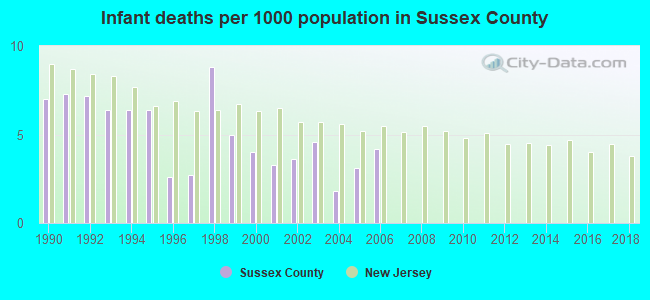
Infant deaths per 1000 live births from 1990 to 1999: 6.0
Infant deaths per 1000 live births from 2000 to 2006: 3.5
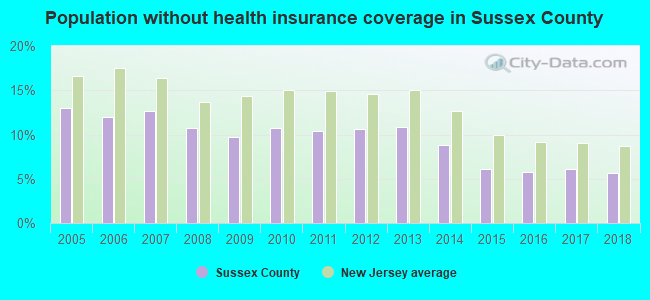
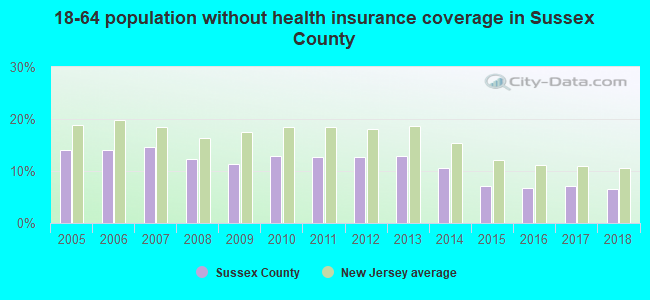
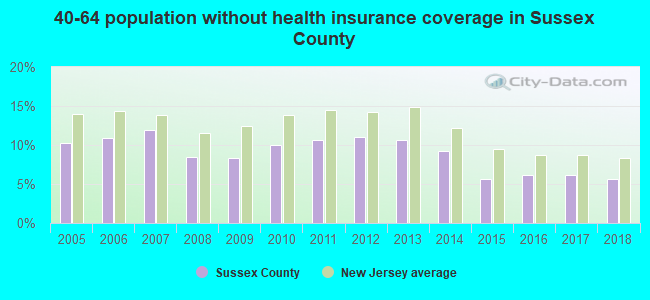
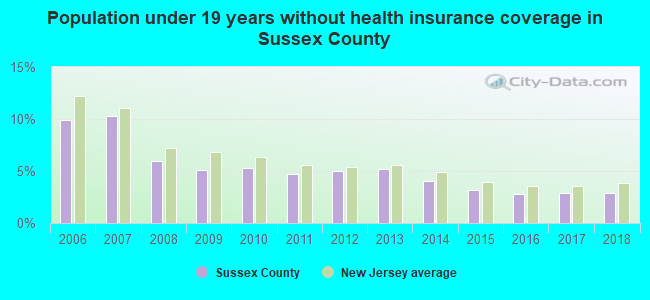
Persons under 19 years old without health insurance coverage in 2018: 2.9%
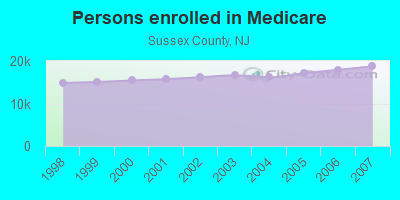
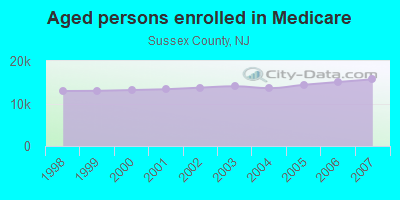
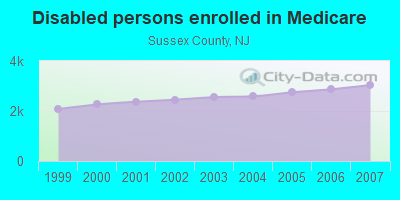
Persons enrolled in hospital insurance and/or supplemental medical insurance (Medicare) in July 1, 2007: 18,737 (15,701 aged, 3,036 disabled)
Children under 18 without health insurance coverage in 2007: 2,523 (6%)
Most common underlying causes of death in Sussex County, New Jersey in 1999 - 2019:
- Atherosclerotic heart disease (1,947)
- Bronchus or lung, unspecified - Malignant neoplasms (1,504)
- Acute myocardial infarction, unspecified (1,207)
- Chronic obstructive pulmonary disease, unspecified (905)
- Alzheimer disease, unspecified (811)
- Atherosclerotic cardiovascular disease, so described (797)
- Unspecified dementia (635)
- Stroke, not specified as haemorrhage or infarction (573)
- Breast, unspecified - Malignant neoplasms (484)
- Colon, unspecified - Malignant neoplasms (432)
Population without health insurance coverage in 2000: 9%
Children under 18 without health insurance coverage in 2000: 6%
Short term general hospital admissions per 100,000 population in 2004: 7,326
Short term general hospital beds per 100,000 population in 2004: 96
Emergency room visits per 100,000 population in 2004: 20,525
General practice office based MDs per 100,000 population in 2005: 991
Medical specialist MDs per 100,000 population in 2005: 673
Dentists per 100,000 population in 1998: 18
Total births per 100,000 population, July 2005 - July 2006 : 48
Total deaths per 100,000 population, July 2005 - July 2006: 78
Limited-service eating places per 100,000 population in 2005 : 18
Beer, wine & liquor stores per 100,000 population in 2005: 1
EPA green book nonattainment status in 2004-2006: 1
Suicides per 1,000,000 population from 2000 to 2006: 75.0. This is more than state average.
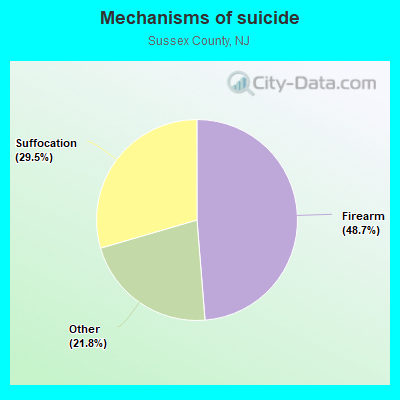
- Firearm - 36.5
- Suffocation - 22.1
- Other - 16.3
Household type by relationship:
Households: 146,084- Male householders: 30,228 (5,843 living alone), Female householders: 28,657 (6,537 living alone)
33,258 spouses (32,750 opposite-sex spouses), 5,047 unmarried partners, (4,839 opposite-sex unmarried partners), 39,504 children (37,085 natural, 501 adopted, 1,918 stepchildren), 1,731 grandchildren, 520 brothers or sisters, 948 parents, 0 foster children, 1,645 other relatives, 2,671 non-relatives
- In group quarters: 1,875
Size of family households: 19,201 2-persons, 9,319 3-persons, 9,319 4-persons, 3,309 5-persons, 809 6-persons, 190 7-or-more-persons.
Size of nonfamily households: 12,380 1-person, 3,932 2-persons, 295 3-persons, 82 4-persons, 49 5-persons.
19,834 married couples with children.
5,766 single-parent households (1,320 men, 4,446 women).
89.2% of residents of Sussex speak English at home.
5.6% of residents speak Spanish at home (68% speak English very well, 19% speak English well, 8% speak English not well, 5% don't speak English at all).
3.5% of residents speak other Indo-European language at home (81% speak English very well, 15% speak English well, 4% speak English not well).
0.9% of residents speak Asian or Pacific Island language at home (69% speak English very well, 25% speak English well, 6% speak English not well).
0.5% of residents speak other language at home (81% speak English very well, 14% speak English well, 5% speak English not well).
In fiscal year 2004:
Federal Government expenditure: $519,053,000 ($3,410 per capita)
Department of Defense expenditure: $23,051,000
Federal direct payments to individuals for retirement and disability: $282,918,000
Federal other direct payments to individuals: $122,690,000
Federal direct payments not to individuals: $424,000
Federal grants: $63,374,000
Federal procurement contracts: $24,369,000 ($16,285,000 Department of Defense)
Federal salaries and wages: $25,278,000 ($1,100,000 Department of Defense)
Federal Government direct loans: $1,727,000
Federal guaranteed/insured loans: $113,857,000
Federal Government insurance: $48,204,000
Population change from April 1, 2000 to July 1, 2005:
Births: 8,902| Here: | 58 per 1000 residents |
| State: | 69 per 1000 residents |
Deaths: 5,258
| Here: | 34 per 1000 residents |
| State: | 44 per 1000 residents |
Net international migration: +819
| Here: | +5 per 1000 residents |
| State: | +33 per 1000 residents |
Net internal migration: +4,664
| Here: | |
| State: |
Total withdrawal of fresh water for public supply: 6.16 millions of gallons per day (84% from ground, 16% from surface)
| Here: | 7.0 |
| State: | 6.8 |
| Here: | 4.0 |
| State: | 3.9 |
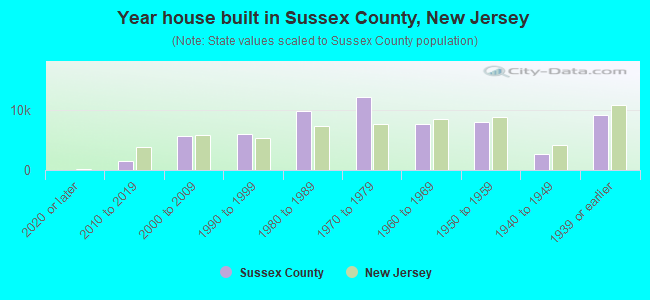
- Year house built in Sussex County, New Jersey
- 2722020 or later
- 1,1522010 to 2019
- 6,1382000 to 2009
- 6,5151990 to 1999
- 8,3501980 to 1989
- 11,2911970 to 1979
- 7,7621960 to 1969
- 8,7371950 to 1959
- 3,9231940 to 1949
- 8,7081939 or earlier
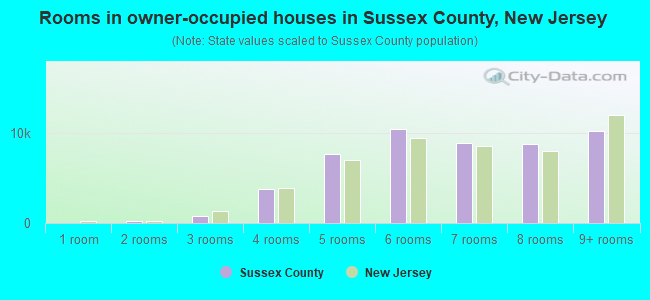
- Rooms in owner-occupied houses in Sussex County, New Jersey
- 5161 room
- 5112 rooms
- 1,7343 rooms
- 4,0734 rooms
- 5,7255 rooms
- 8,1936 rooms
- 8,6607 rooms
- 8,6218 rooms
- 12,0169+ rooms
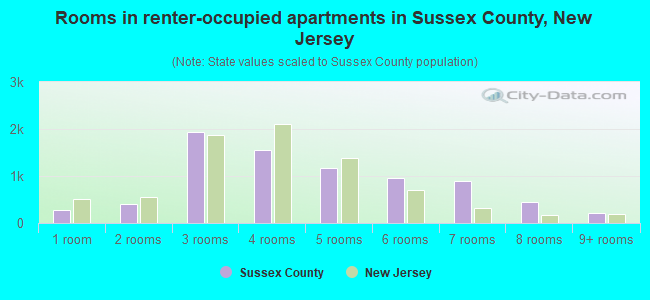
- Rooms in renter-occupied apartments in Sussex County, New Jersey
- 2141 room
- 6572 rooms
- 2,4423 rooms
- 2,2074 rooms
- 1,2325 rooms
- 6166 rooms
- 9027 rooms
- 4248 rooms
- 1429+ rooms
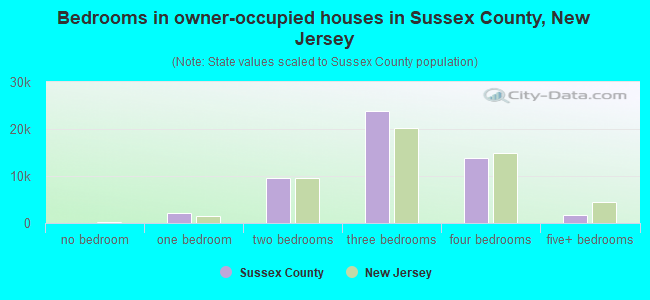
- Bedrooms in owner-occupied houses in Sussex County, New Jersey
- 516no bedroom
- 2,2001 bedroom
- 9,1652 bedrooms
- 22,3813 bedrooms
- 13,8194 bedrooms
- 1,9685+ bedrooms
- Bedrooms in renter-occupied apartments in Sussex County, New Jersey
- 284no bedroom
- 2,9101 bedroom
- 3,9782 bedrooms
- 1,2863 bedrooms
- 3784 bedrooms
- 05+ bedrooms
- Cars and other vehicles available in Sussex County in owner-occupied houses/condos
- 470no vehicle
- 12,1731 vehicle
- 21,9012 vehicles
- 10,1073 vehicles
- 4,2884 vehicles
- 1,1105+ vehicles
- Cars and other vehicles available in Sussex County in renter-occupied apartments
- 1,005no vehicle
- 3,9071 vehicle
- 2,4432 vehicles
- 1,1953 vehicles
- 2864 vehicles
- 05+ vehicles
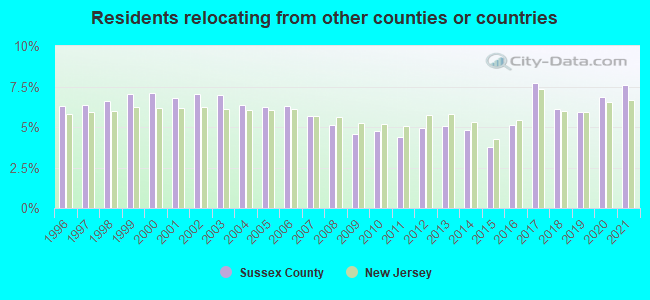
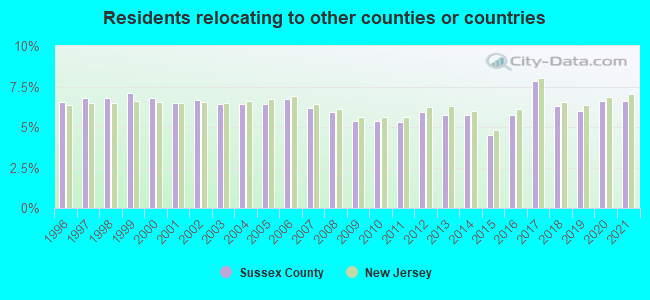
91.2% of Sussex County residents lived in the same house 1 years ago.
Out of people who lived in different houses, 32% lived in this county.
Out of people who lived in different counties, 74% lived in New Jersey.
| Sussex County: | 91.2% |
| State average: | 90.4% |
Place of birth for U.S.-born residents:
- This state: 102,496
- Other state: 28,669
- Northeast: 22,408
- Midwest: 1,788
- South: 2,561
- West: 1,912
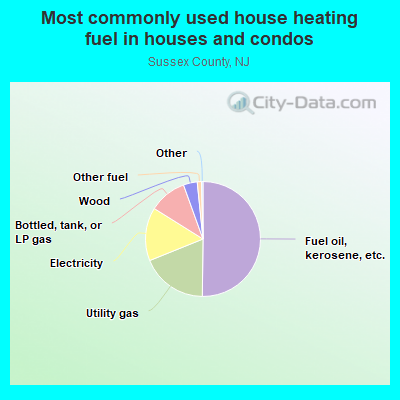
- 53.6%Fuel oil, kerosene, etc.
- 20.0%Utility gas
- 11.9%Bottled, tank, or LP gas
- 10.3%Electricity
- 2.6%Wood
- 0.7%Other fuel
- 0.4%Solar energy
- 0.3%Coal or coke
- 0.2%No fuel used
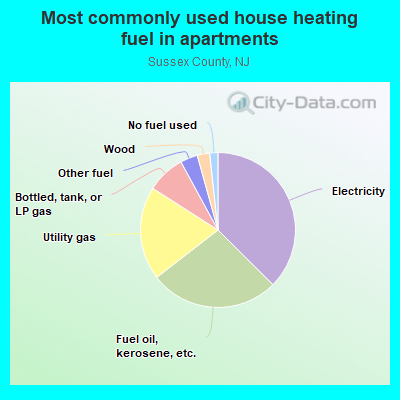
- 30.5%Fuel oil, kerosene, etc.
- 30.5%Utility gas
- 26.9%Electricity
- 9.6%Bottled, tank, or LP gas
- 1.8%Wood
- 0.7%No fuel used
Private vs. public school enrollment:
| Here: | 14.1% |
| New Jersey: | 12.3% |
| Here: | 5.7% |
| New Jersey: | 13.1% |
| Here: | 41.4% |
| New Jersey: | 33.2% |

Sussex County government finances - Expenditure in 2018:
- Assistance and Subsidies - Public Welfare, Federal Categorical Assistance Programs: $1,345,000
Public Welfare, Cash Assistance Programs - Other: $930,000
- Bond Funds - Cash and Securities: $49,361,000
Cash and Securities: $20,965,000
- Charges - Other: $17,924,000
Higher Education - Other: $14,338,000
Higher Education - Other: $13,767,000
Solid Waste Management: $10,688,000
Solid Waste Management: $10,657,000
Sewerage: $6,134,000
Sewerage: $5,921,000
Other: $4,120,000
Elementary and Secondary Education - Other: $1,434,000
Elementary and Secondary Education School Lunch: $356,000
Elementary and Secondary Education School Lunch: $297,000
Elementary and Secondary Education - Other: $159,000
- Construction - Regular Highways: $9,092,000
General - Other: $4,075,000
Regular Highways: $3,790,000
Elementary and Secondary Education: $2,302,000
Other Higher Education: $2,110,000
General - Other: $1,850,000
Elementary and Secondary Education: $1,398,000
General Public Buildings: $306,000
Sewerage: $262,000
Central Staff Services: $241,000
Judicial and Legal Services: $182,000
Correctional Institutions: $170,000
Police Protection: $81,000
Libraries: $68,000
- Current Operations - General - Other: $59,586,000
General - Other: $28,695,000
Other Higher Education: $20,142,000
Elementary and Secondary Education: $14,689,000
Elementary and Secondary Education: $14,623,000
Correctional Institutions: $8,696,000
Correctional Institutions: $8,383,000
Regular Highways: $6,980,000
Police Protection: $6,752,000
Public Welfare Institutions: $6,376,000
Judicial and Legal Services: $6,241,000
Judicial and Legal Services: $5,760,000
Health - Other: $5,614,000
Public Welfare - Other: $5,137,000
Regular Highways: $5,071,000
Solid Waste Management: $4,909,000
Libraries: $4,780,000
Libraries: $4,361,000
Health - Other: $3,447,000
Public Welfare - Other: $3,301,000
Sewerage: $3,210,000
Central Staff Services: $2,819,000
Police Protection: $2,509,000
General Public Buildings: $2,359,000
General Public Buildings: $2,317,000
Transit Utilities: $2,185,000
Central Staff Services: $1,624,000
Financial Administration: $1,615,000
Other Higher Education: $1,470,000
Transit Utilities: $1,336,000
Financial Administration: $1,197,000
Hospitals: $814,000
Natural Resources - Other: $784,000
Local Fire Protection: $517,000
Corrections - Other: $364,000
Corrections - Other: $339,000
Local Fire Protection: $274,000
Natural Resources - Other: $272,000
Protective Inspection and Regulation - Other: $123,000
Protective Inspection and Regulation - Other: $98,000
Solid Waste Management: $78,000
Parks and Recreation: $9,000
Parks and Recreation: $3,000
- Federal Intergovernmental - Education: $3,057,000
Education: $2,660,000
Transit Utilities: $431,000
- General - Interest on Debt: $6,227,000
Interest on Debt: $4,675,000
- Intergovernmental to Local - Other - Other Higher Education: $69,000
- Intergovernmental to State - Hospitals: $772,000
Elementary and Secondary Education: $4,000
Elementary and Secondary Education: $4,000
- Local Intergovernmental - Education: $5,756,000
Education: $5,582,000
Highways: $345,000
- Long Term Debt - Beginning Outstanding - Unspecified Public Purpose: $109,460,000
Outstanding Unspecified Public Purpose: $98,019,000
Beginning Outstanding - Unspecified Public Purpose: $31,819,000
Retired Unspecified Public Purpose: $24,003,000
Beginning Outstanding - Public Debt for Private Purpose: $23,981,000
Outstanding Nonguaranteed - Industrial Revenue: $21,541,000
Retired Unspecified Public Purpose: $11,441,000
Outstanding Unspecified Public Purpose: $7,816,000
Retired Nonguaranteed - Public Debt for Private Purpose: $2,440,000
- Miscellaneous - General Revenue - Other: $10,672,000
Interest Earnings: $7,615,000
General Revenue - Other: $3,464,000
Fines and Forfeits: $1,284,000
Interest Earnings: $1,059,000
Fines and Forfeits: $527,000
Rents: $255,000
Rents: $226,000
- Other Capital Outlay - Sewerage: $880,000
Regular Highways: $560,000
Solid Waste Management: $385,000
Elementary and Secondary Education: $224,000
General - Other: $203,000
Police Protection: $85,000
Libraries: $50,000
Correctional Institutions: $48,000
Elementary and Secondary Education: $18,000
Judicial and Legal Services: $7,000
Financial Administration: $3,000
General Public Building: $2,000
- Other Funds - Cash and Securities: $101,064,000
Cash and Securities: $42,301,000
- Sinking Funds - Cash and Securities: $24,413,000
Cash and Securities: $18,999,000
- State Intergovernmental - Education: $9,152,000
Education: $7,843,000
Health and Hospitals: $7,390,000
Highways: $6,669,000
Public Welfare: $4,340,000
Other: $3,916,000
Other: $2,764,000
Health and Hospitals: $2,107,000
Transit Utilities: $1,403,000
Public Welfare: $1,397,000
General Local Government Support: $226,000
General Local Government Support: $124,000
- Tax - Property: $98,655,000
Property: $94,911,000
Other License: $10,000
- Total Salaries and Wages: $38,330,000
: $17,601,000
Sussex County government finances - Revenue in 2018:
- Assistance and Subsidies - Public Welfare, Federal Categorical Assistance Programs: $1,345,000
Public Welfare, Cash Assistance Programs - Other: $930,000
- Bond Funds - Cash and Securities: $49,361,000
Cash and Securities: $20,965,000
- Charges - Other: $17,924,000
Higher Education - Other: $14,338,000
Higher Education - Other: $13,767,000
Solid Waste Management: $10,688,000
Solid Waste Management: $10,657,000
Sewerage: $6,134,000
Sewerage: $5,921,000
Other: $4,120,000
Elementary and Secondary Education - Other: $1,434,000
Elementary and Secondary Education School Lunch: $356,000
Elementary and Secondary Education School Lunch: $297,000
Elementary and Secondary Education - Other: $159,000
- Construction - Regular Highways: $9,092,000
General - Other: $4,075,000
Regular Highways: $3,790,000
Elementary and Secondary Education: $2,302,000
Other Higher Education: $2,110,000
General - Other: $1,850,000
Elementary and Secondary Education: $1,398,000
General Public Buildings: $306,000
Sewerage: $262,000
Central Staff Services: $241,000
Judicial and Legal Services: $182,000
Correctional Institutions: $170,000
Police Protection: $81,000
Libraries: $68,000
- Current Operations - General - Other: $59,586,000
General - Other: $28,695,000
Other Higher Education: $20,142,000
Elementary and Secondary Education: $14,689,000
Elementary and Secondary Education: $14,623,000
Correctional Institutions: $8,696,000
Correctional Institutions: $8,383,000
Regular Highways: $6,980,000
Police Protection: $6,752,000
Public Welfare Institutions: $6,376,000
Judicial and Legal Services: $6,241,000
Judicial and Legal Services: $5,760,000
Health - Other: $5,614,000
Public Welfare - Other: $5,137,000
Regular Highways: $5,071,000
Solid Waste Management: $4,909,000
Libraries: $4,780,000
Libraries: $4,361,000
Health - Other: $3,447,000
Public Welfare - Other: $3,301,000
Sewerage: $3,210,000
Central Staff Services: $2,819,000
Police Protection: $2,509,000
General Public Buildings: $2,359,000
General Public Buildings: $2,317,000
Transit Utilities: $2,185,000
Central Staff Services: $1,624,000
Financial Administration: $1,615,000
Other Higher Education: $1,470,000
Transit Utilities: $1,336,000
Financial Administration: $1,197,000
Hospitals: $814,000
Natural Resources - Other: $784,000
Local Fire Protection: $517,000
Corrections - Other: $364,000
Corrections - Other: $339,000
Local Fire Protection: $274,000
Natural Resources - Other: $272,000
Protective Inspection and Regulation - Other: $123,000
Protective Inspection and Regulation - Other: $98,000
Solid Waste Management: $78,000
Parks and Recreation: $9,000
Parks and Recreation: $3,000
- Federal Intergovernmental - Education: $3,057,000
Education: $2,660,000
Transit Utilities: $431,000
- General - Interest on Debt: $6,227,000
Interest on Debt: $4,675,000
- Intergovernmental to Local - Other - Other Higher Education: $69,000
- Intergovernmental to State - Hospitals: $772,000
Elementary and Secondary Education: $4,000
Elementary and Secondary Education: $4,000
- Local Intergovernmental - Education: $5,756,000
Education: $5,582,000
Highways: $345,000
- Long Term Debt - Beginning Outstanding - Unspecified Public Purpose: $109,460,000
Outstanding Unspecified Public Purpose: $98,019,000
Beginning Outstanding - Unspecified Public Purpose: $31,819,000
Retired Unspecified Public Purpose: $24,003,000
Beginning Outstanding - Public Debt for Private Purpose: $23,981,000
Outstanding Nonguaranteed - Industrial Revenue: $21,541,000
Retired Unspecified Public Purpose: $11,441,000
Outstanding Unspecified Public Purpose: $7,816,000
Retired Nonguaranteed - Public Debt for Private Purpose: $2,440,000
- Miscellaneous - General Revenue - Other: $10,672,000
Interest Earnings: $7,615,000
General Revenue - Other: $3,464,000
Fines and Forfeits: $1,284,000
Interest Earnings: $1,059,000
Fines and Forfeits: $527,000
Rents: $255,000
Rents: $226,000
- Other Capital Outlay - Sewerage: $880,000
Regular Highways: $560,000
Solid Waste Management: $385,000
Elementary and Secondary Education: $224,000
General - Other: $203,000
Police Protection: $85,000
Libraries: $50,000
Correctional Institutions: $48,000
Elementary and Secondary Education: $18,000
Judicial and Legal Services: $7,000
Financial Administration: $3,000
General Public Building: $2,000
- Other Funds - Cash and Securities: $101,064,000
Cash and Securities: $42,301,000
- Sinking Funds - Cash and Securities: $24,413,000
Cash and Securities: $18,999,000
- State Intergovernmental - Education: $9,152,000
Education: $7,843,000
Health and Hospitals: $7,390,000
Highways: $6,669,000
Public Welfare: $4,340,000
Other: $3,916,000
Other: $2,764,000
Health and Hospitals: $2,107,000
Transit Utilities: $1,403,000
Public Welfare: $1,397,000
General Local Government Support: $226,000
General Local Government Support: $124,000
- Tax - Property: $98,655,000
Property: $94,911,000
Other License: $10,000
- Total Salaries and Wages: $38,330,000
: $17,601,000
Sussex County government finances - Debt in 2018:
- Assistance and Subsidies - Public Welfare, Federal Categorical Assistance Programs: $1,345,000
Public Welfare, Cash Assistance Programs - Other: $930,000
- Bond Funds - Cash and Securities: $49,361,000
Cash and Securities: $20,965,000
- Charges - Other: $17,924,000
Higher Education - Other: $14,338,000
Higher Education - Other: $13,767,000
Solid Waste Management: $10,688,000
Solid Waste Management: $10,657,000
Sewerage: $6,134,000
Sewerage: $5,921,000
Other: $4,120,000
Elementary and Secondary Education - Other: $1,434,000
Elementary and Secondary Education School Lunch: $356,000
Elementary and Secondary Education School Lunch: $297,000
Elementary and Secondary Education - Other: $159,000
- Construction - Regular Highways: $9,092,000
General - Other: $4,075,000
Regular Highways: $3,790,000
Elementary and Secondary Education: $2,302,000
Other Higher Education: $2,110,000
General - Other: $1,850,000
Elementary and Secondary Education: $1,398,000
General Public Buildings: $306,000
Sewerage: $262,000
Central Staff Services: $241,000
Judicial and Legal Services: $182,000
Correctional Institutions: $170,000
Police Protection: $81,000
Libraries: $68,000
- Current Operations - General - Other: $59,586,000
General - Other: $28,695,000
Other Higher Education: $20,142,000
Elementary and Secondary Education: $14,689,000
Elementary and Secondary Education: $14,623,000
Correctional Institutions: $8,696,000
Correctional Institutions: $8,383,000
Regular Highways: $6,980,000
Police Protection: $6,752,000
Public Welfare Institutions: $6,376,000
Judicial and Legal Services: $6,241,000
Judicial and Legal Services: $5,760,000
Health - Other: $5,614,000
Public Welfare - Other: $5,137,000
Regular Highways: $5,071,000
Solid Waste Management: $4,909,000
Libraries: $4,780,000
Libraries: $4,361,000
Health - Other: $3,447,000
Public Welfare - Other: $3,301,000
Sewerage: $3,210,000
Central Staff Services: $2,819,000
Police Protection: $2,509,000
General Public Buildings: $2,359,000
General Public Buildings: $2,317,000
Transit Utilities: $2,185,000
Central Staff Services: $1,624,000
Financial Administration: $1,615,000
Other Higher Education: $1,470,000
Transit Utilities: $1,336,000
Financial Administration: $1,197,000
Hospitals: $814,000
Natural Resources - Other: $784,000
Local Fire Protection: $517,000
Corrections - Other: $364,000
Corrections - Other: $339,000
Local Fire Protection: $274,000
Natural Resources - Other: $272,000
Protective Inspection and Regulation - Other: $123,000
Protective Inspection and Regulation - Other: $98,000
Solid Waste Management: $78,000
Parks and Recreation: $9,000
Parks and Recreation: $3,000
- Federal Intergovernmental - Education: $3,057,000
Education: $2,660,000
Transit Utilities: $431,000
- General - Interest on Debt: $6,227,000
Interest on Debt: $4,675,000
- Intergovernmental to Local - Other - Other Higher Education: $69,000
- Intergovernmental to State - Hospitals: $772,000
Elementary and Secondary Education: $4,000
Elementary and Secondary Education: $4,000
- Local Intergovernmental - Education: $5,756,000
Education: $5,582,000
Highways: $345,000
- Long Term Debt - Beginning Outstanding - Unspecified Public Purpose: $109,460,000
Outstanding Unspecified Public Purpose: $98,019,000
Beginning Outstanding - Unspecified Public Purpose: $31,819,000
Retired Unspecified Public Purpose: $24,003,000
Beginning Outstanding - Public Debt for Private Purpose: $23,981,000
Outstanding Nonguaranteed - Industrial Revenue: $21,541,000
Retired Unspecified Public Purpose: $11,441,000
Outstanding Unspecified Public Purpose: $7,816,000
Retired Nonguaranteed - Public Debt for Private Purpose: $2,440,000
- Miscellaneous - General Revenue - Other: $10,672,000
Interest Earnings: $7,615,000
General Revenue - Other: $3,464,000
Fines and Forfeits: $1,284,000
Interest Earnings: $1,059,000
Fines and Forfeits: $527,000
Rents: $255,000
Rents: $226,000
- Other Capital Outlay - Sewerage: $880,000
Regular Highways: $560,000
Solid Waste Management: $385,000
Elementary and Secondary Education: $224,000
General - Other: $203,000
Police Protection: $85,000
Libraries: $50,000
Correctional Institutions: $48,000
Elementary and Secondary Education: $18,000
Judicial and Legal Services: $7,000
Financial Administration: $3,000
General Public Building: $2,000
- Other Funds - Cash and Securities: $101,064,000
Cash and Securities: $42,301,000
- Sinking Funds - Cash and Securities: $24,413,000
Cash and Securities: $18,999,000
- State Intergovernmental - Education: $9,152,000
Education: $7,843,000
Health and Hospitals: $7,390,000
Highways: $6,669,000
Public Welfare: $4,340,000
Other: $3,916,000
Other: $2,764,000
Health and Hospitals: $2,107,000
Transit Utilities: $1,403,000
Public Welfare: $1,397,000
General Local Government Support: $226,000
General Local Government Support: $124,000
- Tax - Property: $98,655,000
Property: $94,911,000
Other License: $10,000
- Total Salaries and Wages: $38,330,000
: $17,601,000
Sussex County government finances - Cash and Securities in 2018:
- Assistance and Subsidies - Public Welfare, Federal Categorical Assistance Programs: $1,345,000
Public Welfare, Cash Assistance Programs - Other: $930,000
- Bond Funds - Cash and Securities: $49,361,000
Cash and Securities: $20,965,000
- Charges - Other: $17,924,000
Higher Education - Other: $14,338,000
Higher Education - Other: $13,767,000
Solid Waste Management: $10,688,000
Solid Waste Management: $10,657,000
Sewerage: $6,134,000
Sewerage: $5,921,000
Other: $4,120,000
Elementary and Secondary Education - Other: $1,434,000
Elementary and Secondary Education School Lunch: $356,000
Elementary and Secondary Education School Lunch: $297,000
Elementary and Secondary Education - Other: $159,000
- Construction - Regular Highways: $9,092,000
General - Other: $4,075,000
Regular Highways: $3,790,000
Elementary and Secondary Education: $2,302,000
Other Higher Education: $2,110,000
General - Other: $1,850,000
Elementary and Secondary Education: $1,398,000
General Public Buildings: $306,000
Sewerage: $262,000
Central Staff Services: $241,000
Judicial and Legal Services: $182,000
Correctional Institutions: $170,000
Police Protection: $81,000
Libraries: $68,000
- Current Operations - General - Other: $59,586,000
General - Other: $28,695,000
Other Higher Education: $20,142,000
Elementary and Secondary Education: $14,689,000
Elementary and Secondary Education: $14,623,000
Correctional Institutions: $8,696,000
Correctional Institutions: $8,383,000
Regular Highways: $6,980,000
Police Protection: $6,752,000
Public Welfare Institutions: $6,376,000
Judicial and Legal Services: $6,241,000
Judicial and Legal Services: $5,760,000
Health - Other: $5,614,000
Public Welfare - Other: $5,137,000
Regular Highways: $5,071,000
Solid Waste Management: $4,909,000
Libraries: $4,780,000
Libraries: $4,361,000
Health - Other: $3,447,000
Public Welfare - Other: $3,301,000
Sewerage: $3,210,000
Central Staff Services: $2,819,000
Police Protection: $2,509,000
General Public Buildings: $2,359,000
General Public Buildings: $2,317,000
Transit Utilities: $2,185,000
Central Staff Services: $1,624,000
Financial Administration: $1,615,000
Other Higher Education: $1,470,000
Transit Utilities: $1,336,000
Financial Administration: $1,197,000
Hospitals: $814,000
Natural Resources - Other: $784,000
Local Fire Protection: $517,000
Corrections - Other: $364,000
Corrections - Other: $339,000
Local Fire Protection: $274,000
Natural Resources - Other: $272,000
Protective Inspection and Regulation - Other: $123,000
Protective Inspection and Regulation - Other: $98,000
Solid Waste Management: $78,000
Parks and Recreation: $9,000
Parks and Recreation: $3,000
- Federal Intergovernmental - Education: $3,057,000
Education: $2,660,000
Transit Utilities: $431,000
- General - Interest on Debt: $6,227,000
Interest on Debt: $4,675,000
- Intergovernmental to Local - Other - Other Higher Education: $69,000
- Intergovernmental to State - Hospitals: $772,000
Elementary and Secondary Education: $4,000
Elementary and Secondary Education: $4,000
- Local Intergovernmental - Education: $5,756,000
Education: $5,582,000
Highways: $345,000
- Long Term Debt - Beginning Outstanding - Unspecified Public Purpose: $109,460,000
Outstanding Unspecified Public Purpose: $98,019,000
Beginning Outstanding - Unspecified Public Purpose: $31,819,000
Retired Unspecified Public Purpose: $24,003,000
Beginning Outstanding - Public Debt for Private Purpose: $23,981,000
Outstanding Nonguaranteed - Industrial Revenue: $21,541,000
Retired Unspecified Public Purpose: $11,441,000
Outstanding Unspecified Public Purpose: $7,816,000
Retired Nonguaranteed - Public Debt for Private Purpose: $2,440,000
- Miscellaneous - General Revenue - Other: $10,672,000
Interest Earnings: $7,615,000
General Revenue - Other: $3,464,000
Fines and Forfeits: $1,284,000
Interest Earnings: $1,059,000
Fines and Forfeits: $527,000
Rents: $255,000
Rents: $226,000
- Other Capital Outlay - Sewerage: $880,000
Regular Highways: $560,000
Solid Waste Management: $385,000
Elementary and Secondary Education: $224,000
General - Other: $203,000
Police Protection: $85,000
Libraries: $50,000
Correctional Institutions: $48,000
Elementary and Secondary Education: $18,000
Judicial and Legal Services: $7,000
Financial Administration: $3,000
General Public Building: $2,000
- Other Funds - Cash and Securities: $101,064,000
Cash and Securities: $42,301,000
- Sinking Funds - Cash and Securities: $24,413,000
Cash and Securities: $18,999,000
- State Intergovernmental - Education: $9,152,000
Education: $7,843,000
Health and Hospitals: $7,390,000
Highways: $6,669,000
Public Welfare: $4,340,000
Other: $3,916,000
Other: $2,764,000
Health and Hospitals: $2,107,000
Transit Utilities: $1,403,000
Public Welfare: $1,397,000
General Local Government Support: $226,000
General Local Government Support: $124,000
- Tax - Property: $98,655,000
Property: $94,911,000
Other License: $10,000
- Total Salaries and Wages: $38,330,000
: $17,601,000
Supplemental Security Income (SSI) in 2006:
- Total number of recipients: 1,465
- Number of aged recipients: 202
- Number of blind and disabled recipients: 1,263
- Number of recipients under 18: 191
- Number of recipients between 18 and 64: 959
- Number of recipients older than 64: 315
- Number of recipients also receiving OASDI: 571
- Amount of payments (thousands of dollars): 607
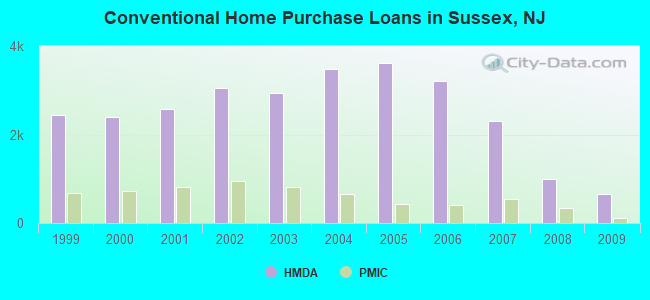
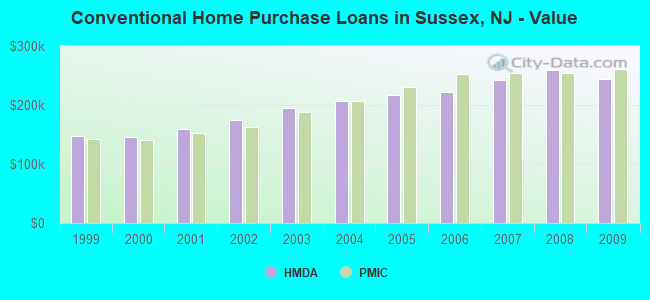
| Home Mortgage Disclosure Act Aggregated Statistics For Year 2009 (Based on 40 full tracts) | ||||||||||||||
| A) FHA, FSA/RHS & VA Home Purchase Loans | B) Conventional Home Purchase Loans | C) Refinancings | D) Home Improvement Loans | E) Loans on Dwellings For 5+ Families | F) Non-occupant Loans on < 5 Family Dwellings (A B C & D) | G) Loans On Manufactured Home Dwelling (A B C & D) | ||||||||
|---|---|---|---|---|---|---|---|---|---|---|---|---|---|---|
| Number | Average Value | Number | Average Value | Number | Average Value | Number | Average Value | Number | Average Value | Number | Average Value | Number | Average Value | |
| LOANS ORIGINATED | 554 | $236,597 | 645 | $244,845 | 4,036 | $229,838 | 291 | $89,976 | 1 | $150,000 | 177 | $208,316 | 4 | $40,750 |
| APPLICATIONS APPROVED, NOT ACCEPTED | 50 | $233,280 | 97 | $252,804 | 353 | $229,977 | 40 | $64,750 | 0 | $0 | 19 | $190,632 | 1 | $8,000 |
| APPLICATIONS DENIED | 109 | $230,716 | 144 | $205,639 | 1,730 | $249,721 | 168 | $80,887 | 0 | $0 | 92 | $190,326 | 7 | $90,286 |
| APPLICATIONS WITHDRAWN | 81 | $244,728 | 77 | $247,390 | 958 | $245,728 | 46 | $126,935 | 1 | $327,000 | 35 | $218,371 | 0 | $0 |
| FILES CLOSED FOR INCOMPLETENESS | 24 | $223,917 | 34 | $232,794 | 247 | $267,777 | 18 | $126,889 | 0 | $0 | 13 | $148,231 | 1 | $83,000 |
| Private Mortgage Insurance Companies Aggregated Statistics For Year 2009 (Based on 40 full tracts) | ||||||
| A) Conventional Home Purchase Loans | B) Refinancings | C) Non-occupant Loans on < 5 Family Dwellings (A & B) | ||||
|---|---|---|---|---|---|---|
| Number | Average Value | Number | Average Value | Number | Average Value | |
| LOANS ORIGINATED | 108 | $261,667 | 63 | $265,698 | 3 | $273,333 |
| APPLICATIONS APPROVED, NOT ACCEPTED | 57 | $257,193 | 33 | $267,455 | 1 | $204,000 |
| APPLICATIONS DENIED | 28 | $250,107 | 30 | $292,733 | 3 | $224,000 |
| APPLICATIONS WITHDRAWN | 16 | $242,750 | 15 | $254,867 | 0 | $0 |
| FILES CLOSED FOR INCOMPLETENESS | 3 | $233,000 | 3 | $239,667 | 0 | $0 |
| Most common first names in Sussex County, NJ among deceased individuals | ||
| Name | Count | Lived (average) |
|---|---|---|
| John | 969 | 74.0 years |
| Mary | 777 | 80.9 years |
| William | 665 | 74.4 years |
| Joseph | 527 | 74.4 years |
| Helen | 468 | 81.1 years |
| Robert | 446 | 68.8 years |
| Margaret | 430 | 79.8 years |
| Anna | 426 | 83.5 years |
| George | 420 | 74.5 years |
| Charles | 389 | 75.2 years |
| Most common last names in Sussex County, NJ among deceased individuals | ||
| Last name | Count | Lived (average) |
|---|---|---|
| Smith | 300 | 77.0 years |
| Miller | 105 | 75.5 years |
| Johnson | 95 | 76.1 years |
| Williams | 85 | 74.5 years |
| Decker | 81 | 76.1 years |
| Jones | 74 | 77.0 years |
| Clark | 71 | 77.2 years |
| Wilson | 60 | 77.5 years |
| Morris | 57 | 76.0 years |
| Anderson | 56 | 79.9 years |
| Businesses in Sussex County, NJ | ||||
| Name | Count | Name | Count | |
|---|---|---|---|---|
| 7-Eleven | 2 | Kohl's | 1 | |
| A&P | 2 | La-Z-Boy | 1 | |
| AT&T | 1 | Lane Furniture | 1 | |
| Advance Auto Parts | 3 | Lowe's | 1 | |
| Applebee's | 1 | Marriott | 1 | |
| Arby's | 1 | Marshalls | 1 | |
| Audi | 1 | MasterBrand Cabinets | 16 | |
| BMW | 1 | McDonald's | 4 | |
| Bed Bath & Beyond | 1 | Nissan | 1 | |
| Blockbuster | 2 | Panera Bread | 1 | |
| Burger King | 4 | Pathmark | 1 | |
| CVS | 2 | Penske | 1 | |
| Chevrolet | 1 | Pizza Hut | 1 | |
| Curves | 3 | RadioShack | 3 | |
| Dairy Queen | 4 | Rite Aid | 6 | |
| Decora Cabinetry | 4 | Sears | 1 | |
| Domino's Pizza | 2 | Staples | 2 | |
| Dunkin Donuts | 13 | Starbucks | 2 | |
| Econo Lodge | 1 | Stop & Shop | 1 | |
| Fashion Bug | 1 | Subaru | 1 | |
| FedEx | 20 | Subway | 6 | |
| Firestone Complete Auto Care | 1 | T-Mobile | 4 | |
| Ford | 1 | Talbots | 1 | |
| GNC | 2 | Toyota | 1 | |
| GameStop | 1 | True Value | 2 | |
| H&R Block | 3 | U-Haul | 11 | |
| Harmon Face Values | 2 | UPS | 26 | |
| Holiday Inn | 1 | Volkswagen | 1 | |
| Home Depot | 1 | Walgreens | 1 | |
| Honda | 1 | Walmart | 2 | |
| Hyundai | 1 | Wendy's | 2 | |
| Jones New York | 2 | YMCA | 3 | |
| KFC | 1 | |||
Sussex County on our top lists:
- #22 on the list of "Top 101 counties with the lowest number of births per 1000 residents 2007-2013"
- #22 on the list of "Top 101 counties with the lowest number of births per 1000 residents 2007-2013 (pop 50,000+)"
- #29 on the list of "Top 101 counties with the largest decrease in the number of births per 1000 residents 2000-2006 to 2007-2013 (pop 50,000+)"
- #35 on the list of "Top 101 counties with the highest percentage of residents that smoked 100+ cigarettes in their lives"
- #41 on the list of "Top 101 counties with the largest number of people moving out compared to moving in (pop. 50,000+)"
- #48 on the list of "Top 101 counties with the lowest average weight of females"
- #55 on the list of "Top 101 counties with the lowest surface withdrawal of fresh water for public supply (pop. 50,000+)"
- #62 on the list of "Top 101 counties with the highest percentage of residents that visited a dentist within the past year"
- #81 on the list of "Top 101 counties with the highest percentage of residents that drank alcohol in the past 30 days"
- #81 on the list of "Top 101 counties with the largest increase in the number of deaths per 1000 residents 2000-2006 to 2007-2013 (pop. 50,000+)"
- #91 on the list of "Top 101 counties with the best general health status score of residents (1-5), 3 years of data"