Estimated zip code population in 2022: 40,282 Zip code population in 2010: 42,920 Zip code population in 2000: 42,621
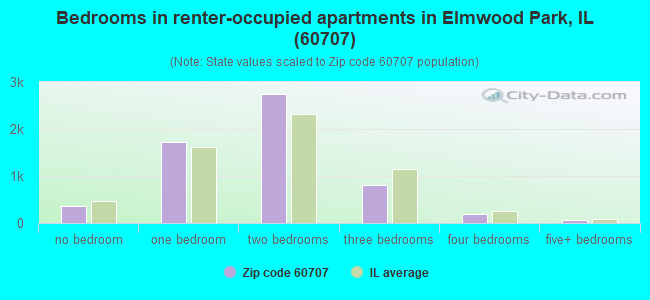
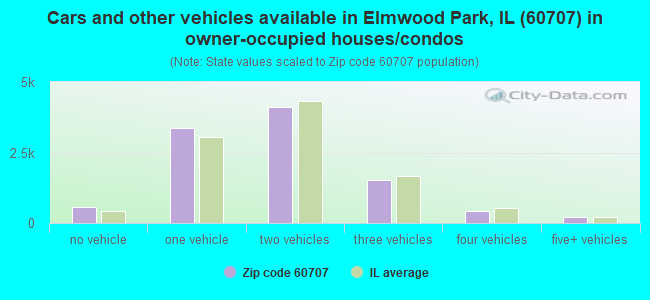
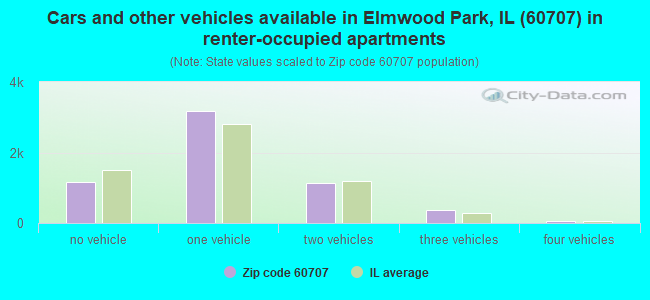
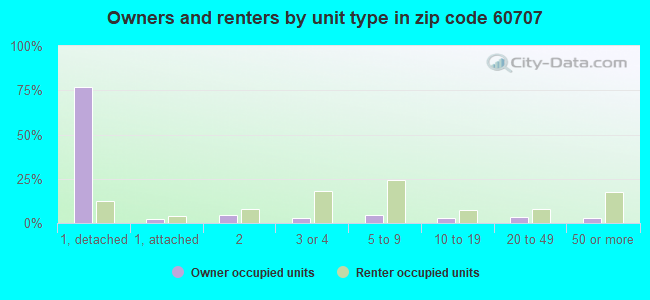
Houses and condos: 17,002 Renter-occupied apartments: 5,862
% of renters here:
37%
State:
33%
March 2022 cost of living index in zip code 60707: 101.7 (near average, U.S. average is 100)
Land area: 3.6 sq. mi. Water area: 0.0 sq. mi.
Population density: 11,164 people per square mile
(high).
OSM Map
General Map
Google Map
MSN Map
OSM Map
General Map
Google Map
MSN Map
OSM Map
General Map
Google Map
MSN Map
OSM Map
General Map
Google Map
MSN Map
Please wait while loading the map...
Real estate property taxes paid for housing units in 2022:
This zip code:
1.7% ($5,662)
Illinois:
2.0% ($4,912)
Median real estate property taxes paid for housing units with mortgages in 2022: $5,693 (1.7%) Median real estate property taxes paid for housing units with no mortgage in 2022: $5,529 (1.7%)
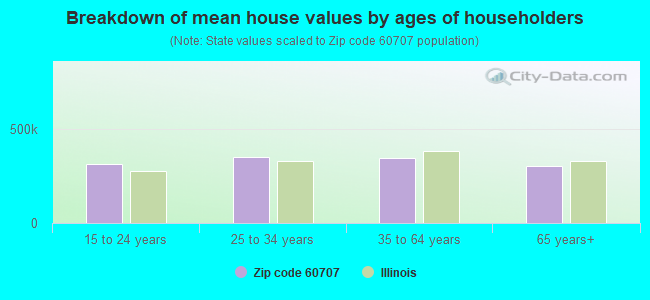
Estimated median house/condo value in 2022: $324,839
60707:
$324,839
Illinois:
$251,600
According to our research of Illinois and other state lists, there were 34 registered sex offenders living in 60707 zip code as of April 27, 2024. The ratio of all residents to sex offenders in zip code 60707 is 1,296 to 1. The ratio of registered sex offenders to all residents in this zip code is lower than the state average.
Median resident age:
This zip code:
40.9 years
Illinois median age:
39.1 years
Average household size:
This zip code:
2.5 people
Illinois:
2.4 people
Averages for the 2020 tax year for zip code 60707, filed in 2021:
Average Adjusted Gross Income (AGI) in 2020: $57,821 (Individual Income Tax Returns)
Here:
$57,821
State:
$82,626
Salary/wage: $54,341 (reported on 80.5% of returns)
Here:
$54,341
State:
$66,640
(% of AGI for various income ranges: 1119.0% for AGIs below $25k, 3573.1% for AGIs $25k-50k, 6561.8% for AGIs $50k-75k, 9697.1% for AGIs $75k-100k, 18056.0% for AGIs $100k-200k, 58762.4% for AGIs over 200k)
Taxable interest for individuals: $1,217 (reported on 22.2% of returns)
This zip code:
$1,217
Illinois:
$2,376
(% of AGI for various income ranges: 14.7% for AGIs below $25k, 14.8% for AGIs $25k-50k, 30.7% for AGIs $50k-75k, 64.9% for AGIs $75k-100k, 92.6% for AGIs $100k-200k, 590.5% for AGIs over 200k)
Ordinary dividends: $4,251 (reported on 13.7% of returns)
Here:
$4,251
State:
$9,061
(% of AGI for various income ranges: 20.3% for AGIs below $25k, 24.8% for AGIs $25k-50k, 63.3% for AGIs $50k-75k, 99.9% for AGIs $75k-100k, 205.2% for AGIs $100k-200k, 1928.1% for AGIs over 200k)
Net capital gain/loss in AGI: +$9,619 (reported on 12.2% of returns)
Here:
+$9,619
State:
+$31,684
(% of AGI for various income ranges: 4.3% for AGIs below $25k, 23.9% for AGIs $25k-50k, 59.8% for AGIs $50k-75k, 106.0% for AGIs $75k-100k, 421.1% for AGIs $100k-200k, 6722.9% for AGIs over 200k)
Profit/loss from business: +$9,507 (reported on 19.7% of returns)
Here:
+$9,507
State:
+$12,175
(% of AGI for various income ranges: 273.2% for AGIs below $25k, 228.2% for AGIs $25k-50k, 172.1% for AGIs $50k-75k, 230.2% for AGIs $75k-100k, 335.5% for AGIs $100k-200k, 1849.0% for AGIs over 200k)
Taxable individual retirement arrangement distribution: $15,458 (reported on 6.0% of returns)
60707:
$15,458
Illinois:
$21,613
(% of AGI for various income ranges: 42.3% for AGIs below $25k, 62.5% for AGIs $25k-50k, 102.8% for AGIs $50k-75k, 183.3% for AGIs $75k-100k, 387.5% for AGIs $100k-200k, 1658.1% for AGIs over 200k)
Self-employed (Keogh) retirement plans: $14,040 (reported on 0.2% of returns)
60707:
$14,040
Illinois:
$30,962
(% of AGI for various income ranges: 42.3% for AGIs $100k-200k)
Total itemized deductions: $24,275 (reported on 9.4% of returns)
Here:
$24,275
State:
$34,948
(% of AGI for various income ranges: 47.5% for AGIs below $25k, 138.4% for AGIs $25k-50k, 367.8% for AGIs $50k-75k, 665.7% for AGIs $75k-100k, 971.4% for AGIs $100k-200k, 2815.2% for AGIs over 200k)
Charity contributions: $5,487 (reported on 7.1% of returns)
Here:
$5,487
State:
$13,122
(% of AGI for various income ranges: 3.3% for AGIs below $25k, 15.8% for AGIs $25k-50k, 49.8% for AGIs $50k-75k, 99.8% for AGIs $75k-100k, 187.0% for AGIs $100k-200k, 854.3% for AGIs over 200k)
Taxes paid: $8,269 (reported on 9.4% of returns)
60707:
$8,269
State:
$8,563
(% of AGI for various income ranges: 13.8% for AGIs below $25k, 41.7% for AGIs $25k-50k, 131.0% for AGIs $50k-75k, 246.5% for AGIs $75k-100k, 336.6% for AGIs $100k-200k, 885.2% for AGIs over 200k)
Earned income credit: $2,088 (reported on 15.4% of returns)
Here:
$2,088
State:
$2,311
(% of AGI for various income ranges: 89.4% for AGIs below $25k, 59.6% for AGIs $25k-50k, 0.7% for AGIs $50k-75k)
Percentage of individuals using paid preparers for their 2020 taxes: 90.6%
Here:
91%
State:
93%
(% for various income ranges: 87.7% for AGIs below $25k, 91.9% for AGIs $25k-50k, 92.1% for AGIs $50k-75k, 92.2% for AGIs $75k-100k, 91.8% for AGIs $100k-200k, 90.0% for AGIs over 200k)
Averages for the 2012 tax year for zip code 60707, filed in 2013:
Average Adjusted Gross Income (AGI) in 2012: $45,869 (Individual Income Tax Returns)
Here:
$45,869
State:
$68,058
Salary/wage: $44,371 (reported on 80.9% of returns)
Here:
$44,371
State:
$55,396
(% of AGI for various income ranges: 68.0% for AGIs below $25k, 82.1% for AGIs $25k-50k, 82.3% for AGIs $50k-75k, 81.8% for AGIs $75k-100k, 81.3% for AGIs $100k-200k, 57.5% for AGIs over 200k)
Taxable interest for individuals: $1,055 (reported on 28.4% of returns)
This zip code:
$1,055
Illinois:
$1,969
(% of AGI for various income ranges: 1.0% for AGIs below $25k, 0.5% for AGIs $25k-50k, 0.6% for AGIs $50k-75k, 0.5% for AGIs $75k-100k, 0.7% for AGIs $100k-200k, 0.9% for AGIs over 200k)
Ordinary dividends: $3,621 (reported on 14.7% of returns)
Here:
$3,621
State:
$7,786
(% of AGI for various income ranges: 1.3% for AGIs below $25k, 0.7% for AGIs $25k-50k, 0.8% for AGIs $50k-75k, 0.9% for AGIs $75k-100k, 1.2% for AGIs $100k-200k, 3.2% for AGIs over 200k)
Net capital gain/loss in AGI: +$2,594 (reported on 10.3% of returns)
Here:
+$2,594
State:
+$22,183
(% of AGI for various income ranges: 0.1% for AGIs $50k-75k, 0.5% for AGIs $75k-100k, 0.9% for AGIs $100k-200k, 3.3% for AGIs over 200k)
Profit/loss from business: +$10,272 (reported on 18.8% of returns)
Here:
+$10,272
State:
+$12,903
(% of AGI for various income ranges: 16.7% for AGIs below $25k, 4.7% for AGIs $25k-50k, 1.8% for AGIs $50k-75k, 1.6% for AGIs $75k-100k, 2.0% for AGIs $100k-200k, 3.5% for AGIs over 200k)
Taxable individual retirement arrangement distribution: $12,745 (reported on 7.7% of returns)
60707:
$12,745
Illinois:
$17,929
(% of AGI for various income ranges: 2.8% for AGIs below $25k, 1.8% for AGIs $25k-50k, 1.6% for AGIs $50k-75k, 2.0% for AGIs $75k-100k, 2.2% for AGIs $100k-200k, 3.5% for AGIs over 200k)
Self-employment retirement plans: $13,829 (reported on 0.3% of returns)
60707:
$13,829
Illinois:
$24,666
Total itemized deductions: $20,448 (25% of AGI, reported on 33.0% of returns)
Here:
$20,448
State:
$26,433
Here:
24.9% of AGI
State:
19.2% of AGI
(% of AGI for various income ranges: 9.7% for AGIs below $25k, 11.7% for AGIs $25k-50k, 15.9% for AGIs $50k-75k, 17.1% for AGIs $75k-100k, 16.7% for AGIs $100k-200k, 15.7% for AGIs over 200k)
Charity contributions: $2,441 (reported on 26.6% of returns)
Here:
$2,441
State:
$4,525
(% of AGI for various income ranges: 0.6% for AGIs below $25k, 1.0% for AGIs $25k-50k, 1.5% for AGIs $50k-75k, 1.6% for AGIs $75k-100k, 1.8% for AGIs $100k-200k, 1.9% for AGIs over 200k)
Taxes paid: $8,254 (reported on 33.0% of returns)
60707:
$8,254
State:
$11,968
(% of AGI for various income ranges: 3.1% for AGIs below $25k, 4.1% for AGIs $25k-50k, 6.1% for AGIs $50k-75k, 7.2% for AGIs $75k-100k, 7.6% for AGIs $100k-200k, 6.5% for AGIs over 200k)
Earned income credit: $2,075 (reported on 19.3% of returns)
Here:
$2,075
State:
$2,349
(% of AGI for various income ranges: 5.9% for AGIs below $25k, 1.1% for AGIs $25k-50k)
Percentage of individuals using paid preparers for their 2012 taxes: 62.4%
Here:
62%
State:
57%
(% for various income ranges: 60.6% for AGIs below $25k, 62.3% for AGIs $25k-50k, 63.8% for AGIs $50k-75k, 65.5% for AGIs $75k-100k, 63.6% for AGIs $100k-200k, 76.9% for AGIs over 200k)
Averages for the 2004 tax year for zip code 60707, filed in 2005:
Average Adjusted Gross Income (AGI) in 2004: $40,515 (Individual Income Tax Returns)
Here:
$40,515
State:
$54,625
Salary/wage: $39,359 (reported on 80.0% of returns)
Here:
$39,359
State:
$46,811
(% of AGI for various income ranges: 71.0% for AGIs below $10k, 71.5% for AGIs $10k-25k, 84.9% for AGIs $25k-50k, 85.7% for AGIs $50k-75k, 84.0% for AGIs $75k-100k, 64.4% for AGIs over 100k)
Taxable interest for individuals: $1,450 (reported on 47.9% of returns)
This zip code:
$1,450
Illinois:
$2,101
(% of AGI for various income ranges: 5.7% for AGIs below $10k, 2.8% for AGIs $10k-25k, 1.5% for AGIs $25k-50k, 1.3% for AGIs $50k-75k, 1.3% for AGIs $75k-100k, 1.7% for AGIs over 100k)
Taxable dividends: $2,420 (reported on 20.1% of returns)
Here:
$2,420
State:
$4,306
(% of AGI for various income ranges: 3.3% for AGIs below $10k, 1.3% for AGIs $10k-25k, 0.9% for AGIs $25k-50k, 0.9% for AGIs $50k-75k, 1.1% for AGIs $75k-100k, 1.6% for AGIs over 100k)
Net capital gain/loss: +$11,969 (reported on 14.5% of returns)
Here:
+$11,969
State:
+$17,321
(% of AGI for various income ranges: -0.6% for AGIs below $10k, 0.6% for AGIs $10k-25k, 0.4% for AGIs $25k-50k, 0.9% for AGIs $50k-75k, 1.9% for AGIs $75k-100k, 13.5% for AGIs over 100k)
Profit/loss from business: +$9,390 (reported on 18.7% of returns)
Here:
+$9,390
State:
+$11,771
(% of AGI for various income ranges: 28.4% for AGIs below $10k, 13.1% for AGIs $10k-25k, 3.4% for AGIs $25k-50k, 1.8% for AGIs $50k-75k, 2.2% for AGIs $75k-100k, 3.1% for AGIs over 100k)
IRA payment deduction: $2,936 (reported on 2.4% of returns)
60707:
$2,936
Illinois:
$3,087
(% of AGI for various income ranges: 0.3% for AGIs below $10k, 0.2% for AGIs $10k-25k, 0.2% for AGIs $25k-50k, 0.2% for AGIs $50k-75k, 0.2% for AGIs $75k-100k, 0.1% for AGIs over 100k)
Self-employed pension: $11,468 (reported on 0.5% of returns)
Here:
$11,468
Illinois:
$16,965
(% of AGI for various income ranges: 0.0% for AGIs $25k-50k, 0.1% for AGIs $50k-75k, 0.1% for AGIs $75k-100k, 0.3% for AGIs over 100k)
Total itemized deductions: $17,540 (26% of AGI, reported on 38.3% of returns)
Here:
$17,540
State:
$20,239
Here:
26.3% of AGI
State:
19.5% of AGI
(% of AGI for various income ranges: 16.7% for AGIs below $10k, 15.0% for AGIs $10k-25k, 16.8% for AGIs $25k-50k, 19.4% for AGIs $50k-75k, 17.9% for AGIs $75k-100k, 14.0% for AGIs over 100k)
Charity contributions deductions: $2,345 (3% of AGI, reported on 33.9% of returns)
Here:
$2,345
State:
$3,719
Here:
3.3% of AGI
State:
3.4% of AGI
(% of AGI for various income ranges: 0.7% for AGIs below $10k, 1.1% for AGIs $10k-25k, 1.6% for AGIs $25k-50k, 2.3% for AGIs $50k-75k, 2.3% for AGIs $75k-100k, 2.3% for AGIs over 100k)
Total tax: $5,349 (reported on 76.5% of returns)
60707:
$5,349
State:
$9,882
(% of AGI for various income ranges: 5.4% for AGIs below $10k, 4.9% for AGIs $10k-25k, 6.7% for AGIs $25k-50k, 8.7% for AGIs $50k-75k, 10.3% for AGIs $75k-100k, 16.4% for AGIs over 100k)
Earned income credit: $1,493 (reported on 15.5% of returns)
Here:
$1,493
State:
$1,788
Percentage of individuals using paid preparers for their 2004 taxes: 62.2%
Here:
62%
State:
61%
(% for various income ranges: 55.5% for AGIs below $10k, 64.2% for AGIs $10k-25k, 63.2% for AGIs $25k-50k, 63.8% for AGIs $50k-75k, 63.3% for AGIs $75k-100k, 67.8% for AGIs over 100k)
Likely homosexual households (counted as self-reported same-sex unmarried-partner households)
Lesbian couples: 0.1% of all households
Gay men: 0.0% of all households
Household received Food Stamps/SNAP in the past 12 months: 2,573 Household did not receive Food Stamps/SNAP in the past 12 months: 13,501
Women who had a birth in the past 12 months: 267 (186 now married, 81 unmarried) Women who did not have a birth in the past 12 months: 9,365 (3,746 now married, 5,616 unmarried)
Housing units in zip code 60707 with a mortgage: 6,690 (627 second mortgage, 10 home equity loan, 543 both second mortgage and home equity loan) Houses without a mortgage: 84
Median monthly owner costs for units with a mortgage: $2,066 Median monthly owner costs for units without a mortgage: $854
Residents with income below the poverty level in 2022:
This zip code:
8.0%
Whole state:
11.9%
Residents with income below 50% of the poverty level in 2022:
This zip code:
3.5%
Whole state:
5.7%
Median number of rooms in houses and condos:
Here:
6.3
State:
6.4
Median number of rooms in apartments:
Here:
4.0
State:
4.1
Notable locations in this zip code not listed on our city pages
Notable locations in zip code 60707: Sayre Station (A), Elmwood Park Fire Department Station 2 (B), Chicago Fire Department District 2 Station 125 (C), Elmwood Park Public Library (D), Elmwood Park Fire Department Station 1 (E), Elmwood Park Village Hall (F), Chicago Engine Company 125 (G). Display/hide their locations on the map
Churches in zip code 60707 include: Atonement Lutheran Church (A), Mont Clare Congregational Church (B), Mount Clare Baptist Church (C), Lutheran Church of the Good Shepherd (D), Saint Gregorys Armenian Apostolic Church (E), Elmwood Park Presbyterian Church (F), Grace Lutheran Church (G), Kingdom Hall of Jehovahs Witnesses (H), New Horizon Temple (I). Display/hide their locations on the map
Parks in zip code 60707 include: Rutherford Park (1), Rutherford-Sayre Park (2), Kathy Torpe Park (3), Kiddie Korale Park (4), Mills Park (5), Triangle Park (6), Sayre Park (7). Display/hide their locations on the map
5,300 married couples with children.
1,881 single-parent households (464 men, 1,417 women).
55.3% of residents of 60707 zip code speak English at home.
26.4% of residents speak Spanish at home (68% very well, 21% well, 9% not well, 2% not at all).
15.8% of residents speak other Indo-European language at home (47% very well, 27% well, 23% not well, 3% not at all).
2.4% of residents speak Asian or Pacific Island language at home (62% very well, 30% well, 8% not well).
1.0% of residents speak other language at home (79% very well, 3% well, 18% not well).
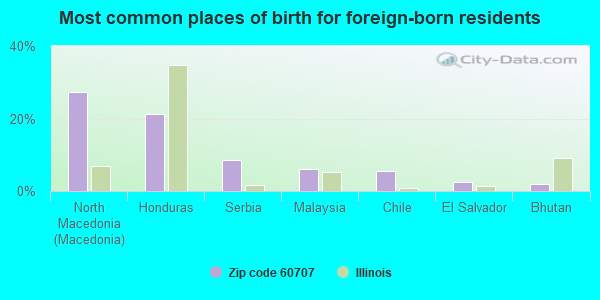
Foreign born population: 9,810 (24.4%) (59.0% of them are naturalized citizens)
This zip code:
24.4%
Whole state:
14.4%
27%North Macedonia (Macedonia)
21%Honduras
9%Serbia
6%Malaysia
5%Chile
2%El Salvador
2%Bhutan
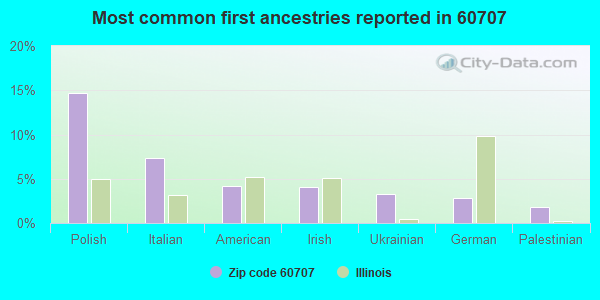
15%Polish
7%Italian
4%American
4%Irish
3%Ukrainian
3%German
2%Palestinian
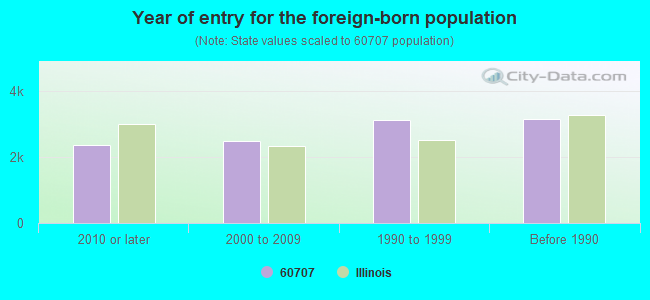
Year of entry for the foreign-born population
2,3562010 or later
2,4922000 to 2009
3,1251990 to 1999
3,155Before 1990
Major facilities with environmental interests located in this zip code:
MASTER FOODS USA (2019 N. OAK PARK AVE. in CHICAGO, IL)
STATE MASTER (Illinois EPA Project) - HAZARDOUS WASTE PROGRAM, AIR PROGRAM, SOLID WASTE PROGRAM AIR SYNTHETIC MINOR (AIRS/AFS) ENFORCEMENT/COMPLIANCE ACTIVITY (Integrated Compliance Information System) - ICIS-HQ-2001-4002, FORMAL ENFORCEMENT ACTION (Integrated Compliance Information System) - ICIS-HQ-2001-4002, FORMAL ENFORCEMENT ACTION CRITERIA AND HAZARDOUS AIR POLLUTANT INVENTORY (Inventory of air pollution sources) Conditionally Exempt Small Quantity Generators, less than 100 kg/month of hazardous waste (Resource Conservation and Recovery Act (tracking hazardous waste)) TRI REPORTER (Tracking of toxic chemicals releasing facilities) Business SIC classification: CANDY AND OTHER CONFECTIONERY PRODUCTS Organizations: MASTERFOODS USA (CONTACT/OPERATOR)
, MARS INC (CONTACT/OWNER)
Alternative names: M & M MARS
RADIO FLYER INC (6515 WEST GRAND AVENUE in CHICAGO, IL)
STATE MASTER (Illinois EPA Project) - SOLID WASTE PROGRAM, AIR PROGRAM, HAZARDOUS WASTE PROGRAM AIR MAJOR (AIRS/AFS) (Integrated Compliance Information System) - ICIS-05-1991-0257, FORMAL ENFORCEMENT ACTION CRITERIA AND HAZARDOUS AIR POLLUTANT INVENTORY (Inventory of air pollution sources) Large Quantity Generators, more that 1000 kg of hazardous waste/month (Resource Conservation and Recovery Act (tracking hazardous waste)) - notification Small Quantity Generators, between 100 kg and 1000 kg of hazardous waste/month (Resource Conservation and Recovery Act (tracking hazardous waste)) - notification TRI REPORTER (Tracking of toxic chemicals releasing facilities) Business SIC classification: GAMES, TOYS, AND CHILDREN'S VEHICLES, EXCEPT DOLLS AND BICYCLES Organizations: RADIO STEEL & MFG CO (CONTACT/OWNER)
Alternative names: RADIO STEEL & MFG CO
LS MASCO CORP (2000 N. HARLEM AVENUE in ELMWOOD PARK, IL)
STATE MASTER (Illinois EPA Project) - AIR PROGRAM, HAZARDOUS WASTE PROGRAM, SOLID WASTE PROGRAM AIR MINOR (AIRS/AFS) Small Quantity Generators, between 100 kg and 1000 kg of hazardous waste/month (Resource Conservation and Recovery Act (tracking hazardous waste)) - notification Business SIC classification: DRYCLEANING PLANTS, EXCEPT RUG CLEANING Alternative names: L S MASCO CORPORATION, REICHARDT CLEANERS
JACOBS TWIN FORD INC (1823 N HARLEM AVE in CHICAGO, IL)
STATE MASTER (Illinois EPA Project) - SOLID WASTE PROGRAM, HAZARDOUS WASTE PROGRAM (Resource Conservation and Recovery Act (tracking hazardous waste)) Organizations: JACOBS JEFFREY A (CONTACT/OWNER)
Alternative names: ELMWOOD FORD MOTORS INC
OMEGA DEMOLITION (1930 N HARLEM AVE in ELMWOOD PARK, IL)
STATE MASTER (Illinois EPA Project) - AIR PROGRAM AIR MINOR (AIRS/AFS) CRITERIA AND HAZARDOUS AIR POLLUTANT INVENTORY (Inventory of air pollution sources) Business SIC classification: NONCLASSIFIABLE ESTABLISHMENTS
N HENRY & SON INC (6450 W CORTLAND ST in CHICAGO, IL)
STATE MASTER (Illinois EPA Project) - HAZARDOUS WASTE PROGRAM, AIR PROGRAM AIR SYNTHETIC MINOR (AIRS/AFS) CRITERIA AND HAZARDOUS AIR POLLUTANT INVENTORY (Inventory of air pollution sources) Small Quantity Generators, between 100 kg and 1000 kg of hazardous waste/month (Resource Conservation and Recovery Act (tracking hazardous waste)) - notification Business SIC classification: FABRICATED TEXTILE PRODUCTS Organizations: HENRY N & SON (CONTACT/OWNER)
Alternative names: HENRY N & SON
HANDY ANDY STORE 9 (2840 N HARLEM N PARCEL in ELMWOOD PARK, IL)
STATE MASTER (Illinois EPA Project) - SOLID WASTE PROGRAM (Resource Conservation and Recovery Act (tracking hazardous waste)) Organizations: HANDY ANDY REALTY CO INC (CONTACT/OWNER)
Alternative names: HANDY ANDY STORE NO 9
HEICK DIE CASTING (6625 W DIVERSEY AVE REAR in CHICAGO, IL)
STATE MASTER (Illinois EPA Project) - SOLID WASTE PROGRAM, HAZARDOUS WASTE PROGRAM Large Quantity Generators, more that 1000 kg of hazardous waste/month (Resource Conservation and Recovery Act (tracking hazardous waste)) - notification
CLEAN CITY (7446 W NORTH AVE in ELMWOOD PARK, IL)
STATE MASTER (Illinois EPA Project) - HAZARDOUS WASTE PROGRAM Small Quantity Generators, between 100 kg and 1000 kg of hazardous waste/month (Resource Conservation and Recovery Act (tracking hazardous waste)) - notification Organizations: POLLI ROSEMARY (CONTACT/OWNER)
ONE HOUR CLEANERS (7408 W GRAND in ELMWOOD PARK, IL)
STATE MASTER (Illinois EPA Project) - HAZARDOUS WASTE PROGRAM Small Quantity Generators, between 100 kg and 1000 kg of hazardous waste/month (Resource Conservation and Recovery Act (tracking hazardous waste)) - notification Organizations: BAE JAMES B (CONTACT/OWNER)
ISABEL CLEANERS (7230 NORTH AVE in ELMWOOD PARK, IL)
STATE MASTER (Illinois EPA Project) - HAZARDOUS WASTE PROGRAM Small Quantity Generators, between 100 kg and 1000 kg of hazardous waste/month (Resource Conservation and Recovery Act (tracking hazardous waste)) - notification Organizations: LJ AND I CORP (CONTACT/OWNER)
ASSOCIATED TRANSFORMER (7818 W GRAND AVE in ELMWOOD PARK, IL)
STATE MASTER (Illinois EPA Project) - HAZARDOUS WASTE PROGRAM Conditionally Exempt Small Quantity Generators, less than 100 kg/month of hazardous waste (Resource Conservation and Recovery Act (tracking hazardous waste))
OAK PARK PLAZA CLEANERS (6804 W. NORTH AVENUE in CHICAGO, IL)
STATE MASTER (Illinois EPA Project) - AIR PROGRAM AIR MINOR (AIRS/AFS) Business SIC classification: DRYCLEANING PLANTS, EXCEPT RUG CLEANING
Housing units lacking complete plumbing facilities: 0.8% Housing units lacking complete kitchen facilities: 1.4%
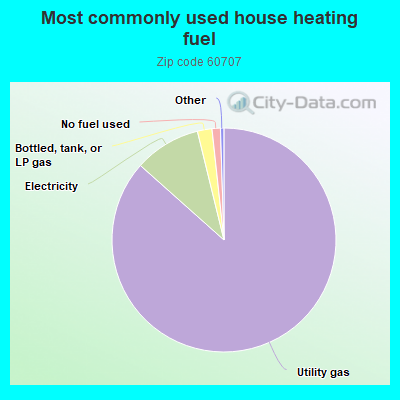
86.5%Utility gas
9.6%Electricity
2.1%Bottled, tank, or LP gas
1.2%No fuel used
Place of birth for U.S.-born residents:
This state: 25,408
Northeast: 398
Midwest: 1,005
South: 1,435
West: 825
62% of the 60707 zip code residents lived in the same house 5 years ago. Out of people who lived in different houses, 93% lived in this county. Out of people who lived in different counties, 50% lived in Illinois.
91% of the 60707 zip code residents lived in the same house 1 year ago. Out of people who lived in different houses, 70% moved from this county. Out of people who lived in different houses, 4% moved from different county within same state. Out of people who lived in different houses, 20% moved from different state. Out of people who lived in different houses, 5% moved from abroad.
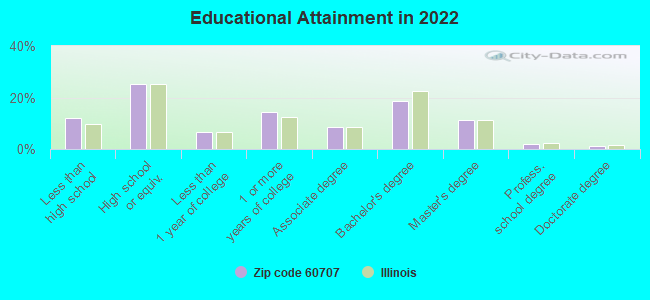
Private vs. public school enrollment:
Students in private schools in grades 1 to 8 (elementary and middle school): 1,028
Here:
25.3%
Illinois:
13.3%
Students in private schools in grades 9 to 12 (high school): 341
Here:
18.2%
Illinois:
9.9%
Students in private undergraduate colleges: 379
Here:
26.0%
Illinois:
27.4%
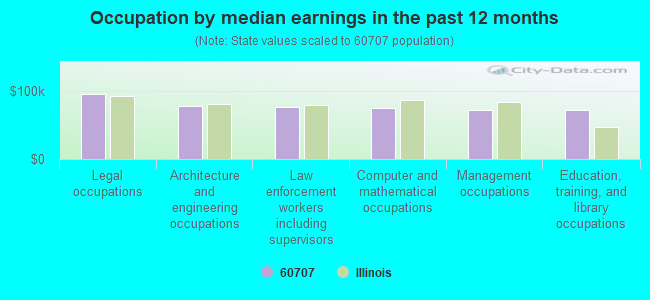
Occupation by median earnings in the past 12 months ($)
96,485Legal occupations
78,283Architecture and engineering occupations
76,641Law enforcement workers including supervisors
75,255Computer and mathematical occupations
72,714Management occupations
72,207Education, training, and library occupations
Companies with federal contracts located in this zip code:
TACTICAL LIGHTING SYSTEMS, INC (1926 N NORDICA AVE in CHICAGO, IL; small business) : $189,756 in 4 contractsfrom 2003 to 2005
$108,588 with Air Force for Electric Portable and Hand Lighting Equipment. Signed on 2005-09-27. Completion date: 2006-09-29.
$40,917 with Air Force for Maintenance, Repair or Alteration of Real Property -- Miscellaneous Buildings. Taking place in GA. Signed on 2003-12-18. Completion date: 2004-04-12.
$30,725 with Air Force for Electrical and Electronic assemblies, Boards, Cards, and Associated Hardware. Taking place in TX. Signed on 2003-09-23. Completion date: 2003-12-23.
$9,526 with Air Force for Miscellaneous Electric Power and Distribution Equipment. Signed on 2005-09-20. Completion date: 2005-11-19.
FREY TOOL & ENGINEERING CORP (7912 W GRAND AVE in ELMWOOD PARK, IL; small business)
$9,960 with Navy for Miscellaneous Fire Control Equipment. Taking place in TX. Signed on 2005-07-29. Completion date: 2005-11-28.
A GRAND AFFAIR CATERING, INC (2627 N HARLEM AVE in CHICAGO, IL; small business)
$4,408 with Army for Meat, Poultry, and Fish. Signed on 2005-07-26. Completion date: 2005-07-27.
DELUXE EVENTS AND CATERING LTD (2136 N HARLEM AVE in ELMWOOD PARK, IL; small business) : -$339,568 in 4 contractsfrom 2000 to 2005
$27,032 with Army for Food Services. Signed on 2000-07-14. Completion date: 2000-09-30.
$0, same as above.Signed on 2005-08-23. Completion date: 2004-09-30.
$0, same as above.Signed on 2002-09-17. Completion date: 2003-09-30.
-$366,600, same as above.Signed on 2005-08-23. Completion date: 2004-09-30.
Top industries in this zip code by the number of employees in 2005:
Administrative and Support and Waste Management and Remediation Services: Temporary Help Services (over 1000 employees: 1 establishment, 100-249 employees: 1 establishment)
Professional, Scientific, and Technical Services: All Other Professional, Scientific, and Technical Services (over 1000: 1)
2002 - 2018 National Fire Incident Reporting System (NFIRS) incidents
According to the data from the years 2002 - 2018 the average number of fire incidents per year is 131. The highest number of reported fire incidents - 184 took place in 2009, and the least - 102 in 2003. The data has a rising trend.
When looking into fire subcategories, the most reports belonged to: Structure Fires (65.3%), and Outside Fires (15.8%).
Fire incident types reported to NFIRS in Zip Code 60707


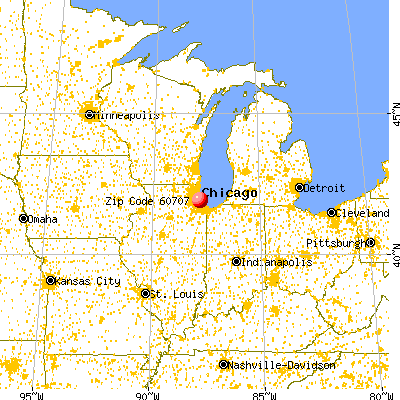


 Nearest zip codes: 60634, 60305, 60171, 60302, 60301, 60706.


 According to the data from the years 2002 - 2018 the average number of fire incidents per year is 131. The highest number of reported fire incidents - 184 took place in 2009, and the least - 102 in 2003. The data has a rising trend.
 When looking into fire subcategories, the most reports belonged to: Structure Fires (65.3%), and Outside Fires (15.8%).