Estimated zip code population in 2022: 11,408 Zip code population in 2010: 11,172 Zip code population in 2000: 11,635
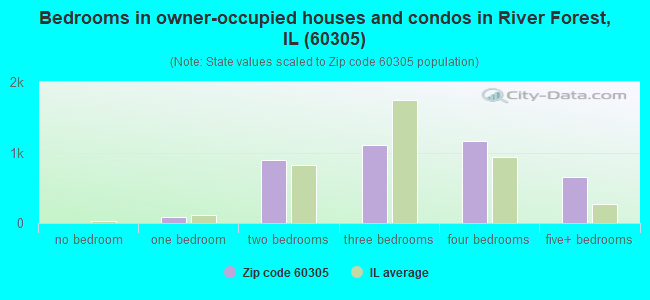
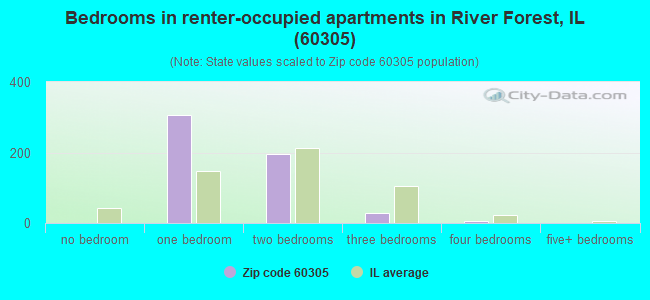
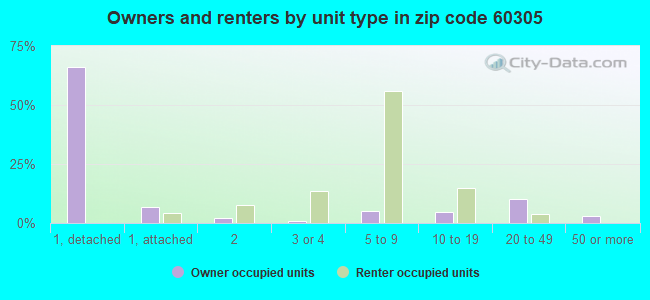
Houses and condos: 4,565 Renter-occupied apartments: 534
% of renters here:
12%
State:
33%
March 2022 cost of living index in zip code 60305: 102.6 (near average, U.S. average is 100)
Land area: 2.5 sq. mi. Water area: 0.0 sq. mi.
Population density: 4,608 people per square mile
(average).
OSM Map
General Map
Google Map
MSN Map
OSM Map
General Map
Google Map
MSN Map
OSM Map
General Map
Google Map
MSN Map
OSM Map
General Map
Google Map
MSN Map
Please wait while loading the map...
Real estate property taxes paid for housing units in 2022:
This zip code:
1.4% ($9,718)
Illinois:
2.0% ($4,912)
Median real estate property taxes paid for housing units with mortgages in 2022: $9,569 (1.3%) Median real estate property taxes paid for housing units with no mortgage in 2022: $9,944 (1.5%)
Business Search- 14 Million verified businesses
Males: 5,528
(48.5%)
Females: 5,880
(51.5%)
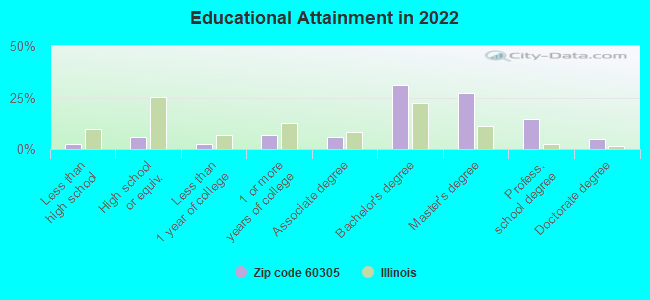
For population 25 years and over in 60305:
High school or higher: 99.2%
Bachelor's degree or higher: 78.3%
Graduate or professional degree: 46.9%
Unemployed: 4.8%
Mean travel time to work (commute): 31.4 minutes
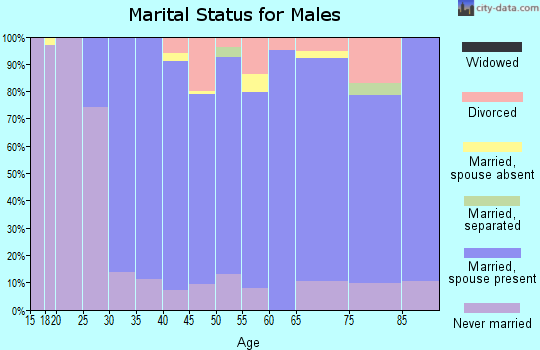
For population 15 years and over in 60305:
Never married: 34.2%
Now married: 54.7%
Separated: 0.9%
Widowed: 5.0%
Divorced: 5.2%
Zip code 60305 compared to state average:
Median household income above state average.
Median house value significantly above state average.
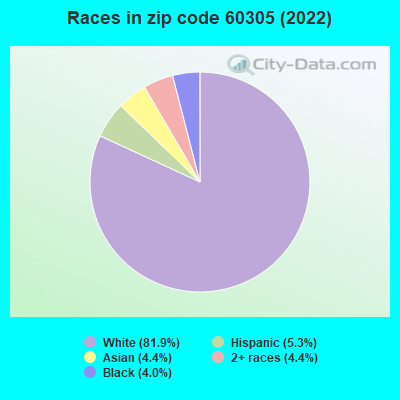
Black race population percentage significantly below state average.
Hispanic race population percentage significantly below state average.
Foreign-born population percentage below state average.
Renting percentage significantly below state average.
Number of rooms per house above state average.
House age above state average.
Percentage of population with a bachelor's degree or higher above state average.
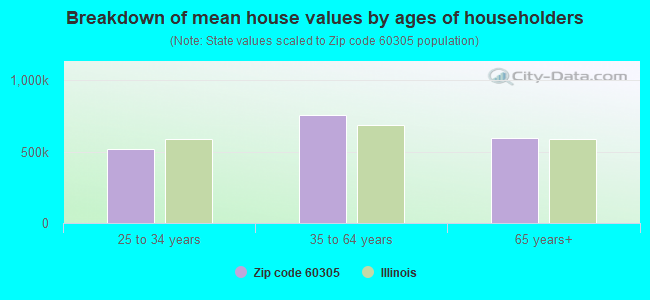
Estimated median house/condo value in 2022: $703,870
60305:
$703,870
Illinois:
$251,600
According to our research of Illinois and other state lists, there was 1 registered sex offender living in 60305 zip code as of April 26, 2024. The ratio of all residents to sex offenders in zip code 60305 is 11,377 to 1. The ratio of registered sex offenders to all residents in this zip code is much lower than the state average.
Median resident age:
This zip code:
40.9 years
Illinois median age:
39.1 years
Average household size:
This zip code:
2.4 people
Illinois:
2.4 people
Averages for the 2020 tax year for zip code 60305, filed in 2021:
Average Adjusted Gross Income (AGI) in 2020: $257,040 (Individual Income Tax Returns)
Here:
$257,040
State:
$82,626
Salary/wage: $174,638 (reported on 76.6% of returns)
Here:
$174,638
State:
$66,640
(% of AGI for various income ranges: 1084.5% for AGIs below $25k, 3421.7% for AGIs $25k-50k, 6716.2% for AGIs $50k-75k, 9532.4% for AGIs $75k-100k, 17823.4% for AGIs $100k-200k, 121906.0% for AGIs over 200k)
Taxable interest for individuals: $5,160 (reported on 53.9% of returns)
This zip code:
$5,160
Illinois:
$2,376
(% of AGI for various income ranges: 48.1% for AGIs below $25k, 51.0% for AGIs $25k-50k, 102.8% for AGIs $50k-75k, 224.3% for AGIs $75k-100k, 256.8% for AGIs $100k-200k, 2642.9% for AGIs over 200k)
Ordinary dividends: $21,734 (reported on 54.1% of returns)
Here:
$21,734
State:
$9,061
(% of AGI for various income ranges: 139.7% for AGIs below $25k, 196.4% for AGIs $25k-50k, 366.2% for AGIs $50k-75k, 630.5% for AGIs $75k-100k, 1485.0% for AGIs $100k-200k, 11086.7% for AGIs over 200k)
Net capital gain/loss in AGI: +$57,573 (reported on 50.0% of returns)
Here:
+$57,573
State:
+$31,684
(% of AGI for various income ranges: 74.1% for AGIs below $25k, 127.6% for AGIs $25k-50k, 275.3% for AGIs $50k-75k, 577.1% for AGIs $75k-100k, 1247.3% for AGIs $100k-200k, 31099.3% for AGIs over 200k)
Profit/loss from business: +$35,116 (reported on 22.3% of returns)
Here:
+$35,116
State:
+$12,175
(% of AGI for various income ranges: 143.9% for AGIs below $25k, 209.5% for AGIs $25k-50k, 308.8% for AGIs $50k-75k, 759.5% for AGIs $75k-100k, 1514.3% for AGIs $100k-200k, 6519.1% for AGIs over 200k)
Taxable individual retirement arrangement distribution: $43,845 (reported on 14.1% of returns)
60305:
$43,845
Illinois:
$21,613
(% of AGI for various income ranges: 71.2% for AGIs below $25k, 177.1% for AGIs $25k-50k, 428.1% for AGIs $50k-75k, 694.8% for AGIs $75k-100k, 1590.7% for AGIs $100k-200k, 4662.0% for AGIs over 200k)
Self-employed (Keogh) retirement plans: $40,488 (reported on 5.0% of returns)
60305:
$40,488
Illinois:
$30,962
(% of AGI for various income ranges: 244.8% for AGIs $100k-200k, 2100.0% for AGIs over 200k)
Total itemized deductions: $42,552 (reported on 32.2% of returns)
Here:
$42,552
State:
$34,948
(% of AGI for various income ranges: 225.0% for AGIs below $25k, 376.2% for AGIs $25k-50k, 775.0% for AGIs $50k-75k, 1236.2% for AGIs $75k-100k, 2372.5% for AGIs $100k-200k, 11578.0% for AGIs over 200k)
Charity contributions: $16,679 (reported on 29.1% of returns)
Here:
$16,679
State:
$13,122
(% of AGI for various income ranges: 13.1% for AGIs below $25k, 38.6% for AGIs $25k-50k, 105.9% for AGIs $50k-75k, 240.0% for AGIs $75k-100k, 495.2% for AGIs $100k-200k, 4833.6% for AGIs over 200k)
Taxes paid: $9,505 (reported on 32.0% of returns)
60305:
$9,505
State:
$8,563
(% of AGI for various income ranges: 55.2% for AGIs below $25k, 95.2% for AGIs $25k-50k, 231.2% for AGIs $50k-75k, 380.5% for AGIs $75k-100k, 725.0% for AGIs $100k-200k, 2266.9% for AGIs over 200k)
Earned income credit: $1,604 (reported on 5.0% of returns)
Here:
$1,604
State:
$2,311
(% of AGI for various income ranges: 41.2% for AGIs below $25k, 36.4% for AGIs $25k-50k)
Percentage of individuals using paid preparers for their 2020 taxes: 90.9%
Here:
91%
State:
93%
(% for various income ranges: 87.4% for AGIs below $25k, 91.5% for AGIs $25k-50k, 88.5% for AGIs $50k-75k, 87.2% for AGIs $75k-100k, 91.3% for AGIs $100k-200k, 94.5% for AGIs over 200k)
Averages for the 2012 tax year for zip code 60305, filed in 2013:
Average Adjusted Gross Income (AGI) in 2012: $196,662 (Individual Income Tax Returns)
Here:
$196,662
State:
$68,058
Salary/wage: $136,039 (reported on 76.5% of returns)
Here:
$136,039
State:
$55,396
(% of AGI for various income ranges: 62.4% for AGIs below $25k, 66.5% for AGIs $25k-50k, 67.0% for AGIs $50k-75k, 60.5% for AGIs $75k-100k, 63.8% for AGIs $100k-200k, 49.7% for AGIs over 200k)
Taxable interest for individuals: $5,134 (reported on 56.9% of returns)
This zip code:
$5,134
Illinois:
$1,969
(% of AGI for various income ranges: 2.8% for AGIs below $25k, 1.8% for AGIs $25k-50k, 1.2% for AGIs $50k-75k, 1.6% for AGIs $75k-100k, 1.3% for AGIs $100k-200k, 1.5% for AGIs over 200k)
Ordinary dividends: $16,406 (reported on 52.9% of returns)
Here:
$16,406
State:
$7,786
(% of AGI for various income ranges: 9.4% for AGIs below $25k, 6.0% for AGIs $25k-50k, 4.0% for AGIs $50k-75k, 5.4% for AGIs $75k-100k, 4.6% for AGIs $100k-200k, 4.2% for AGIs over 200k)
Net capital gain/loss in AGI: +$45,403 (reported on 46.2% of returns)
Here:
+$45,403
State:
+$22,183
(% of AGI for various income ranges: 1.4% for AGIs below $25k, 1.3% for AGIs $25k-50k, 2.2% for AGIs $50k-75k, 1.1% for AGIs $75k-100k, 2.9% for AGIs $100k-200k, 13.1% for AGIs over 200k)
Profit/loss from business: +$33,491 (reported on 21.6% of returns)
Here:
+$33,491
State:
+$12,903
(% of AGI for various income ranges: 8.7% for AGIs below $25k, 4.7% for AGIs $25k-50k, 4.3% for AGIs $50k-75k, 6.0% for AGIs $75k-100k, 4.7% for AGIs $100k-200k, 3.3% for AGIs over 200k)
Taxable individual retirement arrangement distribution: $39,030 (reported on 17.9% of returns)
60305:
$39,030
Illinois:
$17,929
(% of AGI for various income ranges: 5.5% for AGIs below $25k, 5.3% for AGIs $25k-50k, 4.6% for AGIs $50k-75k, 5.2% for AGIs $75k-100k, 6.0% for AGIs $100k-200k, 3.0% for AGIs over 200k)
Self-employment retirement plans: $31,773 (reported on 5.0% of returns)
60305:
$31,773
Illinois:
$24,666
Total itemized deductions: $50,278 (17% of AGI, reported on 61.3% of returns)
Here:
$50,278
State:
$26,433
Here:
16.5% of AGI
State:
19.2% of AGI
(% of AGI for various income ranges: 29.7% for AGIs below $25k, 24.2% for AGIs $25k-50k, 23.8% for AGIs $50k-75k, 24.6% for AGIs $75k-100k, 22.2% for AGIs $100k-200k, 13.4% for AGIs over 200k)
Charity contributions: $8,506 (reported on 55.7% of returns)
Here:
$8,506
State:
$4,525
(% of AGI for various income ranges: 2.0% for AGIs below $25k, 2.3% for AGIs $25k-50k, 2.7% for AGIs $50k-75k, 2.7% for AGIs $75k-100k, 2.4% for AGIs $100k-200k, 2.4% for AGIs over 200k)
Taxes paid: $27,843 (reported on 60.9% of returns)
60305:
$27,843
State:
$11,968
(% of AGI for various income ranges: 11.2% for AGIs below $25k, 10.5% for AGIs $25k-50k, 10.6% for AGIs $50k-75k, 11.9% for AGIs $75k-100k, 11.7% for AGIs $100k-200k, 7.8% for AGIs over 200k)
Earned income credit: $1,466 (reported on 5.5% of returns)
Here:
$1,466
State:
$2,349
(% of AGI for various income ranges: 2.4% for AGIs below $25k, 0.4% for AGIs $25k-50k)
Percentage of individuals using paid preparers for their 2012 taxes: 62.8%
Here:
63%
State:
57%
(% for various income ranges: 55.5% for AGIs below $25k, 54.9% for AGIs $25k-50k, 57.4% for AGIs $50k-75k, 64.9% for AGIs $75k-100k, 65.6% for AGIs $100k-200k, 75.4% for AGIs over 200k)
Averages for the 2004 tax year for zip code 60305, filed in 2005:
Average Adjusted Gross Income (AGI) in 2004: $151,767 (Individual Income Tax Returns)
Here:
$151,767
State:
$54,625
Salary/wage: $109,528 (reported on 74.5% of returns)
Here:
$109,528
State:
$46,811
(% of AGI for various income ranges: 58.5% for AGIs $10k-25k, 71.4% for AGIs $25k-50k, 70.4% for AGIs $50k-75k, 64.4% for AGIs $75k-100k, 50.7% for AGIs over 100k)
Taxable interest for individuals: $6,114 (reported on 70.5% of returns)
This zip code:
$6,114
Illinois:
$2,101
(% of AGI for various income ranges: 7.2% for AGIs $10k-25k, 4.1% for AGIs $25k-50k, 3.5% for AGIs $50k-75k, 3.8% for AGIs $75k-100k, 2.5% for AGIs over 100k)
Taxable dividends: $10,815 (reported on 59.9% of returns)
Here:
$10,815
State:
$4,306
(% of AGI for various income ranges: 8.9% for AGIs $10k-25k, 5.0% for AGIs $25k-50k, 3.8% for AGIs $50k-75k, 3.6% for AGIs $75k-100k, 4.1% for AGIs over 100k)
Net capital gain/loss: +$43,586 (reported on 51.5% of returns)
Here:
+$43,586
State:
+$17,321
(% of AGI for various income ranges: 2.5% for AGIs $10k-25k, 2.0% for AGIs $25k-50k, 2.4% for AGIs $50k-75k, 3.0% for AGIs $75k-100k, 16.6% for AGIs over 100k)
Profit/loss from business: +$37,590 (reported on 19.8% of returns)
Here:
+$37,590
State:
+$11,771
(% of AGI for various income ranges: 7.6% for AGIs $10k-25k, 3.6% for AGIs $25k-50k, 4.8% for AGIs $50k-75k, 4.8% for AGIs $75k-100k, 4.8% for AGIs over 100k)
IRA payment deduction: $3,455 (reported on 4.0% of returns)
60305:
$3,455
Illinois:
$3,087
(% of AGI for various income ranges: 0.4% for AGIs $10k-25k, 0.3% for AGIs $25k-50k, 0.3% for AGIs $50k-75k, 0.3% for AGIs $75k-100k, 0.0% for AGIs over 100k)
Self-employed pension: $23,517 (reported on 6.0% of returns)
Here:
$23,517
Illinois:
$16,965
(% of AGI for various income ranges: 0.5% for AGIs $50k-75k, 0.4% for AGIs $75k-100k, 1.0% for AGIs over 100k)
Total itemized deductions: $35,143 (14% of AGI, reported on 58.5% of returns)
Here:
$35,143
State:
$20,239
Here:
14.4% of AGI
State:
19.5% of AGI
(% of AGI for various income ranges: 26.1% for AGIs $10k-25k, 24.9% for AGIs $25k-50k, 24.0% for AGIs $50k-75k, 24.3% for AGIs $75k-100k, 11.6% for AGIs over 100k)
Charity contributions deductions: $8,481 (3% of AGI, reported on 54.8% of returns)
Here:
$8,481
State:
$3,719
Here:
3.3% of AGI
State:
3.4% of AGI
(% of AGI for various income ranges: 2.5% for AGIs $10k-25k, 3.1% for AGIs $25k-50k, 3.5% for AGIs $50k-75k, 3.7% for AGIs $75k-100k, 3.0% for AGIs over 100k)
Total tax: $40,961 (reported on 79.7% of returns)
60305:
$40,961
State:
$9,882
(% of AGI for various income ranges: 5.3% for AGIs $10k-25k, 7.8% for AGIs $25k-50k, 10.0% for AGIs $50k-75k, 10.7% for AGIs $75k-100k, 23.3% for AGIs over 100k)
Earned income credit: $1,402 (reported on 3.8% of returns)
Here:
$1,402
State:
$1,788
Percentage of individuals using paid preparers for their 2004 taxes: 64.8%
Here:
65%
State:
61%
(% for various income ranges: 59.7% for AGIs below $10k, 61.6% for AGIs $10k-25k, 59.3% for AGIs $25k-50k, 59.4% for AGIs $50k-75k, 65.5% for AGIs $75k-100k, 73.4% for AGIs over 100k)
Household received Food Stamps/SNAP in the past 12 months: 60 Household did not receive Food Stamps/SNAP in the past 12 months: 4,282
Women who had a birth in the past 12 months: 111 (98 now married, 12 unmarried) Women who did not have a birth in the past 12 months: 2,240 (1,025 now married, 1,210 unmarried)
Housing units in zip code 60305 with a mortgage: 2,373 (278 second mortgage, 7 home equity loan, 257 both second mortgage and home equity loan) Houses without a mortgage: 71
Median monthly owner costs for units with a mortgage: $3,506 Median monthly owner costs for units without a mortgage: $1,519
Residents with income below the poverty level in 2022:
This zip code:
1.3%
Whole state:
11.9%
Residents with income below 50% of the poverty level in 2022:
This zip code:
0.3%
Whole state:
5.7%
Median number of rooms in houses and condos:
Here:
7.7
State:
6.4
Median number of rooms in apartments:
Here:
4.0
State:
4.1
Notable locations in this zip code not listed on our city pages
Notable locations in zip code 60305: Rebecca Crown Memorial Library (A), Power Hall (B), Mother Samuel Coughlin Hall (C), Mazzuchelli Hall (D), Lewis Hall (E), Albertus Magnus Science Hall (F), Mary Martha Hall and Computer Center (G), Lindemann Hall (H), Kretzmann Hall (I), Krentz Center (J), Krauss Hall (K), Kohn Hall (L), Koehneke Community Center (M), Klinck Memorial Library (N), Jonathan Hall (O), Gross Hall (P), Geiseman Gymnasium (Q), Fred A Spurgat Building (R), Eifrig Hall (S), David Hall (T). Display/hide their locations on the map
Churches in zip code 60305 include: Chapel of Our Lord (A), Christ Episcopal Church (B), First Church of Christ Scientist (C), First Presbyterian Church (D), Grace Evangelical Lutheran Church (E), River Forest Methodist Church (F), Saint Luke Roman Catholic Church (G), Saint Vincent Ferrer Church (H), West Suburban Temple Har Zion (I). Display/hide their locations on the map
Parks in zip code 60305 include: Cummings Square (1), Thatcher Woods Glen (2), Keystone Park (3), Constitution Park (4). Display/hide their locations on the map
In group quarters: 967 (-1 institutionalized population)
Size of family households: 1,270 2-persons, 709 3-persons, 627 4-persons, 179 5-persons, 109 6-persons, 20 7-or-more-persons
Size of nonfamily households: 1,383 1-person, 87 2-persons, 20 4-persons
2,399 married couples with children.
230 single-parent households (51 men, 179 women).
87.9% of residents of 60305 zip code speak English at home.
3.5% of residents speak Spanish at home (68% very well, 29% well, 3% not well).
5.5% of residents speak other Indo-European language at home (61% very well, 11% well, 17% not well, 11% not at all).
2.4% of residents speak Asian or Pacific Island language at home (66% very well, 24% well, 10% not well).
0.5% of residents speak other language at home (80% very well, 20% not well).
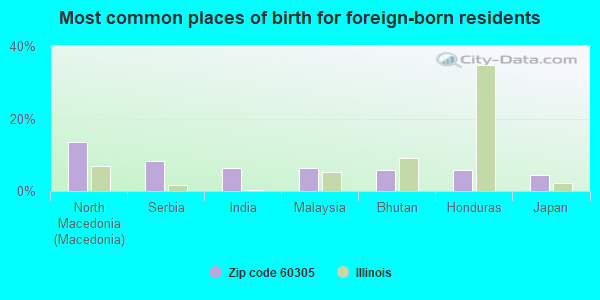
Foreign born population: 1,016 (8.9%) (67.8% of them are naturalized citizens)
This zip code:
8.9%
Whole state:
14.4%
13%North Macedonia (Macedonia)
8%Serbia
6%India
6%Malaysia
6%Bhutan
6%Honduras
4%Japan
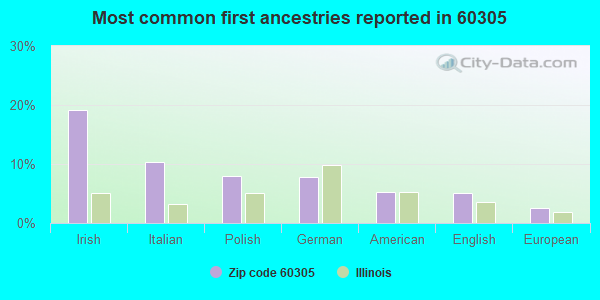
19%Irish
10%Italian
8%Polish
8%German
5%American
5%English
3%European
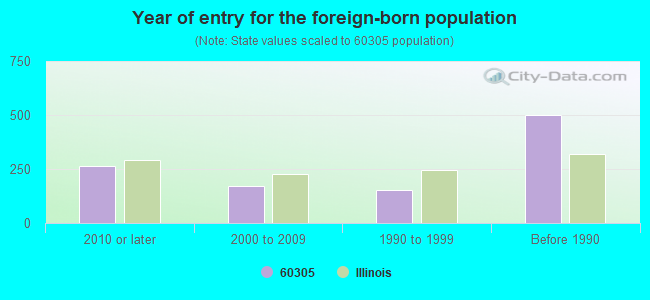
Year of entry for the foreign-born population
2632010 or later
1702000 to 2009
1551990 to 1999
501Before 1990
Major facilities with environmental interests located in this zip code:
RIVER FOREST CSOS (400 PARK AVENUE in RIVER FOREST, IL)
STATE MASTER (Illinois EPA Project) - DRINKING WATER PROGRAM STATE MASTER (Illinois EPA Project) - National Pollutant Discharge Elimination System Permit National Pollutant Discharge Elimination System NON-MAJOR (Tracking pollutant discharge elimination systems) - permit Business SIC classification: NONCLASSIFIABLE ESTABLISHMENTS Alternative names: RIVER FOREST CSOS, VILLAGE OF
RIVER FOREST CLEANERS (7613 LAKE ST in RIVER FOREST, IL)
STATE MASTER (Illinois EPA Project) - HAZARDOUS WASTE PROGRAM, AIR PROGRAM AIR MINOR (AIRS/AFS) CRITERIA AND HAZARDOUS AIR POLLUTANT INVENTORY (Inventory of air pollution sources) Small Quantity Generators, between 100 kg and 1000 kg of hazardous waste/month (Resource Conservation and Recovery Act (tracking hazardous waste)) - notification Business SIC classification: DRYCLEANING PLANTS, EXCEPT RUG CLEANING Business NAICS classification: DRYCLEANING AND LAUNDRY SERVICES (EXCEPT COIN-OPERATED). Organizations: DITCHFIELD EDWARD (CONTACT/OWNER)
CONCORDIA UNIVERSITY (7400 AUGUSTA ST in RIVER FOREST, IL)
STATE MASTER (Illinois EPA Project) - HAZARDOUS WASTE PROGRAM, AIR PROGRAM, SOLID WASTE PROGRAM AIR MINOR (AIRS/AFS) CRITERIA AND HAZARDOUS AIR POLLUTANT INVENTORY (Inventory of air pollution sources) Conditionally Exempt Small Quantity Generators, less than 100 kg/month of hazardous waste (Resource Conservation and Recovery Act (tracking hazardous waste)) - notification Business SIC classification: AUTOMATIC CONTROLS FOR REGULATING RESIDENTIAL AND COMMERCIAL ENVIRONMENTS AND APPLIANCES Business NAICS classification: AUTOMATIC ENVIRONMENTAL CONTROL MANUFACTURING FOR RESIDENTIAL, COMMERCIAL, AND APPLIANCE USE.
RIVER FOREST, VILLAGE OF (45 FOREST AVE in RIVER FOREST, IL)
STATE MASTER (Illinois EPA Project) - SOLID WASTE PROGRAM, HAZARDOUS WASTE PROGRAM Large Quantity Generators, more that 1000 kg of hazardous waste/month (Resource Conservation and Recovery Act (tracking hazardous waste)) - notification Organizations: RIVER FOREST VILLAGE OF (CONTACT/OWNER)
Alternative names: RIVER FOREST VILLAGE OF PUBLIC WKS BLDG
RIVER FOREST, VILLAGE OF (410 PARK AVE in RIVER FOREST, IL)
STATE MASTER (Illinois EPA Project) - SOLID WASTE PROGRAM, HAZARDOUS WASTE PROGRAM Large Quantity Generators, more that 1000 kg of hazardous waste/month (Resource Conservation and Recovery Act (tracking hazardous waste)) - notification Organizations: RIVER FOREST VILLAGE OF (CONTACT/OWNER)
Alternative names: RIVER FOREST VILLAGE OF FIRE DEPT
ALLEN REALTY & BUILDERS (7720 LAKE ST in RIVER FOREST, IL)
STATE MASTER (Illinois EPA Project) - SOLID WASTE PROGRAM (Resource Conservation and Recovery Act (tracking hazardous waste)) Organizations: ALLEN ROBERT P (CONTACT/OWNER)
LUTHERAN CHILD AND FAMILY SERVICES (7620 MADISON in RIVER FOREST, IL)
STATE MASTER (Illinois EPA Project) - AIR PROGRAM AIR MINOR (AIRS/AFS) Business SIC classification: OPERATORS OF NONRESIDENTIAL BUILDINGS
RIVER FOREST GARDEN APTS/CONDO ASSN (7208 OAK in RIVER FOREST, IL)
STATE MASTER (Illinois EPA Project) - AIR PROGRAM AIR MINOR (AIRS/AFS) CRITERIA AND HAZARDOUS AIR POLLUTANT INVENTORY (Inventory of air pollution sources) Business SIC classification: NONCLASSIFIABLE ESTABLISHMENTS Alternative names: RIVER FOREST GARDEN APTS CONDO ASSOC
ROOSEVELT SCHOOL (7560 OAK AVE in RIVER FOREST, IL)
(Geographic Names Information System) (National Center for Education Statistics) - STATE ID-1401609001002 Organizations: RIVER FOREST SCHOOL DIST 90 (SCHOOL DISTRICT)
ATLANTIC RICHFIELD CO (HARLEM & CHICAGO AVE in RIVER FOREST, IL)
STATE MASTER (Illinois EPA Project) - AIR PROGRAM AIR MINOR (AIRS/AFS) Business SIC classification: PETROLEUM BULK STATIONS AND TERMINALS
HOY LANDSCAPING (345 ASHLAND AVE in RIVER FOREST, IL)
STATE MASTER (Illinois EPA Project) - AIR PROGRAM AIR MINOR (AIRS/AFS) Business SIC classification: NONCLASSIFIABLE ESTABLISHMENTS
DANIEL FORBES CO (7310 W CARDINAL AVE in RIVER FOREST, IL)
STATE MASTER (Illinois EPA Project) - AIR PROGRAM AIR MINOR (AIRS/AFS) Business SIC classification: NONCLASSIFIABLE ESTABLISHMENTS
RIVER FOREST MARKET (7625 W LAKE ST in RIVER FOREST, IL)
STATE MASTER (Illinois EPA Project) - AIR PROGRAM AIR MINOR (AIRS/AFS) Business SIC classification: GROCERY STORES
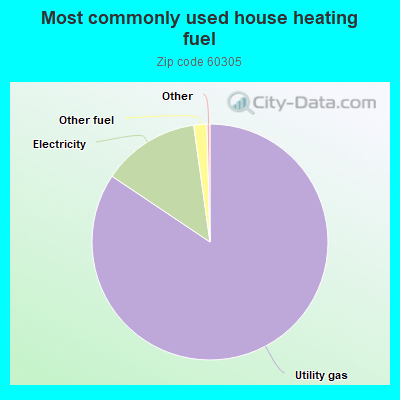
84.5%Utility gas
13.4%Electricity
1.8%Other fuel
Population in 1990: 11,669.
Place of birth for U.S.-born residents:
This state: 7,522
Northeast: 606
Midwest: 1,166
South: 644
West: 376
61% of the 60305 zip code residents lived in the same house 5 years ago. Out of people who lived in different houses, 74% lived in this county. Out of people who lived in different counties, 50% lived in Illinois.
91% of the 60305 zip code residents lived in the same house 1 year ago. Out of people who lived in different houses, 74% moved from this county. Out of people who lived in different houses, 8% moved from different county within same state. Out of people who lived in different houses, 14% moved from different state.
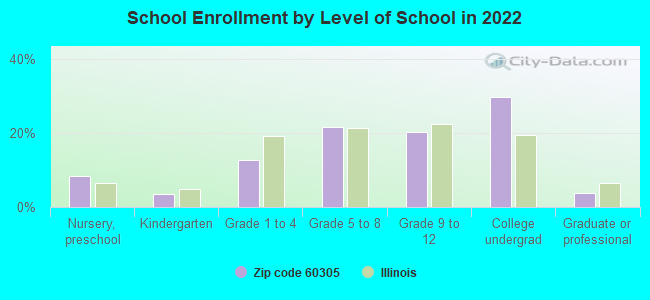
Private vs. public school enrollment:
Students in private schools in grades 1 to 8 (elementary and middle school): 178
Here:
14.7%
Illinois:
13.3%
Students in private schools in grades 9 to 12 (high school): 188
Here:
26.3%
Illinois:
9.9%
Students in private undergraduate colleges: 667
Here:
63.4%
Illinois:
27.4%
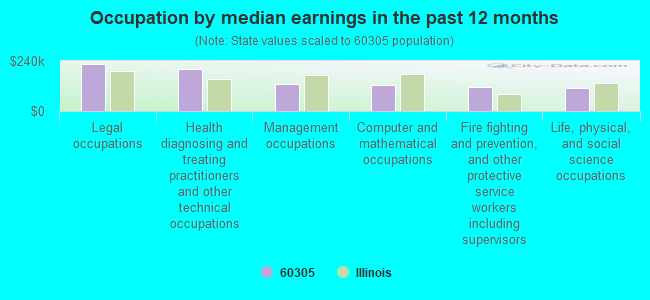
Occupation by median earnings in the past 12 months ($)
225,393Legal occupations
200,694Health diagnosing and treating practitioners and other technical occupations
129,070Management occupations
127,189Computer and mathematical occupations
113,098Fire fighting and prevention, and other protective service workers including supervisors
111,798Life, physical, and social science occupations
Companies with federal contracts located in this zip code:
WATERLOO, DAN (400 ASHLAND AVE in RIVER FOREST, IL; small business) : $35,437 in 4 contractsin 2005
$14,987 with NASA for . Taking place in TX. Signed on 2005-02-16. Effective on 2005-03-08. Completion date: 2005-03-10.
$10,225 with Air Force for Education -- Engineering Development (R&D). Taking place in FL. Signed on 2005-09-20. Completion date: 2006-03-20.
$10,225 with NASA for . Signed on 2005-04-12. Completion date: 2005-04-27.
$0, same as above.Signed on 2005-04-13. Completion date: 2005-04-27.
Top industries in this zip code by the number of employees in 2005:
Educational Services: Colleges, Universities, and Professional Schools (500-999 employees: 2 establishments)
Other Services (except Public Administration): Religious Organizations (50-99: 2, 10-19: 2, 5-9: 1, 1-4: 3)
Educational Services: Elementary and Secondary Schools (50-99: 2, 20-49: 1)
Health Care and Social Assistance: Medical Laboratories (100-249: 1)
Health Care and Social Assistance: Offices of Physicians (except Mental Health Specialists) (20-49: 1, 10-19: 3, 5-9: 7, 1-4: 17)
Detailed PMIC statistics for the following Tracts:8119.00
, 8120.00
2002 - 2018 National Fire Incident Reporting System (NFIRS) incidents
According to the data from the years 2002 - 2018 the average number of fires per year is 55. The highest number of fires - 81 took place in 2007, and the least - 5 in 2002. The data has an increasing trend.
When looking into fire subcategories, the most reports belonged to: Structure Fires (79.9%), and Outside Fires (13.9%).
Fire incident types reported to NFIRS in Zip Code 60305

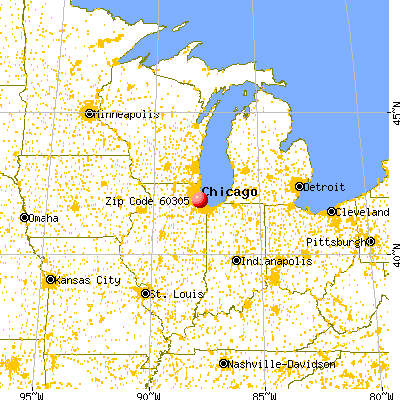


 Nearest zip codes: 60301, 60130, 60153, 60302, 60707, 60171.
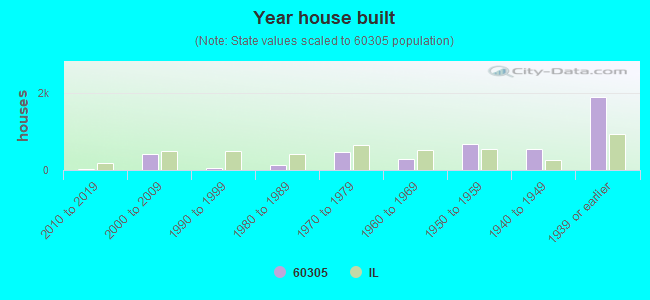


 According to the data from the years 2002 - 2018 the average number of fires per year is 55. The highest number of fires - 81 took place in 2007, and the least - 5 in 2002. The data has an increasing trend.
 When looking into fire subcategories, the most reports belonged to: Structure Fires (79.9%), and Outside Fires (13.9%).