Estimated zip code population in 2022: 74,828 Zip code population in 2010: 74,298 Zip code population in 2000: 74,164
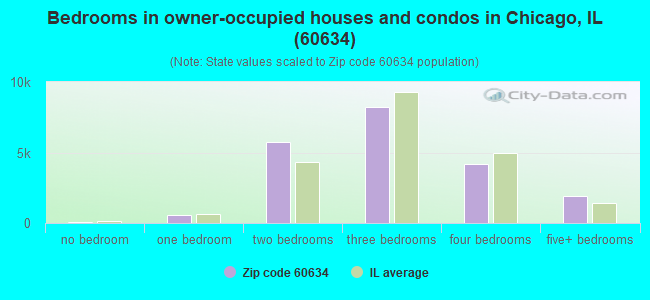
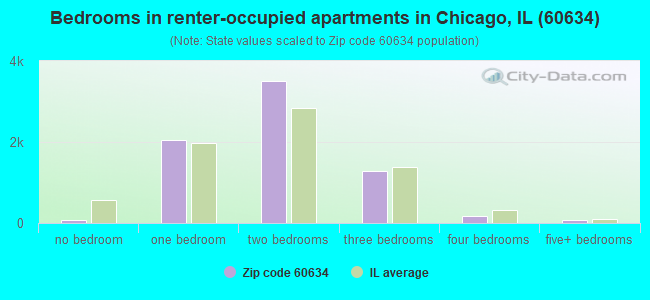
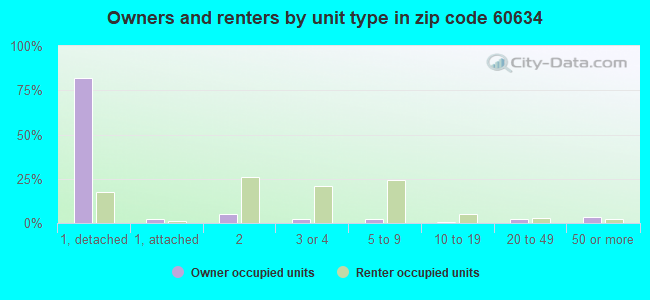
Houses and condos: 29,343 Renter-occupied apartments: 7,203
% of renters here:
26%
State:
33%
March 2022 cost of living index in zip code 60634: 101.3 (near average, U.S. average is 100)
Land area: 7.1 sq. mi. Water area: 0.0 sq. mi.
Population density: 10,520 people per square mile
(high).
OSM Map
General Map
Google Map
MSN Map
OSM Map
General Map
Google Map
MSN Map
OSM Map
General Map
Google Map
MSN Map
OSM Map
General Map
Google Map
MSN Map
Please wait while loading the map...
Real estate property taxes paid for housing units in 2022:
This zip code:
1.4% ($4,671)
Illinois:
2.0% ($4,912)
Median real estate property taxes paid for housing units with mortgages in 2022: $4,733 (1.4%) Median real estate property taxes paid for housing units with no mortgage in 2022: $4,514 (1.4%)
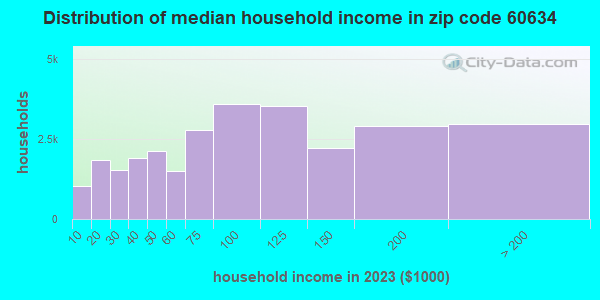
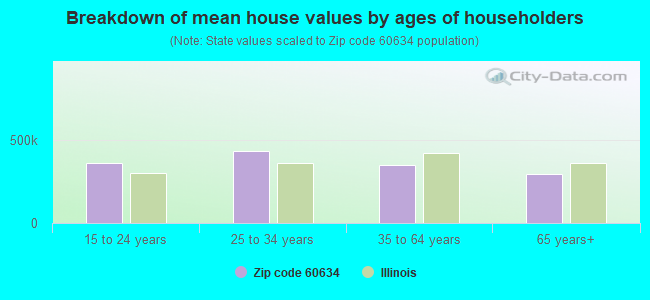
Estimated median house/condo value in 2022: $337,992
60634:
$337,992
Illinois:
$251,600
According to our research of Illinois and other state lists, there were 29 registered sex offenders living in 60634 zip code as of April 27, 2024. The ratio of all residents to sex offenders in zip code 60634 is 2,567 to 1. The ratio of registered sex offenders to all residents in this zip code is much lower than the state average.
Median resident age:
This zip code:
41.6 years
Illinois median age:
39.1 years
Average household size:
This zip code:
2.7 people
Illinois:
2.4 people
Averages for the 2020 tax year for zip code 60634, filed in 2021:
Average Adjusted Gross Income (AGI) in 2020: $53,998 (Individual Income Tax Returns)
Here:
$53,998
State:
$82,626
Salary/wage: $53,332 (reported on 77.9% of returns)
Here:
$53,332
State:
$66,640
(% of AGI for various income ranges: 1088.8% for AGIs below $25k, 3609.5% for AGIs $25k-50k, 6629.4% for AGIs $50k-75k, 9745.5% for AGIs $75k-100k, 17115.4% for AGIs $100k-200k, 47577.7% for AGIs over 200k)
Taxable interest for individuals: $1,126 (reported on 22.2% of returns)
This zip code:
$1,126
Illinois:
$2,376
(% of AGI for various income ranges: 21.9% for AGIs below $25k, 20.5% for AGIs $25k-50k, 31.5% for AGIs $50k-75k, 51.6% for AGIs $75k-100k, 86.7% for AGIs $100k-200k, 258.4% for AGIs over 200k)
Ordinary dividends: $3,174 (reported on 12.1% of returns)
Here:
$3,174
State:
$9,061
(% of AGI for various income ranges: 15.8% for AGIs below $25k, 20.1% for AGIs $25k-50k, 45.7% for AGIs $50k-75k, 76.8% for AGIs $75k-100k, 145.3% for AGIs $100k-200k, 1109.0% for AGIs over 200k)
Net capital gain/loss in AGI: +$7,172 (reported on 10.8% of returns)
Here:
+$7,172
State:
+$31,684
(% of AGI for various income ranges: 6.9% for AGIs below $25k, 18.1% for AGIs $25k-50k, 65.6% for AGIs $50k-75k, 82.9% for AGIs $75k-100k, 289.0% for AGIs $100k-200k, 4459.0% for AGIs over 200k)
Profit/loss from business: +$9,757 (reported on 21.1% of returns)
Here:
+$9,757
State:
+$12,175
(% of AGI for various income ranges: 391.0% for AGIs below $25k, 290.3% for AGIs $25k-50k, 213.5% for AGIs $50k-75k, 152.7% for AGIs $75k-100k, 249.8% for AGIs $100k-200k, 1146.1% for AGIs over 200k)
Taxable individual retirement arrangement distribution: $13,915 (reported on 5.6% of returns)
60634:
$13,915
Illinois:
$21,613
(% of AGI for various income ranges: 47.8% for AGIs below $25k, 50.6% for AGIs $25k-50k, 114.0% for AGIs $50k-75k, 169.3% for AGIs $75k-100k, 312.3% for AGIs $100k-200k, 1038.1% for AGIs over 200k)
Self-employed (Keogh) retirement plans: $11,025 (reported on 0.1% of returns)
60634:
$11,025
Illinois:
$30,962
(% of AGI for various income ranges: 14.4% for AGIs $100k-200k)
Total itemized deductions: $23,577 (reported on 8.1% of returns)
Here:
$23,577
State:
$34,948
(% of AGI for various income ranges: 51.8% for AGIs below $25k, 115.2% for AGIs $25k-50k, 345.7% for AGIs $50k-75k, 592.6% for AGIs $75k-100k, 744.3% for AGIs $100k-200k, 2113.2% for AGIs over 200k)
Charity contributions: $4,084 (reported on 5.7% of returns)
Here:
$4,084
State:
$13,122
(% of AGI for various income ranges: 2.2% for AGIs below $25k, 8.8% for AGIs $25k-50k, 35.4% for AGIs $50k-75k, 60.9% for AGIs $75k-100k, 122.8% for AGIs $100k-200k, 372.6% for AGIs over 200k)
Taxes paid: $7,914 (reported on 8.1% of returns)
60634:
$7,914
State:
$8,563
(% of AGI for various income ranges: 11.8% for AGIs below $25k, 34.5% for AGIs $25k-50k, 114.6% for AGIs $50k-75k, 215.9% for AGIs $75k-100k, 260.3% for AGIs $100k-200k, 651.0% for AGIs over 200k)
Earned income credit: $1,986 (reported on 15.5% of returns)
Here:
$1,986
State:
$2,311
(% of AGI for various income ranges: 88.1% for AGIs below $25k, 59.8% for AGIs $25k-50k, 0.7% for AGIs $50k-75k)
Percentage of individuals using paid preparers for their 2020 taxes: 89.6%
Here:
90%
State:
93%
(% for various income ranges: 86.1% for AGIs below $25k, 91.0% for AGIs $25k-50k, 91.5% for AGIs $50k-75k, 90.9% for AGIs $75k-100k, 92.5% for AGIs $100k-200k, 93.3% for AGIs over 200k)
Averages for the 2012 tax year for zip code 60634, filed in 2013:
Average Adjusted Gross Income (AGI) in 2012: $41,785 (Individual Income Tax Returns)
Here:
$41,785
State:
$68,058
Salary/wage: $43,051 (reported on 75.8% of returns)
Here:
$43,051
State:
$55,396
(% of AGI for various income ranges: 61.7% for AGIs below $25k, 80.8% for AGIs $25k-50k, 81.5% for AGIs $50k-75k, 82.0% for AGIs $75k-100k, 82.4% for AGIs $100k-200k, 60.8% for AGIs over 200k)
Taxable interest for individuals: $1,024 (reported on 28.7% of returns)
This zip code:
$1,024
Illinois:
$1,969
(% of AGI for various income ranges: 1.2% for AGIs below $25k, 0.6% for AGIs $25k-50k, 0.5% for AGIs $50k-75k, 0.6% for AGIs $75k-100k, 0.6% for AGIs $100k-200k, 1.4% for AGIs over 200k)
Ordinary dividends: $3,114 (reported on 12.6% of returns)
Here:
$3,114
State:
$7,786
(% of AGI for various income ranges: 1.0% for AGIs below $25k, 0.7% for AGIs $25k-50k, 0.8% for AGIs $50k-75k, 0.8% for AGIs $75k-100k, 1.0% for AGIs $100k-200k, 2.7% for AGIs over 200k)
Net capital gain/loss in AGI: +$2,145 (reported on 8.2% of returns)
Here:
+$2,145
State:
+$22,183
(% of AGI for various income ranges: 0.2% for AGIs $50k-75k, 0.1% for AGIs $75k-100k, 0.7% for AGIs $100k-200k, 4.4% for AGIs over 200k)
Profit/loss from business: +$9,509 (reported on 22.6% of returns)
Here:
+$9,509
State:
+$12,903
(% of AGI for various income ranges: 23.7% for AGIs below $25k, 5.4% for AGIs $25k-50k, 1.8% for AGIs $50k-75k, 1.1% for AGIs $75k-100k, 1.2% for AGIs $100k-200k, 2.6% for AGIs over 200k)
Taxable individual retirement arrangement distribution: $11,960 (reported on 7.6% of returns)
60634:
$11,960
Illinois:
$17,929
(% of AGI for various income ranges: 2.8% for AGIs below $25k, 1.9% for AGIs $25k-50k, 1.9% for AGIs $50k-75k, 2.1% for AGIs $75k-100k, 2.3% for AGIs $100k-200k, 2.6% for AGIs over 200k)
Self-employment retirement plans: $12,725 (reported on 0.1% of returns)
60634:
$12,725
Illinois:
$24,666
Total itemized deductions: $19,065 (25% of AGI, reported on 29.1% of returns)
Here:
$19,065
State:
$26,433
Here:
24.8% of AGI
State:
19.2% of AGI
(% of AGI for various income ranges: 8.1% for AGIs below $25k, 10.8% for AGIs $25k-50k, 14.7% for AGIs $50k-75k, 15.9% for AGIs $75k-100k, 15.5% for AGIs $100k-200k, 11.5% for AGIs over 200k)
Charity contributions: $1,887 (reported on 22.5% of returns)
Here:
$1,887
State:
$4,525
(% of AGI for various income ranges: 0.3% for AGIs below $25k, 0.7% for AGIs $25k-50k, 1.1% for AGIs $50k-75k, 1.2% for AGIs $75k-100k, 1.4% for AGIs $100k-200k, 1.3% for AGIs over 200k)
Taxes paid: $7,404 (reported on 29.0% of returns)
60634:
$7,404
State:
$11,968
(% of AGI for various income ranges: 2.4% for AGIs below $25k, 3.6% for AGIs $25k-50k, 5.7% for AGIs $50k-75k, 6.1% for AGIs $75k-100k, 6.6% for AGIs $100k-200k, 5.8% for AGIs over 200k)
Earned income credit: $2,004 (reported on 20.6% of returns)
Here:
$2,004
State:
$2,349
(% of AGI for various income ranges: 5.9% for AGIs below $25k, 1.1% for AGIs $25k-50k)
Percentage of individuals using paid preparers for their 2012 taxes: 64.8%
Here:
65%
State:
57%
(% for various income ranges: 62.8% for AGIs below $25k, 65.6% for AGIs $25k-50k, 67.5% for AGIs $50k-75k, 66.8% for AGIs $75k-100k, 65.9% for AGIs $100k-200k, 73.1% for AGIs over 200k)
Averages for the 2004 tax year for zip code 60634, filed in 2005:
Average Adjusted Gross Income (AGI) in 2004: $35,380 (Individual Income Tax Returns)
Here:
$35,380
State:
$54,625
Salary/wage: $37,325 (reported on 74.0% of returns)
Here:
$37,325
State:
$46,811
(% of AGI for various income ranges: 54.0% for AGIs below $10k, 65.6% for AGIs $10k-25k, 83.0% for AGIs $25k-50k, 84.0% for AGIs $50k-75k, 84.2% for AGIs $75k-100k, 70.2% for AGIs over 100k)
Taxable interest for individuals: $1,414 (reported on 48.3% of returns)
This zip code:
$1,414
Illinois:
$2,101
(% of AGI for various income ranges: 5.4% for AGIs below $10k, 3.3% for AGIs $10k-25k, 1.7% for AGIs $25k-50k, 1.5% for AGIs $50k-75k, 1.3% for AGIs $75k-100k, 1.9% for AGIs over 100k)
Taxable dividends: $1,971 (reported on 17.0% of returns)
Here:
$1,971
State:
$4,306
(% of AGI for various income ranges: 2.1% for AGIs below $10k, 1.4% for AGIs $10k-25k, 0.8% for AGIs $25k-50k, 0.8% for AGIs $50k-75k, 0.8% for AGIs $75k-100k, 1.1% for AGIs over 100k)
Net capital gain/loss: +$7,458 (reported on 11.4% of returns)
Here:
+$7,458
State:
+$17,321
(% of AGI for various income ranges: -0.8% for AGIs below $10k, 0.3% for AGIs $10k-25k, 0.3% for AGIs $25k-50k, 0.7% for AGIs $50k-75k, 1.6% for AGIs $75k-100k, 10.1% for AGIs over 100k)
Profit/loss from business: +$8,469 (reported on 23.3% of returns)
Here:
+$8,469
State:
+$11,771
(% of AGI for various income ranges: 42.5% for AGIs below $10k, 17.6% for AGIs $10k-25k, 4.6% for AGIs $25k-50k, 2.1% for AGIs $50k-75k, 1.2% for AGIs $75k-100k, 1.6% for AGIs over 100k)
IRA payment deduction: $2,889 (reported on 2.5% of returns)
60634:
$2,889
Illinois:
$3,087
(% of AGI for various income ranges: 0.2% for AGIs below $10k, 0.3% for AGIs $10k-25k, 0.3% for AGIs $25k-50k, 0.2% for AGIs $50k-75k, 0.1% for AGIs $75k-100k, 0.1% for AGIs over 100k)
Self-employed pension: $6,185 (reported on 0.2% of returns)
Here:
$6,185
Illinois:
$16,965
Total itemized deductions: $16,591 (28% of AGI, reported on 33.6% of returns)
Here:
$16,591
State:
$20,239
Here:
28.1% of AGI
State:
19.5% of AGI
(% of AGI for various income ranges: 12.7% for AGIs below $10k, 13.9% for AGIs $10k-25k, 16.1% for AGIs $25k-50k, 17.7% for AGIs $50k-75k, 16.5% for AGIs $75k-100k, 13.8% for AGIs over 100k)
Charity contributions deductions: $1,826 (3% of AGI, reported on 29.0% of returns)
Here:
$1,826
State:
$3,719
Here:
2.9% of AGI
State:
3.4% of AGI
(% of AGI for various income ranges: 0.5% for AGIs below $10k, 0.8% for AGIs $10k-25k, 1.3% for AGIs $25k-50k, 1.6% for AGIs $50k-75k, 1.8% for AGIs $75k-100k, 2.0% for AGIs over 100k)
Total tax: $4,143 (reported on 78.0% of returns)
60634:
$4,143
State:
$9,882
(% of AGI for various income ranges: 7.3% for AGIs below $10k, 5.4% for AGIs $10k-25k, 6.8% for AGIs $25k-50k, 8.7% for AGIs $50k-75k, 9.9% for AGIs $75k-100k, 15.1% for AGIs over 100k)
Earned income credit: $1,356 (reported on 16.7% of returns)
Here:
$1,356
State:
$1,788
Percentage of individuals using paid preparers for their 2004 taxes: 63.5%
Here:
63%
State:
61%
(% for various income ranges: 55.8% for AGIs below $10k, 65.9% for AGIs $10k-25k, 65.2% for AGIs $25k-50k, 66.3% for AGIs $50k-75k, 67.7% for AGIs $75k-100k, 65.4% for AGIs over 100k)
Likely homosexual households (counted as self-reported same-sex unmarried-partner households)
Lesbian couples: 0.2% of all households
Gay men: 0.2% of all households
Household received Food Stamps/SNAP in the past 12 months: 2,520 Household did not receive Food Stamps/SNAP in the past 12 months: 25,255
Women who had a birth in the past 12 months: 530 (438 now married, 91 unmarried) Women who did not have a birth in the past 12 months: 17,929 (7,370 now married, 10,547 unmarried)
Housing units in zip code 60634 with a mortgage: 12,965 (870 second mortgage, 758 both second mortgage and home equity loan) Houses without a mortgage: 199
Median monthly owner costs for units with a mortgage: $2,059 Median monthly owner costs for units without a mortgage: $804
Residents with income below the poverty level in 2022:
This zip code:
9.0%
Whole state:
11.9%
Residents with income below 50% of the poverty level in 2022:
This zip code:
4.8%
Whole state:
5.7%
Median number of rooms in houses and condos:
Here:
6.0
State:
6.4
Median number of rooms in apartments:
Here:
4.1
State:
4.1
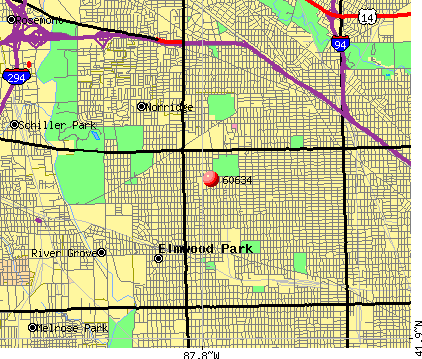
Notable locations in this zip code not listed on our city pages
Notable locations in zip code 60634: Indian Boundary Golf Course (A), Chicago Fire Department District 2 Station 86 (B), Chicago Fire Department District 2 Station 94 (C), Chicago Engine Company 94 (D), Chicago Engine Company 86 (E). Display/hide their locations on the map
Churches in zip code 60634 include: Belmont Evangelical Church (A), Chicago Latvian Evangelical Lutheran Zion Congregation (B), Christ Lutheran Church (C), Christadelphian Church (D), Forest Preserve Bible Church (E), Grace Evangelical Free Church (F), Irvingwood - Acacia Presbyterian Church (G), Marantha Baptist Church (H), Martin Luther Lutheran Church (I). Display/hide their locations on the map
Cemeteries: Acacia Park Cemetery (1), Westlawn Jewish Cemetery (2), Irving Park Cemetery (3), Mount Mayriv Cemetery (4), Mount Olive Cemetery (5), Mount Isaiah Israel Cemetery (6), B'Nai Abraham Cemetery (7). Display/hide their locations on the map
Parks in zip code 60634 include: Shabbona Park (1), Bell Park (2), Hiawatha Park (3), Seymour Simon Preserve (4), Merrimac Park (5). Display/hide their locations on the map
Tourist attractions (not listed on the city page) : Tony's Peking Gardens (Botanical Gardens; 5819 West Belmont Avenue), E & B Amusement (Amusement & Theme Parks; 5758 West Addison Street).
In group quarters: 350 (-1 institutionalized population)
Size of family households: 6,827 2-persons, 4,750 3-persons, 4,550 4-persons, 1,440 5-persons, 749 6-persons, 688 7-or-more-persons
Size of nonfamily households: 7,571 1-person, 1,175 2-persons, 137 3-persons
9,676 married couples with children.
3,035 single-parent households (794 men, 2,241 women).
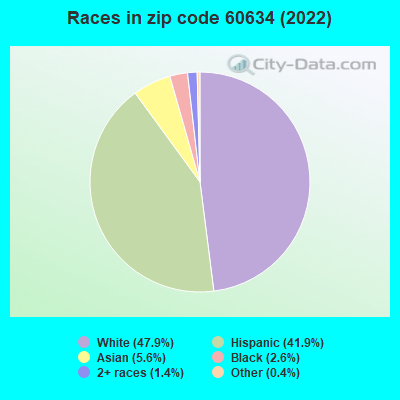
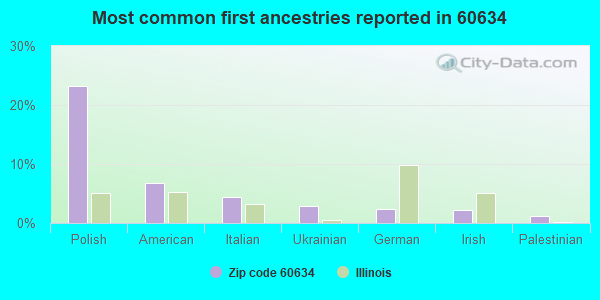
43.0% of residents of 60634 zip code speak English at home.
32.1% of residents speak Spanish at home (69% very well, 16% well, 11% not well, 4% not at all).
20.0% of residents speak other Indo-European language at home (44% very well, 27% well, 24% not well, 6% not at all).
3.9% of residents speak Asian or Pacific Island language at home (63% very well, 29% well, 6% not well, 1% not at all).
1.9% of residents speak other language at home (80% very well, 13% well, 7% not well).
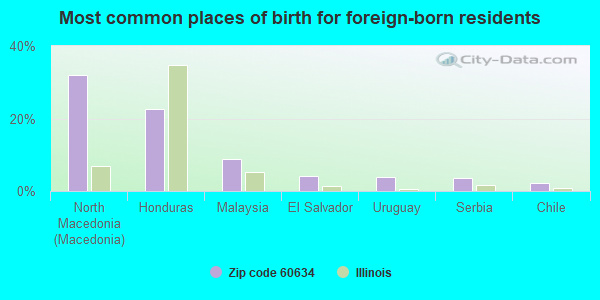
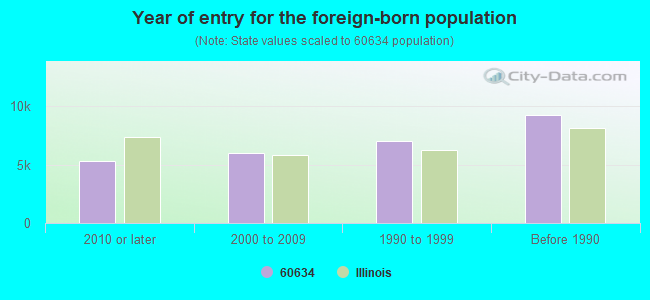
Foreign born population: 25,319 (33.8%) (56.8% of them are naturalized citizens)
Major facilities with environmental interests located in this zip code:
LYON ELEMENTARY SCHOOL (2941 N MCVICKER in CHICAGO, IL)
STATE MASTER (Illinois EPA Project) - AIR PROGRAM, HAZARDOUS WASTE PROGRAM AIR MINOR (AIRS/AFS) (National Center for Education Statistics) - STATE ID-1501629902323 CRITERIA AND HAZARDOUS AIR POLLUTANT INVENTORY (Inventory of air pollution sources) Conditionally Exempt Small Quantity Generators, less than 100 kg/month of hazardous waste (Resource Conservation and Recovery Act (tracking hazardous waste)) - notification TRANSPORTER (Resource Conservation and Recovery Act (tracking hazardous waste)) - notification Business SIC and NAICS classification: ELEMENTARY AND SECONDARY SCHOOLS Organizations: CHICAGO PUBLIC SCHOOLS 6WN (CONTACT/OWNER)
, CITY OF CHICAGO SCHOOL DIST 299 (SCHOOL DISTRICT)
Alternative names: CHICAGO BOARD OF EDUCATION, LYON ELEMENTARY SCHOOL-CHGO BD ED, LYON MARY SCHOOL
INDIAN BOUNDARY DIVISION HQTS (8800 W BELMONT AVE in CHICAGO, IL)
STATE MASTER (Illinois EPA Project) - SOLID WASTE PROGRAM ENFORCEMENT/COMPLIANCE ACTIVITY (Integrated Compliance Information System) - ICIS-05-2004-2010, FORMAL ENFORCEMENT ACTION (Integrated Compliance Information System) - ICIS-05-2004-2010, FORMAL ENFORCEMENT ACTION Conditionally Exempt Small Quantity Generators, less than 100 kg/month of hazardous waste (Resource Conservation and Recovery Act (tracking hazardous waste)) - notification Organizations: FOREST PRESERVE DIST COOK COUNTY (CONTACT/OWNER)
MYSER SCHOOL (4310 N MELVINA in CHICAGO, IL)
STATE MASTER (Illinois EPA Project) - AIR PROGRAM, HAZARDOUS WASTE PROGRAM AIR MINOR (AIRS/AFS) COMPLIANCE ACTIVITY (Tracking inspections of insecticide, fungicide, and rodenticide, and toxic substances) (National Center for Education Statistics) - STATE ID-1501629902459 CRITERIA AND HAZARDOUS AIR POLLUTANT INVENTORY (Inventory of air pollution sources) Small Quantity Generators, between 100 kg and 1000 kg of hazardous waste/month (Resource Conservation and Recovery Act (tracking hazardous waste)) - notification Business SIC and NAICS classification: ELEMENTARY AND SECONDARY SCHOOLS Organizations: CHICAGO PUBLIC SCHOOLS (CONTACT/OWNER)
, CITY OF CHICAGO SCHOOL DIST 299 (SCHOOL DISTRICT)
Alternative names: CHICAGO BOARD OF EDUCATION, MYSER SCHOOL CHGO BOARD ED, SMYSER ELEMENTARY SCHOOL, SMYSER SCHOOL
LACAPUCIANA COFFEE CO (7547 W ADDISON AVE in CHICAGO, IL)
STATE MASTER (Illinois EPA Project) - AIR PROGRAM AIR MINOR (AIRS/AFS) CRITERIA AND HAZARDOUS AIR POLLUTANT INVENTORY (Inventory of air pollution sources) Business SIC classification: ROASTED COFFEE; NONCLASSIFIABLE ESTABLISHMENTS Alternative names: LA-CAPANNINA -COFFEE/ALACAVANNIA COFFEE, LA-CAPANNINA -COFFEE/ALACAVANNIA COFFEE SHOP, LA CAPUCINA COFFEE COMPANY
KROWS CLEANERS (3332 N HARLEM in CHICAGO, IL)
STATE MASTER (Illinois EPA Project) - AIR PROGRAM STATE MASTER (Illinois EPA Project) - HAZARDOUS WASTE PROGRAM AIR MINOR (AIRS/AFS) Small Quantity Generators, between 100 kg and 1000 kg of hazardous waste/month (Resource Conservation and Recovery Act (tracking hazardous waste)) - notification Business SIC classification: DRYCLEANING PLANTS, EXCEPT RUG CLEANING Organizations: REVELIS KATHY (CONTACT/OWNER)
Alternative names: KRINOS CLEANERS
RAINBOW CLEANERS (7115 W ADDISON ST in CHICAGO, IL)
STATE MASTER (Illinois EPA Project) - AIR PROGRAM, HAZARDOUS WASTE PROGRAM AIR MINOR (AIRS/AFS) Small Quantity Generators, between 100 kg and 1000 kg of hazardous waste/month (Resource Conservation and Recovery Act (tracking hazardous waste)) - notification (Resource Conservation and Recovery Act (tracking hazardous waste)) Business SIC classification: DRYCLEANING PLANTS, EXCEPT RUG CLEANING Organizations: MARGARITAS HARRY (CONTACT/OWNER)
, MARGARITIS HARRY (CONTACT/OWNER)
ARTHUR E CANTY (3740 N PANAMA in CHICAGO, IL)
STATE MASTER (Illinois EPA Project) - HAZARDOUS WASTE PROGRAM (National Center for Education Statistics) - STATE ID-1501629902119 Small Quantity Generators, between 100 kg and 1000 kg of hazardous waste/month (Resource Conservation and Recovery Act (tracking hazardous waste)) - notification Organizations: CHICAGO PUBLIC SCHOOLS (CONTACT/OWNER)
, CITY OF CHICAGO SCHOOL DIST 299 (SCHOOL DISTRICT)
ILLINOIS TOOL WORKS CHRONOMATIC (4126 N NASHVILLE AVE. in CHICAGO, IL)
STATE MASTER (Illinois EPA Project) - SOLID WASTE PROGRAM, HAZARDOUS WASTE PROGRAM, AIR PROGRAM AIR MINOR (AIRS/AFS) CRITERIA AND HAZARDOUS AIR POLLUTANT INVENTORY (Inventory of air pollution sources) Small Quantity Generators, between 100 kg and 1000 kg of hazardous waste/month (Resource Conservation and Recovery Act (tracking hazardous waste)) Business SIC classification: MOTOR VEHICLE PARTS AND ACCESSORIES Organizations: ILLINOIS TOOL WORKS, INCORPORATED (CONTACT/OPERATOR)
Alternative names: ILLINOIS TOOL WORKS INC CHRONOMATIC DIV, ILLINOIS TOOL WORKS CHRONOMATIC OFFICE
ADVANCE DIAL CO (3439 N. HARLEM AVE. in CHICAGO, IL)
STATE MASTER (Illinois EPA Project) - AIR PROGRAM, HAZARDOUS WASTE PROGRAM AIR MINOR (AIRS/AFS) (Resource Conservation and Recovery Act (tracking hazardous waste)) Business SIC classification: SPECIAL DIES AND TOOLS, DIE SETS, JIGS AND FIXTURES, AND INDUSTRIAL MOLDS Alternative names: WILSON GLADYS R AND ASSOC
OUR LADY OF RESURRECTION MEDICAL CENTER (5645 W ADDISON ST in CHICAGO, IL)
STATE MASTER (Illinois EPA Project) - SOLID WASTE PROGRAM, AIR PROGRAM, HAZARDOUS WASTE PROGRAM AIR MINOR (AIRS/AFS) CRITERIA AND HAZARDOUS AIR POLLUTANT INVENTORY (Inventory of air pollution sources) Conditionally Exempt Small Quantity Generators, less than 100 kg/month of hazardous waste (Resource Conservation and Recovery Act (tracking hazardous waste)) - notification Business SIC and NAICS classification: GENERAL MEDICAL AND SURGICAL HOSPITALS Organizations: RESURRECTION HEALTHCARE CORP (CONTACT/OWNER)
Alternative names: OUR LADY OF THE RESURRECTION
MR BS DRY CLEANERS (3217 N HARLEM AVE in CHICAGO, IL)
STATE MASTER (Illinois EPA Project) - AIR PROGRAM, HAZARDOUS WASTE PROGRAM AIR MINOR (AIRS/AFS) CRITERIA AND HAZARDOUS AIR POLLUTANT INVENTORY (Inventory of air pollution sources) Small Quantity Generators, between 100 kg and 1000 kg of hazardous waste/month (Resource Conservation and Recovery Act (tracking hazardous waste)) - notification Business SIC classification: DRYCLEANING PLANTS, EXCEPT RUG CLEANING Organizations: CHOI SANG C (CONTACT/OWNER)
Alternative names: MR BS CLEANERS
REINBURG SCHOOL (3425 MAJOR AVENUE in CHICAGO, IL)
STATE MASTER (Illinois EPA Project) - AIR PROGRAM, HAZARDOUS WASTE PROGRAM, SOLID WASTE PROGRAM AIR MINOR (AIRS/AFS) CRITERIA AND HAZARDOUS AIR POLLUTANT INVENTORY (Inventory of air pollution sources) Conditionally Exempt Small Quantity Generators, less than 100 kg/month of hazardous waste (Resource Conservation and Recovery Act (tracking hazardous waste)) - notification Business SIC and NAICS classification: ELEMENTARY AND SECONDARY SCHOOLS Organizations: CHICAGO PUBLIC SCHOOLS (CONTACT/OWNER)
Alternative names: CHICAGO BOARD OF EDUCATION, REINBERG PETER SCHOOL, REINBURG SCHOOL CHGO BOARD ED
ACACIA PARK CEMETERY & MAUSOLEUM (7800 W. IRVING PARK ROAD in CHICAGO, IL)
STATE MASTER (Illinois EPA Project) - SOLID WASTE PROGRAM, AIR PROGRAM AIR MINOR (AIRS/AFS) CRITERIA AND HAZARDOUS AIR POLLUTANT INVENTORY (Inventory of air pollution sources) Business SIC classification: CEMETERY SUBDIVIDERS AND DEVELOPERS Business NAICS classification: CEMETERIES AND CREMATORIES.
Housing units lacking complete plumbing facilities: 0.3% Housing units lacking complete kitchen facilities: 0.8%
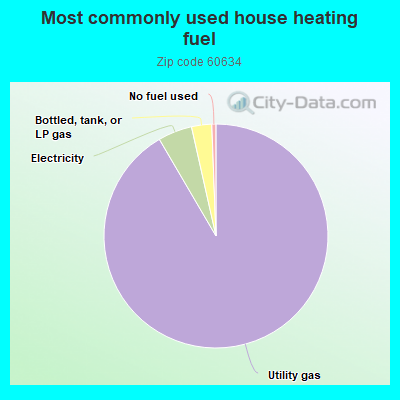
91.3%Utility gas
4.9%Electricity
2.9%Bottled, tank, or LP gas
0.6%No fuel used
Population in 1990: 69,160. Population change in the 1990s: +5,004 (+7.2%).
Place of birth for U.S.-born residents:
This state: 43,159
Northeast: 862
Midwest: 1,661
South: 992
West: 537
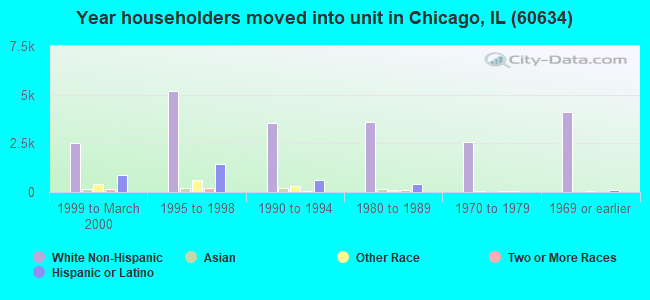
64% of the 60634 zip code residents lived in the same house 5 years ago. Out of people who lived in different houses, 93% lived in this county. Out of people who lived in different counties, 50% lived in Illinois.
93% of the 60634 zip code residents lived in the same house 1 year ago. Out of people who lived in different houses, 83% moved from this county. Out of people who lived in different houses, 2% moved from different county within same state. Out of people who lived in different houses, 6% moved from different state. Out of people who lived in different houses, 6% moved from abroad.
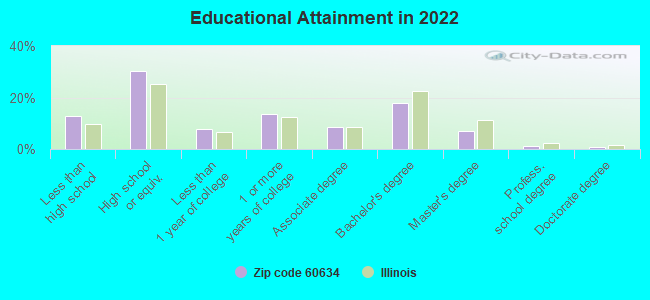
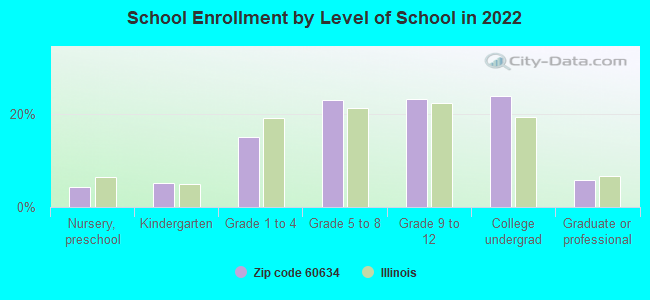
Private vs. public school enrollment:
Students in private schools in grades 1 to 8 (elementary and middle school): 950
Here:
14.1%
Illinois:
13.3%
Students in private schools in grades 9 to 12 (high school): 506
Here:
12.3%
Illinois:
9.9%
Students in private undergraduate colleges: 1,075
Here:
25.4%
Illinois:
27.4%
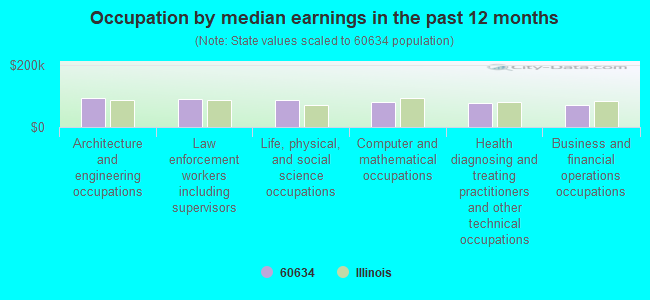
Occupation by median earnings in the past 12 months ($)
94,977Architecture and engineering occupations
92,064Law enforcement workers including supervisors
88,075Life, physical, and social science occupations
81,215Computer and mathematical occupations
76,727Health diagnosing and treating practitioners and other technical occupations
70,604Business and financial operations occupations
Companies with federal contracts located in this zip code (CHICAGO, IL):
CAPITAL SERVICES INC (4104 N NASHVILLE AVE; small business) : $3,408,986 in 87 contractsfrom 1999 to 2002
Contracts for Custodial Janitorial Services by Bureau of the Census, Navy Signed by year:2000: $1,065,489; 2001: $841,983; 2002: $526,514; 2003: $0; 2004: $0; 2005: $0; 2006: $0.
Biggest contracts:
$946,000 with Bureau of the Census for Custodial Janitorial Services. Taking place in IN. Signed on 1999-10-15. Completion date: 2000-09-15.
$419,478 with Navy for Custodial Janitorial Services. Taking place in NH. Signed on 2001-09-28. Completion date: 2002-03-31.
$289,000 with Bureau of the Census for Custodial Janitorial Services. Taking place in IN. Signed on 2000-09-15. Completion date: 2000-09-15.
$245,425 with Navy for Custodial Janitorial Services. Taking place in NH. Signed on 2000-06-09. Completion date: 2000-11-01.
MILEX PRODUCTS INC (4311 N NORMANDY; small business) : $16,283 in 3 contractsfrom 2003 to 2006
$11,550 with Navy for Books and Pamphlets. Taking place in CA. Signed on 2003-04-04. Completion date: 2003-04-21.
$4,662 with Army for Books and Pamphlets. Signed on 2004-02-05. Completion date: 2004-02-13.
$71 with Department of Veterans Affairs for Medical and Surgical Instruments, Equipment, and Supplies. Signed on 2006-04-06. Completion date: 2006-04-14.
DELUXE STITCHER COMPANY INC (6635 W IRVING PARK ROAD; small business)
$6,100 with Navy for Printing, Duplicating, and Bookbinding Equipment. Signed on 2004-09-03. Completion date: 2004-09-10.
K & S CLEANING SERVICE INC (7610 W BELMONT; small business) : -$2,000 in 2 contractsin 2004
$0 with Army for Custodial Janitorial Services. Signed on 2004-03-16. Completion date: 1999-09-15.
-$2,000, same as above.Signed on 2004-03-16. Completion date: 1999-09-15.
Top industries in this zip code by the number of employees in 2005:
Construction: All Other Specialty Trade Contractors (500-999 employees: 1 establishment, 1-4 employees: 8 establishments)
2002 - 2018 National Fire Incident Reporting System (NFIRS) incidents
Based on the data from the years 2002 - 2018 the average number of fires per year is 126. The highest number of fire incidents - 214 took place in 2012, and the least - 0 in 2005. The data has a decreasing trend.
When looking into fire subcategories, the most reports belonged to: Structure Fires (35.2%), and Other (24.9%).
Fire incident types reported to NFIRS in Zip Code 60634


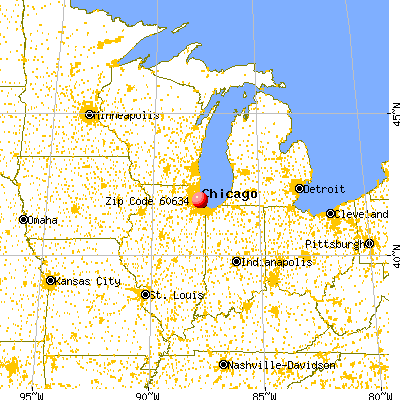


 Nearest zip codes: 60706, 60707, 60656, 60171, 60631, 60305.


 Based on the data from the years 2002 - 2018 the average number of fires per year is 126. The highest number of fire incidents - 214 took place in 2012, and the least - 0 in 2005. The data has a decreasing trend.
 When looking into fire subcategories, the most reports belonged to: Structure Fires (35.2%), and Other (24.9%).