Estimated zip code population in 2022: 29,999 Zip code population in 2010: 28,641 Zip code population in 2000: 28,832
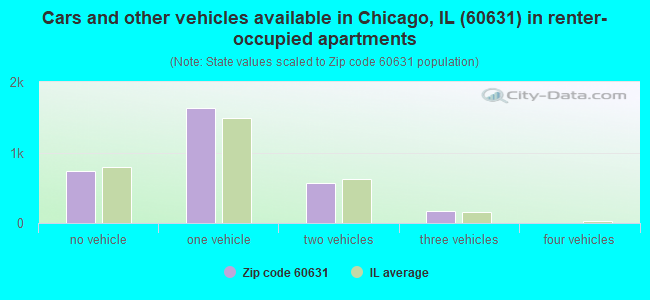
Houses and condos: 12,743 Renter-occupied apartments: 3,090
% of renters here:
25%
State:
33%
March 2022 cost of living index in zip code 60631: 102.0 (near average, U.S. average is 100)
Land area: 3.7 sq. mi. Water area: 0.0 sq. mi.
Population density: 8,063 people per square mile
(high).
OSM Map
General Map
Google Map
MSN Map
OSM Map
General Map
Google Map
MSN Map
OSM Map
General Map
Google Map
MSN Map
OSM Map
General Map
Google Map
MSN Map
Please wait while loading the map...
Real estate property taxes paid for housing units in 2022:
This zip code:
1.5% ($6,390)
Illinois:
2.0% ($4,912)
Median real estate property taxes paid for housing units with mortgages in 2022: $6,628 (1.5%) Median real estate property taxes paid for housing units with no mortgage in 2022: $5,922 (1.5%)
Estimated median house/condo value in 2022: $428,699
60631:
$428,699
Illinois:
$251,600
According to our research of Illinois and other state lists, there were 8 registered sex offenders living in 60631 zip code as of April 27, 2024. The ratio of all residents to sex offenders in zip code 60631 is 3,580 to 1. The ratio of registered sex offenders to all residents in this zip code is much lower than the state average.
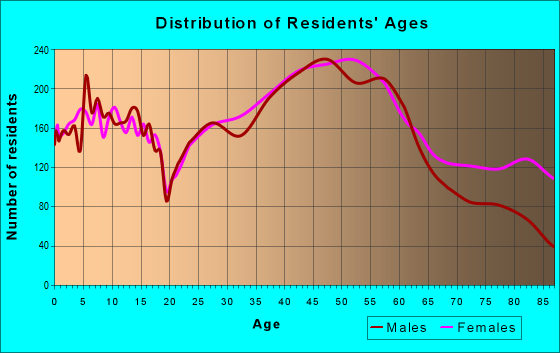
Median resident age:
This zip code:
41.3 years
Illinois median age:
39.1 years
Average household size:
This zip code:
2.4 people
Illinois:
2.4 people
Averages for the 2020 tax year for zip code 60631, filed in 2021:
Average Adjusted Gross Income (AGI) in 2020: $96,138 (Individual Income Tax Returns)
Here:
$96,138
State:
$82,626
Salary/wage: $89,456 (reported on 77.3% of returns)
Here:
$89,456
State:
$66,640
(% of AGI for various income ranges: 1007.3% for AGIs below $25k, 3411.4% for AGIs $25k-50k, 6161.7% for AGIs $50k-75k, 8979.2% for AGIs $75k-100k, 17306.4% for AGIs $100k-200k, 55873.0% for AGIs over 200k)
Taxable interest for individuals: $1,677 (reported on 41.7% of returns)
This zip code:
$1,677
Illinois:
$2,376
(% of AGI for various income ranges: 45.4% for AGIs below $25k, 56.4% for AGIs $25k-50k, 93.0% for AGIs $50k-75k, 99.8% for AGIs $75k-100k, 132.1% for AGIs $100k-200k, 464.4% for AGIs over 200k)
Ordinary dividends: $4,689 (reported on 32.2% of returns)
Here:
$4,689
State:
$9,061
(% of AGI for various income ranges: 68.6% for AGIs below $25k, 93.5% for AGIs $25k-50k, 158.7% for AGIs $50k-75k, 219.3% for AGIs $75k-100k, 299.7% for AGIs $100k-200k, 1210.2% for AGIs over 200k)
Net capital gain/loss in AGI: +$10,220 (reported on 27.7% of returns)
Here:
+$10,220
State:
+$31,684
(% of AGI for various income ranges: 22.6% for AGIs below $25k, 42.0% for AGIs $25k-50k, 100.0% for AGIs $50k-75k, 174.7% for AGIs $75k-100k, 477.9% for AGIs $100k-200k, 4108.5% for AGIs over 200k)
Profit/loss from business: +$13,444 (reported on 14.9% of returns)
Here:
+$13,444
State:
+$12,175
(% of AGI for various income ranges: 197.5% for AGIs below $25k, 196.2% for AGIs $25k-50k, 152.4% for AGIs $50k-75k, 148.6% for AGIs $75k-100k, 396.9% for AGIs $100k-200k, 1482.0% for AGIs over 200k)
Taxable individual retirement arrangement distribution: $19,573 (reported on 11.9% of returns)
60631:
$19,573
Illinois:
$21,613
(% of AGI for various income ranges: 117.8% for AGIs below $25k, 174.6% for AGIs $25k-50k, 263.4% for AGIs $50k-75k, 352.4% for AGIs $75k-100k, 513.7% for AGIs $100k-200k, 1473.8% for AGIs over 200k)
Self-employed (Keogh) retirement plans: $25,822 (reported on 0.6% of returns)
60631:
$25,822
Illinois:
$30,962
(% of AGI for various income ranges: 22.2% for AGIs $100k-200k, 273.2% for AGIs over 200k)
Total itemized deductions: $28,914 (reported on 16.4% of returns)
Here:
$28,914
State:
$34,948
(% of AGI for various income ranges: 134.8% for AGIs below $25k, 260.3% for AGIs $25k-50k, 419.5% for AGIs $50k-75k, 833.2% for AGIs $75k-100k, 1150.9% for AGIs $100k-200k, 3277.9% for AGIs over 200k)
Charity contributions: $4,723 (reported on 13.6% of returns)
Here:
$4,723
State:
$13,122
(% of AGI for various income ranges: 6.8% for AGIs below $25k, 15.2% for AGIs $25k-50k, 41.1% for AGIs $50k-75k, 81.5% for AGIs $75k-100k, 141.1% for AGIs $100k-200k, 683.6% for AGIs over 200k)
Taxes paid: $8,751 (reported on 16.3% of returns)
60631:
$8,751
State:
$8,563
(% of AGI for various income ranges: 27.5% for AGIs below $25k, 53.4% for AGIs $25k-50k, 129.4% for AGIs $50k-75k, 279.7% for AGIs $75k-100k, 384.3% for AGIs $100k-200k, 891.5% for AGIs over 200k)
Earned income credit: $1,591 (reported on 5.2% of returns)
Here:
$1,591
State:
$2,311
(% of AGI for various income ranges: 39.8% for AGIs below $25k, 26.0% for AGIs $25k-50k)
Percentage of individuals using paid preparers for their 2020 taxes: 90.2%
Here:
90%
State:
93%
(% for various income ranges: 86.3% for AGIs below $25k, 91.1% for AGIs $25k-50k, 89.9% for AGIs $50k-75k, 91.0% for AGIs $75k-100k, 91.7% for AGIs $100k-200k, 92.6% for AGIs over 200k)
Averages for the 2012 tax year for zip code 60631, filed in 2013:
Average Adjusted Gross Income (AGI) in 2012: $72,560 (Individual Income Tax Returns)
Here:
$72,560
State:
$68,058
Salary/wage: $68,044 (reported on 76.9% of returns)
Here:
$68,044
State:
$55,396
(% of AGI for various income ranges: 58.1% for AGIs below $25k, 70.9% for AGIs $25k-50k, 70.5% for AGIs $50k-75k, 73.7% for AGIs $75k-100k, 80.6% for AGIs $100k-200k, 58.9% for AGIs over 200k)
Taxable interest for individuals: $1,447 (reported on 48.6% of returns)
This zip code:
$1,447
Illinois:
$1,969
(% of AGI for various income ranges: 3.1% for AGIs below $25k, 1.2% for AGIs $25k-50k, 1.1% for AGIs $50k-75k, 0.9% for AGIs $75k-100k, 0.7% for AGIs $100k-200k, 0.9% for AGIs over 200k)
Ordinary dividends: $3,944 (reported on 32.6% of returns)
Here:
$3,944
State:
$7,786
(% of AGI for various income ranges: 4.1% for AGIs below $25k, 2.1% for AGIs $25k-50k, 1.9% for AGIs $50k-75k, 1.8% for AGIs $75k-100k, 1.2% for AGIs $100k-200k, 2.1% for AGIs over 200k)
Net capital gain/loss in AGI: +$7,931 (reported on 23.3% of returns)
Here:
+$7,931
State:
+$22,183
(% of AGI for various income ranges: 0.4% for AGIs $25k-50k, 0.3% for AGIs $50k-75k, 0.6% for AGIs $75k-100k, 0.7% for AGIs $100k-200k, 10.9% for AGIs over 200k)
Profit/loss from business: +$13,275 (reported on 14.1% of returns)
Here:
+$13,275
State:
+$12,903
(% of AGI for various income ranges: 11.1% for AGIs below $25k, 4.1% for AGIs $25k-50k, 2.2% for AGIs $50k-75k, 1.4% for AGIs $75k-100k, 1.7% for AGIs $100k-200k, 2.7% for AGIs over 200k)
Taxable individual retirement arrangement distribution: $12,429 (reported on 14.5% of returns)
60631:
$12,429
Illinois:
$17,929
(% of AGI for various income ranges: 6.9% for AGIs below $25k, 4.1% for AGIs $25k-50k, 3.3% for AGIs $50k-75k, 2.7% for AGIs $75k-100k, 2.0% for AGIs $100k-200k, 1.1% for AGIs over 200k)
Self-employment retirement plans: $21,225 (reported on 0.5% of returns)
60631:
$21,225
Illinois:
$24,666
(% of AGI for various income ranges: 0.4% for AGIs below $25k, 0.1% for AGIs $100k-200k, 0.5% for AGIs over 200k)
Total itemized deductions: $23,775 (21% of AGI, reported on 47.3% of returns)
Here:
$23,775
State:
$26,433
Here:
21.0% of AGI
State:
19.2% of AGI
(% of AGI for various income ranges: 17.1% for AGIs below $25k, 13.0% for AGIs $25k-50k, 15.4% for AGIs $50k-75k, 17.8% for AGIs $75k-100k, 16.7% for AGIs $100k-200k, 12.3% for AGIs over 200k)
Charity contributions: $2,344 (reported on 41.5% of returns)
Here:
$2,344
State:
$4,525
(% of AGI for various income ranges: 0.9% for AGIs below $25k, 1.1% for AGIs $25k-50k, 1.3% for AGIs $50k-75k, 1.5% for AGIs $75k-100k, 1.5% for AGIs $100k-200k, 1.3% for AGIs over 200k)
Taxes paid: $9,909 (reported on 47.3% of returns)
60631:
$9,909
State:
$11,968
(% of AGI for various income ranges: 4.4% for AGIs below $25k, 4.2% for AGIs $25k-50k, 5.9% for AGIs $50k-75k, 6.9% for AGIs $75k-100k, 7.5% for AGIs $100k-200k, 5.9% for AGIs over 200k)
Earned income credit: $1,787 (reported on 6.8% of returns)
Here:
$1,787
State:
$2,349
(% of AGI for various income ranges: 2.8% for AGIs below $25k, 0.4% for AGIs $25k-50k)
Percentage of individuals using paid preparers for their 2012 taxes: 61.3%
Here:
61%
State:
57%
(% for various income ranges: 55.0% for AGIs below $25k, 56.2% for AGIs $25k-50k, 63.6% for AGIs $50k-75k, 67.9% for AGIs $75k-100k, 67.7% for AGIs $100k-200k, 71.7% for AGIs over 200k)
Averages for the 2004 tax year for zip code 60631, filed in 2005:
Average Adjusted Gross Income (AGI) in 2004: $56,145 (Individual Income Tax Returns)
Here:
$56,145
State:
$54,625
Salary/wage: $54,619 (reported on 76.3% of returns)
Here:
$54,619
State:
$46,811
(% of AGI for various income ranges: 105.6% for AGIs below $10k, 53.0% for AGIs $10k-25k, 74.5% for AGIs $25k-50k, 75.6% for AGIs $50k-75k, 78.2% for AGIs $75k-100k, 73.6% for AGIs over 100k)
Taxable interest for individuals: $1,970 (reported on 67.0% of returns)
This zip code:
$1,970
Illinois:
$2,101
(% of AGI for various income ranges: 17.8% for AGIs below $10k, 7.7% for AGIs $10k-25k, 3.0% for AGIs $25k-50k, 2.1% for AGIs $50k-75k, 1.7% for AGIs $75k-100k, 1.5% for AGIs over 100k)
Taxable dividends: $2,599 (reported on 38.0% of returns)
Here:
$2,599
State:
$4,306
(% of AGI for various income ranges: 10.6% for AGIs below $10k, 4.7% for AGIs $10k-25k, 2.1% for AGIs $25k-50k, 1.6% for AGIs $50k-75k, 1.5% for AGIs $75k-100k, 1.3% for AGIs over 100k)
Net capital gain/loss: +$8,365 (reported on 26.8% of returns)
Here:
+$8,365
State:
+$17,321
(% of AGI for various income ranges: -0.9% for AGIs below $10k, 0.5% for AGIs $10k-25k, 0.4% for AGIs $25k-50k, 0.6% for AGIs $50k-75k, 1.3% for AGIs $75k-100k, 8.5% for AGIs over 100k)
Profit/loss from business: +$12,324 (reported on 13.1% of returns)
Here:
+$12,324
State:
+$11,771
(% of AGI for various income ranges: 15.0% for AGIs below $10k, 6.6% for AGIs $10k-25k, 2.6% for AGIs $25k-50k, 2.3% for AGIs $50k-75k, 2.7% for AGIs $75k-100k, 2.6% for AGIs over 100k)
IRA payment deduction: $3,211 (reported on 2.8% of returns)
60631:
$3,211
Illinois:
$3,087
(% of AGI for various income ranges: 0.6% for AGIs below $10k, 0.2% for AGIs $10k-25k, 0.3% for AGIs $25k-50k, 0.1% for AGIs $50k-75k, 0.2% for AGIs $75k-100k, 0.1% for AGIs over 100k)
Self-employed pension: $13,811 (reported on 0.7% of returns)
Here:
$13,811
Illinois:
$16,965
(% of AGI for various income ranges: 0.1% for AGIs $50k-75k, 0.2% for AGIs $75k-100k, 0.3% for AGIs over 100k)
Total itemized deductions: $18,957 (22% of AGI, reported on 46.6% of returns)
Here:
$18,957
State:
$20,239
Here:
22.2% of AGI
State:
19.5% of AGI
(% of AGI for various income ranges: 26.5% for AGIs below $10k, 17.6% for AGIs $10k-25k, 14.6% for AGIs $25k-50k, 17.6% for AGIs $50k-75k, 16.7% for AGIs $75k-100k, 14.4% for AGIs over 100k)
Charity contributions deductions: $2,417 (3% of AGI, reported on 43.2% of returns)
Here:
$2,417
State:
$3,719
Here:
2.8% of AGI
State:
3.4% of AGI
(% of AGI for various income ranges: 1.3% for AGIs below $10k, 1.5% for AGIs $10k-25k, 1.4% for AGIs $25k-50k, 1.8% for AGIs $50k-75k, 1.9% for AGIs $75k-100k, 2.1% for AGIs over 100k)
Total tax: $8,083 (reported on 84.0% of returns)
60631:
$8,083
State:
$9,882
(% of AGI for various income ranges: 4.7% for AGIs below $10k, 4.7% for AGIs $10k-25k, 8.4% for AGIs $25k-50k, 10.0% for AGIs $50k-75k, 10.6% for AGIs $75k-100k, 16.1% for AGIs over 100k)
Earned income credit: $1,105 (reported on 4.7% of returns)
Here:
$1,105
State:
$1,788
Percentage of individuals using paid preparers for their 2004 taxes: 60.9%
Here:
61%
State:
61%
(% for various income ranges: 51.8% for AGIs below $10k, 61.2% for AGIs $10k-25k, 58.0% for AGIs $25k-50k, 64.7% for AGIs $50k-75k, 64.4% for AGIs $75k-100k, 67.8% for AGIs over 100k)
Likely homosexual households (counted as self-reported same-sex unmarried-partner households)
Lesbian couples: 0.0% of all households
Gay men: 0.1% of all households
Household received Food Stamps/SNAP in the past 12 months: 538 Household did not receive Food Stamps/SNAP in the past 12 months: 11,492
Women who had a birth in the past 12 months: 270 (256 now married, 13 unmarried) Women who did not have a birth in the past 12 months: 6,156 (2,975 now married, 3,161 unmarried)
Housing units in zip code 60631 with a mortgage: 5,629 (588 second mortgage, 498 both second mortgage and home equity loan) Houses without a mortgage: 165
Median monthly owner costs for units with a mortgage: $2,553 Median monthly owner costs for units without a mortgage: $902
Residents with income below the poverty level in 2022:
This zip code:
7.0%
Whole state:
11.9%
Residents with income below 50% of the poverty level in 2022:
This zip code:
3.6%
Whole state:
5.7%
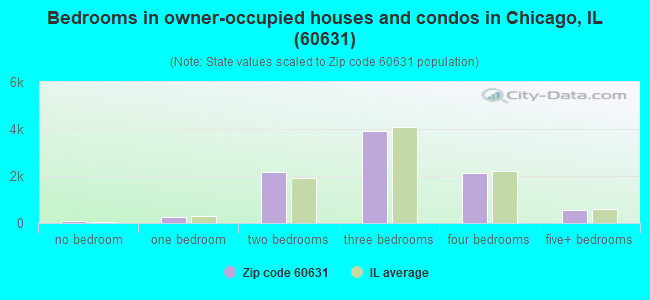
Median number of rooms in houses and condos:
Here:
6.3
State:
6.4
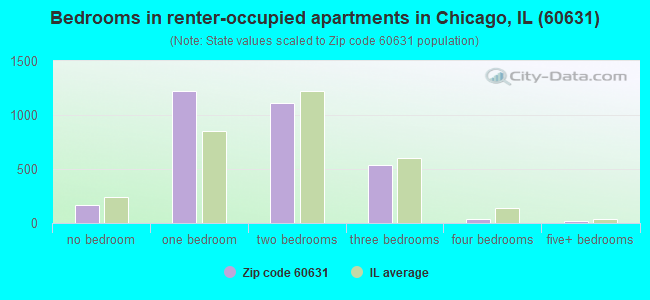
Median number of rooms in apartments:
Here:
3.9
State:
4.1
Notable locations in this zip code not listed on our city pages
Notable locations in zip code 60631: Chicago Fire Department District 2 Station 119 (A), Chicago Engine Company 119 (B), Saint Juliana Rectory (C). Display/hide their locations on the map
Churches in zip code 60631 include: Edison Park Lutheran Church (A), Edison Park United Methodist Church (B), Church of the Full Gospel (C), First Edison Park United Church of Christ (D), Immaculate Conception Roman Catholic Church (E), Jehovahs Witnesses Norwood Park Unit (F), Northwest United Presbyterian Church of Chicago (G), Norwood Park Evangelical Lutheran Church (H), Norwood Park Presbyterian Church (I). Display/hide their locations on the map
Cemeteries: All Saints Polish National Catholic Cemetery (1), Immaculate Conception Monastery (2), Norwood Park Cemetery (3), Saint Nicholas Ukrainian Catholic Cemetery (4). Display/hide their locations on the map
Parks in zip code 60631 include: Brooks Park (1), Edison Park (2), Monument Park (3), Norwood Circle Park (4), Norwood Park (5), Norwood Playground (6), Olympia Park (7). Display/hide their locations on the map
Tourist attraction (not listed on the city page) : AmeriTours (Tours & Charters; 6839 W. Thorndale Avenue).
In group quarters: 473 (-1 institutionalized population)
Size of family households: 3,324 2-persons, 1,804 3-persons, 1,908 4-persons, 649 5-persons, 231 6-persons, 44 7-or-more-persons
Size of nonfamily households: 3,656 1-person, 488 2-persons, 53 3-persons
5,591 married couples with children.
813 single-parent households (211 men, 602 women).
74.9% of residents of 60631 zip code speak English at home.
9.3% of residents speak Spanish at home (85% very well, 12% well, 3% not well, 1% not at all).
12.5% of residents speak other Indo-European language at home (57% very well, 29% well, 10% not well, 4% not at all).
2.8% of residents speak Asian or Pacific Island language at home (81% very well, 12% well, 3% not well, 4% not at all).
0.8% of residents speak other language at home (100% very well).
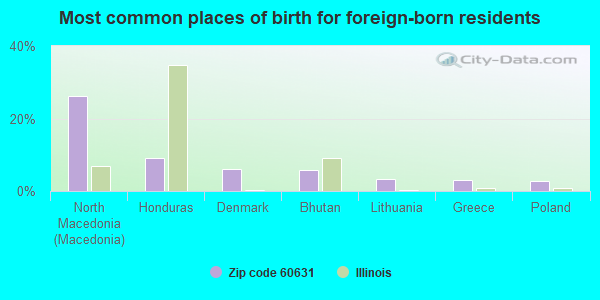
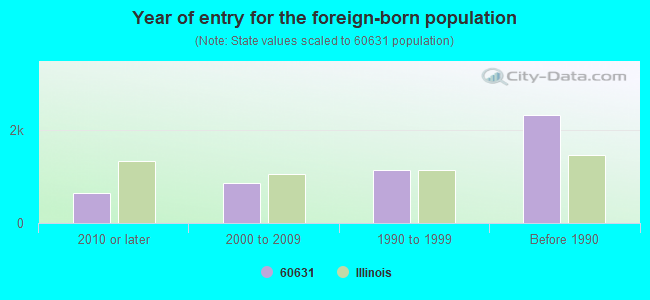
Foreign born population: 4,822 (16.1%) (73.0% of them are naturalized citizens)
Major facilities with environmental interests located in this zip code:
AMERICAN RACK CO (5810 NORTHWEST HIGHWAY in CHICAGO, IL)
STATE MASTER (Illinois EPA Project) - AIR PROGRAM AIR MINOR (AIRS/AFS) - ICIS-, ENFORCEMENT/COMPLIANCE ACTIVITY AIR MINOR (AIRS/AFS) CRITERIA AND HAZARDOUS AIR POLLUTANT INVENTORY (Inventory of air pollution sources) TRI REPORTER (Tracking of toxic chemicals releasing facilities) Business SIC classification: FABRICATED METAL PRODUCTS; NONCLASSIFIABLE ESTABLISHMENTS
ILLINOIS BELL TELEPHONE CO (6001 N NORTHWEST HWY in CHICAGO, IL)
STATE MASTER (Illinois EPA Project) - SOLID WASTE PROGRAM, AIR PROGRAM AIR MINOR (AIRS/AFS) CRITERIA AND HAZARDOUS AIR POLLUTANT INVENTORY (Inventory of air pollution sources) (Resource Conservation and Recovery Act (tracking hazardous waste)) Business SIC classification: TELEPHONE COMMUNICATIONS, EXCEPT RADIOTELEPHONE Alternative names: ILL BELL TEL CO NEWCASTLE C O
NORWOOD PARK ELEMENTARY SCHOOL (5900 N NINA in CHICAGO, IL)
STATE MASTER (Illinois EPA Project) - HAZARDOUS WASTE PROGRAM (National Center for Education Statistics) - STATE ID-1501629902376 Organizations: CITY OF CHICAGO SCHOOL DIST 299 (SCHOOL DISTRICT)
RESURRECTION HOSPITAL (7435 W TALCOTT AVE in CHICAGO, IL)
STATE MASTER (Illinois EPA Project) - HAZARDOUS WASTE PROGRAM, AIR PROGRAM, SOLID WASTE PROGRAM AIR MINOR (AIRS/AFS) CRITERIA AND HAZARDOUS AIR POLLUTANT INVENTORY (Inventory of air pollution sources) Small Quantity Generators, between 100 kg and 1000 kg of hazardous waste/month (Resource Conservation and Recovery Act (tracking hazardous waste)) - notification Business SIC and NAICS classification: GENERAL MEDICAL AND SURGICAL HOSPITALS Organizations: RESURRECTION HEALTH CARE (CONTACT/OWNER)
Alternative names: RESURRECTION MEDICAL CENTER
MOBIL OIL CORP (7757 W DEVON & CANFIELD in CHICAGO, IL)
STATE MASTER (Illinois EPA Project) - SOLID WASTE PROGRAM, AIR PROGRAM, HAZARDOUS WASTE PROGRAM AIR MINOR (AIRS/AFS) (Resource Conservation and Recovery Act (tracking hazardous waste)) Business SIC classification: PETROLEUM BULK STATIONS AND TERMINALS Organizations: MOBIL OIL CORP MKTG ENVIRON (CONTACT/OWNER)
Alternative names: MOBIL OIL CORP SS AIH
PRECISION FINISHING (6678 NORTHWEST HIGHWAY in CHICAGO, IL)
STATE MASTER (Illinois EPA Project) - AIR PROGRAM, HAZARDOUS WASTE PROGRAM AIR MINOR (AIRS/AFS) CRITERIA AND HAZARDOUS AIR POLLUTANT INVENTORY (Inventory of air pollution sources) Conditionally Exempt Small Quantity Generators, less than 100 kg/month of hazardous waste (Resource Conservation and Recovery Act (tracking hazardous waste)) - notification Business SIC classification: ELECTROPLATING, PLATING, POLISHING, ANODIZING, AND COLORING Organizations: MROCZEK JOE AND BAVARO VIC (CONTACT/OWNER)
Alternative names: PRECISION FINSIHING
SAFETY SOCKET SCREW CORP (6501 N AVONDALE AVE in CHICAGO, IL)
STATE MASTER (Illinois EPA Project) - HAZARDOUS WASTE PROGRAM, AIR PROGRAM, SOLID WASTE PROGRAM AIR MINOR (AIRS/AFS) CRITERIA AND HAZARDOUS AIR POLLUTANT INVENTORY (Inventory of air pollution sources) Conditionally Exempt Small Quantity Generators, less than 100 kg/month of hazardous waste (Resource Conservation and Recovery Act (tracking hazardous waste)) - notification Business SIC classification: BOLTS, NUTS, SCREWS, RIVETS, AND WASHERS
NORWOOD PARK DODGE (6333 NORTHWEST HWY in CHICAGO, IL)
STATE MASTER (Illinois EPA Project) - SOLID WASTE PROGRAM, HAZARDOUS WASTE PROGRAM Large Quantity Generators, more that 1000 kg of hazardous waste/month (Resource Conservation and Recovery Act (tracking hazardous waste)) - notification Organizations: RUDAS THOMAS (CONTACT/OWNER)
RESURRECTION HIGH SCHOOL (7500 W. TALCOTT AVENUE in CHICAGO, IL)
STATE MASTER (Illinois EPA Project) - AIR PROGRAM AIR MINOR (AIRS/AFS) CRITERIA AND HAZARDOUS AIR POLLUTANT INVENTORY (Inventory of air pollution sources) Business SIC and NAICS classification: ELEMENTARY AND SECONDARY SCHOOLS
ORGANON TEKNIKA (115 S SANGAMON ST in CHICAGO, IL)
STATE MASTER (Illinois EPA Project) - HAZARDOUS WASTE PROGRAM Large Quantity Generators, more that 1000 kg of hazardous waste/month (Resource Conservation and Recovery Act (tracking hazardous waste)) - notification Organizations: AKZO AMERICA (CONTACT/OWNER)
PONTARELLI BUILDERS INC (6800 N HARLEM in CHICAGO, IL)
STATE MASTER (Illinois EPA Project) - HAZARDOUS WASTE PROGRAM Large Quantity Generators, more that 1000 kg of hazardous waste/month (Resource Conservation and Recovery Act (tracking hazardous waste)) - notification
ARTISTRY ENGRAVING & EMBOSSING (6000 N NORTHWEST HWY in CHICAGO, IL)
STATE MASTER (Illinois EPA Project) - HAZARDOUS WASTE PROGRAM Conditionally Exempt Small Quantity Generators, less than 100 kg/month of hazardous waste (Resource Conservation and Recovery Act (tracking hazardous waste)) Organizations: JOHNSEN DOROTHY K (CONTACT/OWNER)
JANLER CORP (6545 N AVONDALE AVE in CHICAGO, IL)
STATE MASTER (Illinois EPA Project) - AIR PROGRAM AIR MINOR (AIRS/AFS) Business SIC classification: NONCLASSIFIABLE ESTABLISHMENTS
Housing units lacking complete plumbing facilities: 0.5% Housing units lacking complete kitchen facilities: 2.3%
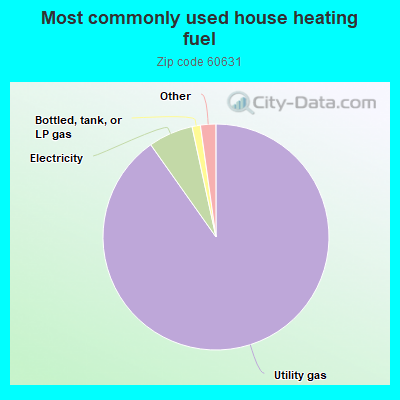
90.2%Utility gas
6.4%Electricity
1.2%Bottled, tank, or LP gas
0.7%Fuel oil, kerosene, etc.
0.7%Other fuel
0.6%No fuel used
Population in 1990: 25,175. Population change in the 1990s: +3,657 (+14.5%).
Place of birth for U.S.-born residents:
This state: 22,586
Northeast: 317
Midwest: 957
South: 493
West: 519
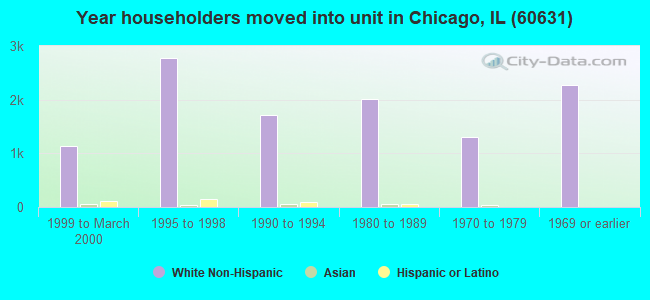
68% of the 60631 zip code residents lived in the same house 5 years ago. Out of people who lived in different houses, 90% lived in this county. Out of people who lived in different counties, 50% lived in Illinois.
91% of the 60631 zip code residents lived in the same house 1 year ago. Out of people who lived in different houses, 83% moved from this county. Out of people who lived in different houses, 1% moved from different county within same state. Out of people who lived in different houses, 9% moved from different state. Out of people who lived in different houses, 2% moved from abroad.
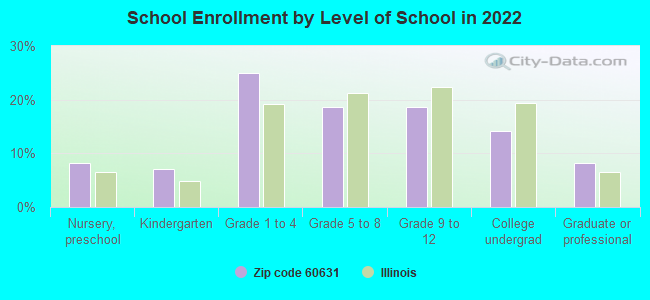
Private vs. public school enrollment:
Students in private schools in grades 1 to 8 (elementary and middle school): 826
Here:
26.1%
Illinois:
13.3%
Students in private schools in grades 9 to 12 (high school): 482
Here:
35.9%
Illinois:
9.9%
Students in private undergraduate colleges: 425
Here:
41.8%
Illinois:
27.4%
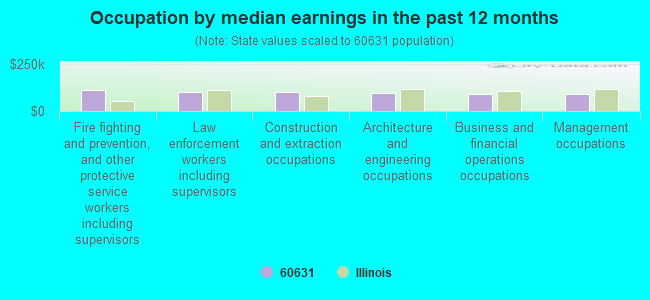
Occupation by median earnings in the past 12 months ($)
110,364Fire fighting and prevention, and other protective service workers including supervisors
102,490Law enforcement workers including supervisors
101,292Construction and extraction occupations
93,917Architecture and engineering occupations
90,691Business and financial operations occupations
90,604Management occupations
Companies with biggest federal contracts located in this zip code (CHICAGO, IL):
STANLEY CONSULTANTS INC (8501 W HIGGINSRD STE 730) : $2,816,624 in 30 contractsfrom 1999 to 2005
Contracts for A&E Production Engineering Services (including Design and Control, and Building Programming), Administrative and Service Buildings, Architect - Engineer Services (including landscaping, interior layout, and designing), Engineering Drafting Services by Army, Air Force, U.S. Army Corps of Engineers - civil program financing only, Navy, and others Signed by year:2000: $10,995; 2001: $682,496; 2002: $396,198; 2003: $643,750; 2004: $349,746; 2005: $685,738; 2006: $0.
Biggest contracts:
$682,496 with Army for A&E Production Engineering Services (including Design and Control, and Building Programming). Taking place in NY. Signed on 2001-06-27. Completion date: 2002-03-11.
$211,487 with Army for Administrative and Service Buildings. Taking place in IA. Signed on 2002-11-08. Completion date: 2003-02-10.
$205,886 with Army for Architect - Engineer Services (including landscaping, interior layout, and designing). Taking place in NY. Signed on 2003-03-11. Completion date: 2003-07-20.
$204,831 with Army for Administrative and Service Buildings. Taking place in IA. Signed on 2003-07-22. Completion date: 2003-12-04.
STEWART-WARNER CORPORATION (7252 W IBSEN) : $2,143,167 in 71 contractsfrom 2000 to 2006
Contracts for Engine Instruments, Liquid and Gas Flow, Liquid Level, and Mechanical Motion Measuring Instruments, Pressure, Temperature, and Humidity Measuring and Controlling Instruments, Electrical and Electronic Properties Measuring and Testing Instruments by Defense Logistics Agency Signed by year:2000: $52,210; 2001: $205,175; 2002: $264,320; 2003: $0; 2004: $763,596; 2005: $704,088; 2006: $153,778.
Biggest contracts:
$498,876 with Defense Logistics Agency for Engine Instruments. Signed on 2005-04-18. Completion date: 2005-11-27.
$174,480, same as above.Signed on 2002-04-26. Completion date: 2002-07-28.
$122,700, same as above.Signed on 2004-12-22. Completion date: 2005-04-20.
$99,991, same as above.Signed on 2004-06-26. Completion date: 2004-09-27.
UNITED STATES CELLULAR CORPORA (8410 WEST BRYN MAWR AVE SU; small business) 500 employees, $0 revenue. : $378,483 in 51 contractsfrom 1999 to 2006
Contracts for Telephone and/or Communications Services (includes Telegraph, Telex, and Cablevision Services), Lease or Rental of Equipment -- Communication, Detection, and Coherent Radiation Equipment, Meteorological Instruments and Apparatus, Telephone and Telegraph Equipment, and moreby Air Force, Federal Bureau of Investigation, Bureau of Reclamation, Bureau of Alcohol, Tobacco, Firearms and Explosives, and others Signed by year:2000: $35,172; 2001: $21,000; 2002: $15,038; 2003: $108,541; 2004: $85,065; 2005: $103,727; 2006: $6,940.
Biggest contracts:
$72,000 with Air Force for Telephone and/or Communications Services (includes Telegraph, Telex, and Cablevision Services). Taking place in OK. Signed on 2005-12-05. Completion date: 2006-09-30.
$49,667 with Air Force for Lease or Rental of Equipment -- Communication, Detection, and Coherent Radiation Equipment. Taking place in OK. Signed on 2003-11-12. Completion date: 2007-12-07.
$32,172, same as above.Signed on 2000-10-10. Completion date: 2001-09-30.
$22,200 with Federal Bureau of Investigation for Lease or Rental of Equipment -- Communication, Detection, and Coherent Radiation Equipment. Taking place in WI. Signed on 2004-01-12. Completion date: 2004-01-31.
NES EQUIPMENT RENTAL LP (8770 WEST BRYN MAWR AVENUE) : $108,393 in 4 contractsfrom 2003 to 2004
$86,925 with NASA for Miscellaneous Service and Trade Equipment. Taking place in AL. Signed on 2003-08-06. Effective on 2003-10-01. Completion date: 2003-10-27.
$9,680 with Army for Passenger Motor Vehicles. Taking place in AL. Signed on 2004-05-21. Completion date: 2004-11-25.
$6,490 with National Park Service for . Taking place in MO. Signed on 2003-12-05. Completion date: 2004-01-16.
$5,298 with U.S. Army Corps of Engineers - civil program financing only for Scaffolding Equipment and Concrete Forms. Taking place in AR. Signed on 2003-07-25. Completion date: 2003-07-31.
BROADWAY ELECTRIC, INC. (6575 N. AVONDALE AVE; small business)
$40,000 with Navy for Maintenance, Repair or Alteration of Real Property -- Hospitals and Infirmaries. Signed on 2000-05-31. Completion date: 1997-11-22.
JDM INFRASTRUCTURE LLC (8770 W BRYN MAWR AVENUE; small business) : $18,920 in 2 contractsfrom 2004 to 2006
$14,160 with Army for ADP Input/Output and Storage Devices. Signed on 2004-08-04. Completion date: 2004-08-18.
$4,760 with Navy for ADP Components. Signed on 2006-03-03. Completion date: 2006-03-17.
garnet midwest inc. (7144 N. HARLEM AVE.; small business)
$12,702 with Forest Service for Laboratory Equipment and Supplies. Signed on 2005-01-03. Completion date: 2005-01-31.
NES RENTALS HOLDINGS INC (8770 W BRYN MAWR, 4TH FL)
$9,172 with Air Force for Lease or Rental of Equipment -- Materials Handling Equipment. Taking place in SC. Signed on 2006-06-21. Completion date: 2006-08-24.
CHICAGO H&S HTL PROPERTY LLC (8609 W BRYN MAWR AVE STE 2)
$7,541 with Army for Lodging - Hotel/Motel. Signed on 2006-01-12. Completion date: 2006-01-15.
REDDI RENTALS, INC (6185 N CANFIELD AVE; small business)
$6,019 with Army for Lease or Rental of Facilities -- Recreation Facilities (Non-Building). Signed on 2005-06-21. Completion date: 2005-07-07.
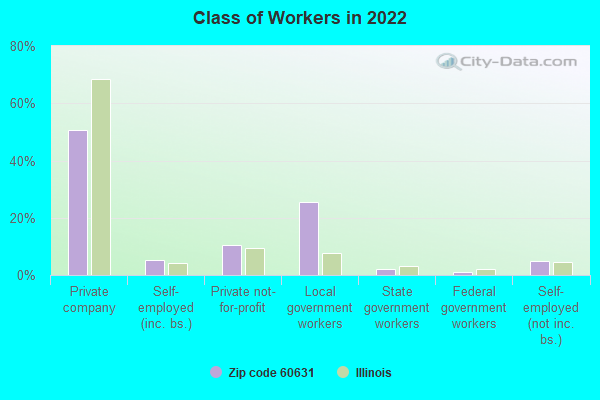
Top industries in this zip code by the number of employees in 2005:
Health Care and Social Assistance: General Medical and Surgical Hospitals (over 1000: 1)
Information: Web Search Portals (over 1000: 1)
Other Services (except Public Administration): Religious Organizations (500-999: 1, 100-249: 1, 50-99: 4, 20-49: 4, 10-19: 4, 5-9: 5, 1-4: 8)
Administrative and Support and Waste Management and Remediation Services: Temporary Help Services (250-499: 1, 100-249: 2, 50-99: 4, 20-49: 1, 10-19: 1, 1-4: 3)
Administrative and Support and Waste Management and Remediation Services: Security Guards and Patrol Services (500-999: 1, 100-249: 1, 50-99: 1, 10-19: 2, 1-4: 2)
Information: Cellular and Other Wireless Telecommunications (500-999: 1, 100-249: 1, 20-49: 2, 1-4: 3)
Accommodation and Food Services: Hotels (except Casino Hotels) and Motels (250-499: 1, 100-249: 1, 50-99: 2, 20-49: 1)
Health Care and Social Assistance: Offices of Physicians (except Mental Health Specialists) (20-49: 6, 10-19: 14, 5-9: 16, 1-4: 29)
Wholesale Trade: Other Electronic Parts and Equipment Merchant Wholesalers (250-499: 1, 100-249: 1, 10-19: 1, 1-4: 1)
People in group quarters in 2010:
462 people in nursing facilities/skilled-nursing facilities
67 people in other noninstitutional facilities
People in group quarters in 2000:
562 people in nursing homes
111 people in religious group quarters
5 people in hospitals/wards and hospices for chronically ill
5 people in other hospitals or wards for chronically ill
Fatal accident statistics in 2013:
Fatal accident count: 1
Vehicles involved in fatal accidents: 3
Fatal accidents caused by drunken drivers: 0
Fatalities: 1
Persons involved in fatal accidents: 4
Pedestrians involved in fatal accidents: 0
Fatal accident statistics in 2012:
Fatal accident count: 3
Vehicles involved in fatal accidents: 4
Fatal accidents caused by drunken drivers: 2
Fatalities: 3
Persons involved in fatal accidents: 7
Pedestrians involved in fatal accidents: 0
Home Mortgage Disclosure Act Aggregated Statistics For Year 2009 (Based on 6 full and 10 partial tracts)
A) FHA, FSA/RHS & VA Home Purchase Loans
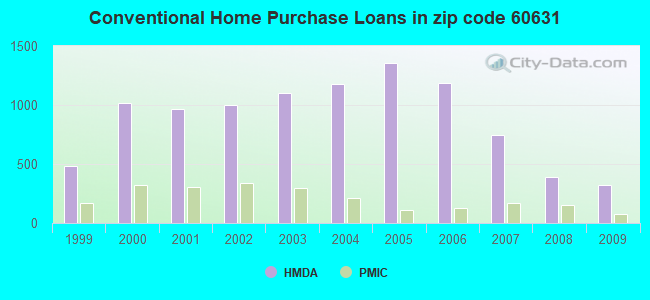
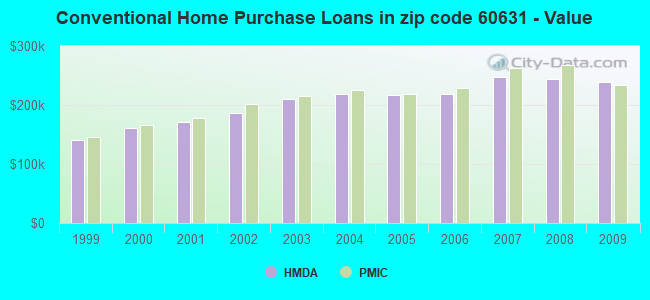
B) Conventional Home Purchase Loans
C) Refinancings
D) Home Improvement Loans
E) Loans on Dwellings For 5+ Families
F) Non-occupant Loans on < 5 Family Dwellings (A B C & D)
G) Loans On Manufactured Home Dwelling (A B C & D)
Number
Average Value
Number
Average Value
Number
Average Value
Number
Average Value
Number
Average Value
Number
Average Value
Number
Average Value
LOANS ORIGINATED
120
$275,065
322
$238,587
2,034
$258,799
42
$151,452
4
$431,958
40
$287,418
0
$0
APPLICATIONS APPROVED, NOT ACCEPTED
10
$258,656
17
$286,146
204
$289,747
4
$95,665
0
$0
1
$105,430
0
$0
APPLICATIONS DENIED
26
$255,992
33
$199,347
455
$299,088
21
$72,998
0
$0
12
$282,742
2
$94,910
APPLICATIONS WITHDRAWN
5
$374,244
18
$255,683
267
$277,660
6
$129,265
0
$0
1
$194,200
0
$0
FILES CLOSED FOR INCOMPLETENESS
5
$196,802
4
$319,625
100
$277,393
4
$173,750
0
$0
0
$0
0
$0
Aggregated Statistics For Year 2008 (Based on 6 full and 10 partial tracts)
A) FHA, FSA/RHS & VA Home Purchase Loans
B) Conventional Home Purchase Loans
C) Refinancings
D) Home Improvement Loans
E) Loans on Dwellings For 5+ Families
F) Non-occupant Loans on < 5 Family Dwellings (A B C & D)
Number
Average Value
Number
Average Value
Number
Average Value
Number
Average Value
Number
Average Value
Number
Average Value
LOANS ORIGINATED
59
$285,433
387
$243,354
1,107
$277,500
87
$107,247
11
$819,423
55
$213,172
APPLICATIONS APPROVED, NOT ACCEPTED
0
$0
40
$238,845
149
$260,727
12
$109,515
0
$0
1
$111,110
APPLICATIONS DENIED
16
$322,500
45
$270,586
435
$318,361
71
$120,356
0
$0
27
$244,258
APPLICATIONS WITHDRAWN
6
$300,312
51
$238,364
160
$283,728
14
$276,881
0
$0
14
$223,000
FILES CLOSED FOR INCOMPLETENESS
0
$0
13
$352,700
62
$295,774
12
$137,882
0
$0
0
$0
Aggregated Statistics For Year 2007 (Based on 6 full and 10 partial tracts)
A) FHA, FSA/RHS & VA Home Purchase Loans
B) Conventional Home Purchase Loans
C) Refinancings
D) Home Improvement Loans
E) Loans on Dwellings For 5+ Families
F) Non-occupant Loans on < 5 Family Dwellings (A B C & D)
Number
Average Value
Number
Average Value
Number
Average Value
Number
Average Value
Number
Average Value
Number
Average Value
LOANS ORIGINATED
2
$323,195
743
$246,945
1,294
$265,773
188
$101,482
7
$533,291
99
$240,070
APPLICATIONS APPROVED, NOT ACCEPTED
0
$0
89
$229,311
189
$247,151
41
$152,824
0
$0
10
$258,903
APPLICATIONS DENIED
2
$183,355
135
$203,467
449
$297,132
105
$170,322
0
$0
41
$257,455
APPLICATIONS WITHDRAWN
0
$0
60
$268,599
210
$297,136
19
$189,048
4
$423,512
23
$255,572
FILES CLOSED FOR INCOMPLETENESS
0
$0
20
$347,510
106
$291,867
4
$647,792
0
$0
3
$167,830
Aggregated Statistics For Year 2006 (Based on 6 full and 10 partial tracts)
A) FHA, FSA/RHS & VA Home Purchase Loans
B) Conventional Home Purchase Loans
C) Refinancings
D) Home Improvement Loans
E) Loans on Dwellings For 5+ Families
F) Non-occupant Loans on < 5 Family Dwellings (A B C & D)
G) Loans On Manufactured Home Dwelling (A B C & D)
Number
Average Value
Number
Average Value
Number
Average Value
Number
Average Value
Number
Average Value
Number
Average Value
Number
Average Value
LOANS ORIGINATED
2
$215,245
1,189
$218,526
1,386
$254,091
196
$132,230
17
$472,258
157
$234,959
4
$52,448
APPLICATIONS APPROVED, NOT ACCEPTED
0
$0
123
$258,381
172
$232,959
47
$81,886
0
$0
23
$306,602
0
$0
APPLICATIONS DENIED
2
$124,095
209
$252,387
444
$268,442
63
$78,896
2
$554,290
39
$273,199
0
$0
APPLICATIONS WITHDRAWN
0
$0
105
$233,901
274
$280,101
17
$153,983
0
$0
34
$319,563
0
$0
FILES CLOSED FOR INCOMPLETENESS
0
$0
35
$264,798
75
$304,672
6
$230,798
0
$0
9
$345,311
0
$0
Aggregated Statistics For Year 2005 (Based on 6 full and 10 partial tracts)
A) FHA, FSA/RHS & VA Home Purchase Loans
B) Conventional Home Purchase Loans
C) Refinancings
D) Home Improvement Loans
E) Loans on Dwellings For 5+ Families
F) Non-occupant Loans on < 5 Family Dwellings (A B C & D)
G) Loans On Manufactured Home Dwelling (A B C & D)
Number
Average Value
Number
Average Value
Number
Average Value
Number
Average Value
Number
Average Value
Number
Average Value
Number
Average Value
LOANS ORIGINATED
2
$248,250
1,356
$217,412
1,730
$238,849
208
$115,027
23
$1,167,534
180
$217,767
4
$73,952
APPLICATIONS APPROVED, NOT ACCEPTED
2
$116,740
125
$223,990
218
$226,380
37
$118,970
2
$854,190
23
$265,207
0
$0
APPLICATIONS DENIED
2
$230,375
239
$200,895
440
$246,625
67
$101,277
1
$275,970
31
$219,415
2
$28,900
APPLICATIONS WITHDRAWN
0
$0
136
$225,112
306
$254,898
34
$179,696
1
$826,880
13
$224,246
3
$42,463
FILES CLOSED FOR INCOMPLETENESS
0
$0
20
$209,082
60
$263,789
12
$152,266
0
$0
8
$226,109
0
$0
Aggregated Statistics For Year 2004 (Based on 6 full and 10 partial tracts)
A) FHA, FSA/RHS & VA Home Purchase Loans
B) Conventional Home Purchase Loans
C) Refinancings
D) Home Improvement Loans
E) Loans on Dwellings For 5+ Families
F) Non-occupant Loans on < 5 Family Dwellings (A B C & D)
G) Loans On Manufactured Home Dwelling (A B C & D)
Number
Average Value
Number
Average Value
Number
Average Value
Number
Average Value
Number
Average Value
Number
Average Value
Number
Average Value
LOANS ORIGINATED
4
$231,990
1,178
$218,124
1,803
$220,555
199
$91,616
24
$607,065
110
$243,696
3
$119,147
APPLICATIONS APPROVED, NOT ACCEPTED
2
$239,530
121
$242,246
206
$196,655
34
$82,614
0
$0
16
$246,846
0
$0
APPLICATIONS DENIED
2
$173,345
133
$209,946
443
$203,731
102
$96,858
4
$322,110
48
$187,320
1
$39,540
APPLICATIONS WITHDRAWN
6
$197,497
63
$254,661
320
$216,617
16
$134,141
0
$0
15
$248,877
0
$0
FILES CLOSED FOR INCOMPLETENESS
0
$0
33
$166,233
104
$205,022
13
$65,807
0
$0
6
$187,372
1
$41,860
Aggregated Statistics For Year 2003 (Based on 6 full and 10 partial tracts)
A) FHA, FSA/RHS & VA Home Purchase Loans
B) Conventional Home Purchase Loans
C) Refinancings
D) Home Improvement Loans
E) Loans on Dwellings For 5+ Families
F) Non-occupant Loans on < 5 Family Dwellings (A B C & D)
Number
Average Value
Number
Average Value
Number
Average Value
Number
Average Value
Number
Average Value
Number
Average Value
LOANS ORIGINATED
8
$190,670
1,098
$210,828
4,860
$184,187
169
$55,068
31
$664,258
151
$187,260
APPLICATIONS APPROVED, NOT ACCEPTED
0
$0
93
$229,780
431
$176,472
18
$52,681
1
$600,140
11
$191,245
APPLICATIONS DENIED
0
$0
94
$214,505
631
$190,554
56
$42,633
0
$0
23
$255,830
APPLICATIONS WITHDRAWN
0
$0
66
$193,746
447
$189,179
21
$84,753
0
$0
11
$148,185
FILES CLOSED FOR INCOMPLETENESS
0
$0
22
$235,121
116
$184,999
3
$56,163
0
$0
2
$78,260
Aggregated Statistics For Year 2002 (Based on 6 full and 10 partial tracts)
A) FHA, FSA/RHS & VA Home Purchase Loans
B) Conventional Home Purchase Loans
C) Refinancings
D) Home Improvement Loans
E) Loans on Dwellings For 5+ Families
F) Non-occupant Loans on < 5 Family Dwellings (A B C & D)
Number
Average Value
Number
Average Value
Number
Average Value
Number
Average Value
Number
Average Value
Number
Average Value
LOANS ORIGINATED
16
$211,269
999
$185,676
3,389
$178,050
155
$34,199
12
$405,099
98
$160,553
APPLICATIONS APPROVED, NOT ACCEPTED
2
$293,555
86
$190,712
335
$177,331
17
$45,230
0
$0
20
$118,386
APPLICATIONS DENIED
2
$114,705
73
$158,376
300
$167,129
50
$54,433
4
$259,665
41
$153,737
APPLICATIONS WITHDRAWN
0
$0
48
$165,971
209
$185,297
14
$59,137
2
$457,830
4
$193,408
FILES CLOSED FOR INCOMPLETENESS
0
$0
20
$189,480
175
$179,575
4
$41,840
0
$0
4
$93,378
Aggregated Statistics For Year 2001 (Based on 6 full and 10 partial tracts)
A) FHA, FSA/RHS & VA Home Purchase Loans
B) Conventional Home Purchase Loans
C) Refinancings
D) Home Improvement Loans
E) Loans on Dwellings For 5+ Families
F) Non-occupant Loans on < 5 Family Dwellings (A B C & D)
Number
Average Value
Number
Average Value
Number
Average Value
Number
Average Value
Number
Average Value
Number
Average Value
LOANS ORIGINATED
27
$204,471
965
$171,008
2,610
$164,444
212
$35,650
23
$491,117
75
$180,854
APPLICATIONS APPROVED, NOT ACCEPTED
2
$185,265
59
$179,229
231
$151,915
47
$52,722
0
$0
8
$136,829
APPLICATIONS DENIED
2
$229,415
96
$180,362
275
$145,754
56
$44,136
0
$0
14
$180,546
APPLICATIONS WITHDRAWN
4
$146,635
43
$177,860
191
$169,509
43
$51,004
0
$0
9
$157,077
FILES CLOSED FOR INCOMPLETENESS
2
$210,110
3
$270,900
66
$190,332
4
$64,300
0
$0
0
$0
Aggregated Statistics For Year 2000 (Based on 6 full and 10 partial tracts)
A) FHA, FSA/RHS & VA Home Purchase Loans
B) Conventional Home Purchase Loans
C) Refinancings
D) Home Improvement Loans
E) Loans on Dwellings For 5+ Families
F) Non-occupant Loans on < 5 Family Dwellings (A B C & D)
Number
Average Value
Number
Average Value
Number
Average Value
Number
Average Value
Number
Average Value
Number
Average Value
LOANS ORIGINATED
23
$185,881
1,016
$160,764
552
$136,371
191
$46,099
12
$462,687
31
$150,918
APPLICATIONS APPROVED, NOT ACCEPTED
0
$0
76
$149,010
111
$117,514
45
$37,363
0
$0
1
$82,350
APPLICATIONS DENIED
3
$156,437
76
$151,664
148
$131,360
82
$34,565
1
$196,130
14
$131,168
APPLICATIONS WITHDRAWN
6
$164,260
64
$179,818
111
$104,495
32
$41,852
4
$444,675
8
$114,568
FILES CLOSED FOR INCOMPLETENESS
0
$0
6
$157,010
58
$191,171
7
$29,126
2
$311,110
2
$184,355
Aggregated Statistics For Year 1999 (Based on 3 full and 5 partial tracts)
A) FHA, FSA/RHS & VA Home Purchase Loans
B) Conventional Home Purchase Loans
C) Refinancings
D) Home Improvement Loans
E) Loans on Dwellings For 5+ Families
F) Non-occupant Loans on < 5 Family Dwellings (A B C & D)
2002 - 2018 National Fire Incident Reporting System (NFIRS) incidents
Based on the data from the years 2002 - 2018 the average number of fires per year is 42. The highest number of fire incidents - 70 took place in 2009, and the least - 6 in 2005. The data has an increasing trend.
When looking into fire subcategories, the most reports belonged to: Structure Fires (41.0%), and Outside Fires (26.0%).
Fire incident types reported to NFIRS in Zip Code 60631

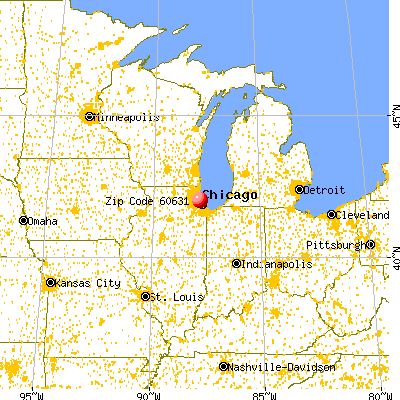


 Nearest zip codes: 60656, 60706, 60714, 60068, 60634, 60053.


 Based on the data from the years 2002 - 2018 the average number of fires per year is 42. The highest number of fire incidents - 70 took place in 2009, and the least - 6 in 2005. The data has an increasing trend.
 When looking into fire subcategories, the most reports belonged to: Structure Fires (41.0%), and Outside Fires (26.0%).