Will County, Illinois (IL)
County owner-occupied free and clear houses and condos in 2010: 34,232
County owner-occupied houses and condos in 2000: 139,411
Renter-occupied apartments: 37,831 (it was 28,131 in 2000)
| % of renters here: | 17% |
| State: | 33% |
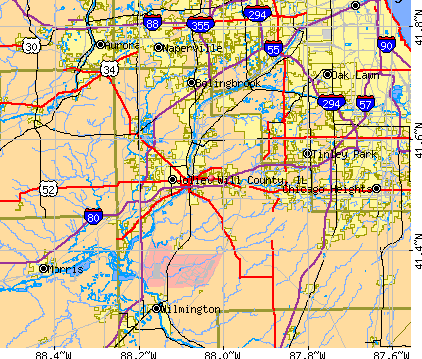
Land area: 837 sq. mi.
Water area: 12.4 sq. mi.
Population density: 833 people per square mile (very high).
Industries providing employment: Educational, health and social services (20.7%), Retail trade (12.1%), Professional, scientific, management, administrative, and waste management services (11.9%), Manufacturing (10.3%).
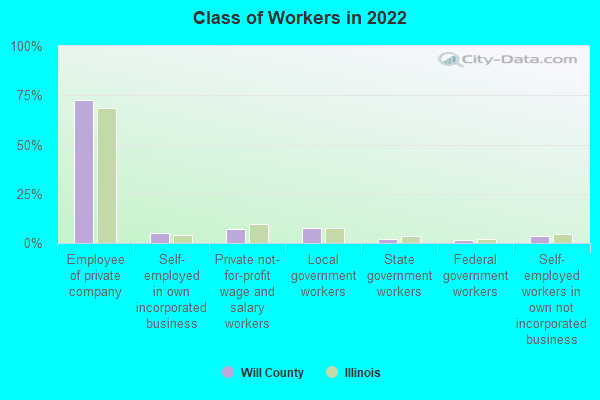
Type of workers:
- Private wage or salary: 85%
- Government: 12%
- Self-employed, not incorporated: 3%
- Unpaid family work: 0%
- OSM Map
- General Map
- Google Map
- MSN Map

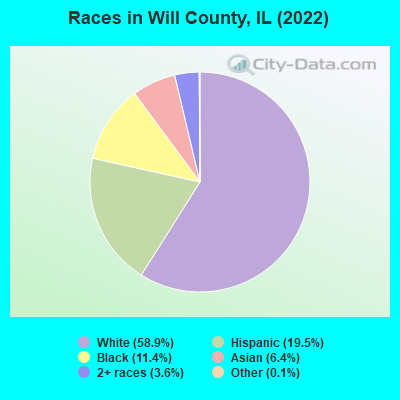
- 410,10058.9%White Non-Hispanic Alone
- 135,57119.5%Hispanic or Latino
- 79,52811.4%Black Non-Hispanic Alone
- 44,6936.4%Asian alone
- 25,2563.6%Two or more races
- 9980.1%Some other race alone
- 3100.04%American Indian and Alaska Native alone
- 3010.04%Native Hawaiian and Other
Pacific Islander alone
| Median resident age: | 39.2 years |
| Illinois median age: | 39.1 years |
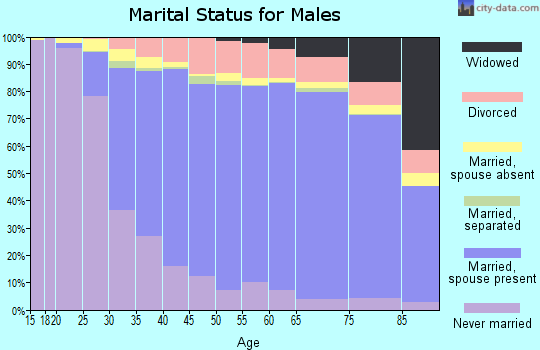
| Males: 348,498 | |
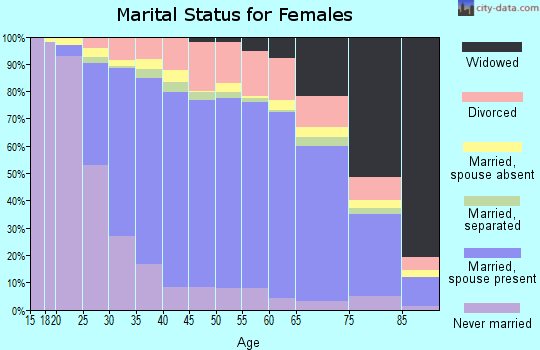
| Females: 348,259 |

 | Why is Will County shaped the way it is? (3 replies) |
| Park Forest real estate taxes (11 replies) |
| Will County Employees Union Turned Down 14.5% Raise & 90% Health Covered (11 replies) |
| North suburbs vs West suburbs vs South suburbs (107 replies) |
| Naperville Home - Will County vs Dupage (3 replies) |
| Got pulled over first time, issued 2 citations (20 replies) |
| Will County: | 2.0 people |
| Illinois: | 3 people |
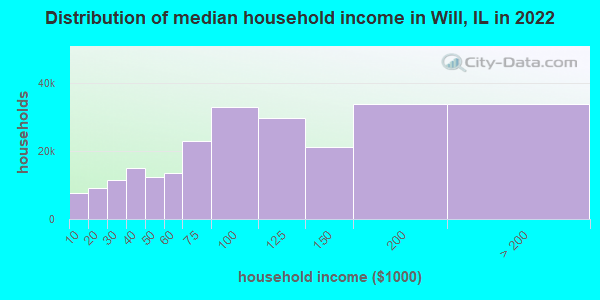
Estimated median household income in 2022: $96,668 ($62,238 in 1999)
| This county: | $96,668 |
| Illinois: | $76,708 |
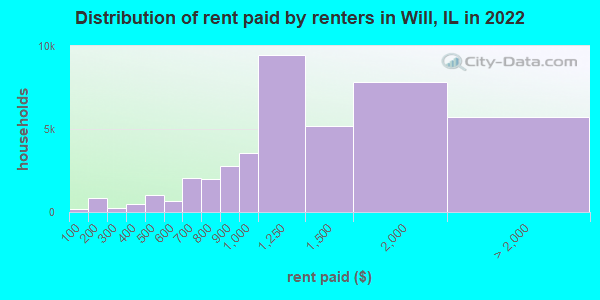
Median contract rent in 2022 for apartments: $1,163 (lower quartile is $893, upper quartile is $1,595)
| This county: | $1163 |
| State: | $1008 |
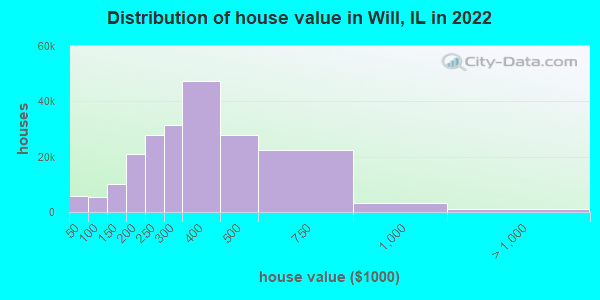
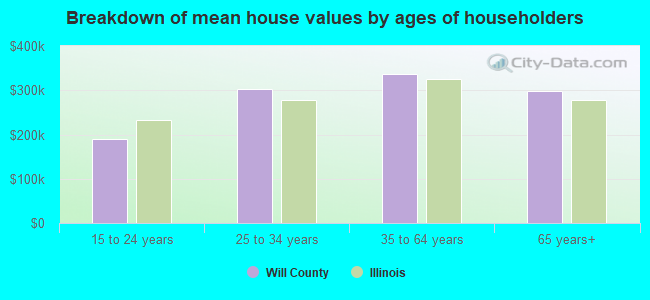
Estimated median house or condo value in 2022: $300,900 (it was $152,200 in 2000)
| Will: | $300,900 |
| Illinois: | $251,600 |
Mean price in 2022:
Median monthly housing costs for homes and condos with a mortgage: $2,034Detached houses: $341,136
Here: $341,136 State: $310,164 Townhouses or other attached units: $239,631
Here: $239,631 State: $286,230 In 2-unit structures: $239,357
Here: $239,357 State: $299,638 In 3-to-4-unit structures: $200,351
Here: $200,351 State: $330,907 In 5-or-more-unit structures: $168,162
Here: $168,162 State: $318,887 Mobile homes: $77,508
Here: $77,508 State: $78,855 Occupied boats, RVs, vans, etc.: $1,010,793
Here: $1,010,793 State: $171,856
Median monthly housing costs for units without a mortgage: $888
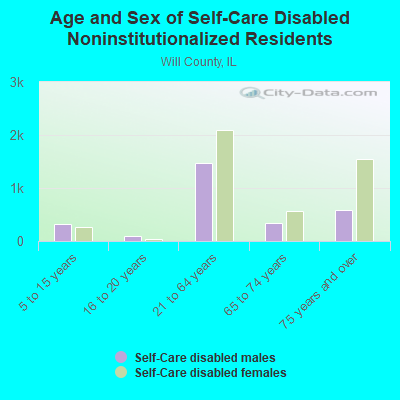
Institutionalized population: 6,353
Crime in 2021 (reported by the sheriff's office or county police, not the county total):
- Murders: 1
- Rapes: 29
- Robberies: 1
- Assaults: 63
- Burglaries: 60
- Thefts: 176
- Auto thefts: 39
Crime in 2020 (reported by the sheriff's office or county police, not the county total):
- Murders: 5
- Rapes: 45
- Robberies: 17
- Assaults: 91
- Burglaries: 198
- Thefts: 382
- Auto thefts: 78
Health of residents in Will County based on CDC Behavioral Risk Factor Surveillance System Survey Questionnaires from 2013 to 2021:
General health status score of residents in this county from 1 (poor) to 5 (excellent) is 3.5. This is about average.73.0% of residents exercised in the past month. This is about average.
40.5% of residents smoked 100+ cigarettes in their lives. This is less than average.
58.1% of adult residents drank alcohol in the past 30 days. This is less than average.
68.0% of residents visited a dentist within the past year. This is about average.
Average weight of males is 197 pounds. This is about average.
Average weight of females is 164 pounds. This is about average.
Health of residents in Will County based on CDC Behavioral Risk Factor Surveillance System Survey Questionnaires from 2003 to 2012:
General health status score of residents in this county from 1 (poor) to 5 (excellent) is 3.6. This is better than average.78.7% of residents exercised in the past month. This is about average.
42.7% of residents smoked 100+ cigarettes in their lives. This is about average.
100.0% of adult residents drank alcohol in the past 30 days. This is more than average.
Average weight of males is 206 pounds. This is more than average.
Average weight of females is 164 pounds. This is about average.
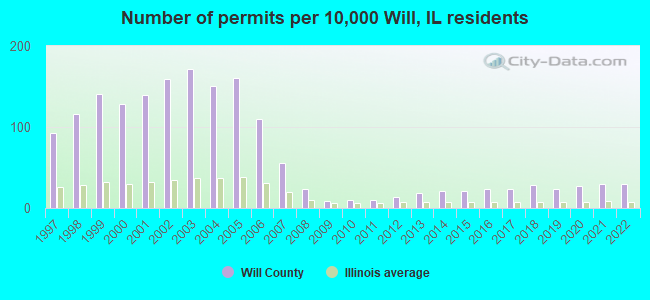
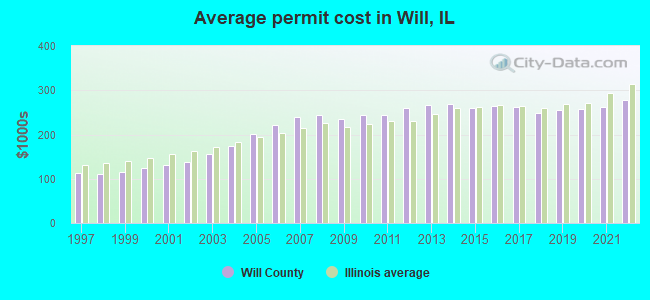
Single-family new house construction building permits:
- 2022: 1498 buildings, average cost: $279,100
- 2021: 1496 buildings, average cost: $262,900
- 2020: 1368 buildings, average cost: $256,600
- 2019: 1181 buildings, average cost: $255,800
- 2018: 1406 buildings, average cost: $249,000
- 2017: 1219 buildings, average cost: $263,400
- 2016: 1197 buildings, average cost: $265,400
- 2015: 1073 buildings, average cost: $260,100
- 2014: 1045 buildings, average cost: $269,100
- 2013: 955 buildings, average cost: $266,100
- 2012: 711 buildings, average cost: $260,400
- 2011: 526 buildings, average cost: $242,800
- 2010: 492 buildings, average cost: $243,400
- 2009: 466 buildings, average cost: $234,200
- 2008: 1152 buildings, average cost: $243,000
- 2007: 2782 buildings, average cost: $240,400
- 2006: 5547 buildings, average cost: $220,900
- 2005: 8036 buildings, average cost: $201,400
- 2004: 7603 buildings, average cost: $172,900
- 2003: 8661 buildings, average cost: $156,600
- 2002: 7966 buildings, average cost: $137,800
- 2001: 7047 buildings, average cost: $130,200
- 2000: 6478 buildings, average cost: $123,600
- 1999: 7074 buildings, average cost: $116,400
- 1998: 5810 buildings, average cost: $109,500
- 1997: 4652 buildings, average cost: $111,900
Median real estate property taxes paid for housing units with mortgages in 2022: $6,892 (2.2%)
Median real estate property taxes paid for housing units with no mortgage in 2022: $6,247 (2.2%)
| Will County: | 6.9% |
| Illinois: | 11.9% |
Median age of residents in 2022: 39.2 years old
(Males: 38.4 years old, Females: 40.1 years old)
(Median age for: White residents: 44.1 years old, Black residents: 37.8 years old, American Indian residents: 37.4 years old, Asian residents: 39.9 years old, Hispanic or Latino residents: 29.1 years old, Other race residents: 32.2 years old)
Area name: Chicago-Naperville-Joliet, IL HUD Metro FMR Area
Fair market rent in 2006 for a 1-bedroom apartment in Will County is $802 a month.
Fair market rent for a 2-bedroom apartment is $901 a month.
Fair market rent for a 3-bedroom apartment is $1102 a month.
Cities in this county include: Joliet, Bolingbrook, Homer Glen, Romeoville, New Lenox, Goodings Grove, Lockport, Mokena, Crest Hill, Plainfield.
2023 air pollution in Will County:
Ozone (1-hour): 0.036 ppm (standard limit: 0.12 ppm). Near U.S. average.
Particulate Matter (PM2.5) Annual: 12.9 µg/m3(standard limit: 15.0 µg/m3). Above U.S. average.
Notable locations in this county outside city limits:
Notable locations in Will County: Glen D Palmer State Game Farm (A), Cedar Ridge Primitive Campground (B), Fox View Picnic Area (C), Tall Oaks Picnic Area (D), Tukaway Farm (E), Head of the Grove (F), Oswego Fire Protection District Station 4 (G), Bristol - Kendall Fire Protection District Station 2 (H), Joliet Fire Department Station 10 (I), Bristol - Kendall Fire Protection District Station 3 (J), Little Rock Fox Fire Department Station 2 Millbrook (K). Display/hide their locations on the map
Shopping Center: Marina Shopping Center (1). Display/hide its location on the map
Churches in Will County include: Oswego Prairie United Methodist Church (A), Plattville Lutheran Church (B), Emanuel Church (C), Helmar Lutheran Church (D), Landmark Missionary Baptist Church (E), Valley Baptist Church (F), Plano Christian Church (G), New Life Assembly Church (H), Lynwood Baptist Church (I). Display/hide their locations on the map
Cemeteries: Wormley Cemetery (1), West Lisbon Lutheran Cemetery (2), Sandy Bluff Cemetery (3), Plattville Evangelical Lutheran Cemetery (4), Pavillion Cemetery (5), Oswego Township Cemetery (6), Cross Lutheran Cemetery (7). Display/hide their locations on the map
Lakes and reservoirs: Lake Plano (A), Loon Lake (B), Beaver Lake (C), Milhurst Lake (D). Display/hide their locations on the map
Streams, rivers, and creeks: Morgan Creek (A), Clear Creek (B), Big Rock Creek (C), East Aux Sable Creek (D), Ackleys Run (E), Middle Aux Sable Creek (F), West Aux Sable Creek (G), Little Slough Creek (H), Rob Roy Creek (I). Display/hide their locations on the map
Parks in Will County include: Klatt Field (1), Maramech Woods Nature Preserve (2), Millhurst Fen Nature Preserve (3), Yorkville Prairie Nature Preserve (4), Houses Grove Forest Preserve (5), Maramach Forest Preserve (6), Augusta Lake Park (7), Silver Springs State Park (8), Violet Patch Park (9). Display/hide their locations on the map
Neighboring counties: Humboldt County, California  , Cook County
  , Modoc County, California , Orange County, New York
  , Lucas County, Ohio , Ulster County, New York .
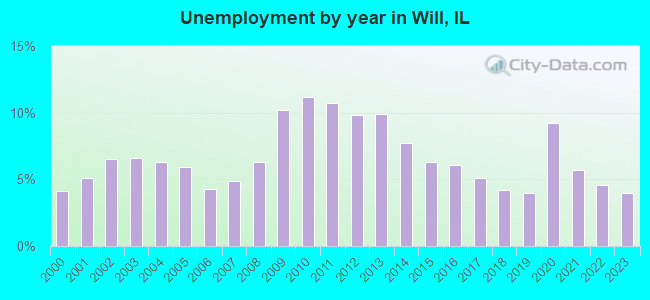
| Here: | 4.0% |
| Illinois: | 4.2% |
Current college students: 26,437
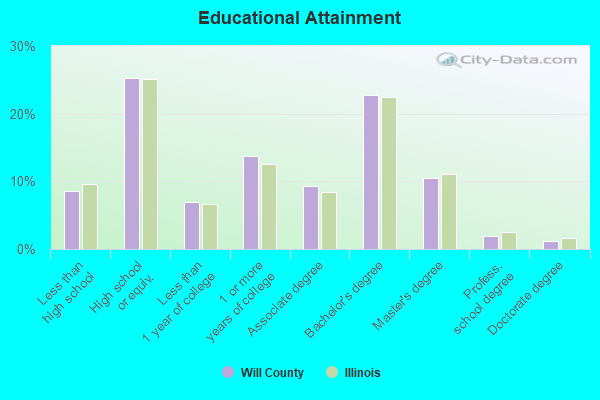
People 25 years of age or older with a high school degree or higher: 91.5%
People 25 years of age or older with a bachelor's degree or higher: 36.2%
Number of foreign born residents: 97,291 (56.7% naturalized citizens)
| Will County: | 14.0% |
| Whole state: | 14.4% |
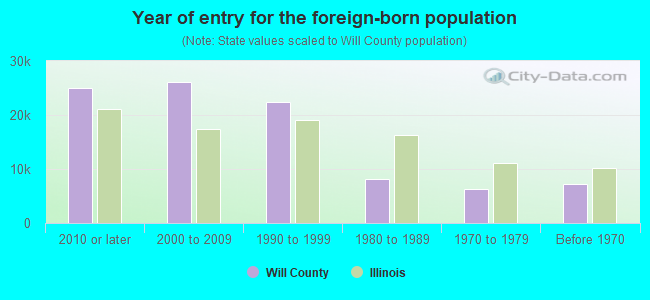
- Year of entry for the foreign-born population
- 25,0072010 or later
- 26,1042000 to 2009
- 22,4031990 to 1999
- 8,1081980 to 1989
- 6,2691970 to 1979
- 7,146Before 1970
Mean travel time to work (commute): minutes
Percentage of county residents living and working in this county: 98.6%
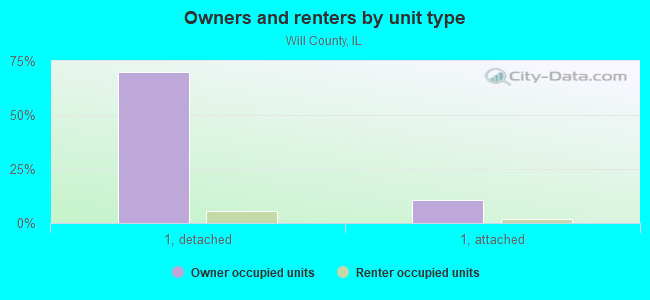
Housing units in structures:
- One, detached: 189,337
- One, attached: 29,132
- Two: 3,855
- 3 or 4: 7,564
- 5 to 9: 5,023
- 10 to 19: 7,673
- 20 to 49: 3,270
- 50 or more: 5,176
- Mobile homes: 3,445
- Boats, RVs, vans, etc.: 110
Housing units in Will County with a mortgage: 134,628 (10,303 second mortgage, 429 home equity loan, 8,085 both second mortgage and home equity loan)
Houses without a mortgage: 3,317
| Here: | 97.8% with mortgage |
| State: | 97.4% with mortgage |
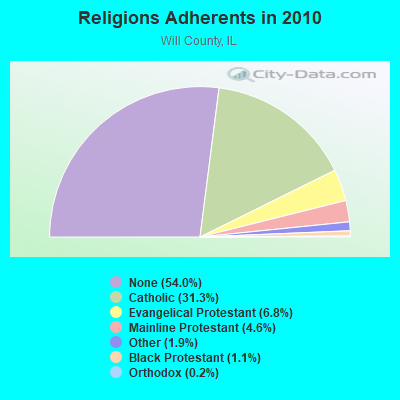
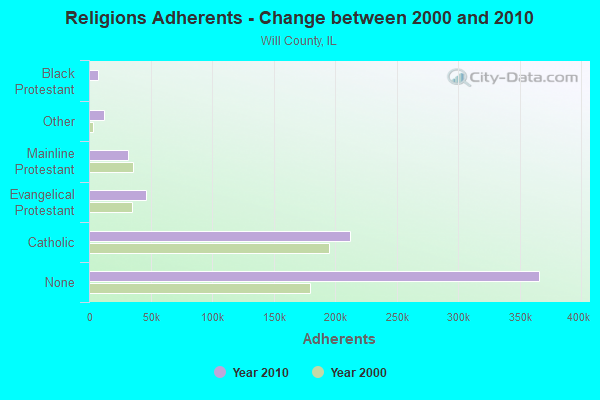
Religion statistics for Will County
| Religion | Adherents | Congregations |
|---|---|---|
| Catholic | 212,252 | 39 |
| Evangelical Protestant | 46,404 | 188 |
| Mainline Protestant | 31,313 | 73 |
| Other | 12,574 | 20 |
| Black Protestant | 7,426 | 16 |
| Orthodox | 1,536 | 6 |
| None | 366,055 | - |
Source: Clifford Grammich, Kirk Hadaway, Richard Houseal, Dale E.Jones, Alexei Krindatch, Richie Stanley and Richard H.Taylor. 2012. 2010 U.S.Religion Census: Religious Congregations & Membership Study. Association of Statisticians of American Religious Bodies. Jones, Dale E., et al. 2002. Congregations and Membership in the United States 2000. Nashville, TN: Glenmary Research Center.
Food Environment Statistics:
| Will County: | 1.27 / 10,000 pop. |
| State: | 2.24 / 10,000 pop. |
| Here: | 0.07 / 10,000 pop. |
| Illinois: | 0.08 / 10,000 pop. |
| This county: | 0.48 / 10,000 pop. |
| Illinois: | 0.75 / 10,000 pop. |
| Will County: | 1.82 / 10,000 pop. |
| Illinois: | 2.61 / 10,000 pop. |
| This county: | 4.26 / 10,000 pop. |
| State: | 6.86 / 10,000 pop. |
| Will County: | 7.7% |
| Illinois: | 8.3% |
| Will County: | 26.3% |
| State: | 25.2% |
| Here: | 13.4% |
| State: | 14.5% |
Agriculture in Will County:
Average size of farms: 320 acresAverage value of agricultural products sold per farm: $99,062
Average value of crops sold per acre for harvested cropland: $312.18
The value of nursery, greenhouse, floriculture, and sod as a percentage of the total market value of agricultural products sold: 20.60%
The value of livestock, poultry, and their products as a percentage of the total market value of agricultural products sold: 6.96%
Average total farm production expenses per farm: $98,100
Harvested cropland as a percentage of land in farms: 92.30%
Irrigated harvested cropland as a percentage of land in farms: 1.01%
Average market value of all machinery and equipment per farm: $101,114
The percentage of farms operated by a family or individual: 85.30%
Average age of principal farm operators: 55 years
Average number of cattle and calves per 100 acres of all land in farms: 1.57
Milk cows as a percentage of all cattle and calves: 16.74%
Corn for grain: 114430 harvested acres
All wheat for grain: 5910 harvested acres
Soybeans for beans: 112650 harvested acres
Vegetables: 3,523 harvested acres
Land in orchards: 28 acres
Tornado activity:
Will County historical area-adjusted tornado activity is significantly below Illinois state average. It is 3823667.2 times below overall U.S. average.Tornadoes in this county have caused 30 fatalities and 358 injuries recorded between 1950 and 2004.
On 8/28/1990, a category 5 (max. wind speeds 261-318 mph) tornado killed 29 people and injured 350 people and caused between $50,000 and $500,000 in damages.
Earthquake activity:
Will County-area historical earthquake activity is significantly above Illinois state average. It is 55% greater than the overall U.S. average.On 4/18/2008 at 09:36:59, a magnitude 5.4 (5.1 MB, 4.8 MS, 5.4 MW, 5.2 MW, Class: Moderate, Intensity: VI - VII) earthquake occurred 212.9 miles away from Will County center
On 6/10/1987 at 23:48:54, a magnitude 5.1 (4.9 MB, 4.4 MS, 4.6 MS, 5.1 LG) earthquake occurred 187.4 miles away from the county center
On 4/18/2008 at 09:36:59, a magnitude 5.2 (5.2 MW, Depth: 8.9 mi) earthquake occurred 212.9 miles away from the county center
On 6/28/2004 at 06:10:52, a magnitude 4.2 (4.2 MW, Depth: 6.2 mi, Class: Light, Intensity: IV - V) earthquake occurred 45.3 miles away from the county center
On 6/18/2002 at 17:37:15, a magnitude 5.0 (4.3 MB, 4.6 MW, 5.0 LG) earthquake occurred 245.2 miles away from Will County center
On 4/18/2008 at 15:14:16, a magnitude 4.8 (4.5 MB, 4.8 MW, 4.6 MW) earthquake occurred 211.3 miles away from the county center
Magnitude types: regional Lg-wave magnitude (LG), body-wave magnitude (MB), surface-wave magnitude (MS), moment magnitude (MW)
Most recent natural disasters:
- Illinois Covid-19 Pandemic, Incident Period: January 20, 2020, FEMA Id: 4489, Natural disaster type: Other
- Illinois Severe Storms, Straight-line Winds, and Tornadoes, Incident Period: November 17, 2013 to November 18, 2013, Major Disaster (Presidential) Declared DR-4157: November 26, 2013, FEMA Id: 4157, Natural disaster type: Storm, Tornado, Wind
- Illinois Severe Storms, Straight-Line Winds and Flooding, Incident Period: April 16, 2013 to May 05, 2013, Major Disaster (Presidential) Declared DR-4116: May 10, 2013, FEMA Id: 4116, Natural disaster type: Storm, Flood, Wind
- Illinois Severe Winter Storm and Snowstorm, Incident Period: January 31, 2011 to February 03, 2011, Major Disaster (Presidential) Declared DR-1960: March 17, 2011, FEMA Id: 1960, Natural disaster type: Snowstorm, Winter Storm
- Illinois Severe Storms and Flooding, Incident Period: September 13, 2008 to October 05, 2008, Major Disaster (Presidential) Declared DR-1800: October 03, 2008, FEMA Id: 1800, Natural disaster type: Storm, Flood
- Illinois Severe Storms and Flooding, Incident Period: August 20, 2007 to August 31, 2007, Major Disaster (Presidential) Declared DR-1729: September 25, 2007, FEMA Id: 1729, Natural disaster type: Storm, Flood
- Illinois Hurricane Katrina Evacuation, Incident Period: August 29, 2005 to October 01, 2005, Emergency Declared EM-3230: September 07, 2005, FEMA Id: 3230, Natural disaster type: Hurricane
- Illinois Severe Storms and Tornadoes, Incident Period: April 20, 2004 to April 23, 2004, Major Disaster (Presidential) Declared DR-1513: April 23, 2004, FEMA Id: 1513, Natural disaster type: Storm, Tornado
- Illinois Severe Winter Storm, Incident Period: December 11, 2000 to December 31, 2000, Emergency Declared EM-3161: January 17, 2001, FEMA Id: 3161, Natural disaster type: Winter Storm
- Illinois Winter Snow Storm, Incident Period: January 01, 1999 to January 15, 1999, Emergency Declared EM-3134: January 08, 1999, FEMA Id: 3134, Natural disaster type: Storm, Snow
- 7 other natural disasters have been reported since 1953.
The number of natural disasters in Will County (17) is near the US average (15).
Major Disasters (Presidential) Declared: 12
Emergencies Declared: 4
Causes of natural disasters: Storms: 9, Floods: 7, Tornadoes: 5, Snowstorms: 2, Winds: 2, Winter Storms: 2, Blizzard: 1, Hurricane: 1, Snow: 1, Other: 1 (Note: some incidents may be assigned to more than one category).
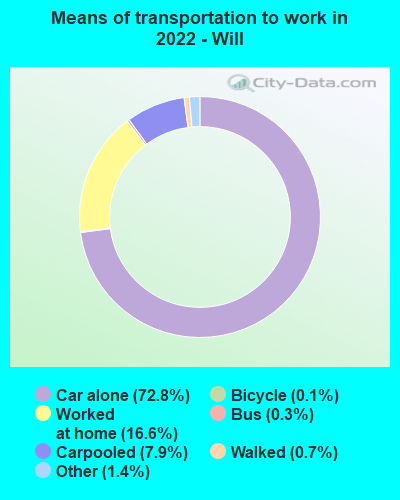
Means of transportation to work:
- Drove a car alone: 229,478 (72.8%)
- Carpooled: 25,004 (7.9%)
- Bus: 919 (0.3%)
- Subway or elevated rail: 113 (0.0%)
- Long-distance train or commuter rail: 193 (0.1%)
- Ferryboat: 87 (0.0%)
- Taxicab, motorcycle, or other means: 4,539 (1.4%)
- Bicycle: 321 (0.1%)
- Walked: 2,361 (0.7%)
- Worked at home: 52,261 (16.6%)
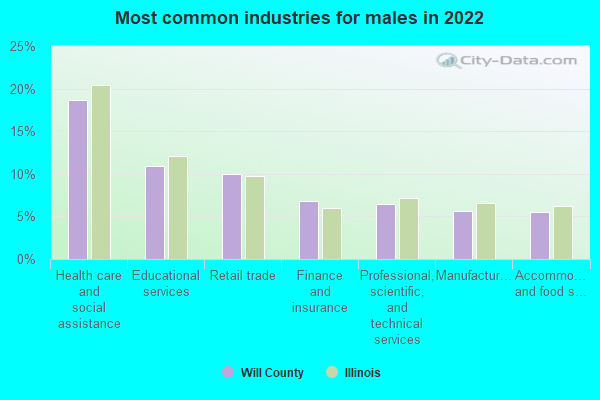
- Health care and social assistance (19%)
- Educational services (11%)
- Retail trade (10%)
- Finance and insurance (7%)
- Professional, scientific, and technical services (6%)
- Manufacturing (6%)
- Accommodation and food services (6%)
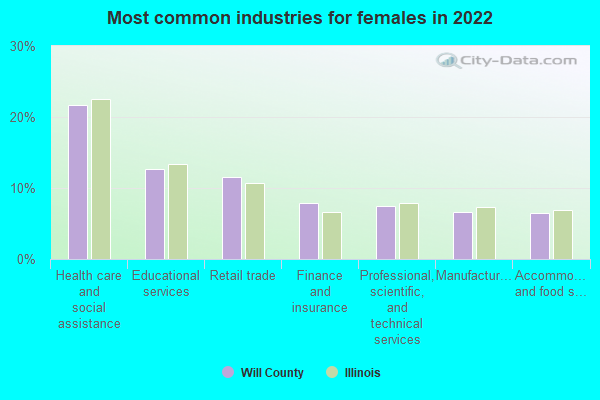
- Health care and social assistance (22%)
- Educational services (13%)
- Retail trade (12%)
- Finance and insurance (8%)
- Professional, scientific, and technical services (7%)
- Manufacturing (7%)
- Accommodation and food services (6%)
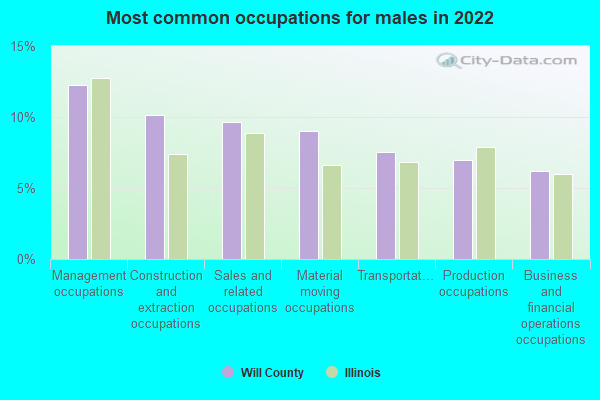
- Management occupations (12%)
- Construction and extraction occupations (10%)
- Sales and related occupations (10%)
- Material moving occupations (9%)
- Transportation occupations (8%)
- Production occupations (7%)
- Business and financial operations occupations (6%)
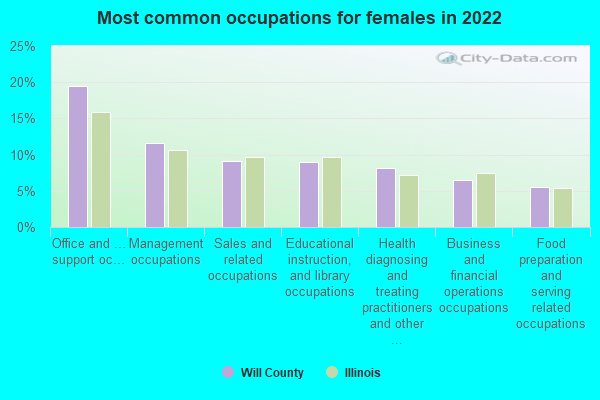
- Office and administrative support occupations (19%)
- Management occupations (12%)
- Sales and related occupations (9%)
- Educational instruction, and library occupations (9%)
- Health diagnosing and treating practitioners and other technical occupations (8%)
- Business and financial operations occupations (7%)
- Food preparation and serving related occupations (5%)
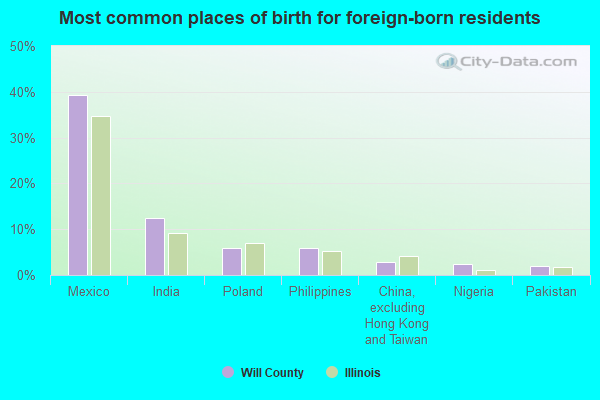
- Mexico (39%)
- India (12%)
- Poland (6%)
- Philippines (6%)
- China, excluding Hong Kong and Taiwan (3%)
- Nigeria (2%)
- Pakistan (2%)
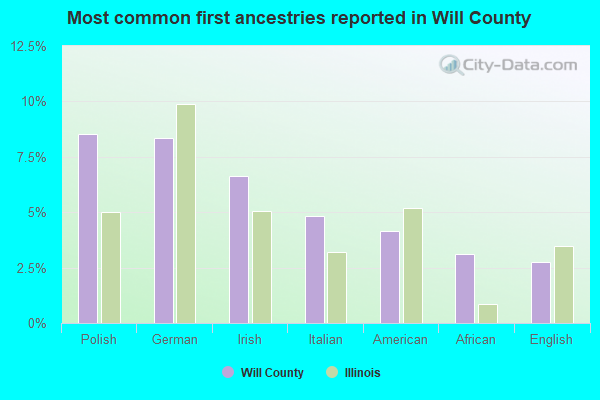
- Polish (9%)
- German (8%)
- Irish (7%)
- Italian (5%)
- American (4%)
- African (3%)
- English (3%)
People in group quarters in Will County, Illinois in 2010:
- 3,160 people in state prisons
- 2,098 people in nursing facilities/skilled-nursing facilities
- 1,507 people in college/university student housing
- 742 people in local jails and other municipal confinement facilities
- 246 people in correctional facilities intended for juveniles
- 227 people in other noninstitutional facilities
- 195 people in group homes intended for adults
- 132 people in emergency and transitional shelters (with sleeping facilities) for people experiencing homelessness
- 94 people in group homes for juveniles (non-correctional)
- 92 people in workers' group living quarters and job corps centers
- 41 people in residential treatment centers for adults
- 9 people in residential treatment centers for juveniles (non-correctional)
- 4 people in in-patient hospice facilities
People in group quarters in Will County, Illinois in 2000:
- 4,218 people in state prisons
- 2,385 people in nursing homes
- 1,226 people in college dormitories (includes college quarters off campus)
- 384 people in training schools for juvenile delinquents
- 374 people in other noninstitutional group quarters
- 307 people in local jails and other confinement facilities (including police lockups)
- 279 people in job corps and vocational training facilities
- 170 people in other nonhousehold living situations
- 117 people in other group homes
- 115 people in homes for the mentally retarded
- 61 people in religious group quarters
- 19 people in agriculture workers' dormitories on farms
- 6 people in homes for the physically handicapped
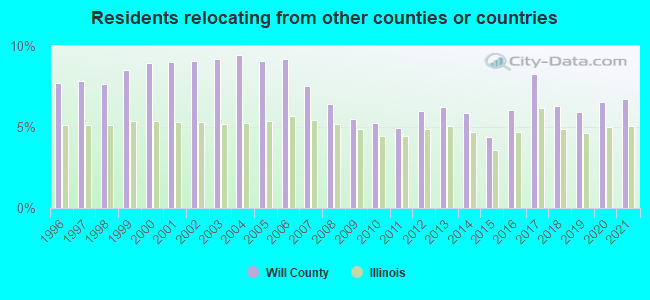
6.75% of this county's 2021 resident taxpayers lived in other counties in 2020 ($73,828 average adjusted gross income)
| Here: | 6.75% |
| Illinois average: | 5.09% |
0.01% of residents moved from foreign countries ($43 average AGI)
Will County: 0.01% Illinois average: 0.01%
5.36% relocated from other counties in Illinois ($59,002 average AGI)
1.38% relocated from other states ($14,782 average AGI)
Will County: 1.38% Illinois average: 2.01%
Top counties from which taxpayers relocated into this county between 2020 and 2021:
| from Cook County, IL | |
| from DuPage County, IL | |
| from Kendall County, IL | |
| from Grundy County, IL | |
| from Kane County, IL | |
| from Lake County, IN | |
| from Kankakee County, IL |
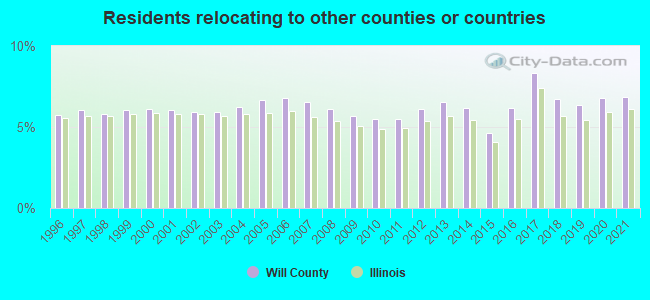
6.85% of this county's 2020 resident taxpayers moved to other counties in 2021 ($78,688 average adjusted gross income)
| Here: | 6.85% |
| Illinois average: | 6.10% |
0.01% of residents moved to foreign countries ($42 average AGI)
Will County: 0.01% Illinois average: 0.01%
4.16% relocated to other counties in Illinois ($41,788 average AGI)
2.68% relocated to other states ($36,858 average AGI)
Will County: 2.68% Illinois average: 3.06%
Top counties to which taxpayers relocated from this county between 2020 and 2021:
| to Cook County, IL | |
| to DuPage County, IL | |
| to Kendall County, IL | |
| to Grundy County, IL | |
| to Lake County, IN | |
| to Kane County, IL | |
| to Kankakee County, IL |
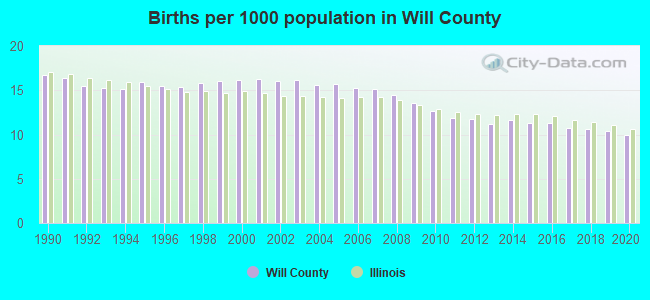
Births per 1000 population from 1990 to 1999: 15.8
Births per 1000 population from 2000 to 2009: 15.4
Births per 1000 population from 2010 to 2022: 9.5
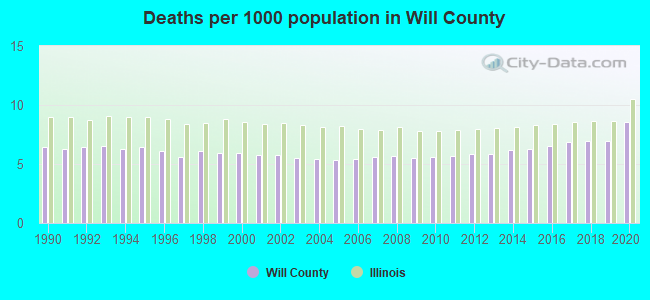
Deaths per 1000 population from 1990 to 1999: 6.2
Deaths per 1000 population from 2000 to 2009: 5.6
Deaths per 1000 population from 2010 to 2020: 6.5
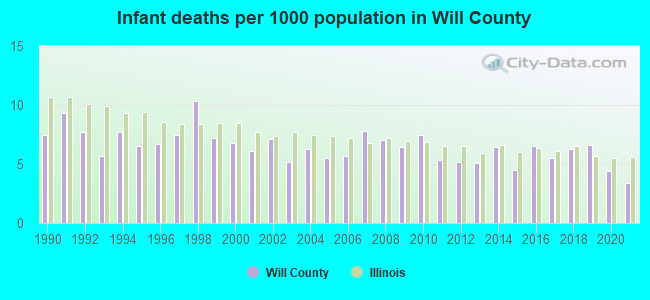
Infant deaths per 1000 live births from 1990 to 1999: 7.6
Infant deaths per 1000 live births from 2000 to 2009: 6.4
Infant deaths per 1000 live births from 2010 to 2021: 5.6
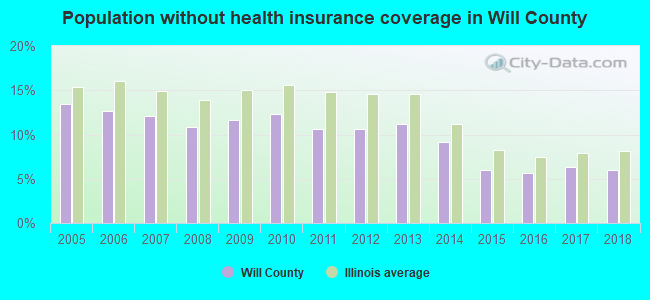
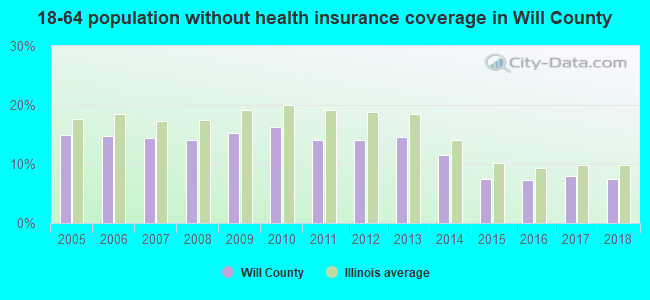
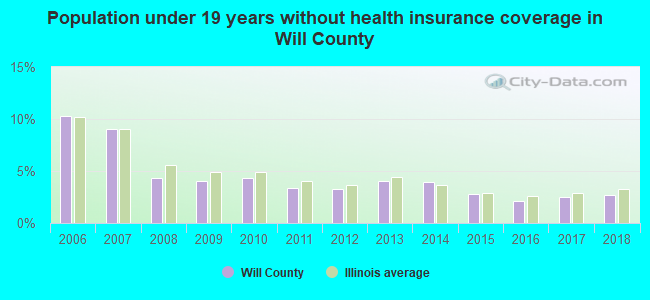
Persons under 19 years old without health insurance coverage in 2018: 2.7%
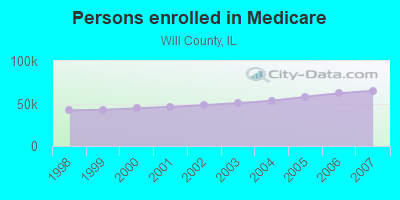
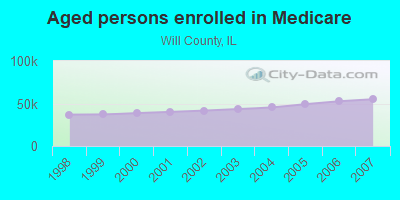
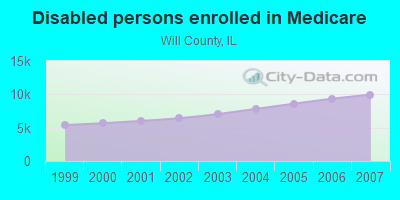
Persons enrolled in hospital insurance and/or supplemental medical insurance (Medicare) in July 1, 2007: 64,981 (55,012 aged, 9,969 disabled)
Children under 18 without health insurance coverage in 2007: 13,738 (7%)
Most common underlying causes of death in Will County, Illinois in 1999 - 2019:
- Atherosclerotic heart disease (6,277)
- Bronchus or lung, unspecified - Malignant neoplasms (5,493)
- Acute myocardial infarction, unspecified (5,135)
- Unspecified dementia (3,044)
- Chronic obstructive pulmonary disease, unspecified (2,820)
- Congestive heart failure (2,262)
- Stroke, not specified as haemorrhage or infarction (1,940)
- Alzheimer disease, unspecified (1,851)
- Breast, unspecified - Malignant neoplasms (1,482)
- Colon, unspecified - Malignant neoplasms (1,449)
Population without health insurance coverage in 2000: 11%
Children under 18 without health insurance coverage in 2000: 8%
Short term general hospital admissions per 100,000 population in 2004: 6,404
Short term general hospital beds per 100,000 population in 2004: 112
Emergency room visits per 100,000 population in 2004: 16,330
General practice office based MDs per 100,000 population in 2005: 1,478
Medical specialist MDs per 100,000 population in 2005: 544
Dentists per 100,000 population in 1998: 10
Total births per 100,000 population, July 2005 - July 2006 : 36
Total deaths per 100,000 population, July 2005 - July 2006: 72
Limited-service eating places per 100,000 population in 2005 : 12
Beer, wine & liquor stores per 100,000 population in 2005: 1
Homicides per 1,000,000 population from 2000 to 2006: 34.7. This is less than state average.
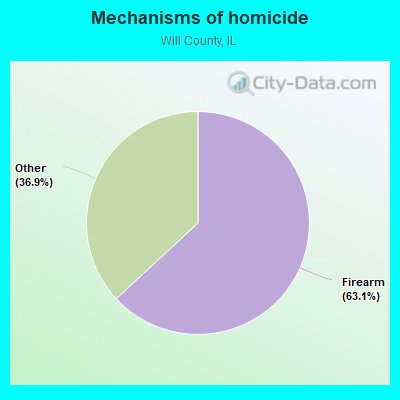
- Firearm - 21.9
- Other - 12.8
Suicides per 1,000,000 population from 2000 to 2006: 85.9. This is more than state average.
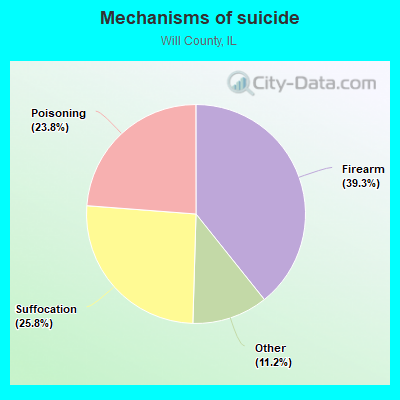
- Firearm - 33.7
- Suffocation - 22.1
- Poisoning - 20.4
- Other - 9.6
Household type by relationship:
Households: 696,757- Male householders: 120,748 (22,814 living alone), Female householders: 123,440 (27,977 living alone)
140,414 spouses (139,804 opposite-sex spouses), 15,804 unmarried partners, (15,611 opposite-sex unmarried partners), 233,608 children (218,679 natural, 5,274 adopted, 9,655 stepchildren), 15,011 grandchildren, 6,306 brothers or sisters, 11,413 parents, 48 foster children, 8,961 other relatives, 12,920 non-relatives
- In group quarters: 8,084
Size of family households: 69,912 2-persons, 41,727 3-persons, 42,543 4-persons, 16,320 5-persons, 6,814 6-persons, 4,045 7-or-more-persons.
Size of nonfamily households: 50,791 1-person, 10,317 2-persons, 1,170 3-persons, 483 4-persons, 66 5-persons.
115,574 married couples with children.
31,456 single-parent households (8,146 men, 23,310 women).
77.0% of residents of Will speak English at home.
13.1% of residents speak Spanish at home (61% speak English very well, 22% speak English well, 12% speak English not well, 5% don't speak English at all).
5.3% of residents speak other Indo-European language at home (71% speak English very well, 19% speak English well, 7% speak English not well, 2% don't speak English at all).
3.1% of residents speak Asian or Pacific Island language at home (71% speak English very well, 19% speak English well, 6% speak English not well, 4% don't speak English at all).
1.5% of residents speak other language at home (84% speak English very well, 13% speak English well, 2% speak English not well).
In fiscal year 2004:
Federal Government expenditure: $1,452,389,000 ($2,366 per capita)
Department of Defense expenditure: $37,577,000
Federal direct payments to individuals for retirement and disability: $842,289,000
Federal other direct payments to individuals: $328,179,000
Federal direct payments not to individuals: $10,455,000
Federal grants: $173,491,000
Federal procurement contracts: $31,051,000 ($13,730,000 Department of Defense)
Federal salaries and wages: $66,923,000 ($7,556,000 Department of Defense)
Federal Government direct loans: $24,689,000
Federal guaranteed/insured loans: $869,688,000
Federal Government insurance: $274,423,000
Population change from April 1, 2000 to July 1, 2005:
Births: 47,311| Here: | 74 per 1000 residents |
| State: | 75 per 1000 residents |
Deaths: 16,678
| Here: | 26 per 1000 residents |
| State: | 43 per 1000 residents |
Net international migration: +6,225
| Here: | +10 per 1000 residents |
| State: | +26 per 1000 residents |
Net internal migration: +104,017
| Here: | |
| State: |
Total withdrawal of fresh water for public supply: 41.57 millions of gallons per day (98% from ground, 2% from surface)
| Here: | 7.0 |
| State: | 6.4 |
| Here: | 4.4 |
| State: | 4.1 |
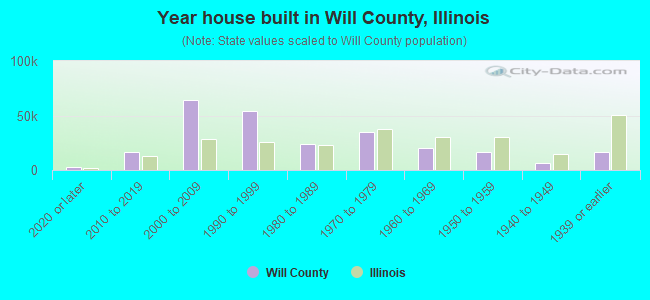
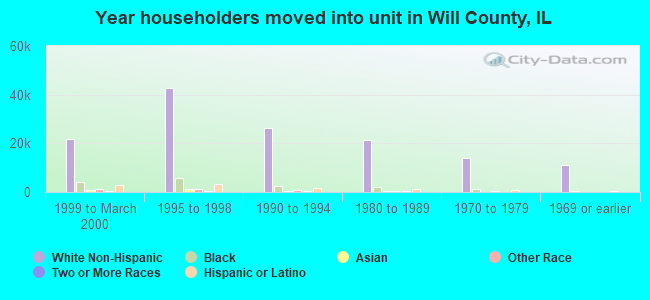
- Year house built in Will County, Illinois
- 2,5342020 or later
- 16,6532010 to 2019
- 64,0282000 to 2009
- 53,8611990 to 1999
- 24,1491980 to 1989
- 34,4551970 to 1979
- 19,7281960 to 1969
- 16,1551950 to 1959
- 6,3001940 to 1949
- 16,7221939 or earlier
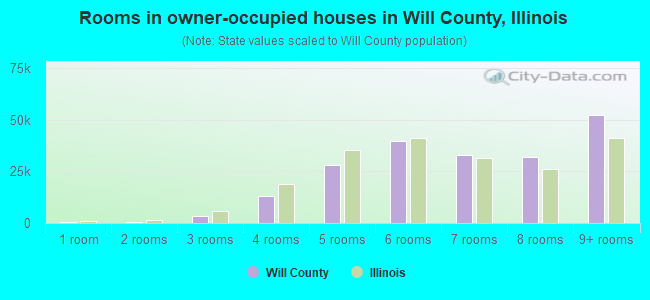
- Rooms in owner-occupied houses in Will County, Illinois
- 2441 room
- 6742 rooms
- 3,2593 rooms
- 13,0204 rooms
- 28,3175 rooms
- 39,5906 rooms
- 32,8257 rooms
- 32,0308 rooms
- 52,2989+ rooms
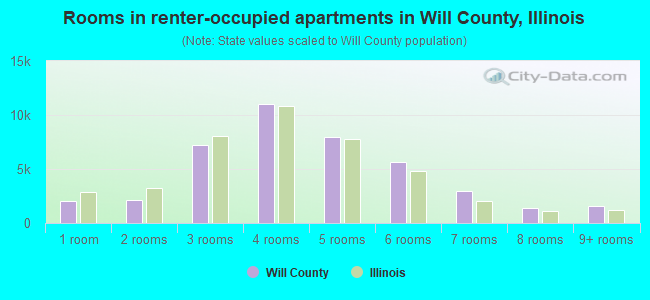
- Rooms in renter-occupied apartments in Will County, Illinois
- 2,0721 room
- 2,0962 rooms
- 7,2543 rooms
- 10,9764 rooms
- 7,9965 rooms
- 5,6626 rooms
- 2,9517 rooms
- 1,3838 rooms
- 1,5419+ rooms
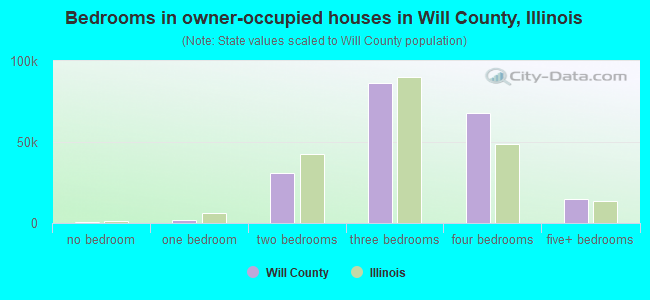
- Bedrooms in owner-occupied houses in Will County, Illinois
- 430no bedroom
- 1,6341 bedroom
- 30,6492 bedrooms
- 86,2783 bedrooms
- 68,1494 bedrooms
- 15,1175+ bedrooms
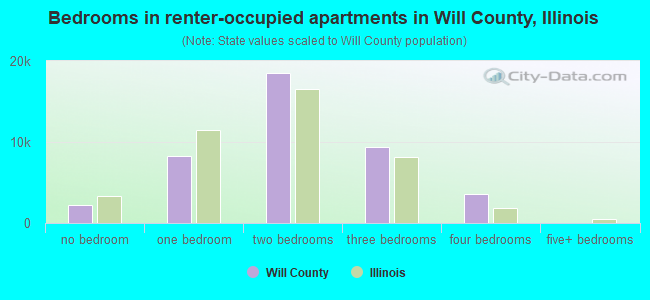
- Bedrooms in renter-occupied apartments in Will County, Illinois
- 2,167no bedroom
- 8,2531 bedroom
- 18,5552 bedrooms
- 9,3973 bedrooms
- 3,5314 bedrooms
- 285+ bedrooms
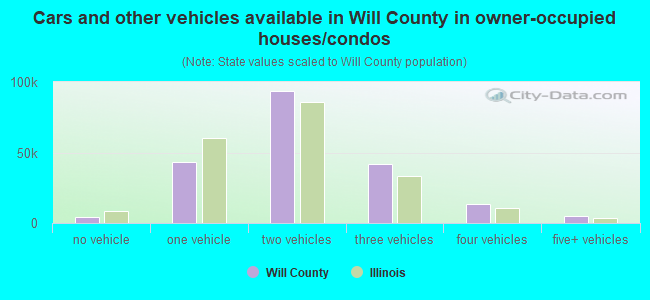
- Cars and other vehicles available in Will County in owner-occupied houses/condos
- 4,098no vehicle
- 43,3741 vehicle
- 93,9152 vehicles
- 41,7253 vehicles
- 13,8274 vehicles
- 5,3185+ vehicles
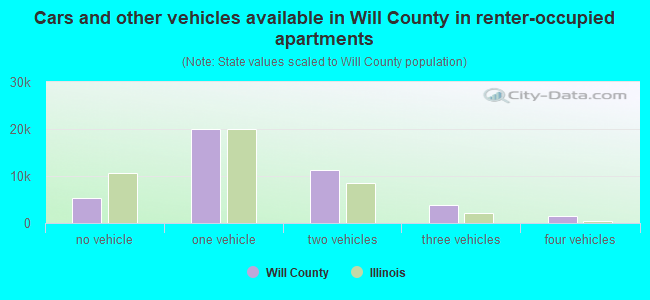
- Cars and other vehicles available in Will County in renter-occupied apartments
- 5,247no vehicle
- 20,0271 vehicle
- 11,3362 vehicles
- 3,8423 vehicles
- 1,4234 vehicles
- 565+ vehicles
92.0% of Will County residents lived in the same house 1 years ago.
Out of people who lived in different houses, 33% lived in this county.
Out of people who lived in different counties, 74% lived in Illinois.
| Will County: | 92.0% |
| State average: | 88.3% |
Place of birth for U.S.-born residents:
- This state: 497,134
- Other state: 94,581
- Northeast: 11,564
- Midwest: 37,991
- South: 27,180
- West: 17,846
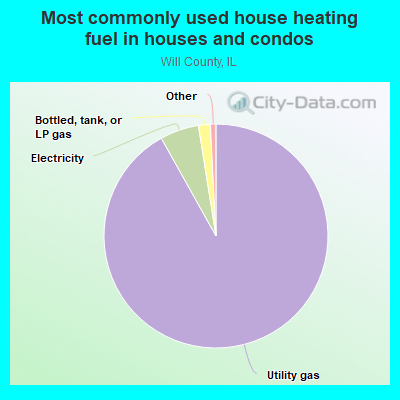
- 91.9%Utility gas
- 5.6%Electricity
- 1.7%Bottled, tank, or LP gas
- 0.3%Other fuel
- 0.2%No fuel used
- 0.1%Wood
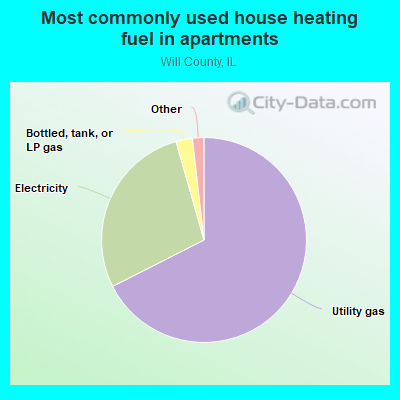
- 67.6%Utility gas
- 28.1%Electricity
- 2.6%Bottled, tank, or LP gas
- 0.8%Other fuel
- 0.6%No fuel used
- 0.2%Wood
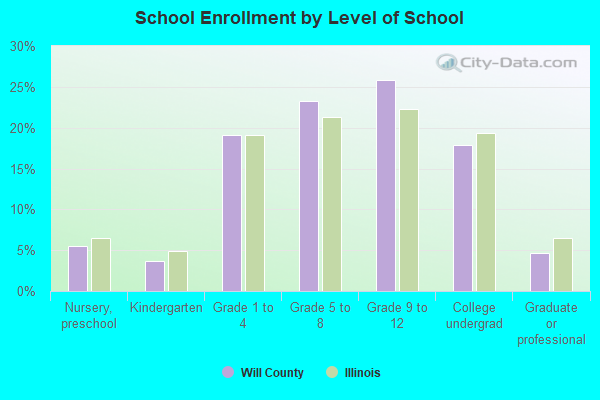
Private vs. public school enrollment:
| Here: | 10.9% |
| Illinois: | 13.3% |
| Here: | 6.9% |
| Illinois: | 9.9% |
| Here: | 23.7% |
| Illinois: | 27.4% |

Will County government finances - Expenditure in 2018:
- Bond Funds - Cash and Securities: $52,865,000
- Charges - Other: $65,929,000
Other: $59,932,000
Solid Waste Management: $1,602,000
Solid Waste Management: $1,533,000
Natural Resources - Other: $1,234,000
Parking Facilities: $470,000
Regular Highways: $468,000
Parking Facilities: $399,000
Parks and Recreation: $194,000
Parks and Recreation: $176,000
Regular Highways: $85,000
- Construction - Regular Highways: $17,026,000
Regular Highways: $10,968,000
Natural Resources - Other: $5,615,000
Natural Resources - Other: $4,788,000
Police Protection: $2,811,000
Central Staff Services: $1,109,000
Central Staff Services: $602,000
General - Other: $594,000
Health - Other: $351,000
Health - Other: $144,000
Police Protection: $16,000
Judicial and Legal Services: $10,000
- Current Operations - Police Protection: $68,915,000
Police Protection: $61,994,000
Health - Other: $59,413,000
Health - Other: $57,130,000
Judicial and Legal Services: $52,740,000
Judicial and Legal Services: $51,294,000
Correctional Institutions: $35,512,000
Correctional Institutions: $34,550,000
Central Staff Services: $25,972,000
Central Staff Services: $23,638,000
Regular Highways: $16,773,000
General - Other: $16,515,000
Regular Highways: $14,176,000
General - Other: $13,659,000
General Public Buildings: $12,018,000
General Public Buildings: $11,364,000
Natural Resources - Other: $11,098,000
Natural Resources - Other: $10,795,000
Financial Administration: $10,311,000
Financial Administration: $7,607,000
Parks and Recreation: $2,845,000
Parks and Recreation: $2,748,000
- Federal Intergovernmental - Public Welfare: $8,709,000
Health and Hospitals: $8,466,000
Public Welfare: $8,268,000
Health and Hospitals: $8,029,000
Other: $2,898,000
Housing and Community Development: $2,469,000
Housing and Community Development: $2,466,000
Other: $1,925,000
Highways: $320,000
Highways: $110,000
- General - Interest on Debt: $37,069,000
Interest on Debt: $21,032,000
- Local Intergovernmental - Other: $29,916,000
Other: $25,141,000
- Long Term Debt - Outstanding Unspecified Public Purpose: $780,198,000
Beginning Outstanding - Unspecified Public Purpose: $594,726,000
Beginning Outstanding - Unspecified Public Purpose: $473,465,000
Outstanding Unspecified Public Purpose: $444,024,000
Issue, Unspecified Public Purpose: $268,129,000
Beginning Outstanding - Public Debt for Private Purpose: $135,699,000
Outstanding Nonguaranteed - Industrial Revenue: $133,549,000
Beginning Outstanding - Public Debt for Private Purpose: $131,399,000
Outstanding Nonguaranteed - Industrial Revenue: $129,250,000
Retired Unspecified Public Purpose: $82,657,000
Retired Unspecified Public Purpose: $31,046,000
Retired Nonguaranteed - Public Debt for Private Purpose: $2,150,000
Retired Nonguaranteed - Public Debt for Private Purpose: $2,150,000
Issue, Unspecified Public Purpose: $1,605,000
- Miscellaneous - Interest Earnings: $11,797,000
General Revenue - Other: $9,581,000
General Revenue - Other: $4,078,000
Interest Earnings: $4,070,000
Fines and Forfeits: $3,168,000
Fines and Forfeits: $2,830,000
- Other Capital Outlay - General - Other: $83,291,000
Police Protection: $34,943,000
Public Welfare - Other: $15,092,000
Police Protection: $8,742,000
General - Other: $7,674,000
Regular Highways: $5,403,000
Regular Highways: $3,218,000
Natural Resources - Other: $3,060,000
Central Staff Services: $748,000
Central Staff Services: $496,000
Public Welfare - Other: $258,000
Correctional Institutions: $139,000
Correctional Institutions: $9,000
- Other Funds - Cash and Securities: $482,158,000
Cash and Securities: $465,003,000
- Sinking Funds - Cash and Securities: $133,549,000
Cash and Securities: $129,250,000
- State Intergovernmental - Highways: $39,265,000
Highways: $36,608,000
General Local Government Support: $20,548,000
General Local Government Support: $19,484,000
Health and Hospitals: $10,650,000
Other: $7,232,000
Other: $6,869,000
Health and Hospitals: $6,374,000
Public Welfare: $5,176,000
Public Welfare: $4,317,000
Housing and Community Development: $71,000
- Tax - Property: $199,300,000
Property: $193,589,000
Other License: $6,474,000
Other License: $3,563,000
Other Selective Sales: $108,000
Other Selective Sales: $16,000
- Total Salaries and Wages: $133,174,000
: $117,569,000
Will County government finances - Revenue in 2018:
- Bond Funds - Cash and Securities: $52,865,000
- Charges - Other: $65,929,000
Other: $59,932,000
Solid Waste Management: $1,602,000
Solid Waste Management: $1,533,000
Natural Resources - Other: $1,234,000
Parking Facilities: $470,000
Regular Highways: $468,000
Parking Facilities: $399,000
Parks and Recreation: $194,000
Parks and Recreation: $176,000
Regular Highways: $85,000
- Construction - Regular Highways: $17,026,000
Regular Highways: $10,968,000
Natural Resources - Other: $5,615,000
Natural Resources - Other: $4,788,000
Police Protection: $2,811,000
Central Staff Services: $1,109,000
Central Staff Services: $602,000
General - Other: $594,000
Health - Other: $351,000
Health - Other: $144,000
Police Protection: $16,000
Judicial and Legal Services: $10,000
- Current Operations - Police Protection: $68,915,000
Police Protection: $61,994,000
Health - Other: $59,413,000
Health - Other: $57,130,000
Judicial and Legal Services: $52,740,000
Judicial and Legal Services: $51,294,000
Correctional Institutions: $35,512,000
Correctional Institutions: $34,550,000
Central Staff Services: $25,972,000
Central Staff Services: $23,638,000
Regular Highways: $16,773,000
General - Other: $16,515,000
Regular Highways: $14,176,000
General - Other: $13,659,000
General Public Buildings: $12,018,000
General Public Buildings: $11,364,000
Natural Resources - Other: $11,098,000
Natural Resources - Other: $10,795,000
Financial Administration: $10,311,000
Financial Administration: $7,607,000
Parks and Recreation: $2,845,000
Parks and Recreation: $2,748,000
- Federal Intergovernmental - Public Welfare: $8,709,000
Health and Hospitals: $8,466,000
Public Welfare: $8,268,000
Health and Hospitals: $8,029,000
Other: $2,898,000
Housing and Community Development: $2,469,000
Housing and Community Development: $2,466,000
Other: $1,925,000
Highways: $320,000
Highways: $110,000
- General - Interest on Debt: $37,069,000
Interest on Debt: $21,032,000
- Local Intergovernmental - Other: $29,916,000
Other: $25,141,000
- Long Term Debt - Outstanding Unspecified Public Purpose: $780,198,000
Beginning Outstanding - Unspecified Public Purpose: $594,726,000
Beginning Outstanding - Unspecified Public Purpose: $473,465,000
Outstanding Unspecified Public Purpose: $444,024,000
Issue, Unspecified Public Purpose: $268,129,000
Beginning Outstanding - Public Debt for Private Purpose: $135,699,000
Outstanding Nonguaranteed - Industrial Revenue: $133,549,000
Beginning Outstanding - Public Debt for Private Purpose: $131,399,000
Outstanding Nonguaranteed - Industrial Revenue: $129,250,000
Retired Unspecified Public Purpose: $82,657,000
Retired Unspecified Public Purpose: $31,046,000
Retired Nonguaranteed - Public Debt for Private Purpose: $2,150,000
Retired Nonguaranteed - Public Debt for Private Purpose: $2,150,000
Issue, Unspecified Public Purpose: $1,605,000
- Miscellaneous - Interest Earnings: $11,797,000
General Revenue - Other: $9,581,000
General Revenue - Other: $4,078,000
Interest Earnings: $4,070,000
Fines and Forfeits: $3,168,000
Fines and Forfeits: $2,830,000
- Other Capital Outlay - General - Other: $83,291,000
Police Protection: $34,943,000
Public Welfare - Other: $15,092,000
Police Protection: $8,742,000
General - Other: $7,674,000
Regular Highways: $5,403,000
Regular Highways: $3,218,000
Natural Resources - Other: $3,060,000
Central Staff Services: $748,000
Central Staff Services: $496,000
Public Welfare - Other: $258,000
Correctional Institutions: $139,000
Correctional Institutions: $9,000
- Other Funds - Cash and Securities: $482,158,000
Cash and Securities: $465,003,000
- Sinking Funds - Cash and Securities: $133,549,000
Cash and Securities: $129,250,000
- State Intergovernmental - Highways: $39,265,000
Highways: $36,608,000
General Local Government Support: $20,548,000
General Local Government Support: $19,484,000
Health and Hospitals: $10,650,000
Other: $7,232,000
Other: $6,869,000
Health and Hospitals: $6,374,000
Public Welfare: $5,176,000
Public Welfare: $4,317,000
Housing and Community Development: $71,000
- Tax - Property: $199,300,000
Property: $193,589,000
Other License: $6,474,000
Other License: $3,563,000
Other Selective Sales: $108,000
Other Selective Sales: $16,000
- Total Salaries and Wages: $133,174,000
: $117,569,000
Will County government finances - Debt in 2018:
- Bond Funds - Cash and Securities: $52,865,000
- Charges - Other: $65,929,000
Other: $59,932,000
Solid Waste Management: $1,602,000
Solid Waste Management: $1,533,000
Natural Resources - Other: $1,234,000
Parking Facilities: $470,000
Regular Highways: $468,000
Parking Facilities: $399,000
Parks and Recreation: $194,000
Parks and Recreation: $176,000
Regular Highways: $85,000
- Construction - Regular Highways: $17,026,000
Regular Highways: $10,968,000
Natural Resources - Other: $5,615,000
Natural Resources - Other: $4,788,000
Police Protection: $2,811,000
Central Staff Services: $1,109,000
Central Staff Services: $602,000
General - Other: $594,000
Health - Other: $351,000
Health - Other: $144,000
Police Protection: $16,000
Judicial and Legal Services: $10,000
- Current Operations - Police Protection: $68,915,000
Police Protection: $61,994,000
Health - Other: $59,413,000
Health - Other: $57,130,000
Judicial and Legal Services: $52,740,000
Judicial and Legal Services: $51,294,000
Correctional Institutions: $35,512,000
Correctional Institutions: $34,550,000
Central Staff Services: $25,972,000
Central Staff Services: $23,638,000
Regular Highways: $16,773,000
General - Other: $16,515,000
Regular Highways: $14,176,000
General - Other: $13,659,000
General Public Buildings: $12,018,000
General Public Buildings: $11,364,000
Natural Resources - Other: $11,098,000
Natural Resources - Other: $10,795,000
Financial Administration: $10,311,000
Financial Administration: $7,607,000
Parks and Recreation: $2,845,000
Parks and Recreation: $2,748,000
- Federal Intergovernmental - Public Welfare: $8,709,000
Health and Hospitals: $8,466,000
Public Welfare: $8,268,000
Health and Hospitals: $8,029,000
Other: $2,898,000
Housing and Community Development: $2,469,000
Housing and Community Development: $2,466,000
Other: $1,925,000
Highways: $320,000
Highways: $110,000
- General - Interest on Debt: $37,069,000
Interest on Debt: $21,032,000
- Local Intergovernmental - Other: $29,916,000
Other: $25,141,000
- Long Term Debt - Outstanding Unspecified Public Purpose: $780,198,000
Beginning Outstanding - Unspecified Public Purpose: $594,726,000
Beginning Outstanding - Unspecified Public Purpose: $473,465,000
Outstanding Unspecified Public Purpose: $444,024,000
Issue, Unspecified Public Purpose: $268,129,000
Beginning Outstanding - Public Debt for Private Purpose: $135,699,000
Outstanding Nonguaranteed - Industrial Revenue: $133,549,000
Beginning Outstanding - Public Debt for Private Purpose: $131,399,000
Outstanding Nonguaranteed - Industrial Revenue: $129,250,000
Retired Unspecified Public Purpose: $82,657,000
Retired Unspecified Public Purpose: $31,046,000
Retired Nonguaranteed - Public Debt for Private Purpose: $2,150,000
Retired Nonguaranteed - Public Debt for Private Purpose: $2,150,000
Issue, Unspecified Public Purpose: $1,605,000
- Miscellaneous - Interest Earnings: $11,797,000
General Revenue - Other: $9,581,000
General Revenue - Other: $4,078,000
Interest Earnings: $4,070,000
Fines and Forfeits: $3,168,000
Fines and Forfeits: $2,830,000
- Other Capital Outlay - General - Other: $83,291,000
Police Protection: $34,943,000
Public Welfare - Other: $15,092,000
Police Protection: $8,742,000
General - Other: $7,674,000
Regular Highways: $5,403,000
Regular Highways: $3,218,000
Natural Resources - Other: $3,060,000
Central Staff Services: $748,000
Central Staff Services: $496,000
Public Welfare - Other: $258,000
Correctional Institutions: $139,000
Correctional Institutions: $9,000
- Other Funds - Cash and Securities: $482,158,000
Cash and Securities: $465,003,000
- Sinking Funds - Cash and Securities: $133,549,000
Cash and Securities: $129,250,000
- State Intergovernmental - Highways: $39,265,000
Highways: $36,608,000
General Local Government Support: $20,548,000
General Local Government Support: $19,484,000
Health and Hospitals: $10,650,000
Other: $7,232,000
Other: $6,869,000
Health and Hospitals: $6,374,000
Public Welfare: $5,176,000
Public Welfare: $4,317,000
Housing and Community Development: $71,000
- Tax - Property: $199,300,000
Property: $193,589,000
Other License: $6,474,000
Other License: $3,563,000
Other Selective Sales: $108,000
Other Selective Sales: $16,000
- Total Salaries and Wages: $133,174,000
: $117,569,000
Will County government finances - Cash and Securities in 2018:
- Bond Funds - Cash and Securities: $52,865,000
- Charges - Other: $65,929,000
Other: $59,932,000
Solid Waste Management: $1,602,000
Solid Waste Management: $1,533,000
Natural Resources - Other: $1,234,000
Parking Facilities: $470,000
Regular Highways: $468,000
Parking Facilities: $399,000
Parks and Recreation: $194,000
Parks and Recreation: $176,000
Regular Highways: $85,000
- Construction - Regular Highways: $17,026,000
Regular Highways: $10,968,000
Natural Resources - Other: $5,615,000
Natural Resources - Other: $4,788,000
Police Protection: $2,811,000
Central Staff Services: $1,109,000
Central Staff Services: $602,000
General - Other: $594,000
Health - Other: $351,000
Health - Other: $144,000
Police Protection: $16,000
Judicial and Legal Services: $10,000
- Current Operations - Police Protection: $68,915,000
Police Protection: $61,994,000
Health - Other: $59,413,000
Health - Other: $57,130,000
Judicial and Legal Services: $52,740,000
Judicial and Legal Services: $51,294,000
Correctional Institutions: $35,512,000
Correctional Institutions: $34,550,000
Central Staff Services: $25,972,000
Central Staff Services: $23,638,000
Regular Highways: $16,773,000
General - Other: $16,515,000
Regular Highways: $14,176,000
General - Other: $13,659,000
General Public Buildings: $12,018,000
General Public Buildings: $11,364,000
Natural Resources - Other: $11,098,000
Natural Resources - Other: $10,795,000
Financial Administration: $10,311,000
Financial Administration: $7,607,000
Parks and Recreation: $2,845,000
Parks and Recreation: $2,748,000
- Federal Intergovernmental - Public Welfare: $8,709,000
Health and Hospitals: $8,466,000
Public Welfare: $8,268,000
Health and Hospitals: $8,029,000
Other: $2,898,000
Housing and Community Development: $2,469,000
Housing and Community Development: $2,466,000
Other: $1,925,000
Highways: $320,000
Highways: $110,000
- General - Interest on Debt: $37,069,000
Interest on Debt: $21,032,000
- Local Intergovernmental - Other: $29,916,000
Other: $25,141,000
- Long Term Debt - Outstanding Unspecified Public Purpose: $780,198,000
Beginning Outstanding - Unspecified Public Purpose: $594,726,000
Beginning Outstanding - Unspecified Public Purpose: $473,465,000
Outstanding Unspecified Public Purpose: $444,024,000
Issue, Unspecified Public Purpose: $268,129,000
Beginning Outstanding - Public Debt for Private Purpose: $135,699,000
Outstanding Nonguaranteed - Industrial Revenue: $133,549,000
Beginning Outstanding - Public Debt for Private Purpose: $131,399,000
Outstanding Nonguaranteed - Industrial Revenue: $129,250,000
Retired Unspecified Public Purpose: $82,657,000
Retired Unspecified Public Purpose: $31,046,000
Retired Nonguaranteed - Public Debt for Private Purpose: $2,150,000
Retired Nonguaranteed - Public Debt for Private Purpose: $2,150,000
Issue, Unspecified Public Purpose: $1,605,000
- Miscellaneous - Interest Earnings: $11,797,000
General Revenue - Other: $9,581,000
General Revenue - Other: $4,078,000
Interest Earnings: $4,070,000
Fines and Forfeits: $3,168,000
Fines and Forfeits: $2,830,000
- Other Capital Outlay - General - Other: $83,291,000
Police Protection: $34,943,000
Public Welfare - Other: $15,092,000
Police Protection: $8,742,000
General - Other: $7,674,000
Regular Highways: $5,403,000
Regular Highways: $3,218,000
Natural Resources - Other: $3,060,000
Central Staff Services: $748,000
Central Staff Services: $496,000
Public Welfare - Other: $258,000
Correctional Institutions: $139,000
Correctional Institutions: $9,000
- Other Funds - Cash and Securities: $482,158,000
Cash and Securities: $465,003,000
- Sinking Funds - Cash and Securities: $133,549,000
Cash and Securities: $129,250,000
- State Intergovernmental - Highways: $39,265,000
Highways: $36,608,000
General Local Government Support: $20,548,000
General Local Government Support: $19,484,000
Health and Hospitals: $10,650,000
Other: $7,232,000
Other: $6,869,000
Health and Hospitals: $6,374,000
Public Welfare: $5,176,000
Public Welfare: $4,317,000
Housing and Community Development: $71,000
- Tax - Property: $199,300,000
Property: $193,589,000
Other License: $6,474,000
Other License: $3,563,000
Other Selective Sales: $108,000
Other Selective Sales: $16,000
- Total Salaries and Wages: $133,174,000
: $117,569,000
Supplemental Security Income (SSI) in 2006:
- Total number of recipients: 5,674
- Number of aged recipients: 719
- Number of blind and disabled recipients: 4,955
- Number of recipients under 18: 1,206
- Number of recipients between 18 and 64: 3,342
- Number of recipients older than 64: 1,126
- Number of recipients also receiving OASDI: 1,399
- Amount of payments (thousands of dollars): 2,773
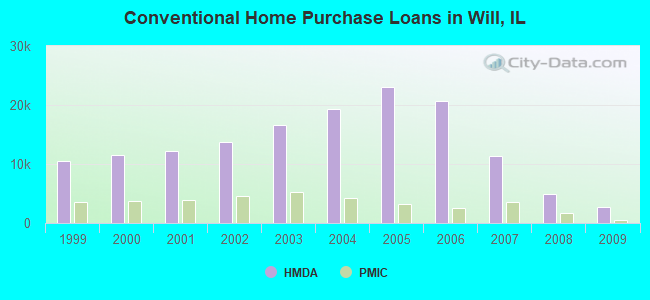
| Home Mortgage Disclosure Act Aggregated Statistics For Year 2009 (Based on 82 full tracts) | ||||||||||||||
| A) FHA, FSA/RHS & VA Home Purchase Loans | B) Conventional Home Purchase Loans | C) Refinancings | D) Home Improvement Loans | E) Loans on Dwellings For 5+ Families | F) Non-occupant Loans on < 5 Family Dwellings (A B C & D) | G) Loans On Manufactured Home Dwelling (A B C & D) | ||||||||
|---|---|---|---|---|---|---|---|---|---|---|---|---|---|---|
| Number | Average Value | Number | Average Value | Number | Average Value | Number | Average Value | Number | Average Value | Number | Average Value | Number | Average Value | |
| LOANS ORIGINATED | 3,027 | $184,174 | 2,788 | $208,488 | 22,763 | $212,385 | 561 | $105,237 | 19 | $1,847,789 | 687 | $141,879 | 85 | $157,882 |
| APPLICATIONS APPROVED, NOT ACCEPTED | 203 | $177,182 | 231 | $228,723 | 1,936 | $218,185 | 83 | $61,253 | 7 | $380,429 | 55 | $155,873 | 2 | $235,500 |
| APPLICATIONS DENIED | 533 | $186,486 | 470 | $187,787 | 5,987 | $219,981 | 415 | $52,328 | 3 | $214,000 | 231 | $132,450 | 33 | $71,485 |
| APPLICATIONS WITHDRAWN | 292 | $177,390 | 244 | $198,578 | 3,316 | $212,999 | 80 | $116,950 | 1 | $405,000 | 91 | $150,670 | 4 | $73,250 |
| FILES CLOSED FOR INCOMPLETENESS | 133 | $179,150 | 94 | $193,319 | 1,424 | $213,387 | 52 | $134,077 | 0 | $0 | 35 | $156,514 | 1 | $80,000 |
| Private Mortgage Insurance Companies Aggregated Statistics For Year 2009 (Based on 78 full tracts) | ||||||||
| A) Conventional Home Purchase Loans | B) Refinancings | C) Non-occupant Loans on < 5 Family Dwellings (A & B) | D) Loans On Manufactured Home Dwelling (A & B) | |||||
|---|---|---|---|---|---|---|---|---|
| Number | Average Value | Number | Average Value | Number | Average Value | Number | Average Value | |
| LOANS ORIGINATED | 512 | $219,219 | 455 | $246,488 | 4 | $159,000 | 0 | $0 |
| APPLICATIONS APPROVED, NOT ACCEPTED | 188 | $212,910 | 271 | $239,878 | 11 | $124,000 | 1 | $152,000 |
| APPLICATIONS DENIED | 109 | $199,954 | 178 | $242,410 | 2 | $173,000 | 0 | $0 |
| APPLICATIONS WITHDRAWN | 35 | $197,429 | 69 | $237,304 | 2 | $151,500 | 0 | $0 |
| FILES CLOSED FOR INCOMPLETENESS | 18 | $296,167 | 33 | $232,364 | 2 | $213,000 | 0 | $0 |
| Most common first names in Will County, IL among deceased individuals | ||
| Name | Count | Lived (average) |
|---|---|---|
| John | 2,445 | 74.4 years |
| Mary | 2,412 | 79.7 years |
| William | 1,615 | 73.5 years |
| Robert | 1,496 | 69.8 years |
| Joseph | 1,469 | 75.1 years |
| James | 1,304 | 70.3 years |
| Helen | 1,079 | 80.5 years |
| George | 1,076 | 75.7 years |
| Frank | 992 | 77.2 years |
| Charles | 984 | 73.3 years |
| Most common last names in Will County, IL among deceased individuals | ||
| Last name | Count | Lived (average) |
|---|---|---|
| Johnson | 638 | 76.7 years |
| Smith | 545 | 75.0 years |
| Anderson | 359 | 76.8 years |
| Brown | 300 | 72.6 years |
| Jones | 283 | 74.0 years |
| Williams | 274 | 69.6 years |
| Miller | 266 | 75.0 years |
| Davis | 222 | 73.7 years |
| Nelson | 176 | 74.5 years |
| Wilson | 170 | 72.9 years |
| Businesses in Will County, IL | ||||
| Name | Count | Name | Count | |
|---|---|---|---|---|
| 7-Eleven | 21 | Knights Inn | 1 | |
| ALDI | 8 | Kohl's | 7 | |
| AMF Bowling | 1 | Kroger | 3 | |
| AT&T | 9 | LA Fitness | 3 | |
| Ace Hardware | 15 | La Quinta | 2 | |
| Advance Auto Parts | 8 | La-Z-Boy | 3 | |
| Aeropostale | 2 | Lane Bryant | 3 | |
| AmericInn | 1 | Lane Furniture | 6 | |
| American Eagle Outfitters | 2 | LensCrafters | 3 | |
| Ann Taylor | 1 | Little Caesars Pizza | 3 | |
| Applebee's | 4 | Long John Silver's | 4 | |
| Arby's | 4 | Lowe's | 2 | |
| Ashley Furniture | 2 | Macy's | 2 | |
| AutoZone | 9 | Marriott | 3 | |
| Avenue | 1 | Marshalls | 2 | |
| BMW | 1 | MasterBrand Cabinets | 24 | |
| Bakers | 1 | Maurices | 2 | |
| Bakers Square | 1 | Mazda | 1 | |
| Bally Total Fitness | 1 | McDonald's | 35 | |
| Barnes & Noble | 2 | Meijer | 3 | |
| Baskin-Robbins | 17 | Men's Wearhouse | 4 | |
| Bath & Body Works | 3 | Menards | 5 | |
| Bed Bath & Beyond | 3 | Motel 6 | 2 | |
| Best Western | 3 | Motherhood Maternity | 3 | |
| Blockbuster | 8 | New Balance | 3 | |
| Brookstone | 1 | New York & Co | 2 | |
| Brunswick Bowling & Billiards | 1 | Nike | 36 | |
| Buffalo Wild Wings | 4 | Nissan | 2 | |
| Burger King | 19 | Office Depot | 1 | |
| CVS | 14 | OfficeMax | 7 | |
| Caribou Coffee | 1 | Old Country Buffet | 1 | |
| Carson Pirie Scott | 2 | Old Navy | 2 | |
| Casual Male XL | 2 | Olive Garden | 2 | |
| Catherines | 2 | Outback | 1 | |
| Charlotte Russe | 2 | Outback Steakhouse | 1 | |
| Chevrolet | 7 | Pac Sun | 2 | |
| Chipotle | 2 | Panda Express | 8 | |
| Chuck E. Cheese's | 2 | Panera Bread | 6 | |
| Church's Chicken | 1 | Papa John's Pizza | 3 | |
| Circle K | 12 | Payless | 9 | |
| Cold Stone Creamery | 4 | Penske | 7 | |
| Coldwater Creek | 1 | PetSmart | 5 | |
| ColorTyme | 2 | Pier 1 Imports | 2 | |
| Comfort Inn | 3 | Pizza Hut | 10 | |
| Costco | 2 | Plato's Closet | 1 | |
| Cracker Barrel | 3 | Popeyes | 3 | |
| Cricket Wireless | 17 | Quiznos | 7 | |
| Curves | 12 | RadioShack | 9 | |
| DHL | 5 | Ramada | 2 | |
| Dairy Queen | 12 | Red Lobster | 3 | |
| Decora Cabinetry | 2 | Red Robin | 2 | |
| Dennys | 3 | Red Roof Inn | 2 | |
| Discount Tire | 7 | Ryder Rental & Truck Leasing | 1 | |
| Domino's Pizza | 3 | SONIC Drive-In | 2 | |
| Dunkin Donuts | 32 | Safeway | 6 | |
| Eddie Bauer | 1 | Sam's Club | 2 | |
| Express | 2 | Sears | 7 | |
| Extended Stay America | 1 | Sephora | 2 | |
| Famous Footwear | 4 | Shoe Carnival | 1 | |
| Fashion Bug | 3 | Spencer Gifts | 1 | |
| FedEx | 91 | Sprint Nextel | 19 | |
| Finish Line | 2 | Staples | 4 | |
| Firestone Complete Auto Care | 8 | Starbucks | 26 | |
| Foot Locker | 3 | Steak 'n Shake | 4 | |
| Ford | 6 | Subaru | 1 | |
| Forever 21 | 1 | Subway | 48 | |
| GNC | 9 | Super 8 | 5 | |
| GameStop | 13 | T-Mobile | 25 | |
| Goodwill | 4 | T.G.I. Driday's | 3 | |
| Gymboree | 1 | T.J.Maxx | 1 | |
| H&M | 1 | Taco Bell | 17 | |
| H&R Block | 20 | Target | 8 | |
| Hilton | 4 | The Athlete's Foot | 2 | |
| Hobby Lobby | 2 | The Room Place | 3 | |
| Holiday Inn | 4 | Torrid | 1 | |
| Hollister Co. | 1 | Toyota | 3 | |
| Home Depot | 6 | Toys"R"Us | 3 | |
| Honda | 2 | True Value | 2 | |
| Hot Topic | 1 | U-Haul | 33 | |
| Hyundai | 2 | U.S. Cellular | 12 | |
| IHOP | 3 | UPS | 109 | |
| IKEA | 1 | Value City Furniture | 1 | |
| J. Jill | 1 | Vans | 4 | |
| JCPenney | 3 | Verizon Wireless | 6 | |
| Jewel-Osco | 14 | Victoria's Secret | 3 | |
| Jimmy John's | 2 | Volkswagen | 1 | |
| JoS. A. Bank | 1 | Vons | 6 | |
| Johnny Rockets | 1 | Walgreens | 25 | |
| Jones New York | 5 | Walmart | 8 | |
| Journeys | 2 | Wendy's | 14 | |
| Just Tires | 3 | Wet Seal | 1 | |
| Justice | 2 | White Castle | 8 | |
| KFC | 14 | Wingate | 1 | |
| Kincaid | 3 | YMCA | 6 | |
| Kmart | 3 | |||
Will County on our top lists:
- #7 on the list of "Top 101 counties with the lowest percentage of residents relocating from foreign countries between 2010 and 2011"
- #10 on the list of "Top 101 counties with the highest percentage of residents that drank alcohol in the past 30 days"
- #18 on the list of "Top 101 counties with the lowest percentage of residents relocating from foreign countries between 2010 and 2011 (pop. 50,000+)"
- #18 on the list of "Top 101 counties with the largest increase in the number of infant deaths per 1000 residents 2000-2006 to 2007-2013 (pop. 50,000+)"
- #19 on the list of "Top 101 counties with the largest decrease in the number of births per 1000 residents 2000-2006 to 2007-2013 (pop 50,000+)"
- #48 on the list of "Top 101 counties with the lowest surface withdrawal of fresh water for public supply (pop. 50,000+)"
- #57 on the list of "Top 101 counties with the highest ground withdrawal of fresh water for public supply"
- #57 on the list of "Top 101 counties with the highest ground withdrawal of fresh water for public supply (pop. 50,000+)"
- #63 on the list of "Top 101 counties with the most Catholic adherents"
- #63 on the list of "Top 101 counties with the most Catholic adherents (pop. 50,000+)"
- #69 on the list of "Top 101 counties with the lowest number of deaths per 1000 residents 2007-2013 (pop. 50,000+)"
- #72 on the list of "Top 101 counties with the lowest percentage of residents relocating to foreign countries in 2011"
- #76 on the list of "Top 101 counties with the lowest percentage of residents that smoked 100+ cigarettes in their lives"
- #77 on the list of "Top 101 counties with the lowest percentage of residents relocating to foreign countries in 2011 (pop. 50,000+)"
- #77 on the list of "Top 101 counties with the largest number of children under 18 without health insurance coverage in 2000 (pop. 50,000+)"
- #81 on the list of "Top 101 counties with the highest Particulate Matter (PM2.5) Annual air pollution readings in 2012 (µg/m3)"
- #84 on the list of "Top 101 counties with the highest number of infant deaths per 1000 residents 2007-2013 (pop. 50,000+)"
- #90 on the list of "Top 101 counties with the highest percentage of residents that exercised in the past month"
- #94 on the list of "Top 101 counties with the most Catholic congregations (pop. 50,000+)"
- #96 on the list of "Top 101 counties with the most Catholic congregations"