Lockport, Illinois Submit your own pictures of this city and show them to the world
OSM Map
General Map
Google Map
MSN Map
OSM Map
General Map
Google Map
MSN Map
OSM Map
General Map
Google Map
MSN Map
OSM Map
General Map
Google Map
MSN Map
Please wait while loading the map...
Population in 2022: 26,105 (100% urban, 0% rural). Population change since 2000: +71.8%Males: 12,786 Females: 13,319
March 2022 cost of living index in Lockport: 100.9 (near average, U.S. average is 100) Percentage of residents living in poverty in 2022: 6.3%for White Non-Hispanic residents , 20.8% for Black residents , 15.7% for Hispanic or Latino residents , 29.3% for other race residents , 16.0% for two or more races residents )
Profiles of local businesses
Business Search - 14 Million verified businesses
Data:
Median household income ($)
Median household income (% change since 2000)
Household income diversity
Ratio of average income to average house value (%)
Ratio of average income to average rent
Median household income ($) - White
Median household income ($) - Black or African American
Median household income ($) - Asian
Median household income ($) - Hispanic or Latino
Median household income ($) - American Indian and Alaska Native
Median household income ($) - Multirace
Median household income ($) - Other Race
Median household income for houses/condos with a mortgage ($)
Median household income for apartments without a mortgage ($)
Races - White alone (%)
Races - White alone (% change since 2000)
Races - Black alone (%)
Races - Black alone (% change since 2000)
Races - American Indian alone (%)
Races - American Indian alone (% change since 2000)
Races - Asian alone (%)
Races - Asian alone (% change since 2000)
Races - Hispanic (%)
Races - Hispanic (% change since 2000)
Races - Native Hawaiian and Other Pacific Islander alone (%)
Races - Native Hawaiian and Other Pacific Islander alone (% change since 2000)
Races - Two or more races (%)
Races - Two or more races (% change since 2000)
Races - Other race alone (%)
Races - Other race alone (% change since 2000)
Racial diversity
Unemployment (%)
Unemployment (% change since 2000)
Unemployment (%) - White
Unemployment (%) - Black or African American
Unemployment (%) - Asian
Unemployment (%) - Hispanic or Latino
Unemployment (%) - American Indian and Alaska Native
Unemployment (%) - Multirace
Unemployment (%) - Other Race
Population density (people per square mile)
Population - Males (%)
Population - Females (%)
Population - Males (%) - White
Population - Males (%) - Black or African American
Population - Males (%) - Asian
Population - Males (%) - Hispanic or Latino
Population - Males (%) - American Indian and Alaska Native
Population - Males (%) - Multirace
Population - Males (%) - Other Race
Population - Females (%) - White
Population - Females (%) - Black or African American
Population - Females (%) - Asian
Population - Females (%) - Hispanic or Latino
Population - Females (%) - American Indian and Alaska Native
Population - Females (%) - Multirace
Population - Females (%) - Other Race
Coronavirus confirmed cases (Apr 28, 2024)
Deaths caused by coronavirus (Apr 28, 2024)
Coronavirus confirmed cases (per 100k population) (Apr 28, 2024)
Deaths caused by coronavirus (per 100k population) (Apr 28, 2024)
Daily increase in number of cases (Apr 28, 2024)
Weekly increase in number of cases (Apr 28, 2024)
Cases doubled (in days) (Apr 28, 2024)
Hospitalized patients (Apr 18, 2022)
Negative test results (Apr 18, 2022)
Total test results (Apr 18, 2022)
COVID Vaccine doses distributed (per 100k population) (Sep 19, 2023)
COVID Vaccine doses administered (per 100k population) (Sep 19, 2023)
COVID Vaccine doses distributed (Sep 19, 2023)
COVID Vaccine doses administered (Sep 19, 2023)
Likely homosexual households (%)
Likely homosexual households (% change since 2000)
Likely homosexual households - Lesbian couples (%)
Likely homosexual households - Lesbian couples (% change since 2000)
Likely homosexual households - Gay men (%)
Likely homosexual households - Gay men (% change since 2000)
Cost of living index
Median gross rent ($)
Median contract rent ($)
Median monthly housing costs ($)
Median house or condo value ($)
Median house or condo value ($ change since 2000)
Mean house or condo value by units in structure - 1, detached ($)
Mean house or condo value by units in structure - 1, attached ($)
Mean house or condo value by units in structure - 2 ($)
Mean house or condo value by units in structure by units in structure - 3 or 4 ($)
Mean house or condo value by units in structure - 5 or more ($)
Mean house or condo value by units in structure - Boat, RV, van, etc. ($)
Mean house or condo value by units in structure - Mobile home ($)
Median house or condo value ($) - White
Median house or condo value ($) - Black or African American
Median house or condo value ($) - Asian
Median house or condo value ($) - Hispanic or Latino
Median house or condo value ($) - American Indian and Alaska Native
Median house or condo value ($) - Multirace
Median house or condo value ($) - Other Race
Median resident age
Resident age diversity
Median resident age - Males
Median resident age - Females
Median resident age - White
Median resident age - Black or African American
Median resident age - Asian
Median resident age - Hispanic or Latino
Median resident age - American Indian and Alaska Native
Median resident age - Multirace
Median resident age - Other Race
Median resident age - Males - White
Median resident age - Males - Black or African American
Median resident age - Males - Asian
Median resident age - Males - Hispanic or Latino
Median resident age - Males - American Indian and Alaska Native
Median resident age - Males - Multirace
Median resident age - Males - Other Race
Median resident age - Females - White
Median resident age - Females - Black or African American
Median resident age - Females - Asian
Median resident age - Females - Hispanic or Latino
Median resident age - Females - American Indian and Alaska Native
Median resident age - Females - Multirace
Median resident age - Females - Other Race
Commute - mean travel time to work (minutes)
Travel time to work - Less than 5 minutes (%)
Travel time to work - Less than 5 minutes (% change since 2000)
Travel time to work - 5 to 9 minutes (%)
Travel time to work - 5 to 9 minutes (% change since 2000)
Travel time to work - 10 to 19 minutes (%)
Travel time to work - 10 to 19 minutes (% change since 2000)
Travel time to work - 20 to 29 minutes (%)
Travel time to work - 20 to 29 minutes (% change since 2000)
Travel time to work - 30 to 39 minutes (%)
Travel time to work - 30 to 39 minutes (% change since 2000)
Travel time to work - 40 to 59 minutes (%)
Travel time to work - 40 to 59 minutes (% change since 2000)
Travel time to work - 60 to 89 minutes (%)
Travel time to work - 60 to 89 minutes (% change since 2000)
Travel time to work - 90 or more minutes (%)
Travel time to work - 90 or more minutes (% change since 2000)
Marital status - Never married (%)
Marital status - Now married (%)
Marital status - Separated (%)
Marital status - Widowed (%)
Marital status - Divorced (%)
Median family income ($)
Median family income (% change since 2000)
Median non-family income ($)
Median non-family income (% change since 2000)
Median per capita income ($)
Median per capita income (% change since 2000)
Median family income ($) - White
Median family income ($) - Black or African American
Median family income ($) - Asian
Median family income ($) - Hispanic or Latino
Median family income ($) - American Indian and Alaska Native
Median family income ($) - Multirace
Median family income ($) - Other Race
Median year house/condo built
Median year apartment built
Year house built - Built 2005 or later (%)
Year house built - Built 2000 to 2004 (%)
Year house built - Built 1990 to 1999 (%)
Year house built - Built 1980 to 1989 (%)
Year house built - Built 1970 to 1979 (%)
Year house built - Built 1960 to 1969 (%)
Year house built - Built 1950 to 1959 (%)
Year house built - Built 1940 to 1949 (%)
Year house built - Built 1939 or earlier (%)
Average household size
Household density (households per square mile)
Average household size - White
Average household size - Black or African American
Average household size - Asian
Average household size - Hispanic or Latino
Average household size - American Indian and Alaska Native
Average household size - Multirace
Average household size - Other Race
Occupied housing units (%)
Vacant housing units (%)
Owner occupied housing units (%)
Renter occupied housing units (%)
Vacancy status - For rent (%)
Vacancy status - For sale only (%)
Vacancy status - Rented or sold, not occupied (%)
Vacancy status - For seasonal, recreational, or occasional use (%)
Vacancy status - For migrant workers (%)
Vacancy status - Other vacant (%)
Residents with income below the poverty level (%)
Residents with income below 50% of the poverty level (%)
Children below poverty level (%)
Poor families by family type - Married-couple family (%)
Poor families by family type - Male, no wife present (%)
Poor families by family type - Female, no husband present (%)
Poverty status for native-born residents (%)
Poverty status for foreign-born residents (%)
Poverty among high school graduates not in families (%)
Poverty among people who did not graduate high school not in families (%)
Residents with income below the poverty level (%) - White
Residents with income below the poverty level (%) - Black or African American
Residents with income below the poverty level (%) - Asian
Residents with income below the poverty level (%) - Hispanic or Latino
Residents with income below the poverty level (%) - American Indian and Alaska Native
Residents with income below the poverty level (%) - Multirace
Residents with income below the poverty level (%) - Other Race
Air pollution - Air Quality Index (AQI)
Air pollution - CO
Air pollution - NO2
Air pollution - SO2
Air pollution - Ozone
Air pollution - PM10
Air pollution - PM25
Air pollution - Pb
Crime - Murders per 100,000 population
Crime - Rapes per 100,000 population
Crime - Robberies per 100,000 population
Crime - Assaults per 100,000 population
Crime - Burglaries per 100,000 population
Crime - Thefts per 100,000 population
Crime - Auto thefts per 100,000 population
Crime - Arson per 100,000 population
Crime - City-data.com crime index
Crime - Violent crime index
Crime - Property crime index
Crime - Murders per 100,000 population (5 year average)
Crime - Rapes per 100,000 population (5 year average)
Crime - Robberies per 100,000 population (5 year average)
Crime - Assaults per 100,000 population (5 year average)
Crime - Burglaries per 100,000 population (5 year average)
Crime - Thefts per 100,000 population (5 year average)
Crime - Auto thefts per 100,000 population (5 year average)
Crime - Arson per 100,000 population (5 year average)
Crime - City-data.com crime index (5 year average)
Crime - Violent crime index (5 year average)
Crime - Property crime index (5 year average)
1996 Presidential Elections Results (%) - Democratic Party (Clinton)
1996 Presidential Elections Results (%) - Republican Party (Dole)
1996 Presidential Elections Results (%) - Other
2000 Presidential Elections Results (%) - Democratic Party (Gore)
2000 Presidential Elections Results (%) - Republican Party (Bush)
2000 Presidential Elections Results (%) - Other
2004 Presidential Elections Results (%) - Democratic Party (Kerry)
2004 Presidential Elections Results (%) - Republican Party (Bush)
2004 Presidential Elections Results (%) - Other
2008 Presidential Elections Results (%) - Democratic Party (Obama)
2008 Presidential Elections Results (%) - Republican Party (McCain)
2008 Presidential Elections Results (%) - Other
2012 Presidential Elections Results (%) - Democratic Party (Obama)
2012 Presidential Elections Results (%) - Republican Party (Romney)
2012 Presidential Elections Results (%) - Other
2016 Presidential Elections Results (%) - Democratic Party (Clinton)
2016 Presidential Elections Results (%) - Republican Party (Trump)
2016 Presidential Elections Results (%) - Other
2020 Presidential Elections Results (%) - Democratic Party (Biden)
2020 Presidential Elections Results (%) - Republican Party (Trump)
2020 Presidential Elections Results (%) - Other
Ancestries Reported - Arab (%)
Ancestries Reported - Czech (%)
Ancestries Reported - Danish (%)
Ancestries Reported - Dutch (%)
Ancestries Reported - English (%)
Ancestries Reported - French (%)
Ancestries Reported - French Canadian (%)
Ancestries Reported - German (%)
Ancestries Reported - Greek (%)
Ancestries Reported - Hungarian (%)
Ancestries Reported - Irish (%)
Ancestries Reported - Italian (%)
Ancestries Reported - Lithuanian (%)
Ancestries Reported - Norwegian (%)
Ancestries Reported - Polish (%)
Ancestries Reported - Portuguese (%)
Ancestries Reported - Russian (%)
Ancestries Reported - Scotch-Irish (%)
Ancestries Reported - Scottish (%)
Ancestries Reported - Slovak (%)
Ancestries Reported - Subsaharan African (%)
Ancestries Reported - Swedish (%)
Ancestries Reported - Swiss (%)
Ancestries Reported - Ukrainian (%)
Ancestries Reported - United States (%)
Ancestries Reported - Welsh (%)
Ancestries Reported - West Indian (%)
Ancestries Reported - Other (%)
Educational Attainment - No schooling completed (%)
Educational Attainment - Less than high school (%)
Educational Attainment - High school or equivalent (%)
Educational Attainment - Less than 1 year of college (%)
Educational Attainment - 1 or more years of college (%)
Educational Attainment - Associate degree (%)
Educational Attainment - Bachelor's degree (%)
Educational Attainment - Master's degree (%)
Educational Attainment - Professional school degree (%)
Educational Attainment - Doctorate degree (%)
School Enrollment - Nursery, preschool (%)
School Enrollment - Kindergarten (%)
School Enrollment - Grade 1 to 4 (%)
School Enrollment - Grade 5 to 8 (%)
School Enrollment - Grade 9 to 12 (%)
School Enrollment - College undergrad (%)
School Enrollment - Graduate or professional (%)
School Enrollment - Not enrolled in school (%)
School enrollment - Public schools (%)
School enrollment - Private schools (%)
School enrollment - Not enrolled (%)
Median number of rooms in houses and condos
Median number of rooms in apartments
Housing units lacking complete plumbing facilities (%)
Housing units lacking complete kitchen facilities (%)
Density of houses
Urban houses (%)
Rural houses (%)
Households with people 60 years and over (%)
Households with people 65 years and over (%)
Households with people 75 years and over (%)
Households with one or more nonrelatives (%)
Households with no nonrelatives (%)
Population in households (%)
Family households (%)
Nonfamily households (%)
Population in families (%)
Family households with own children (%)
Median number of bedrooms in owner occupied houses
Mean number of bedrooms in owner occupied houses
Median number of bedrooms in renter occupied houses
Mean number of bedrooms in renter occupied houses
Median number of vehichles in owner occupied houses
Mean number of vehichles in owner occupied houses
Median number of vehichles in renter occupied houses
Mean number of vehichles in renter occupied houses
Mortgage status - with mortgage (%)
Mortgage status - with second mortgage (%)
Mortgage status - with home equity loan (%)
Mortgage status - with both second mortgage and home equity loan (%)
Mortgage status - without a mortgage (%)
Average family size
Average family size - White
Average family size - Black or African American
Average family size - Asian
Average family size - Hispanic or Latino
Average family size - American Indian and Alaska Native
Average family size - Multirace
Average family size - Other Race
Geographical mobility - Same house 1 year ago (%)
Geographical mobility - Moved within same county (%)
Geographical mobility - Moved from different county within same state (%)
Geographical mobility - Moved from different state (%)
Geographical mobility - Moved from abroad (%)
Place of birth - Born in state of residence (%)
Place of birth - Born in other state (%)
Place of birth - Native, outside of US (%)
Place of birth - Foreign born (%)
Housing units in structures - 1, detached (%)
Housing units in structures - 1, attached (%)
Housing units in structures - 2 (%)
Housing units in structures - 3 or 4 (%)
Housing units in structures - 5 to 9 (%)
Housing units in structures - 10 to 19 (%)
Housing units in structures - 20 to 49 (%)
Housing units in structures - 50 or more (%)
Housing units in structures - Mobile home (%)
Housing units in structures - Boat, RV, van, etc. (%)
House/condo owner moved in on average (years ago)
Renter moved in on average (years ago)
Year householder moved into unit - Moved in 1999 to March 2000 (%)
Year householder moved into unit - Moved in 1995 to 1998 (%)
Year householder moved into unit - Moved in 1990 to 1994 (%)
Year householder moved into unit - Moved in 1980 to 1989 (%)
Year householder moved into unit - Moved in 1970 to 1979 (%)
Year householder moved into unit - Moved in 1969 or earlier (%)
Means of transportation to work - Drove car alone (%)
Means of transportation to work - Carpooled (%)
Means of transportation to work - Public transportation (%)
Means of transportation to work - Bus or trolley bus (%)
Means of transportation to work - Streetcar or trolley car (%)
Means of transportation to work - Subway or elevated (%)
Means of transportation to work - Railroad (%)
Means of transportation to work - Ferryboat (%)
Means of transportation to work - Taxicab (%)
Means of transportation to work - Motorcycle (%)
Means of transportation to work - Bicycle (%)
Means of transportation to work - Walked (%)
Means of transportation to work - Other means (%)
Working at home (%)
Industry diversity
Most Common Industries - Agriculture, forestry, fishing and hunting, and mining (%)
Most Common Industries - Agriculture, forestry, fishing and hunting (%)
Most Common Industries - Mining, quarrying, and oil and gas extraction (%)
Most Common Industries - Construction (%)
Most Common Industries - Manufacturing (%)
Most Common Industries - Wholesale trade (%)
Most Common Industries - Retail trade (%)
Most Common Industries - Transportation and warehousing, and utilities (%)
Most Common Industries - Transportation and warehousing (%)
Most Common Industries - Utilities (%)
Most Common Industries - Information (%)
Most Common Industries - Finance and insurance, and real estate and rental and leasing (%)
Most Common Industries - Finance and insurance (%)
Most Common Industries - Real estate and rental and leasing (%)
Most Common Industries - Professional, scientific, and management, and administrative and waste management services (%)
Most Common Industries - Professional, scientific, and technical services (%)
Most Common Industries - Management of companies and enterprises (%)
Most Common Industries - Administrative and support and waste management services (%)
Most Common Industries - Educational services, and health care and social assistance (%)
Most Common Industries - Educational services (%)
Most Common Industries - Health care and social assistance (%)
Most Common Industries - Arts, entertainment, and recreation, and accommodation and food services (%)
Most Common Industries - Arts, entertainment, and recreation (%)
Most Common Industries - Accommodation and food services (%)
Most Common Industries - Other services, except public administration (%)
Most Common Industries - Public administration (%)
Occupation diversity
Most Common Occupations - Management, business, science, and arts occupations (%)
Most Common Occupations - Management, business, and financial occupations (%)
Most Common Occupations - Management occupations (%)
Most Common Occupations - Business and financial operations occupations (%)
Most Common Occupations - Computer, engineering, and science occupations (%)
Most Common Occupations - Computer and mathematical occupations (%)
Most Common Occupations - Architecture and engineering occupations (%)
Most Common Occupations - Life, physical, and social science occupations (%)
Most Common Occupations - Education, legal, community service, arts, and media occupations (%)
Most Common Occupations - Community and social service occupations (%)
Most Common Occupations - Legal occupations (%)
Most Common Occupations - Education, training, and library occupations (%)
Most Common Occupations - Arts, design, entertainment, sports, and media occupations (%)
Most Common Occupations - Healthcare practitioners and technical occupations (%)
Most Common Occupations - Health diagnosing and treating practitioners and other technical occupations (%)
Most Common Occupations - Health technologists and technicians (%)
Most Common Occupations - Service occupations (%)
Most Common Occupations - Healthcare support occupations (%)
Most Common Occupations - Protective service occupations (%)
Most Common Occupations - Fire fighting and prevention, and other protective service workers including supervisors (%)
Most Common Occupations - Law enforcement workers including supervisors (%)
Most Common Occupations - Food preparation and serving related occupations (%)
Most Common Occupations - Building and grounds cleaning and maintenance occupations (%)
Most Common Occupations - Personal care and service occupations (%)
Most Common Occupations - Sales and office occupations (%)
Most Common Occupations - Sales and related occupations (%)
Most Common Occupations - Office and administrative support occupations (%)
Most Common Occupations - Natural resources, construction, and maintenance occupations (%)
Most Common Occupations - Farming, fishing, and forestry occupations (%)
Most Common Occupations - Construction and extraction occupations (%)
Most Common Occupations - Installation, maintenance, and repair occupations (%)
Most Common Occupations - Production, transportation, and material moving occupations (%)
Most Common Occupations - Production occupations (%)
Most Common Occupations - Transportation occupations (%)
Most Common Occupations - Material moving occupations (%)
People in Group quarters - Institutionalized population (%)
People in Group quarters - Correctional institutions (%)
People in Group quarters - Federal prisons and detention centers (%)
People in Group quarters - Halfway houses (%)
People in Group quarters - Local jails and other confinement facilities (including police lockups) (%)
People in Group quarters - Military disciplinary barracks (%)
People in Group quarters - State prisons (%)
People in Group quarters - Other types of correctional institutions (%)
People in Group quarters - Nursing homes (%)
People in Group quarters - Hospitals/wards, hospices, and schools for the handicapped (%)
People in Group quarters - Hospitals/wards and hospices for chronically ill (%)
People in Group quarters - Hospices or homes for chronically ill (%)
People in Group quarters - Military hospitals or wards for chronically ill (%)
People in Group quarters - Other hospitals or wards for chronically ill (%)
People in Group quarters - Hospitals or wards for drug/alcohol abuse (%)
People in Group quarters - Mental (Psychiatric) hospitals or wards (%)
People in Group quarters - Schools, hospitals, or wards for the mentally retarded (%)
People in Group quarters - Schools, hospitals, or wards for the physically handicapped (%)
People in Group quarters - Institutions for the deaf (%)
People in Group quarters - Institutions for the blind (%)
People in Group quarters - Orthopedic wards and institutions for the physically handicapped (%)
People in Group quarters - Wards in general hospitals for patients who have no usual home elsewhere (%)
People in Group quarters - Wards in military hospitals for patients who have no usual home elsewhere (%)
People in Group quarters - Juvenile institutions (%)
People in Group quarters - Long-term care (%)
People in Group quarters - Homes for abused, dependent, and neglected children (%)
People in Group quarters - Residential treatment centers for emotionally disturbed children (%)
People in Group quarters - Training schools for juvenile delinquents (%)
People in Group quarters - Short-term care, detention or diagnostic centers for delinquent children (%)
People in Group quarters - Type of juvenile institution unknown (%)
People in Group quarters - Noninstitutionalized population (%)
People in Group quarters - College dormitories (includes college quarters off campus) (%)
People in Group quarters - Military quarters (%)
People in Group quarters - On base (%)
People in Group quarters - Barracks, unaccompanied personnel housing (UPH), (Enlisted/Officer), ;and similar group living quarters for military personnel (%)
People in Group quarters - Transient quarters for temporary residents (%)
People in Group quarters - Military ships (%)
People in Group quarters - Group homes (%)
People in Group quarters - Homes or halfway houses for drug/alcohol abuse (%)
People in Group quarters - Homes for the mentally ill (%)
People in Group quarters - Homes for the mentally retarded (%)
People in Group quarters - Homes for the physically handicapped (%)
People in Group quarters - Other group homes (%)
People in Group quarters - Religious group quarters (%)
People in Group quarters - Dormitories (%)
People in Group quarters - Agriculture workers' dormitories on farms (%)
People in Group quarters - Job Corps and vocational training facilities (%)
People in Group quarters - Other workers' dormitories (%)
People in Group quarters - Crews of maritime vessels (%)
People in Group quarters - Other nonhousehold living situations (%)
People in Group quarters - Other noninstitutional group quarters (%)
Residents speaking English at home (%)
Residents speaking English at home - Born in the United States (%)
Residents speaking English at home - Native, born elsewhere (%)
Residents speaking English at home - Foreign born (%)
Residents speaking Spanish at home (%)
Residents speaking Spanish at home - Born in the United States (%)
Residents speaking Spanish at home - Native, born elsewhere (%)
Residents speaking Spanish at home - Foreign born (%)
Residents speaking other language at home (%)
Residents speaking other language at home - Born in the United States (%)
Residents speaking other language at home - Native, born elsewhere (%)
Residents speaking other language at home - Foreign born (%)
Class of Workers - Employee of private company (%)
Class of Workers - Self-employed in own incorporated business (%)
Class of Workers - Private not-for-profit wage and salary workers (%)
Class of Workers - Local government workers (%)
Class of Workers - State government workers (%)
Class of Workers - Federal government workers (%)
Class of Workers - Self-employed workers in own not incorporated business and Unpaid family workers (%)
House heating fuel used in houses and condos - Utility gas (%)
House heating fuel used in houses and condos - Bottled, tank, or LP gas (%)
House heating fuel used in houses and condos - Electricity (%)
House heating fuel used in houses and condos - Fuel oil, kerosene, etc. (%)
House heating fuel used in houses and condos - Coal or coke (%)
House heating fuel used in houses and condos - Wood (%)
House heating fuel used in houses and condos - Solar energy (%)
House heating fuel used in houses and condos - Other fuel (%)
House heating fuel used in houses and condos - No fuel used (%)
House heating fuel used in apartments - Utility gas (%)
House heating fuel used in apartments - Bottled, tank, or LP gas (%)
House heating fuel used in apartments - Electricity (%)
House heating fuel used in apartments - Fuel oil, kerosene, etc. (%)
House heating fuel used in apartments - Coal or coke (%)
House heating fuel used in apartments - Wood (%)
House heating fuel used in apartments - Solar energy (%)
House heating fuel used in apartments - Other fuel (%)
House heating fuel used in apartments - No fuel used (%)
Armed forces status - In Armed Forces (%)
Armed forces status - Civilian (%)
Armed forces status - Civilian - Veteran (%)
Armed forces status - Civilian - Nonveteran (%)
Fatal accidents locations in years 2005-2021
Fatal accidents locations in 2005
Fatal accidents locations in 2006
Fatal accidents locations in 2007
Fatal accidents locations in 2008
Fatal accidents locations in 2009
Fatal accidents locations in 2010
Fatal accidents locations in 2011
Fatal accidents locations in 2012
Fatal accidents locations in 2013
Fatal accidents locations in 2014
Fatal accidents locations in 2015
Fatal accidents locations in 2016
Fatal accidents locations in 2017
Fatal accidents locations in 2018
Fatal accidents locations in 2019
Fatal accidents locations in 2020
Fatal accidents locations in 2021
Alcohol use - People drinking some alcohol every month (%)
Alcohol use - People not drinking at all (%)
Alcohol use - Average days/month drinking alcohol
Alcohol use - Average drinks/week
Alcohol use - Average days/year people drink much
Audiometry - Average condition of hearing (%)
Audiometry - People that can hear a whisper from across a quiet room (%)
Audiometry - People that can hear normal voice from across a quiet room (%)
Audiometry - Ears ringing, roaring, buzzing (%)
Audiometry - Had a job exposure to loud noise (%)
Audiometry - Had off-work exposure to loud noise (%)
Blood Pressure & Cholesterol - Has high blood pressure (%)
Blood Pressure & Cholesterol - Checking blood pressure at home (%)
Blood Pressure & Cholesterol - Frequently checking blood cholesterol (%)
Blood Pressure & Cholesterol - Has high cholesterol level (%)
Consumer Behavior - Money monthly spent on food at supermarket/grocery store
Consumer Behavior - Money monthly spent on food at other stores
Consumer Behavior - Money monthly spent on eating out
Consumer Behavior - Money monthly spent on carryout/delivered foods
Consumer Behavior - Income spent on food at supermarket/grocery store (%)
Consumer Behavior - Income spent on food at other stores (%)
Consumer Behavior - Income spent on eating out (%)
Consumer Behavior - Income spent on carryout/delivered foods (%)
Current Health Status - General health condition (%)
Current Health Status - Blood donors (%)
Current Health Status - Has blood ever tested for HIV virus (%)
Current Health Status - Left-handed people (%)
Dermatology - People using sunscreen (%)
Diabetes - Diabetics (%)
Diabetes - Had a blood test for high blood sugar (%)
Diabetes - People taking insulin (%)
Diet Behavior & Nutrition - Diet health (%)
Diet Behavior & Nutrition - Milk product consumption (# of products/month)
Diet Behavior & Nutrition - Meals not home prepared (#/week)
Diet Behavior & Nutrition - Meals from fast food or pizza place (#/week)
Diet Behavior & Nutrition - Ready-to-eat foods (#/month)
Diet Behavior & Nutrition - Frozen meals/pizza (#/month)
Drug Use - People that ever used marijuana or hashish (%)
Drug Use - Ever used hard drugs (%)
Drug Use - Ever used any form of cocaine (%)
Drug Use - Ever used heroin (%)
Drug Use - Ever used methamphetamine (%)
Health Insurance - People covered by health insurance (%)
Kidney Conditions-Urology - Avg. # of times urinating at night
Medical Conditions - People with asthma (%)
Medical Conditions - People with anemia (%)
Medical Conditions - People with psoriasis (%)
Medical Conditions - People with overweight (%)
Medical Conditions - Elderly people having difficulties in thinking or remembering (%)
Medical Conditions - People who ever received blood transfusion (%)
Medical Conditions - People having trouble seeing even with glass/contacts (%)
Medical Conditions - People with arthritis (%)
Medical Conditions - People with gout (%)
Medical Conditions - People with congestive heart failure (%)
Medical Conditions - People with coronary heart disease (%)
Medical Conditions - People with angina pectoris (%)
Medical Conditions - People who ever had heart attack (%)
Medical Conditions - People who ever had stroke (%)
Medical Conditions - People with emphysema (%)
Medical Conditions - People with thyroid problem (%)
Medical Conditions - People with chronic bronchitis (%)
Medical Conditions - People with any liver condition (%)
Medical Conditions - People who ever had cancer or malignancy (%)
Mental Health - People who have little interest in doing things (%)
Mental Health - People feeling down, depressed, or hopeless (%)
Mental Health - People who have trouble sleeping or sleeping too much (%)
Mental Health - People feeling tired or having little energy (%)
Mental Health - People with poor appetite or overeating (%)
Mental Health - People feeling bad about themself (%)
Mental Health - People who have trouble concentrating on things (%)
Mental Health - People moving or speaking slowly or too fast (%)
Mental Health - People having thoughts they would be better off dead (%)
Oral Health - Average years since last visit a dentist
Oral Health - People embarrassed because of mouth (%)
Oral Health - People with gum disease (%)
Oral Health - General health of teeth and gums (%)
Oral Health - Average days a week using dental floss/device
Oral Health - Average days a week using mouthwash for dental problem
Oral Health - Average number of teeth
Pesticide Use - Households using pesticides to control insects (%)
Pesticide Use - Households using pesticides to kill weeds (%)
Physical Activity - People doing vigorous-intensity work activities (%)
Physical Activity - People doing moderate-intensity work activities (%)
Physical Activity - People walking or bicycling (%)
Physical Activity - People doing vigorous-intensity recreational activities (%)
Physical Activity - People doing moderate-intensity recreational activities (%)
Physical Activity - Average hours a day doing sedentary activities
Physical Activity - Average hours a day watching TV or videos
Physical Activity - Average hours a day using computer
Physical Functioning - People having limitations keeping them from working (%)
Physical Functioning - People limited in amount of work they can do (%)
Physical Functioning - People that need special equipment to walk (%)
Physical Functioning - People experiencing confusion/memory problems (%)
Physical Functioning - People requiring special healthcare equipment (%)
Prescription Medications - Average number of prescription medicines taking
Preventive Aspirin Use - Adults 40+ taking low-dose aspirin (%)
Reproductive Health - Vaginal deliveries (%)
Reproductive Health - Cesarean deliveries (%)
Reproductive Health - Deliveries resulted in a live birth (%)
Reproductive Health - Pregnancies resulted in a delivery (%)
Reproductive Health - Women breastfeeding newborns (%)
Reproductive Health - Women that had a hysterectomy (%)
Reproductive Health - Women that had both ovaries removed (%)
Reproductive Health - Women that have ever taken birth control pills (%)
Reproductive Health - Women taking birth control pills (%)
Reproductive Health - Women that have ever used Depo-Provera or injectables (%)
Reproductive Health - Women that have ever used female hormones (%)
Sexual Behavior - People 18+ that ever had sex (vaginal, anal, or oral) (%)
Sexual Behavior - Males 18+ that ever had vaginal sex with a woman (%)
Sexual Behavior - Males 18+ that ever performed oral sex on a woman (%)
Sexual Behavior - Males 18+ that ever had anal sex with a woman (%)
Sexual Behavior - Males 18+ that ever had any sex with a man (%)
Sexual Behavior - Females 18+ that ever had vaginal sex with a man (%)
Sexual Behavior - Females 18+ that ever performed oral sex on a man (%)
Sexual Behavior - Females 18+ that ever had anal sex with a man (%)
Sexual Behavior - Females 18+ that ever had any kind of sex with a woman (%)
Sexual Behavior - Average age people first had sex
Sexual Behavior - Average number of female sex partners in lifetime (males 18+)
Sexual Behavior - Average number of female vaginal sex partners in lifetime (males 18+)
Sexual Behavior - Average age people first performed oral sex on a woman (18+)
Sexual Behavior - Average number of woman performed oral sex on in lifetime (18+)
Sexual Behavior - Average number of male sex partners in lifetime (males 18+)
Sexual Behavior - Average number of male anal sex partners in lifetime (males 18+)
Sexual Behavior - Average age people first performed oral sex on a man (18+)
Sexual Behavior - Average number of male oral sex partners in lifetime (18+)
Sexual Behavior - People using protection when performing oral sex (%)
Sexual Behavior - Average number of times people have vaginal or anal sex a year
Sexual Behavior - People having sex without condom (%)
Sexual Behavior - Average number of male sex partners in lifetime (females 18+)
Sexual Behavior - Average number of male vaginal sex partners in lifetime (females 18+)
Sexual Behavior - Average number of female sex partners in lifetime (females 18+)
Sexual Behavior - Circumcised males 18+ (%)
Sleep Disorders - Average hours sleeping at night
Sleep Disorders - People that has trouble sleeping (%)
Smoking-Cigarette Use - People smoking cigarettes (%)
Taste & Smell - People 40+ having problems with smell (%)
Taste & Smell - People 40+ having problems with taste (%)
Taste & Smell - People 40+ that ever had wisdom teeth removed (%)
Taste & Smell - People 40+ that ever had tonsils teeth removed (%)
Taste & Smell - People 40+ that ever had a loss of consciousness because of a head injury (%)
Taste & Smell - People 40+ that ever had a broken nose or other serious injury to face or skull (%)
Taste & Smell - People 40+ that ever had two or more sinus infections (%)
Weight - Average height (inches)
Weight - Average weight (pounds)
Weight - Average BMI
Weight - People that are obese (%)
Weight - People that ever were obese (%)
Weight - People trying to lose weight (%)
According to our research of Illinois and other state lists, there were 31 registered sex offenders living in Lockport, Illinois as of April 28, 2024 . The ratio of all residents to sex offenders in Lockport is 814 to 1.The ratio of registered sex offenders to all residents in this city is near the state average.
Officers per 1,000 residents here:
1.52Illinois average:
3.06
Latest news from Lockport, IL collected exclusively by city-data.com from local newspapers, TV, and radio stations
Ancestries: Polish (22.4%), Irish (11.0%), Italian (10.7%), German (9.3%), American (6.5%), Lithuanian (4.0%).
Current Local Time:
Incorporated on 09/02/1890
Land area: 7.08 square miles.
Population density: 3,685 people per square mile (average).
2,096 residents are foreign born (4.4% Europe , 2.0% Asia , 1.2% Latin America ).
This city:
8.0%Illinois:
14.1%
Median real estate property taxes paid for housing units with mortgages in 2022: $7,667 (2.5%)Median real estate property taxes paid for housing units with no mortgage in 2022: $7,122 (2.4%)
Nearest city with pop. 50,000+: Joliet, IL
Nearest city with pop. 200,000+: Chicago, IL
Nearest cities:
Latitude: 41.59 N, Longitude: 88.05 W
Daytime population change due to commuting: -5,215 (-20.0%)Workers who live and work in this city: 3,511 (24.9%)
Property values in Lockport, IL
Single-family new house construction building permits:
2022: 202 buildings , average cost: $322,9002021: 77 buildings , average cost: $334,5002020: 40 buildings , average cost: $307,5002019: 43 buildings , average cost: $352,3002018: 96 buildings , average cost: $312,1002017: 98 buildings , average cost: $272,1002016: 115 buildings , average cost: $284,1002015: 42 buildings , average cost: $275,7002014: 49 buildings , average cost: $295,5002013: 29 buildings , average cost: $322,0002012: 33 buildings , average cost: $328,0002011: 25 buildings , average cost: $343,0002010: 35 buildings , average cost: $233,8002009: 18 buildings , average cost: $206,0002008: 83 buildings , average cost: $255,2002007: 152 buildings , average cost: $263,1002006: 300 buildings , average cost: $214,1002005: 563 buildings , average cost: $207,8002004: 427 buildings , average cost: $165,6002003: 433 buildings , average cost: $150,7002002: 426 buildings , average cost: $140,2002001: 382 buildings , average cost: $123,4002000: 425 buildings , average cost: $106,9001999: 357 buildings , average cost: $111,2001998: 207 buildings , average cost: $114,7001997: 214 buildings , average cost: $101,200Unemployment in December 2023:
Population change in the 1990s: +5,445 (+55.9%).
Most common occupations in Lockport, IL (%)
Both Males Females
Other sales and related occupations, including supervisors (4.7%)
Other office and administrative support workers, including supervisors (4.0%)
Electrical equipment mechanics and other installation, maintenance, and repair workers, including supervisors (3.7%)
Other production occupations, including supervisors (3.7%)
Secretaries and administrative assistants (3.5%)
Registered nurses (3.4%)
Preschool, kindergarten, elementary, and middle school teachers (3.2%)
Electrical equipment mechanics and other installation, maintenance, and repair workers, including supervisors (6.8%)
Driver/sales workers and truck drivers (6.0%)
Other production occupations, including supervisors (5.7%)
Carpenters (4.1%)
Sales representatives, services, wholesale and manufacturing (3.8%)
Vehicle and mobile equipment mechanics, installers, and repairers (3.6%)
Metal workers and plastic workers (3.6%)
Secretaries and administrative assistants (7.4%)
Other office and administrative support workers, including supervisors (7.1%)
Registered nurses (6.3%)
Preschool, kindergarten, elementary, and middle school teachers (6.1%)
Other sales and related occupations, including supervisors (5.8%)
Cashiers (4.4%)
Retail sales workers, except cashiers (3.7%)
Tornado activity:
Lockport-area historical tornado activity is near Illinois state average. It is 60% greater than the overall U.S. average.
On 8/28/1990, a category F5 (max. wind speeds 261-318 mph) tornado 5.5 miles away from the Lockport city center killed 29 people and injured 350 people and caused between $50,000 and $500,000 in damages.
On 6/13/1976, a category F4 (max. wind speeds 207-260 mph) tornado 6.1 miles away from the city center killed 2 people and injured 23 people and caused between $500,000 and $5,000,000 in damages.
Earthquake activity:
Lockport-area historical earthquake activity is significantly above Illinois state average. It is 54% greater than the overall U.S. average. On 4/18/2008 at 09:36:59, a magnitude 5.4 (5.1 MB, 4.8 MS, 5.4 MW, 5.2 MW, Class: Moderate, Intensity: VI - VII) earthquake occurred 217.1 miles away from the city center On 6/10/1987 at 23:48:54, a magnitude 5.1 (4.9 MB, 4.4 MS, 4.6 MS, 5.1 LG) earthquake occurred 191.6 miles away from the city center On 4/18/2008 at 09:36:59, a magnitude 5.2 (5.2 MW, Depth: 8.9 mi) earthquake occurred 217.2 miles away from the city center On 6/28/2004 at 06:10:52, a magnitude 4.2 (4.2 MW, Depth: 6.2 mi, Class: Light, Intensity: IV - V) earthquake occurred 45.0 miles away from the city center On 6/18/2002 at 17:37:15, a magnitude 5.0 (4.3 MB, 4.6 MW, 5.0 LG) earthquake occurred 249.5 miles away from Lockport center On 4/18/2008 at 15:14:16, a magnitude 4.8 (4.5 MB, 4.8 MW, 4.6 MW) earthquake occurred 215.6 miles away from the city center Magnitude types: regional Lg-wave magnitude (LG), body-wave magnitude (MB), surface-wave magnitude (MS), moment magnitude (MW) Natural disasters: The number of natural disasters in Will County (17) is near the US average (15).Major Disasters (Presidential) Declared: 12Emergencies Declared: 4Storms: 9, Floods: 7, Tornadoes: 5, Snowstorms: 2, Winds: 2, Winter Storms: 2, Blizzard: 1, Hurricane: 1, Snow: 1, Other: 1 (Note: some incidents may be assigned to more than one category). Hospitals and medical centers in Lockport: SHADY OAKS WEST (16220 PARKER ROAD) LOCKPORT DAVITA AT HOME (16626 W. 159TH STREET, STE. 703)
ELITE HEALTHCARE PROVIDERS (1000 SOUTH STATE ST, STE 301)
Amtrak stations near Lockport: 5 miles: JOLIET (50 E. JEFFERSON ST.) Services: ticket office, partially wheelchair accessible, enclosed waiting area, public restrooms, public payphones, vending machines, paid short-term parking, paid long-term parking, public transit connection.
15 miles: NAPERVILLE (E. 4TH & ELLSWORTH AVE.) Services: ticket office, partially wheelchair accessible, enclosed waiting area, public restrooms, public payphones, free short-term parking, free long-term parking, call for taxi service, public transit connection.
19 miles: LA GRANGE ROAD (LA GRANGE, 25 W. BURLINGTON AVE.) Services: enclosed waiting area, public payphones, taxi stand, public transit connection.
Colleges/universities with over 2000 students nearest to Lockport:
Lewis University (about 3 miles; Romeoville, IL ; Full-time enrollment: 5,739)
University of St Francis (about 5 miles; Joliet, IL ; FT enrollment: 2,454)
Joliet Junior College (about 10 miles; Joliet, IL ; FT enrollment: 11,401)
Moraine Valley Community College (about 14 miles; Palos Hills, IL ; FT enrollment: 12,008)
Benedictine University (about 14 miles; Lisle, IL ; FT enrollment: 5,694)
North Central College (about 14 miles; Naperville, IL ; FT enrollment: 2,860)
College of DuPage (about 18 miles; Glen Ellyn, IL ; FT enrollment: 18,910)
Public high school in Lockport:
Public elementary/middle schools in Lockport: WILLIAM J BUTLER SCHOOL Students: 726, Location: 1900 S FARRELL RD, Grades: PK-4)LUDWIG ELEM SCHOOL Students: 438, Location: 710 N STATE ST, Grades: 4-5)KELVIN GROVE JR HIGH SCHOOL Students: 372, Location: 808 ADAMS ST, Grades: 4-8)FAIRMONT SCHOOL Students: 324, Location: 735 GREEN GARDEN PL, Grades: PK-8)TAFT GRADE SCHOOL Students: 317, Location: 1605 S WASHINGTON ST, Grades: PK-8)MILNE GROVE ELEM SCHOOL Students: 301, Location: 565 E 7TH ST, Grades: PK-3)WALSH ELEM SCHOOL Location: 514 MACGREGOR RD, Grades: PK-1)
Private elementary/middle schools in Lockport: ST JOSEPH ELEMENTARY SCHOOL Students: 276, Location: 529 MADISON ST, Grades: PK-8)
ST DENNIS SCHOOL Students: 238, Location: 1201 S WASHINGTON ST, Grades: PK-8)
CREST HILL CHRISTIAN SCHOOL Students: 20, Location: 21514 W DIVISION ST, Grades: PK-4)
See full list of schools located in Lockport Library in Lockport: DES PLAINES VALLEY PUBLIC LIBRARY DISTRICT Operating income: $2,260,974; Location: 121 EAST EIGHTH STREET; 159,691 books ; 12,161 audio materials ; 5,150 video materials ; 15 local licensed databases ; 18 state licensed databases ; 2 other licensed databases ; 211 print serial subscriptions )
Notable locations in Lockport: (A) , Illinois and Michigan Canal Museum (B) , Gladys Fox Museum (C) , Gaylord Building (D) , Lockport City Hall (E) , Lockport Township Fire Protection District Station 1 (F) . Display/hide their locations on the map
Churches in Lockport include: (A) , First United Methodist Church of Lockport (B) , Saint Pauls Lutheran Church (C) , Shepherd of the Hill Lutheran Church (D) , Saint Johns Episcopal Church (E) , Covenant Community Church (F) , Church of Christ (G) , Community Life Church (H) , First Congregational Church (I) . Display/hide their locations on the map
Cemeteries: (1) , Lockport Cemetery (2) , Runyan Cemetery (3) , Lockport Catholic Cemetery (4) , Calvary Cemetery (5) . Display/hide their locations on the map
Streams, rivers, and creeks: (A) . Display/hide its location on the map
Parks in Lockport include: (1) , Dellwood Park (2) , Legion Park (3) , Lockport Historic District (4) . Display/hide their locations on the map
Birthplace of: Tom Haller - Baseball player and coach, Jake Christensen - Football player, Jim Donahue - Major League Baseball player, Nick Setta - Player of and football, Alando Tucker - College basketball player (Wisconsin Badgers), Kyle Higgins - Writer.
Will County has a predicted average indoor radon screening level between 2 and 4 pCi/L (pico curies per liter) - Moderate Potential Drinking water stations with addresses in Lockport and their reported violations in the past:
SOUTHWEST DEVELOPMENT (Population served: 25, Groundwater):
Past health violations:
MCL, Monthly (TCR) - In JUN-2011, Contaminant: Coliform. Follow-up actions: St Site Visit (enforcement) (JUN-16-2011), St Formal NOV issued (JUN-16-2011), St Compliance achieved (JUL-27-2011)
Population served: 25, Groundwater):
Past health violations:
MCL, Monthly (TCR) - Between JAN-2009 and DEC-2009, Contaminant: Coliform. Follow-up actions: St Public Notif requested (JUL-08-2009), St Formal NOV issued (JUN-16-2010), St Public Notif received (JUN-23-2010)
Address: 14929 S ARCHER Population served: 25, Purch groundwater):
Past monitoring violations:
One regular monitoring violation
Drinking water stations with addresses in Lockport that have no violations reported:
ST BERNARDS CHURCH (Population served: 1,600, Primary Water Source Type: Groundwater)
FIRST APOSTOLIC CHURCH (Population served: 730, Primary Water Source Type: Groundwater)
SIEGALS COTTONWOOD FARMS (Population served: 500, Primary Water Source Type: Groundwater)
STRIKE N SPARE (Address: 811 N NORTHERN DR Population served: 300, Primary Water Source Type: Groundwater)
LOCKPORT GOLF & RECREATION (Population served: 145, Primary Water Source Type: Groundwater)
HOMER CONGREGATIONAL CHURCH (Address: 14832 W 163RD ST Population served: 100, Primary Water Source Type: Groundwater)
PAGODA HOUSE RESTAURANT (Population served: 100, Primary Water Source Type: Groundwater)
ROCCOS PUB (Population served: 100, Primary Water Source Type: Groundwater)
FIRST BAPTIST CHURCH (Population served: 70, Primary Water Source Type: Groundwater)
HARRIS BANK (Population served: 50, Primary Water Source Type: Groundwater)
Average household size: This city:
2.8 peopleIllinois:
2.6 people
Percentage of family households: This city:
73.5%Whole state:
65.8%
Percentage of households with unmarried partners: This city:
5.9%Whole state:
6.3%
Likely homosexual households (counted as self-reported same-sex unmarried-partner households)
Lesbian couples: 0.2% of all households Gay men: 0.1% of all households
People in group quarters in Lockport in 2010:
77 people in group homes for juveniles (non-correctional)
16 people in workers' group living quarters and job corps centers
6 people in group homes intended for adults
people in religious group quarters in 2000Banks with most branches in Lockport (2011 data):
BMO Harris Bank National Association: Homer Township Branch at 14831 West 159th Street, branch established on 1998/03/14; 826 East Ninth Street Branch at 826 East Ninth Street, branch established on 1971/06/10. Info updated 2011/07/14: Bank assets: $97,264.0 mil, Deposits: $75,624.6 mil, headquarters in Chicago, IL, positive income , 717 total offices , Holding Company: Bank Of Montreal
Woodforest National Bank: Lockport Walmart Branch at 16241 S Farrell Road, branch established on 2007/08/13. Info updated 2011/05/10: Bank assets: $3,488.9 mil, Deposits: $3,097.6 mil, headquarters in Houston, TX, positive income , Commercial Lending Specialization, 766 total offices , Holding Company: Woodforest Financial Group Employee Stock Ownership Plan (With 401(K) Provisions)
TCF National Bank: Jewel-Lockport Branch at 16625 W. 159th Street, branch established on 2002/09/18. Info updated 2009/11/23: Bank assets: $19,007.0 mil, Deposits: $12,377.0 mil, headquarters in Sioux Falls, SD, positive income , Commercial Lending Specialization, 441 total offices , Holding Company: Tcf Financial Corporation
Standard Bank and Trust Company: Lockport Branch at 16545 West 159th Street, branch established on 2005/08/15. Info updated 2006/11/03: Bank assets: $2,140.2 mil, Deposits: $1,872.8 mil, headquarters in Hickory Hills, IL, positive income , Commercial Lending Specialization, 43 total offices , Holding Company: Standard Bancshares, Inc.
Fifth Third Bank: Lockport Banking Center Branch at 16732 West 159th Street, branch established on 2005/10/11. Info updated 2009/10/05: Bank assets: $114,540.4 mil, Deposits: $89,689.1 mil, headquarters in Cincinnati, OH, positive income , Commercial Lending Specialization, 1378 total offices , Holding Company: Fifth Third Bancorp
GreenChoice Bank, fsb: South State Street Branch at 838 S State St, branch established on 2005/06/30. Info updated 2011/11/04: Bank assets: $65.6 mil, Deposits: $59.9 mil, headquarters in Chicago, IL, negative income in the last year , Commercial Lending Specialization, 2 total offices
JPMorgan Chase Bank, National Association: Farrell & 159th Banking Center at 16057 South Farrell Road, branch established on 2007/08/29. Info updated 2011/11/10: Bank assets: $1,811,678.0 mil, Deposits: $1,190,738.0 mil, headquarters in Columbus, OH, positive income , International Specialization, 5577 total offices , Holding Company: Jpmorgan Chase & Co.
RBS Citizens, National Association: Lockport at 1103 East Ninth Street, branch established on 1988/05/23. Info updated 2007/09/19: Bank assets: $106,940.6 mil, Deposits: $75,690.2 mil, headquarters in Providence, RI, positive income , 1135 total offices , Holding Company: Uk Financial Investments Limited
First Midwest Bank: Lockport Branch at 800 South State Street, branch established on 1996/04/13. Info updated 2011/12/22: Bank assets: $7,848.0 mil, Deposits: $6,529.2 mil, headquarters in Itasca, IL, positive income , Commercial Lending Specialization, 100 total offices , Holding Company: First Midwest Bancorp, Inc.
For population 15 years and over in Lockport:
Never married: 32.1%Now married: 53.0%Separated: 0.6%Widowed: 5.2%Divorced: 9.1% For population 25 years and over in Lockport:
High school or higher: 96.9%Bachelor's degree or higher: 43.7%Graduate or professional degree: 14.5%Unemployed: 2.5%Mean travel time to work (commute): 31.8 minutes
Education Gini index (Inequality in education) Here:
9.9Illinois average:
12.5
Religion statistics for Lockport, IL (based on Will County data)
Religion Adherents Congregations Catholic 212,252 39 Evangelical Protestant 46,404 188 Mainline Protestant 31,313 73 Other 12,574 20 Black Protestant 7,426 16 Orthodox 1,536 6 None 366,055 -
Source: Clifford Grammich, Kirk Hadaway, Richard Houseal, Dale E.Jones, Alexei Krindatch, Richie Stanley and Richard H.Taylor. 2012. 2010 U.S.Religion Census: Religious Congregations & Membership Study. Association of Statisticians of American Religious Bodies. Jones, Dale E., et al. 2002. Congregations and Membership in the United States 2000. Nashville, TN: Glenmary Research Center. Graphs represent county-level data
Food Environment Statistics: Number of grocery stores : 85Will County :
1.27 / 10,000 pop.Illinois :
2.24 / 10,000 pop.
Number of supercenters and club stores : 5Will County :
0.07 / 10,000 pop.Illinois :
0.08 / 10,000 pop.
Number of convenience stores (no gas) : 32This county :
0.48 / 10,000 pop.Illinois :
0.75 / 10,000 pop.
Number of convenience stores (with gas) : 122This county :
1.82 / 10,000 pop.Illinois :
2.61 / 10,000 pop.
Number of full-service restaurants : 286This county :
4.26 / 10,000 pop.State :
6.86 / 10,000 pop.
Adult diabetes rate : This county :
7.7%Illinois :
8.3%
Adult obesity rate : This county :
26.3%Illinois :
25.2%
Low-income preschool obesity rate : This county :
13.4%Illinois :
14.5%
Health and Nutrition: Healthy diet rate : This city:
50.4%Illinois:
49.5%
Average overall health of teeth and gums : This city:
49.2%Illinois:
47.2%
Average BMI : Lockport:
28.9Illinois:
28.6
People feeling badly about themselves : People not drinking alcohol at all : This city:
9.8%Illinois:
10.8%
Average hours sleeping at night : This city:
6.8Illinois:
6.8
Overweight people : Lockport:
35.5%Illinois:
33.4%
General health condition : This city:
58.2%Illinois:
56.4%
Average condition of hearing : Lockport:
80.0%Illinois:
79.9%
More about Health and Nutrition of Lockport, IL Residents
Local government employment and payroll (March 2022)
Function
Full-time employees
Monthly full-time payroll
Average yearly full-time wage
Part-time employees
Monthly part-time payroll
Police Protection - Officers
42 $356,904 $101,973 0 $0 Streets and Highways
16 $97,804 $73,353 0 $0 Other Government Administration
12 $80,477 $80,477 0 $0 Sewerage
11 $56,544 $61,684 0 $0 Water Supply
8 $47,483 $71,225 0 $0 Judicial and Legal
8 $29,954 $44,931 0 $0 Police - Other
5 $20,978 $50,347 14 $9,523 Financial Administration
5 $35,062 $84,149 2 $3,157 Other and Unallocable
3 $18,856 $75,424 0 $0
Totals for Government
110 $744,062 $81,170 16 $12,679
Lockport government finances - Expenditure in 2018 (per resident):
Construction - Water Utilities: $4,500,000 ($172.38)
Regular Highways: $2,605,000 ($99.79)General - Other: $39,000 ($1.49)Current Operations - Police Protection: $8,132,000 ($311.51)
Regular Highways: $3,754,000 ($143.80)Sewerage: $3,441,000 ($131.81)Water Utilities: $2,711,000 ($103.85)Solid Waste Management: $2,428,000 ($93.01)Financial Administration: $2,170,000 ($83.13)General - Other: $15,000 ($0.57)General - Interest on Debt: $1,390,000 ($53.25)
Other Capital Outlay - Regular Highways: $1,162,000 ($44.51)
Police Protection: $486,000 ($18.62)Water Utilities: $200,000 ($7.66)Central Staff Services: $28,000 ($1.07)Total Salaries and Wages: $7,889,000 ($302.20)
Lockport government finances - Revenue in 2018 (per resident):
Charges - Solid Waste Management: $2,439,000 ($93.43)
Federal Intergovernmental - Transit Utilities: $411,000 ($15.74)
Other: $341,000 ($13.06)Local Intergovernmental - Other: $42,000 ($1.61)
Miscellaneous - General Revenue - Other: $1,327,000 ($50.83)
Fines and Forfeits: $838,000 ($32.10)Interest Earnings: $335,000 ($12.83)Revenue - Water Utilities: $10,317,000 ($395.21)
State Intergovernmental - General Local Government Support: $7,449,000 ($285.35)
Highways: $680,000 ($26.05)Other: $65,000 ($2.49)Tax - Property: $6,700,000 ($256.66)
Other License: $1,207,000 ($46.24)Public Utilities Sales: $745,000 ($28.54)
Lockport government finances - Debt in 2018 (per resident):
Long Term Debt - Beginning Outstanding - Unspecified Public Purpose: $34,746,000 ($1331.01)
Outstanding Unspecified Public Purpose: $33,610,000 ($1287.49)Retired Unspecified Public Purpose: $5,481,000 ($209.96)Issue, Unspecified Public Purpose: $4,345,000 ($166.44)
Lockport government finances - Cash and Securities in 2018 (per resident):
Other Funds - Cash and Securities: $37,464,000 ($1435.13)
6.75% of this county's 2021 resident taxpayers lived in other counties in 2020 ($73,828 average adjusted gross income )
Here:
6.75%Illinois average:
5.09%
0.01% of residents moved from foreign countries ($43 average AGI )Will County:
0.01%Illinois average:
0.01%
Top counties from which taxpayers relocated into this county between 2020 and 2021:
6.85% of this county's 2020 resident taxpayers moved to other counties in 2021 ($78,688 average adjusted gross income )
Here:
6.85%Illinois average:
6.10%
0.01% of residents moved to foreign countries ($42 average AGI )Will County:
0.01%Illinois average:
0.01%
Top counties to which taxpayers relocated from this county between 2020 and 2021:
Businesses in Lockport, IL
Name Count Name Count
AT&T 1 Lane Furniture 1 Ace Hardware 1 MasterBrand Cabinets 1 Advance Auto Parts 1 McDonald's 1 AutoZone 1 Pizza Hut 1 Blockbuster 1 Quiznos 1 Burger King 1 SONIC Drive-In 1 CVS 1 Sprint Nextel 1 Cold Stone Creamery 1 Starbucks 2 DHL 1 Subway 3 Dairy Queen 1 T-Mobile 2 Dunkin Donuts 1 Taco Bell 1 FedEx 3 U-Haul 1 GameStop 1 U.S. Cellular 1 H&R Block 1 UPS 5 Jewel-Osco 1 Walgreens 1 Jimmy John's 1 Walmart 1 KFC 1
Strongest AM radio stations in Lockport:
WYLL (1160 AM; 50 kW; CHICAGO, IL; Owner: SCA LICENSE CORPORATION)
WLS (890 AM; 50 kW; CHICAGO, IL; Owner: WLS, INC.)
WMVP (1000 AM; 50 kW; CHICAGO, IL; Owner: ABC, INC.)
WSCR (670 AM; 50 kW; CHICAGO, IL; Owner: INFINITY BROADCASTING OPERATIONS, INC.)
WAGG (610 AM; BIRMINGHAM, AL; Owner: CXR HOLDINGS, INC.)
WBBM (780 AM; 50 kW; CHICAGO, IL; Owner: INFINITY BROADCASTING OPERATIONS, INC.)
WGN (720 AM; 50 kW; CHICAGO, IL; Owner: WGN CONTINENTAL BROADCASTING CO.)
WJOL (1340 AM; 1 kW; JOLIET, IL; Owner: NM LICENSING, LLC)
WVIV (1200 AM; 20 kW; CHICAGO, IL; Owner: WLXX-AM LICENSE CORP.)
WWHN (1510 AM; daytime; 1 kW; JOLIET, IL; Owner: HAWKINS BROADCASTING COMPANY)
WRDZ (1300 AM; 4 kW; LA GRANGE, IL; Owner: ABC, INC.)
WTMJ (620 AM; 50 kW; MILWAUKEE, WI; Owner: JOURNAL BROADCAST CORPORATION)
WAUR (930 AM; 4 kW; SANDWICH, IL; Owner: CHRISTIAN BROADCASTING SYSTEM, LTD.)
Strongest FM radio stations in Lockport:
WJTW (93.5 FM; JOLIET, IL; Owner: NM LICENSING, LLC)
WLRA (88.1 FM; LOCKPORT, IL; Owner: LEWIS UNIVERSITY)
WLLI-FM (96.7 FM; JOLIET, IL; Owner: NM LICENSING, LLC)
WLEY-FM (107.9 FM; AURORA, IL; Owner: WLEY LICENSING, INC.)
WCKG (105.9 FM; ELMWOOD PARK, IL; Owner: INFINITY HOLDINGS CORPORATION OF ORLANDO)
WLIT-FM (93.9 FM; CHICAGO, IL; Owner: AMFM RADIO LICENSES, L.L.C.)
WJMK (104.3 FM; CHICAGO, IL; Owner: INFINITY BROADCASTING CORP. OF ILLINOIS)
WNUA (95.5 FM; CHICAGO, IL; Owner: AMFM RADIO LICENSES, L.L.C.)
WTMX (101.9 FM; SKOKIE, IL; Owner: BONNEVILLE HOLDING COMPANY)
WBBM-FM (96.3 FM; CHICAGO, IL; Owner: INFINITY BROADCASTING OPERATIONS, INC.)
WKSC-FM (103.5 FM; CHICAGO, IL; Owner: AMFM RADIO LICENSES, L.L.C.)
WFMT (98.7 FM; CHICAGO, IL; Owner: WINDOW TO THE WORLD COMMUNICATIONS)
WGCI-FM (107.5 FM; CHICAGO, IL; Owner: AMFM RADIO LICENSES, L.L.C.)
WZZN (94.7 FM; CHICAGO, IL; Owner: ABC CHICAGO FM RADIO,INC.)
WCSF (88.7 FM; JOLIET, IL; Owner: COLLEGE OF ST. FRANCIS)
WCCQ (98.3 FM; CREST HILL, IL; Owner: THREE EAGLES OF JOLIET, INC.)
WBEZ (91.5 FM; CHICAGO, IL; Owner: THE WBEZ ALLIANCE, INC.)
WKQX (101.1 FM; CHICAGO, IL; Owner: EMMIS RADIO LICENSE CORPORATION)
WLUP-FM (97.9 FM; CHICAGO, IL; Owner: BONNEVILLE HOLDING COMPANY)
WNND (100.3 FM; CHICAGO, IL; Owner: BONNEVILLE HOLDING COMPANY)
TV broadcast stations around Lockport:
WLS-TV (Channel 7; CHICAGO, IL; Owner: WLS TELEVISION, INC.)
WMAQ-TV (Channel 5; CHICAGO, IL; Owner: NBC SUBSIDIARY (WMAQ-TV), INC.)
WTTW (Channel 11; CHICAGO, IL; Owner: WINDOW TO THE WORLD COMMUNICATIONS, INC.)
WGN-TV (Channel 9; CHICAGO, IL; Owner: WGN CONTINENTAL BROADCASTING COMPANY)
WGBO-TV (Channel 66; JOLIET, IL; Owner: WGBO LICENSE PARTNERSHIP, G.P.)
WBBM-TV (Channel 2; CHICAGO, IL; Owner: CBS BROADCASTING INC.)
WPWR-TV (Channel 50; GARY, IN; Owner: FOX TELEVISION STATIONS, INC.)
WXFT (Channel 60; AURORA, IL; Owner: TELEFUTURA CHICAGO LLC)
WCIU-TV (Channel 26; CHICAGO, IL; Owner: WCIU-TV LIMITED PARTNERSHIP)
WCPX (Channel 38; CHICAGO, IL; Owner: PAXSON CHICAGO LICENSE, INC.)
WFLD (Channel 32; CHICAGO, IL; Owner: FOX TELEVISION STATIONS, INC.)
W68DO (Channel 68; PALATINE, IL; Owner: TRINITY BROADCASTING NETWORK)
WFBT-CA (Channel 23; CHICAGO, IL; Owner: CHANNEL 23 LIMITED PARTNERSHIP)
W54AP (Channel 54; BLUE ISLAND, IL; Owner: CATHOLIC VIEWS BROADCASTS, INC.)
WJYS (Channel 62; HAMMOND, IN; Owner: JOVON BROADCASTING CORPORATION)
WSNS-TV (Channel 44; CHICAGO, IL; Owner: TELEMUNDO OF CHICAGO, INC.)
WYIN (Channel 56; GARY, IN; Owner: NORTHWEST INDIANA PUBLIC BROADCASTING, INC.)
WOCH-LP (Channel 28; CHICAGO, IL; Owner: KM LPTV OF CHICAGO-28, L.L.C.)
WYCC (Channel 20; CHICAGO, IL; Owner: COLLEGE DIST. #508, COUNTY OF COOK)
W34CK (Channel 34; ARLINGTON HEIGHTS, IL; Owner: FIRST UNITED, INC.)
WOCK-CA (Channel 13; CHICAGO, IL; Owner: KM LPTV OF CHICAGO-13, L.L.C.)
W24AJ (Channel 24; AURORA, IL; Owner: NELSON TV, INC.)
W64CQ (Channel 64; ARLINGTON HEIGHTS, IL; Owner: TRINITY BROADCASTING NETWORK)
WWTO-TV (Channel 35; LASALLE, IL; Owner: TRINITY BROADCASTING NETWORK)
WSPY-LP (Channel 30; PLANO, IL; Owner: WSPY-TV, INC.)
National Bridge Inventory (NBI) Statistics 44 Number of bridges955ft / 291m Total length $1,302,000 Total costs760,375 Total average daily traffic110,898 Total average daily truck traffic
New bridges - historical statistics
2 1950-1959 5 1960-1969 3 1970-1979 2 1980-1989 3 1990-1999 26 2000-2009 3 2010-2019
See full National Bridge Inventory statistics for Lockport, IL
Home Mortgage Disclosure Act Aggregated Statistics For Year 2009(Based on 4 partial tracts) A) FHA, FSA/RHS & VA B) Conventional C) Refinancings D) Home Improvement Loans E) Loans on Dwellings For 5+ Families F) Non-occupant Loans on G) Loans On Manufactured Number Average Value Number Average Value Number Average Value Number Average Value Number Average Value Number Average Value Number Average Value
LOANS ORIGINATED 47 $179,452 45 $189,669 370 $189,253 10 $73,789 3 $269,523 10 $129,472 1 $197,210 APPLICATIONS APPROVED, NOT ACCEPTED 3 $205,060 3 $226,270 32 $185,868 0 $0 0 $0 0 $0 0 $0 APPLICATIONS DENIED 5 $141,552 8 $141,636 102 $194,961 9 $22,736 0 $0 4 $117,760 0 $0 APPLICATIONS WITHDRAWN 5 $177,028 5 $200,884 44 $193,944 1 $103,360 0 $0 1 $145,940 0 $0 FILES CLOSED FOR INCOMPLETENESS 1 $143,900 0 $0 19 $193,353 0 $0 0 $0 0 $0 0 $0
Aggregated Statistics For Year 2008(Based on 4 partial tracts) A) FHA, FSA/RHS & VA B) Conventional C) Refinancings D) Home Improvement Loans E) Loans on Dwellings For 5+ Families F) Non-occupant Loans on Number Average Value Number Average Value Number Average Value Number Average Value Number Average Value Number Average Value
LOANS ORIGINATED 34 $188,422 93 $194,166 234 $190,418 17 $52,559 4 $371,870 25 $119,271 APPLICATIONS APPROVED, NOT ACCEPTED 2 $198,025 7 $249,676 35 $206,544 5 $69,248 0 $0 1 $146,150 APPLICATIONS DENIED 4 $180,222 21 $173,040 103 $197,280 19 $61,199 0 $0 9 $106,952 APPLICATIONS WITHDRAWN 5 $170,914 12 $216,304 49 $198,131 3 $60,967 0 $0 4 $121,645 FILES CLOSED FOR INCOMPLETENESS 1 $239,500 3 $193,337 18 $190,900 1 $152,410 0 $0 1 $267,080
Aggregated Statistics For Year 2007(Based on 4 partial tracts) A) FHA, FSA/RHS & VA B) Conventional C) Refinancings D) Home Improvement Loans E) Loans on Dwellings For 5+ Families F) Non-occupant Loans on Number Average Value Number Average Value Number Average Value Number Average Value Number Average Value Number Average Value
LOANS ORIGINATED 17 $193,665 276 $186,132 312 $174,486 52 $87,520 2 $551,090 54 $134,354 APPLICATIONS APPROVED, NOT ACCEPTED 0 $0 33 $171,135 54 $174,233 9 $88,037 0 $0 5 $138,426 APPLICATIONS DENIED 3 $160,607 34 $219,871 140 $181,418 23 $102,288 1 $694,650 16 $160,378 APPLICATIONS WITHDRAWN 1 $162,090 33 $155,722 63 $180,938 5 $139,718 0 $0 8 $107,569 FILES CLOSED FOR INCOMPLETENESS 0 $0 5 $234,892 35 $202,169 2 $113,090 0 $0 2 $106,035
Aggregated Statistics For Year 2006(Based on 4 partial tracts) A) FHA, FSA/RHS & VA B) Conventional C) Refinancings D) Home Improvement Loans E) Loans on Dwellings For 5+ Families F) Non-occupant Loans on Number Average Value Number Average Value Number Average Value Number Average Value Number Average Value Number Average Value
LOANS ORIGINATED 13 $204,797 391 $168,217 361 $166,968 47 $50,699 1 $1,205,570 62 $145,651 APPLICATIONS APPROVED, NOT ACCEPTED 1 $242,800 49 $163,478 72 $148,062 10 $81,582 1 $1,528,230 9 $147,290 APPLICATIONS DENIED 1 $140,240 64 $154,928 168 $173,292 23 $60,473 0 $0 14 $137,386 APPLICATIONS WITHDRAWN 1 $241,420 49 $135,301 87 $170,686 3 $125,077 0 $0 9 $114,319 FILES CLOSED FOR INCOMPLETENESS 0 $0 9 $170,314 45 $180,682 1 $38,920 0 $0 3 $130,317
Aggregated Statistics For Year 2005(Based on 4 partial tracts) A) FHA, FSA/RHS & VA B) Conventional C) Refinancings D) Home Improvement Loans E) Loans on Dwellings For 5+ Families F) Non-occupant Loans on G) Loans On Manufactured Number Average Value Number Average Value Number Average Value Number Average Value Number Average Value Number Average Value Number Average Value
LOANS ORIGINATED 18 $174,627 474 $166,715 375 $160,147 42 $68,407 2 $281,815 65 $137,131 1 $7,410 APPLICATIONS APPROVED, NOT ACCEPTED 0 $0 54 $160,364 61 $160,537 7 $52,273 1 $156,530 6 $93,283 0 $0 APPLICATIONS DENIED 2 $209,660 75 $141,384 175 $165,439 24 $51,923 0 $0 15 $150,325 2 $58,815 APPLICATIONS WITHDRAWN 2 $122,755 33 $146,042 108 $180,762 10 $119,489 0 $0 11 $138,208 0 $0 FILES CLOSED FOR INCOMPLETENESS 1 $278,640 20 $118,627 39 $159,452 3 $117,817 0 $0 6 $81,505 0 $0
Aggregated Statistics For Year 2004(Based on 4 partial tracts) A) FHA, FSA/RHS & VA B) Conventional C) Refinancings D) Home Improvement Loans E) Loans on Dwellings For 5+ Families F) Non-occupant Loans on G) Loans On Manufactured Number Average Value Number Average Value Number Average Value Number Average Value Number Average Value Number Average Value Number Average Value
LOANS ORIGINATED 30 $166,618 415 $167,125 369 $152,320 36 $51,144 3 $479,933 39 $161,092 0 $0 APPLICATIONS APPROVED, NOT ACCEPTED 5 $161,788 47 $153,978 54 $162,390 8 $53,699 0 $0 9 $128,046 1 $222,290 APPLICATIONS DENIED 5 $174,128 56 $139,509 183 $138,243 27 $40,173 0 $0 10 $126,843 0 $0 APPLICATIONS WITHDRAWN 5 $177,254 39 $153,499 112 $153,114 8 $55,028 0 $0 7 $167,400 0 $0 FILES CLOSED FOR INCOMPLETENESS 1 $222,170 9 $156,868 30 $179,495 4 $51,692 0 $0 2 $74,215 0 $0
Aggregated Statistics For Year 2003(Based on 4 partial tracts) A) FHA, FSA/RHS & VA B) Conventional C) Refinancings D) Home Improvement Loans E) Loans on Dwellings For 5+ Families F) Non-occupant Loans on Number Average Value Number Average Value Number Average Value Number Average Value Number Average Value Number Average Value
LOANS ORIGINATED 66 $169,441 313 $152,749 797 $135,308 24 $30,440 0 $0 45 $116,979 APPLICATIONS APPROVED, NOT ACCEPTED 2 $183,095 34 $165,931 84 $130,118 6 $30,380 0 $0 7 $142,673 APPLICATIONS DENIED 3 $168,340 20 $138,545 195 $123,696 21 $29,402 1 $95,470 13 $100,268 APPLICATIONS WITHDRAWN 6 $160,135 29 $157,618 138 $136,464 6 $43,793 0 $0 7 $137,904 FILES CLOSED FOR INCOMPLETENESS 2 $181,035 7 $149,683 22 $150,855 2 $26,090 0 $0 1 $71,460
Aggregated Statistics For Year 2002(Based on 4 partial tracts) A) FHA, FSA/RHS & VA B) Conventional C) Refinancings D) Home Improvement Loans E) Loans on Dwellings For 5+ Families F) Non-occupant Loans on Number Average Value Number Average Value Number Average Value Number Average Value Number Average Value Number Average Value
LOANS ORIGINATED 37 $145,374 198 $139,366 487 $133,093 25 $27,949 3 $242,447 36 $111,184 APPLICATIONS APPROVED, NOT ACCEPTED 2 $154,015 14 $163,809 62 $121,402 6 $22,120 0 $0 1 $87,680 APPLICATIONS DENIED 6 $126,565 14 $119,264 105 $105,456 10 $14,566 0 $0 6 $82,365 APPLICATIONS WITHDRAWN 6 $138,883 15 $134,214 82 $126,789 1 $59,490 0 $0 1 $235,810 FILES CLOSED FOR INCOMPLETENESS 0 $0 4 $159,872 18 $125,697 1 $33,270 0 $0 0 $0
Aggregated Statistics For Year 2001(Based on 4 partial tracts) A) FHA, FSA/RHS & VA B) Conventional C) Refinancings D) Home Improvement Loans E) Loans on Dwellings For 5+ Families F) Non-occupant Loans on Number Average Value Number Average Value Number Average Value Number Average Value Number Average Value Number Average Value
LOANS ORIGINATED 39 $135,091 208 $128,628 433 $121,479 46 $20,957 1 $342,690 21 $77,605 APPLICATIONS APPROVED, NOT ACCEPTED 3 $145,510 14 $135,619 43 $108,562 12 $42,160 0 $0 3 $29,077 APPLICATIONS DENIED 4 $159,595 14 $99,101 106 $97,988 28 $26,023 0 $0 4 $74,620 APPLICATIONS WITHDRAWN 4 $134,148 16 $145,782 74 $104,336 6 $26,475 0 $0 3 $54,083 FILES CLOSED FOR INCOMPLETENESS 0 $0 2 $143,040 23 $105,863 0 $0 0 $0 1 $156,520
Aggregated Statistics For Year 2000(Based on 4 partial tracts) A) FHA, FSA/RHS & VA B) Conventional C) Refinancings D) Home Improvement Loans E) Loans on Dwellings For 5+ Families F) Non-occupant Loans on Number Average Value Number Average Value Number Average Value Number Average Value Number Average Value Number Average Value
LOANS ORIGINATED 57 $121,149 212 $125,407 119 $91,434 57 $20,308 1 $473,730 12 $112,594 APPLICATIONS APPROVED, NOT ACCEPTED 2 $133,070 12 $132,218 24 $82,781 12 $28,352 0 $0 1 $71,500 APPLICATIONS DENIED 6 $145,392 37 $110,828 71 $79,039 31 $29,856 0 $0 7 $97,730 APPLICATIONS WITHDRAWN 5 $91,892 24 $106,417 39 $63,449 7 $32,343 0 $0 3 $67,963 FILES CLOSED FOR INCOMPLETENESS 0 $0 5 $130,744 23 $85,383 1 $35,840 0 $0 1 $29,990
Aggregated Statistics For Year 1999(Based on 4 partial tracts) A) FHA, FSA/RHS & VA B) Conventional C) Refinancings D) Home Improvement Loans E) Loans on Dwellings For 5+ Families F) Non-occupant Loans on Number Average Value Number Average Value Number Average Value Number Average Value Number Average Value Number Average Value
LOANS ORIGINATED 54 $112,721 179 $126,491 200 $98,764 44 $19,074 3 $132,850 19 $77,461 APPLICATIONS APPROVED, NOT ACCEPTED 1 $51,670 21 $110,348 43 $91,487 10 $18,696 0 $0 8 $92,729 APPLICATIONS DENIED 4 $115,568 25 $88,506 100 $102,494 29 $22,662 0 $0 8 $68,605 APPLICATIONS WITHDRAWN 3 $125,773 13 $122,558 58 $100,461 6 $33,777 0 $0 0 $0 FILES CLOSED FOR INCOMPLETENESS 0 $0 4 $115,000 21 $112,410 1 $21,270 0 $0 2 $72,385
Detailed HMDA statistics for the following Tracts:
8805.02
, 8806.00 , 8807.00 , 8810.04
Private Mortgage Insurance Companies Aggregated Statistics For Year 2009(Based on 4 partial tracts) A) Conventional B) Refinancings Number Average Value Number Average Value
LOANS ORIGINATED 11 $241,187 7 $237,434 APPLICATIONS APPROVED, NOT ACCEPTED 2 $253,205 2 $166,500 APPLICATIONS DENIED 3 $210,153 3 $262,400 APPLICATIONS WITHDRAWN 1 $345,030 0 $0 FILES CLOSED FOR INCOMPLETENESS 0 $0 0 $0
Aggregated Statistics For Year 2008(Based on 4 partial tracts) A) Conventional B) Refinancings C) Non-occupant Loans on Number Average Value Number Average Value Number Average Value
LOANS ORIGINATED 36 $198,261 19 $219,889 1 $161,040 APPLICATIONS APPROVED, NOT ACCEPTED 11 $189,835 8 $237,116 1 $80,630 APPLICATIONS DENIED 2 $211,025 3 $208,697 1 $86,800 APPLICATIONS WITHDRAWN 1 $220,220 2 $250,225 0 $0 FILES CLOSED FOR INCOMPLETENESS 1 $142,470 3 $233,500 0 $0
Aggregated Statistics For Year 2007(Based on 4 partial tracts) A) Conventional B) Refinancings C) Non-occupant Loans on Number Average Value Number Average Value Number Average Value
LOANS ORIGINATED 56 $195,985 31 $208,813 3 $153,567 APPLICATIONS APPROVED, NOT ACCEPTED 9 $199,748 6 $270,745 2 $124,190 APPLICATIONS DENIED 1 $347,120 0 $0 1 $304,720 APPLICATIONS WITHDRAWN 2 $228,945 2 $204,660 0 $0 FILES CLOSED FOR INCOMPLETENESS 0 $0 0 $0 0 $0
Aggregated Statistics For Year 2006(Based on 4 partial tracts) A) Conventional B) Refinancings C) Non-occupant Loans on Number Average Value Number Average Value Number Average Value
LOANS ORIGINATED 48 $190,345 18 $216,248 4 $150,200 APPLICATIONS APPROVED, NOT ACCEPTED 10 $209,457 5 $223,086 1 $157,450 APPLICATIONS DENIED 4 $218,228 4 $281,002 2 $189,870 APPLICATIONS WITHDRAWN 5 $237,906 3 $156,320 0 $0 FILES CLOSED FOR INCOMPLETENESS 0 $0 0 $0 0 $0
Aggregated Statistics For Year 2005(Based on 4 partial tracts) A) Conventional B) Refinancings C) Non-occupant Loans on Number Average Value Number Average Value Number Average Value
LOANS ORIGINATED 71 $199,188 23 $186,504 4 $168,072 APPLICATIONS APPROVED, NOT ACCEPTED 10 $226,116 6 $160,268 1 $107,040 APPLICATIONS DENIED 1 $305,050 0 $0 0 $0 APPLICATIONS WITHDRAWN 4 $212,930 2 $144,170 0 $0 FILES CLOSED FOR INCOMPLETENESS 0 $0 0 $0 0 $0
Aggregated Statistics For Year 2004(Based on 4 partial tracts) A) Conventional B) Refinancings C) Non-occupant Loans on Number Average Value Number Average Value Number Average Value
LOANS ORIGINATED 133 $196,289 37 $175,267 3 $91,673 APPLICATIONS APPROVED, NOT ACCEPTED 27 $194,315 14 $146,881 2 $95,860 APPLICATIONS DENIED 2 $203,890 0 $0 0 $0 APPLICATIONS WITHDRAWN 6 $179,475 5 $150,026 1 $192,930 FILES CLOSED FOR INCOMPLETENESS 0 $0 0 $0 0 $0
Aggregated Statistics For Year 2003(Based on 4 partial tracts) A) Conventional B) Refinancings C) Non-occupant Loans on Number Average Value Number Average Value Number Average Value
LOANS ORIGINATED 115 $168,316 71 $156,240 8 $105,214 APPLICATIONS APPROVED, NOT ACCEPTED 15 $172,010 15 $144,714 3 $129,800 APPLICATIONS DENIED 1 $230,940 0 $0 0 $0 APPLICATIONS WITHDRAWN 4 $207,552 2 $119,115 0 $0 FILES CLOSED FOR INCOMPLETENESS 0 $0 0 $0 0 $0
Aggregated Statistics For Year 2002(Based on 4 partial tracts) A) Conventional B) Refinancings C) Non-occupant Loans on Number Average Value Number Average Value Number Average Value
LOANS ORIGINATED 98 $149,493 44 $145,966 2 $138,335 APPLICATIONS APPROVED, NOT ACCEPTED 9 $176,899 5 $133,498 1 $97,890 APPLICATIONS DENIED 0 $0 1 $204,070 0 $0 APPLICATIONS WITHDRAWN 3 $193,713 4 $126,562 0 $0 FILES CLOSED FOR INCOMPLETENESS 0 $0 0 $0 0 $0
Aggregated Statistics For Year 2001(Based on 4 partial tracts) A) Conventional B) Refinancings C) Non-occupant Loans on Number Average Value Number Average Value Number Average Value
LOANS ORIGINATED 69 $145,692 34 $139,946 3 $69,127 APPLICATIONS APPROVED, NOT ACCEPTED 9 $158,738 9 $127,292 0 $0 APPLICATIONS DENIED 2 $87,525 1 $111,990 0 $0 APPLICATIONS WITHDRAWN 1 $64,350 2 $141,170 0 $0 FILES CLOSED FOR INCOMPLETENESS 0 $0 0 $0 0 $0
Aggregated Statistics For Year 2000(Based on 4 partial tracts) A) Conventional B) Refinancings C) Non-occupant Loans on Number Average Value Number Average Value Number Average Value
LOANS ORIGINATED 74 $139,421 6 $113,400 2 $138,715 APPLICATIONS APPROVED, NOT ACCEPTED 7 $148,149 1 $190,960 1 $122,260 APPLICATIONS DENIED 2 $118,680 0 $0 0 $0 APPLICATIONS WITHDRAWN 3 $189,797 1 $94,440 0 $0 FILES CLOSED FOR INCOMPLETENESS 2 $92,060 0 $0 0 $0
Aggregated Statistics For Year 1999(Based on 4 partial tracts) A) Conventional B) Refinancings C) Non-occupant Loans on Number Average Value Number Average Value Number Average Value
LOANS ORIGINATED 63 $138,920 20 $134,034 1 $79,870 APPLICATIONS APPROVED, NOT ACCEPTED 6 $165,352 3 $118,723 0 $0 APPLICATIONS DENIED 1 $210,150 3 $147,220 1 $131,630 APPLICATIONS WITHDRAWN 2 $76,220 0 $0 0 $0 FILES CLOSED FOR INCOMPLETENESS 0 $0 1 $95,070 1 $95,070
Detailed PMIC statistics for the following Tracts:
8805.02
, 8806.00 , 8807.00 , 8810.04 Lockport compared to Illinois state average:
Unemployed percentage significantly below state average. Black race population percentage significantly below state average. Median age below state average. Renting percentage below state average. Length of stay since moving in above state average. Number of rooms per house above state average. House age below state average. Percentage of population with a bachelor's degree or higher above state average.
#80 on the list of "Top 101 cities with the most residents born in Poland (population 500+)"
#7 on the list of "Top 101 counties with the lowest percentage of residents relocating from foreign countries between 2010 and 2011"
#10 on the list of "Top 101 counties with the highest percentage of residents that drank alcohol in the past 30 days"
#18 on the list of "Top 101 counties with the largest increase in the number of infant deaths per 1000 residents 2000-2006 to 2007-2013 (pop. 50,000+)"
#19 on the list of "Top 101 counties with the largest decrease in the number of births per 1000 residents 2000-2006 to 2007-2013 (pop 50,000+)"
#48 on the list of "Top 101 counties with the lowest surface withdrawal of fresh water for public supply (pop. 50,000+)"
Top Patent Applicants
Michael J. Connors (29)
David A. Dylkiewicz (13)
John H. Wiker (11)
Scott M. Lesniak (11)
Martin R. Zielke (10)
Roger D. Segroves (9)
Gaston E. Tudury (9)
Satya Kamineni (5)
Robert J. Blaskovitz (5)
Mark D. Klassen (4)
Total of 224 patent applications in 2008-2024.

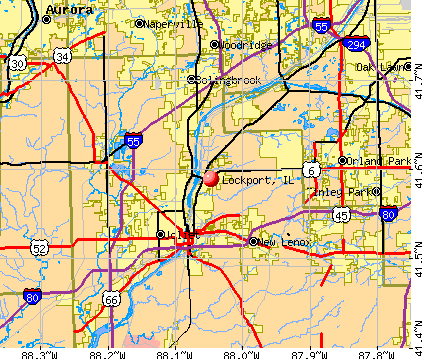


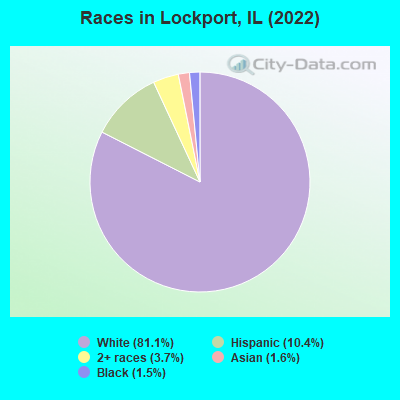
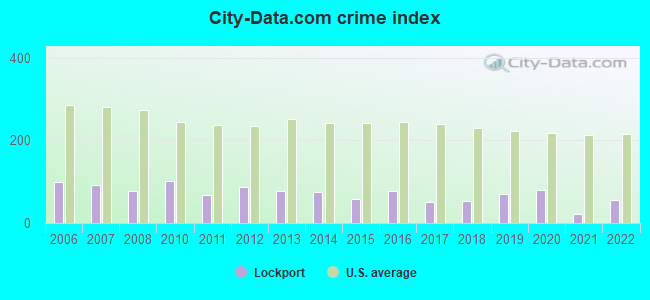
 Recent articles from our blog. Our writers, many of them Ph.D. graduates or candidates, create easy-to-read articles on a wide variety of topics.

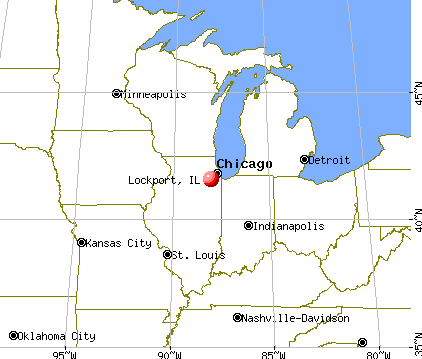
 (5.0 miles
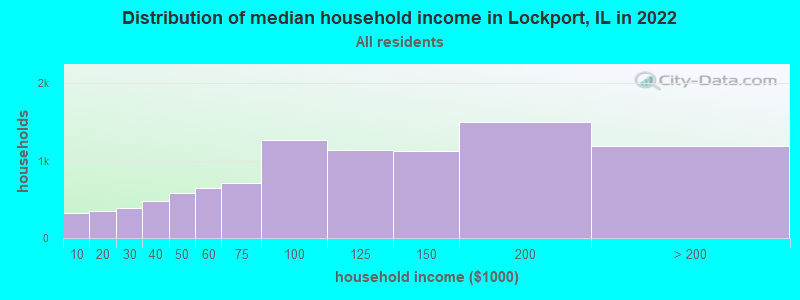
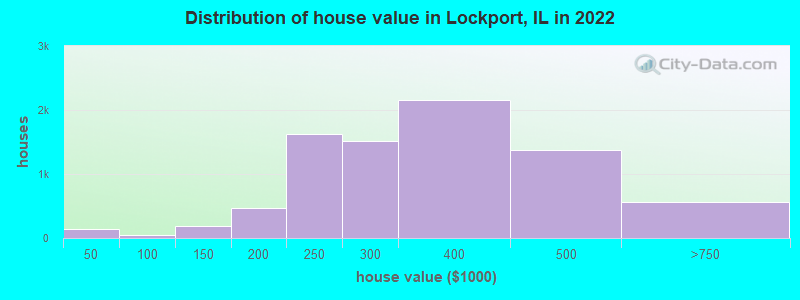
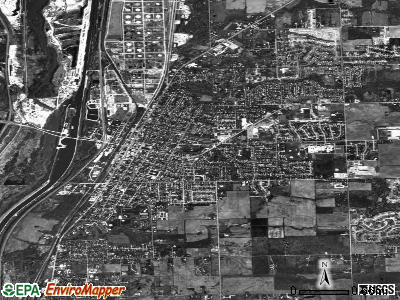
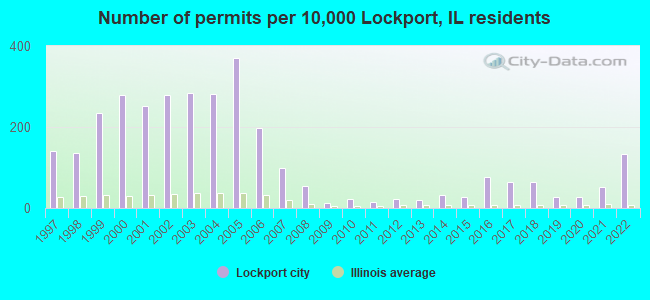
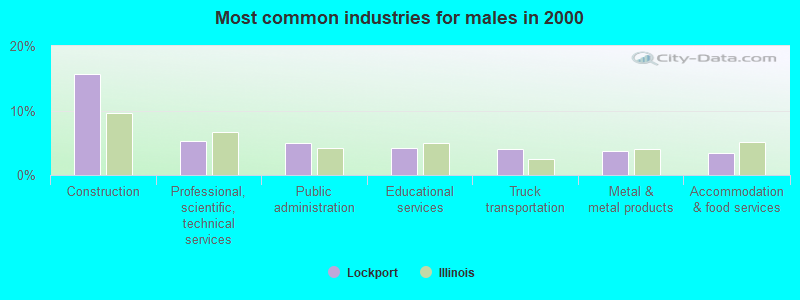
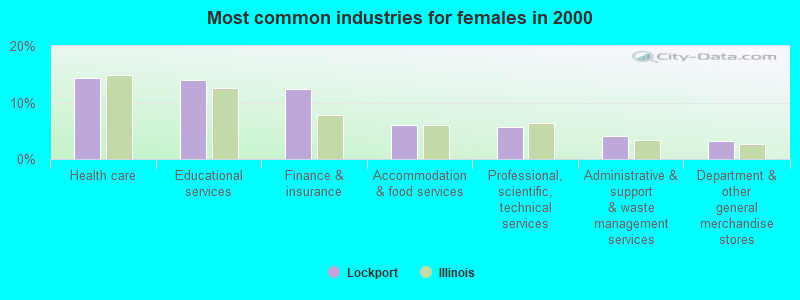
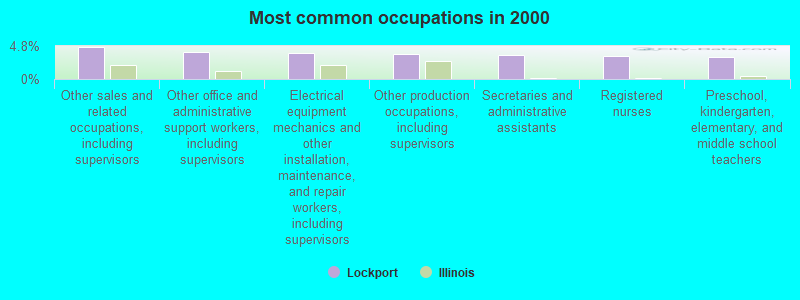
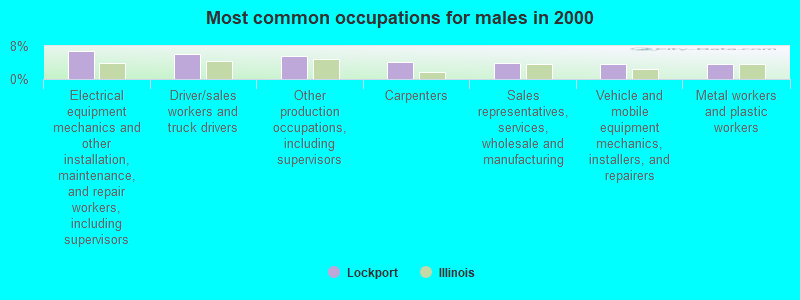
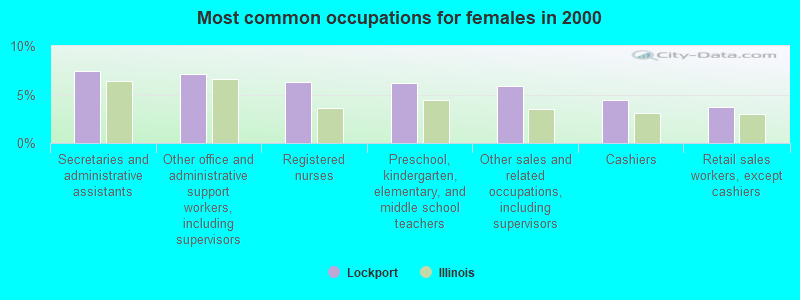
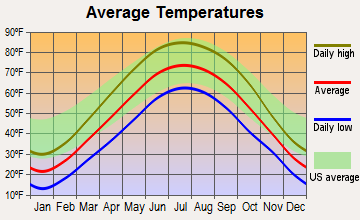
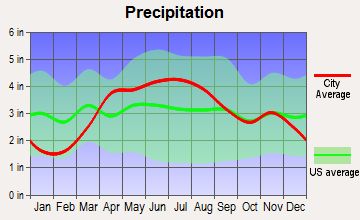
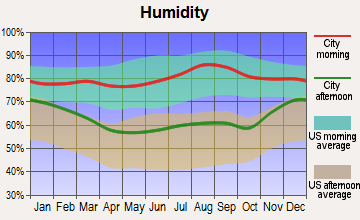
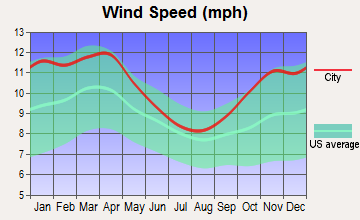
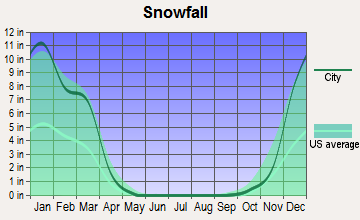
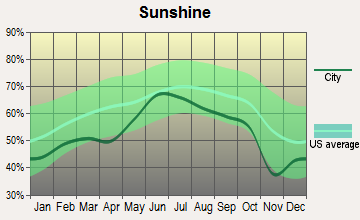
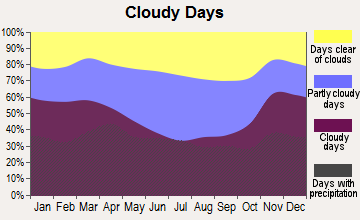
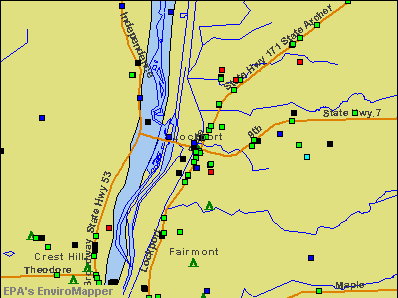

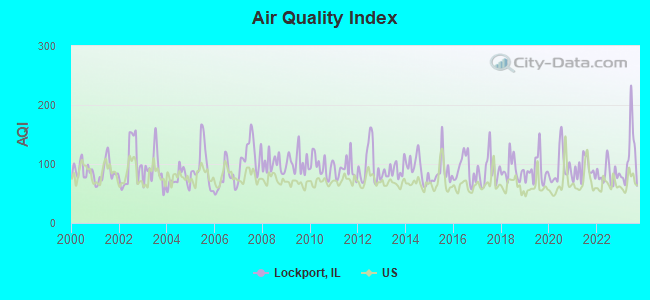
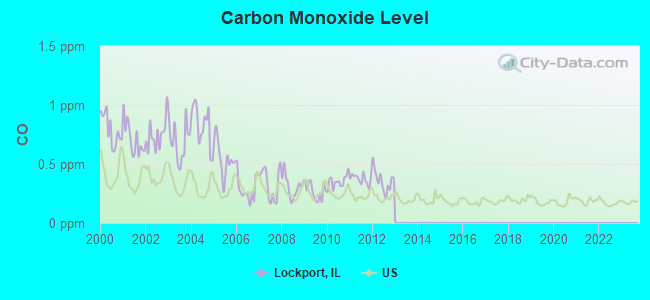
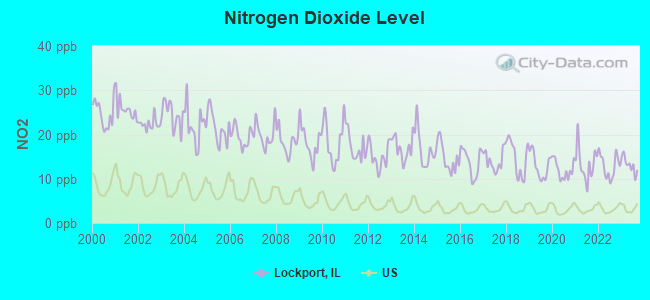
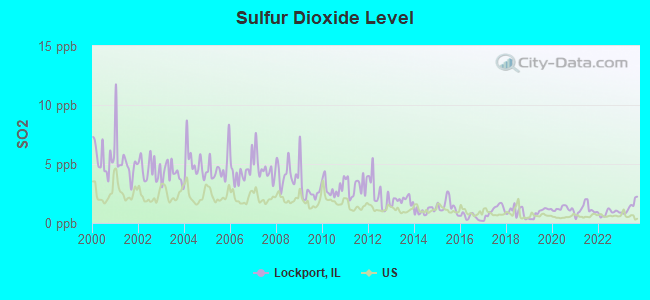
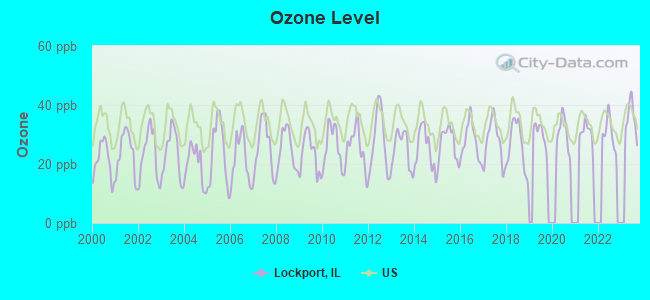
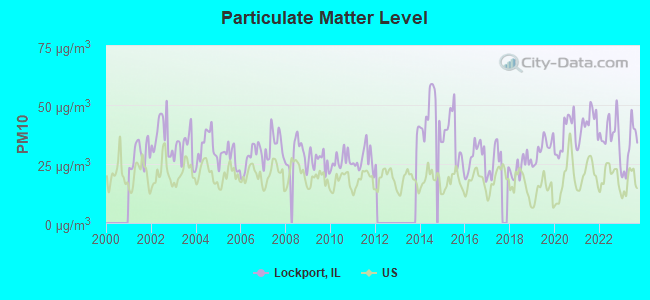
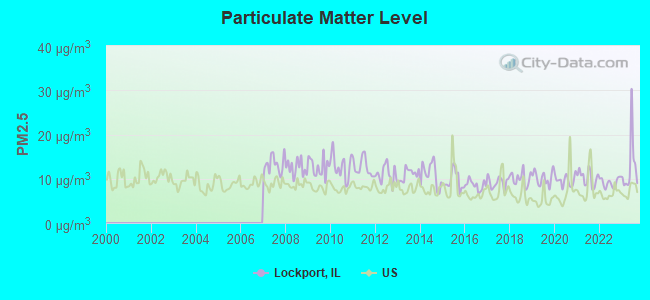
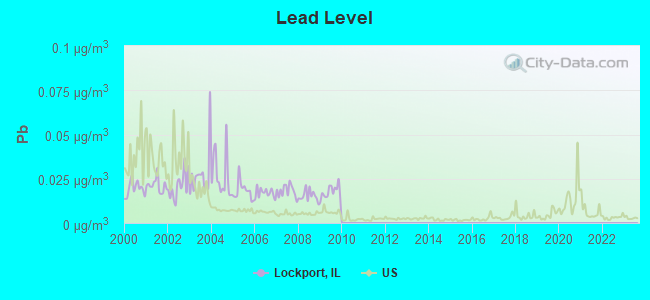

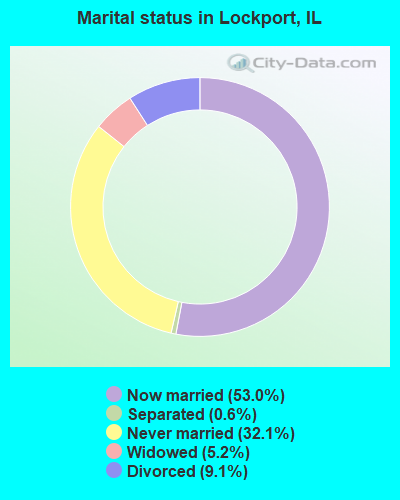
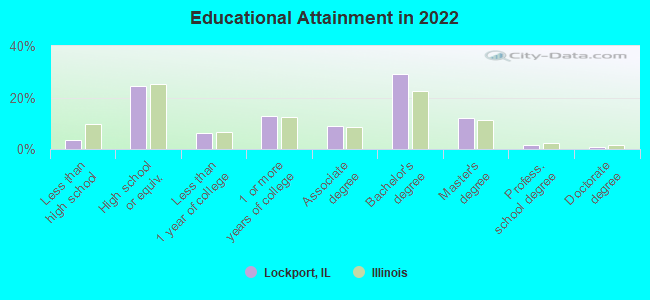
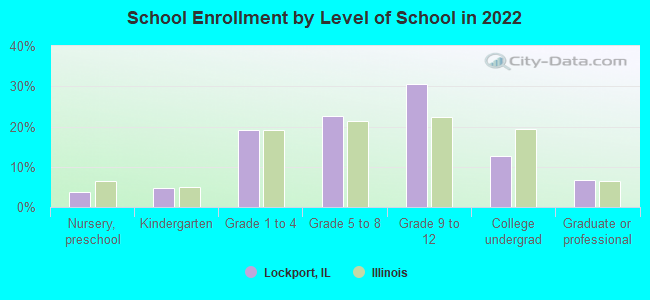
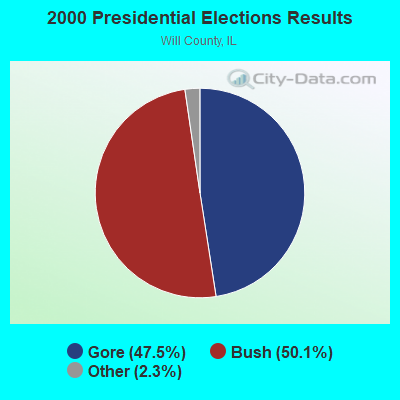
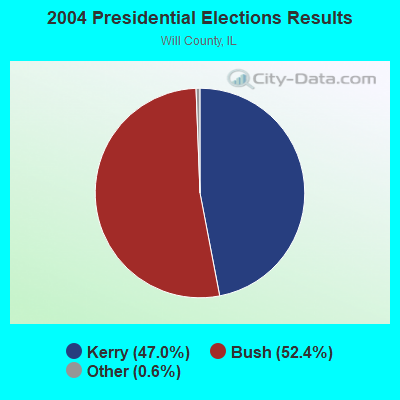
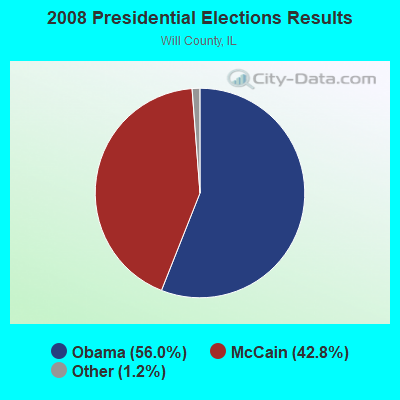
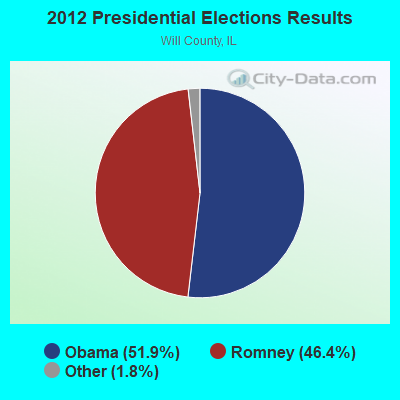
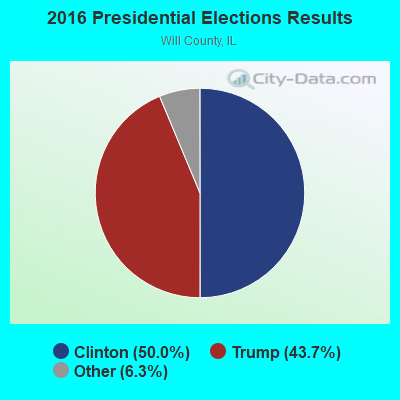
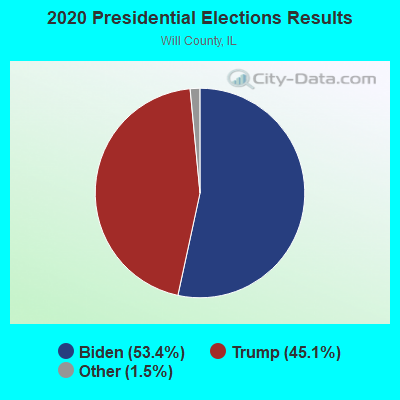
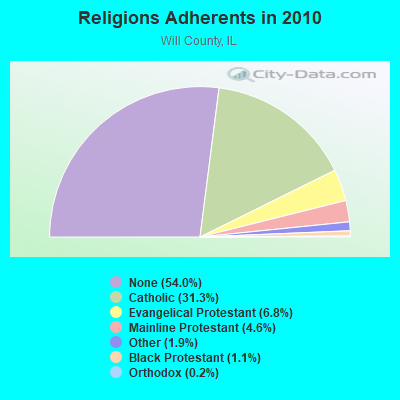
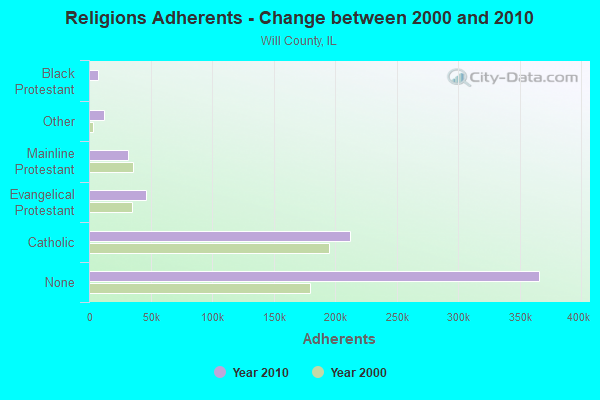
 Based on the data from the years 2002 - 2018 the average number of fires per year is 140. The highest number of reported fires - 209 took place in 2003, and the least - 93 in 2018. The data has a declining trend.
 When looking into fire subcategories, the most reports belonged to: Structure Fires (41.0%), and Outside Fires (39.0%).