Kendall County, Illinois (IL)
County owner-occupied free and clear houses and condos in 2010: 4,234
County owner-occupied houses and condos in 2000: 15,810
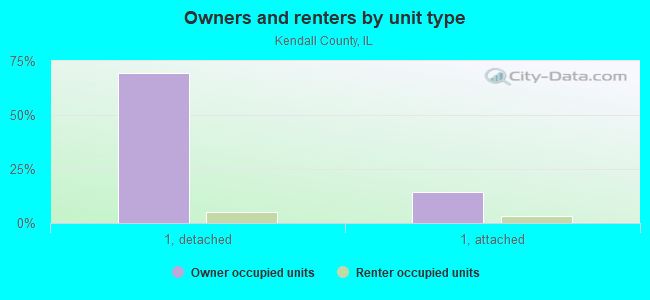
Renter-occupied apartments: 5,468 (it was 2,988 in 2000)
| % of renters here: | 16% |
| State: | 33% |
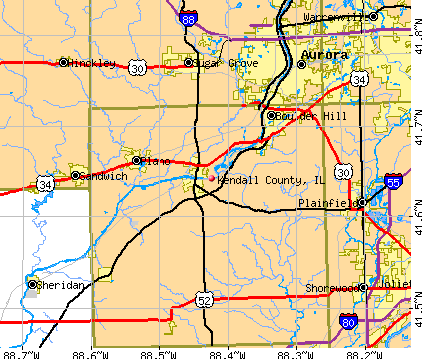
Land area: 321 sq. mi.
Water area: 2.1 sq. mi.
Population density: 428 people per square mile (high).
Industries providing employment: Educational, health and social services (23.7%), Retail trade (13.7%), Professional, scientific, management, administrative, and waste management services (10.5%).
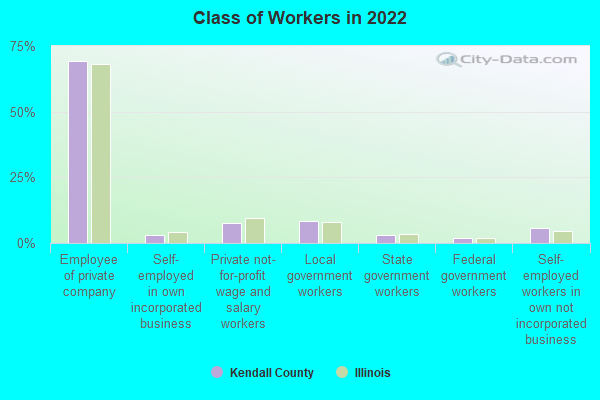
Type of workers:
- Private wage or salary: 81%
- Government: 14%
- Self-employed, not incorporated: 4%
- Unpaid family work: 0%
- OSM Map
- General Map
- Google Map
- MSN Map

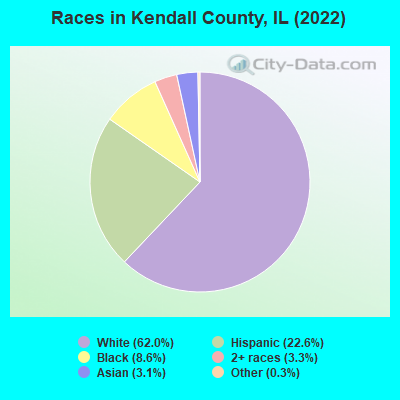
- 85,15662.0%White Non-Hispanic Alone
- 31,08622.6%Hispanic or Latino
- 11,8178.6%Black Non-Hispanic Alone
- 4,5283.3%Two or more races
- 4,2473.1%Asian alone
- 4200.3%Some other race alone
| Median resident age: | 35.0 years |
| Illinois median age: | 39.1 years |
| Males: 67,853 | |
| Females: 69,401 |

 | You just handed Governor Madigan a blank check. (50 replies) |
| Joliet scores big with a new electric vehicle factory to employ 750 (3 replies) |
| Plainfield address with Joliet city services (5 replies) |
| Illinois losing population to other states (90 replies) |
| Chicago's population grew by only 82 residents last year, (135 replies) |
| Single black girl Moving from San Diego to Chicago (29 replies) |
| Kendall County: | 3.0 people |
| Illinois: | 3 people |
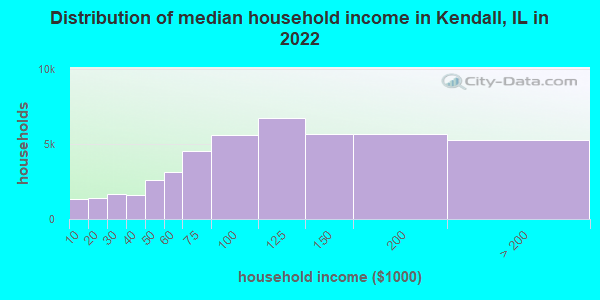
Estimated median household income in 2022: $101,447 ($64,625 in 1999)
| This county: | $101,447 |
| Illinois: | $76,708 |
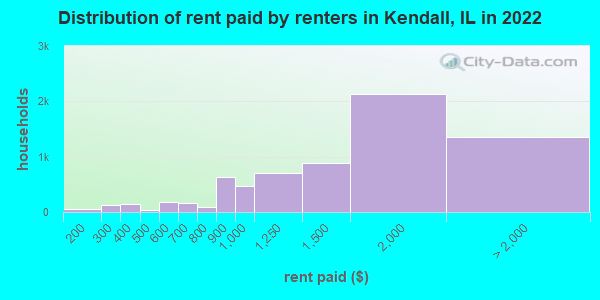
Median contract rent in 2022 for apartments: $1,297 (lower quartile is $845, upper quartile is $1,884)
| This county: | $1297 |
| State: | $1008 |
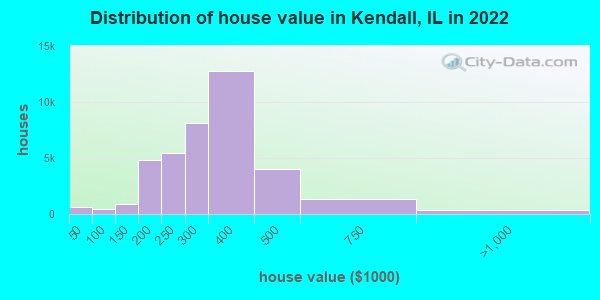
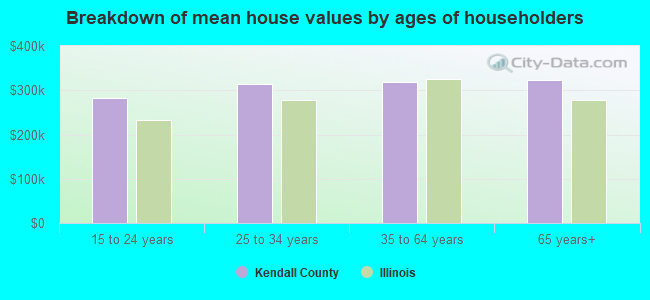
Estimated median house or condo value in 2022: $311,500 (it was $156,100 in 2000)
| Kendall: | $311,500 |
| Illinois: | $251,600 |
Mean price in 2022:
Median monthly housing costs for homes and condos with a mortgage: $2,133Detached houses: $321,597
Here: $321,597 State: $310,164 Townhouses or other attached units: $212,182
Here: $212,182 State: $286,230 In 2-unit structures: $314,684
Here: $314,684 State: $299,638 In 3-to-4-unit structures: $194,158
Here: $194,158 State: $330,907 In 5-or-more-unit structures: $132,379
Here: $132,379 State: $318,887 Mobile homes: $32,523
Here: $32,523 State: $78,855
Median monthly housing costs for units without a mortgage: $951
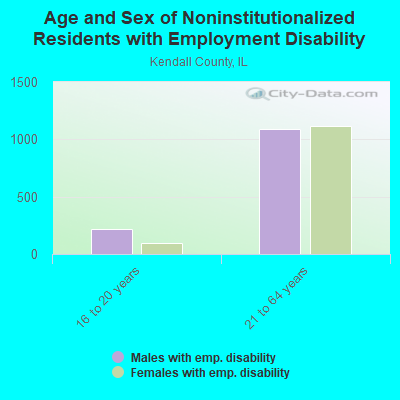
Institutionalized population: 173
Crime in 2021 (reported by the sheriff's office or county police, not the county total):
- Murders: 0
- Rapes: 21
- Robberies: 0
- Assaults: 12
- Burglaries: 39
- Thefts: 124
- Auto thefts: 15
Crime in 2020 (reported by the sheriff's office or county police, not the county total):
- Murders: 1
- Rapes: 8
- Robberies: 2
- Assaults: 7
- Burglaries: 31
- Thefts: 371
- Auto thefts: 18
Health of residents in Kendall County based on CDC Behavioral Risk Factor Surveillance System Survey Questionnaires from 2013 to 2021:
General health status score of residents in this county from 1 (poor) to 5 (excellent) is 3.5. This is about average.73.0% of residents exercised in the past month. This is about average.
40.5% of residents smoked 100+ cigarettes in their lives. This is less than average.
58.1% of adult residents drank alcohol in the past 30 days. This is less than average.
68.0% of residents visited a dentist within the past year. This is about average.
Average weight of males is 197 pounds. This is about average.
Average weight of females is 164 pounds. This is about average.
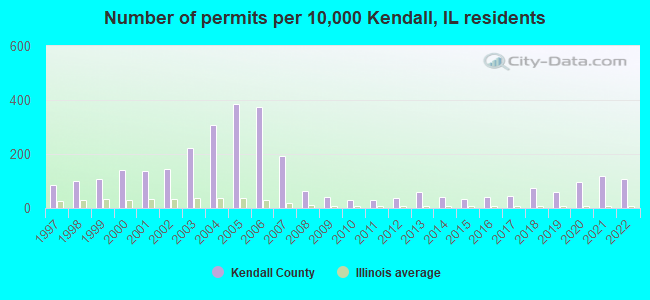
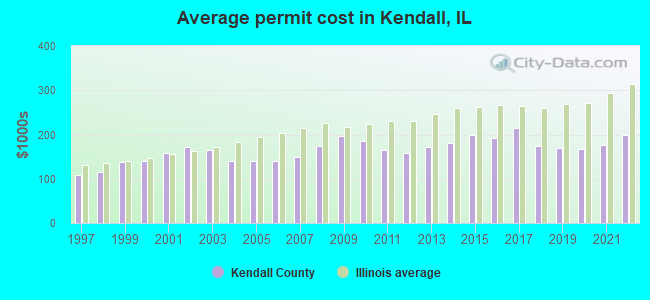
Single-family new house construction building permits:
- 2022: 597 buildings, average cost: $199,700
- 2021: 642 buildings, average cost: $176,100
- 2020: 519 buildings, average cost: $167,300
- 2019: 316 buildings, average cost: $169,400
- 2018: 406 buildings, average cost: $175,200
- 2017: 236 buildings, average cost: $215,400
- 2016: 224 buildings, average cost: $191,400
- 2015: 174 buildings, average cost: $198,100
- 2014: 220 buildings, average cost: $180,700
- 2013: 320 buildings, average cost: $171,200
- 2012: 198 buildings, average cost: $157,900
- 2011: 169 buildings, average cost: $164,300
- 2010: 171 buildings, average cost: $185,600
- 2009: 217 buildings, average cost: $197,300
- 2008: 349 buildings, average cost: $173,400
- 2007: 1048 buildings, average cost: $148,900
- 2006: 2034 buildings, average cost: $140,100
- 2005: 2102 buildings, average cost: $140,500
- 2004: 1672 buildings, average cost: $139,100
- 2003: 1208 buildings, average cost: $165,400
- 2002: 787 buildings, average cost: $171,100
- 2001: 751 buildings, average cost: $158,800
- 2000: 767 buildings, average cost: $140,100
- 1999: 588 buildings, average cost: $137,500
- 1998: 549 buildings, average cost: $115,900
- 1997: 457 buildings, average cost: $107,900
Median real estate property taxes paid for housing units with mortgages in 2022: $7,146 (2.2%)
Median real estate property taxes paid for housing units with no mortgage in 2022: $6,757 (2.3%)
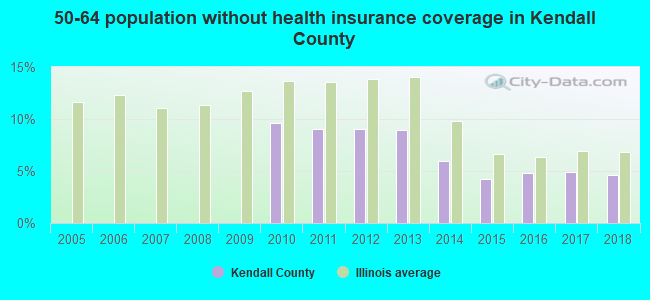
| Kendall County: | 9.2% |
| Illinois: | 11.9% |
Median age of residents in 2022: 35.0 years old
(Males: 34.1 years old, Females: 36.9 years old)
(Median age for: White residents: 40.6 years old, Black residents: 31.4 years old, American Indian residents: 42.0 years old, Asian residents: 36.7 years old, Hispanic or Latino residents: 27.5 years old, Other race residents: 34.3 years old)
Area name: Chicago-Naperville-Joliet, IL HUD Metro FMR Area
Fair market rent in 2006 for a 1-bedroom apartment in Kendall County is $802 a month.
Fair market rent for a 2-bedroom apartment is $901 a month.
Fair market rent for a 3-bedroom apartment is $1102 a month.
Cities in this county include: Oswego, Boulder Hill, Yorkville, Plano, Newark, Millington, Millbrook, Lisbon, Plattville.
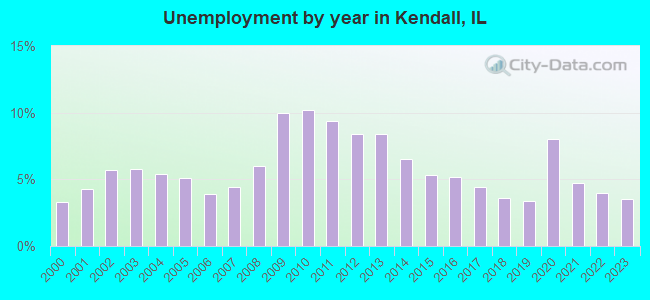
| Here: | 3.5% |
| Illinois: | 4.2% |
Current college students: 2,555
People 25 years of age or older with a high school degree or higher: 93.0%
People 25 years of age or older with a bachelor's degree or higher: 36.5%
Number of foreign born residents: 12,739 (53.8% naturalized citizens)
| Kendall County: | 9.3% |
| Whole state: | 14.4% |
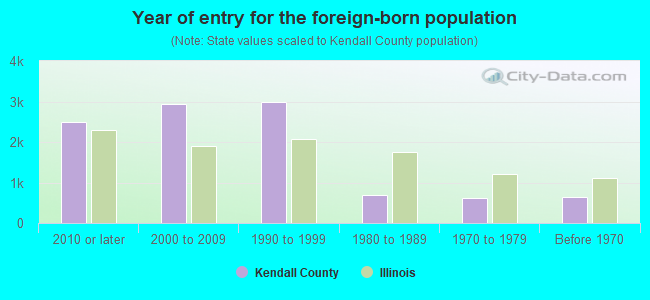
- Year of entry for the foreign-born population
- 2,4822010 or later
- 2,9382000 to 2009
- 2,9951990 to 1999
- 6861980 to 1989
- 6131970 to 1979
- 633Before 1970
Mean travel time to work (commute): minutes
Percentage of county residents living and working in this county: 99.1%
Housing units in structures:
- One, detached: 32,288
- One, attached: 9,648
- Two: 932
- 3 or 4: 1,407
- 5 to 9: 292
- 10 to 19: 814
- 20 to 49: 437
- 50 or more: 540
- Mobile homes: 61
Housing units in Kendall County with a mortgage: 28,132 (2,187 second mortgage, 0 home equity loan, 1,729 both second mortgage and home equity loan)
Houses without a mortgage: 389
| Here: | 6.7% with mortgage |
| State: | 97.4% with mortgage |
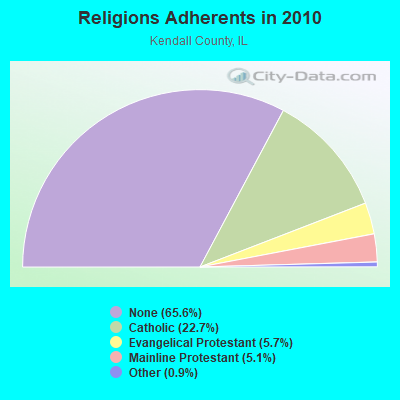
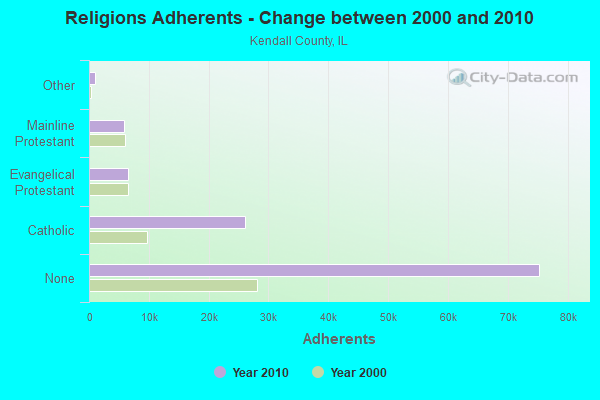
Religion statistics for Kendall County
| Religion | Adherents | Congregations |
|---|---|---|
| Catholic | 26,089 | 4 |
| Evangelical Protestant | 6,500 | 31 |
| Mainline Protestant | 5,805 | 16 |
| Other | 1,054 | 4 |
| Orthodox | - | - |
| None | 75,288 | - |
Source: Clifford Grammich, Kirk Hadaway, Richard Houseal, Dale E.Jones, Alexei Krindatch, Richie Stanley and Richard H.Taylor. 2012. 2010 U.S.Religion Census: Religious Congregations & Membership Study. Association of Statisticians of American Religious Bodies. Jones, Dale E., et al. 2002. Congregations and Membership in the United States 2000. Nashville, TN: Glenmary Research Center.
Food Environment Statistics:
| Kendall County: | 0.93 / 10,000 pop. |
| State: | 2.24 / 10,000 pop. |
| Here: | 0.21 / 10,000 pop. |
| Illinois: | 0.08 / 10,000 pop. |
| This county: | 0.21 / 10,000 pop. |
| Illinois: | 0.75 / 10,000 pop. |
| Kendall County: | 1.45 / 10,000 pop. |
| Illinois: | 2.61 / 10,000 pop. |
| This county: | 4.97 / 10,000 pop. |
| State: | 6.86 / 10,000 pop. |
| Kendall County: | 6.5% |
| Illinois: | 8.3% |
| Kendall County: | 25.4% |
| State: | 25.2% |
| Here: | 13.2% |
| State: | 14.5% |
Agriculture in Kendall County:
Average size of farms: 408 acresAverage value of agricultural products sold per farm: $141,094
Average value of crops sold per acre for harvested cropland: $328.89
The value of nursery, greenhouse, floriculture, and sod as a percentage of the total market value of agricultural products sold: 28.09%
The value of livestock, poultry, and their products as a percentage of the total market value of agricultural products sold: 10.97%
Average total farm production expenses per farm: $128,384
Harvested cropland as a percentage of land in farms: 93.62%
Average market value of all machinery and equipment per farm: $126,318
The percentage of farms operated by a family or individual: 87.38%
Average age of principal farm operators: 55 years
Average number of cattle and calves per 100 acres of all land in farms: 2.05
Corn for grain: 80030 harvested acres
All wheat for grain: 935 harvested acres
Soybeans for beans: 70558 harvested acres
Land in orchards: 15 acres
Earthquake activity:
Kendall County-area historical earthquake activity is significantly above Illinois state average. It is 61% greater than the overall U.S. average.On 4/18/2008 at 09:36:59, a magnitude 5.4 (5.1 MB, 4.8 MS, 5.4 MW, 5.2 MW, Class: Moderate, Intensity: VI - VII) earthquake occurred 222.4 miles away from Kendall County center
On 6/10/1987 at 23:48:54, a magnitude 5.1 (4.9 MB, 4.4 MS, 4.6 MS, 5.1 LG) earthquake occurred 197.2 miles away from the county center
On 4/18/2008 at 09:36:59, a magnitude 5.2 (5.2 MW, Depth: 8.9 mi) earthquake occurred 222.5 miles away from the county center
On 6/28/2004 at 06:10:52, a magnitude 4.2 (4.2 MW, Depth: 6.2 mi, Class: Light, Intensity: IV - V) earthquake occurred 27.6 miles away from the county center
On 6/18/2002 at 17:37:15, a magnitude 5.0 (4.3 MB, 4.6 MW, 5.0 LG) earthquake occurred 255.1 miles away from Kendall County center
On 4/18/2008 at 15:14:16, a magnitude 4.8 (4.5 MB, 4.8 MW, 4.6 MW) earthquake occurred 221.1 miles away from the county center
Magnitude types: regional Lg-wave magnitude (LG), body-wave magnitude (MB), surface-wave magnitude (MS), moment magnitude (MW)
Most recent natural disasters:
- Illinois Covid-19 Pandemic, Incident Period: January 20, 2020, FEMA Id: 4489, Natural disaster type: Other
- Illinois Severe Storms, Straight-Line Winds and Flooding, Incident Period: April 16, 2013 to May 05, 2013, Major Disaster (Presidential) Declared DR-4116: May 10, 2013, FEMA Id: 4116, Natural disaster type: Storm, Flood, Wind
- Illinois Severe Storms and Flooding, Incident Period: September 13, 2008 to October 05, 2008, Major Disaster (Presidential) Declared DR-1800: October 03, 2008, FEMA Id: 1800, Natural disaster type: Storm, Flood
- Illinois Snow, Incident Period: November 30, 2006 to December 01, 2006, Emergency Declared EM-3269: December 29, 2006, FEMA Id: 3269, Natural disaster type: Snow
- Illinois Hurricane Katrina Evacuation, Incident Period: August 29, 2005 to October 01, 2005, Emergency Declared EM-3230: September 07, 2005, FEMA Id: 3230, Natural disaster type: Hurricane
- Illinois Severe Winter Storm, Incident Period: December 11, 2000 to December 31, 2000, Emergency Declared EM-3161: January 17, 2001, FEMA Id: 3161, Natural disaster type: Winter Storm
- Illinois Winter Snow Storm, Incident Period: January 01, 1999 to January 15, 1999, Emergency Declared EM-3134: January 08, 1999, FEMA Id: 3134, Natural disaster type: Storm, Snow
- Illinois Flooding, Incident Period: July 17, 1996 to August 07, 1996, Major Disaster (Presidential) Declared DR-1129: July 25, 1996, FEMA Id: 1129, Natural disaster type: Flood
- Illinois Tornadoes, Incident Period: August 28, 1990, Major Disaster (Presidential) Declared DR-878: August 29, 1990, FEMA Id: 878, Natural disaster type: Tornado
- Illinois Blizzards and Snowstorms, Incident Period: January 16, 1979, Emergency Declared EM-3068: January 16, 1979, FEMA Id: 3068, Natural disaster type: Snowstorm, Blizzard
- 2 other natural disasters have been reported since 1953.
The number of natural disasters in Kendall County (12) is smaller than the US average (15).
Major Disasters (Presidential) Declared: 6
Emergencies Declared: 5
Causes of natural disasters: Floods: 5, Storms: 5, Snows: 2, Blizzard: 1, Hurricane: 1, Snowstorm: 1, Tornado: 1, Wind: 1, Winter Storm: 1, Other: 1 (Note: some incidents may be assigned to more than one category).
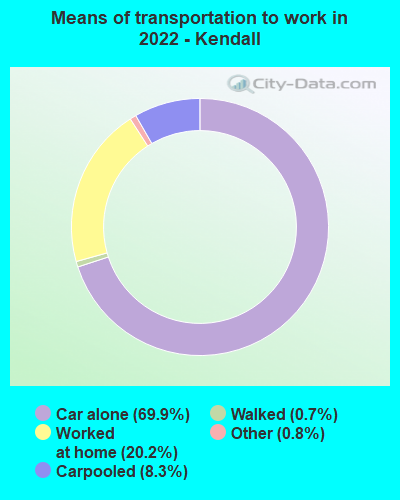
Means of transportation to work:
- Drove a car alone: 27,069 (67.3%)
- Carpooled: 3,414 (8.5%)
- Bus: 24 (0.1%)
- Long-distance train or commuter rail: 9 (0.0%)
- Taxicab, motorcycle, or other means: 349 (0.9%)
- Bicycle: 8 (0.0%)
- Walked: 274 (0.7%)
- Worked at home: 10,628 (26.4%)
- Health care and social assistance (16%)
- Retail trade (14%)
- Educational services (11%)
- Accommodation and food services (8%)
- Manufacturing (7%)
- Finance and insurance (6%)
- Professional, scientific, and technical services (5%)
- Health care and social assistance (18%)
- Retail trade (16%)
- Educational services (13%)
- Accommodation and food services (10%)
- Manufacturing (8%)
- Finance and insurance (7%)
- Professional, scientific, and technical services (6%)
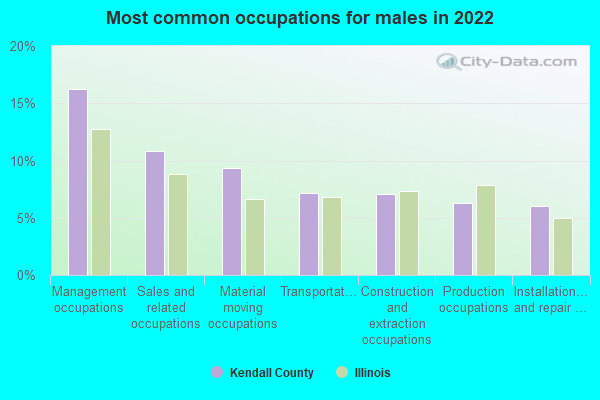
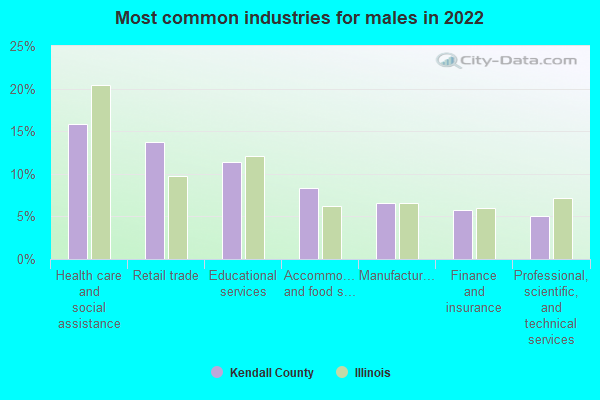
- Management occupations (16%)
- Sales and related occupations (11%)
- Material moving occupations (9%)
- Transportation occupations (7%)
- Construction and extraction occupations (7%)
- Production occupations (6%)
- Installation, maintenance, and repair occupations (6%)
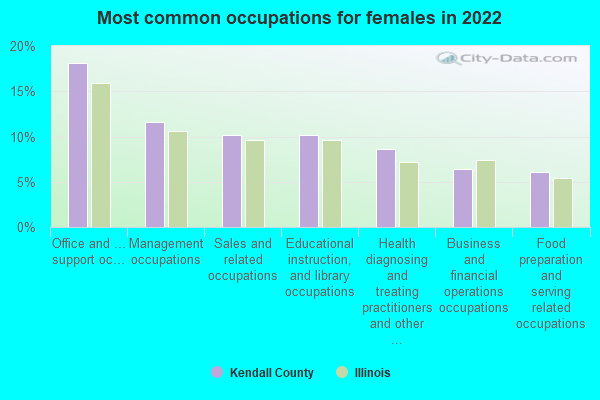
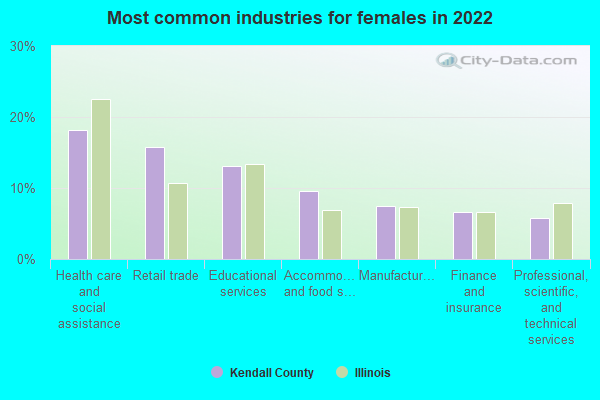
- Office and administrative support occupations (18%)
- Management occupations (12%)
- Sales and related occupations (10%)
- Educational instruction, and library occupations (10%)
- Health diagnosing and treating practitioners and other technical occupations (9%)
- Business and financial operations occupations (6%)
- Food preparation and serving related occupations (6%)
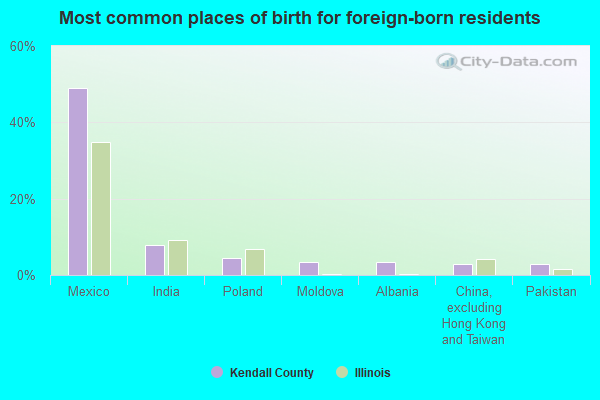
- Mexico (49%)
- India (8%)
- Poland (4%)
- Moldova (4%)
- Albania (3%)
- China, excluding Hong Kong and Taiwan (3%)
- Pakistan (3%)
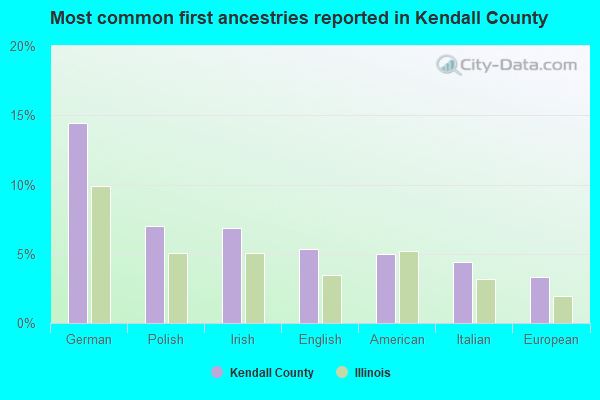
- German (14%)
- Polish (7%)
- Irish (7%)
- English (5%)
- American (5%)
- Italian (4%)
- European (3%)
People in group quarters in Kendall County, Illinois in 2010:
- 112 people in nursing facilities/skilled-nursing facilities
- 61 people in local jails and other municipal confinement facilities
- 21 people in group homes intended for adults
- 14 people in other noninstitutional facilities
People in group quarters in Kendall County, Illinois in 2000:
- 142 people in nursing homes
- 48 people in local jails and other confinement facilities (including police lockups)
- 2 people in religious group quarters
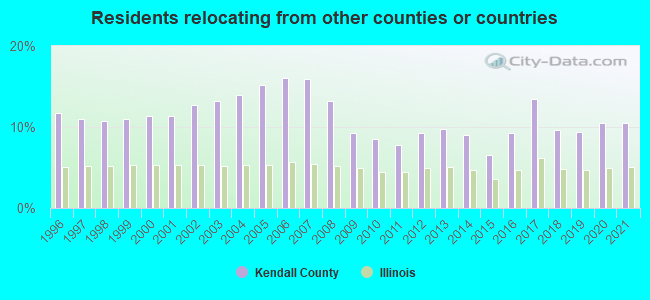
10.47% of this county's 2021 resident taxpayers lived in other counties in 2020 ($69,277 average adjusted gross income)
| Here: | 10.47% |
| Illinois average: | 5.09% |
10 or fewer of this county's residents moved from foreign countries.
8.99% relocated from other counties in Illinois ($59,585 average AGI)
1.48% relocated from other states ($9,693 average AGI)
Kendall County: 1.48% Illinois average: 2.01%
Top counties from which taxpayers relocated into this county between 2020 and 2021:
| from Kane County, IL | |
| from DuPage County, IL | |
| from Will County, IL | |
| from Cook County, IL | |
| from DeKalb County, IL | |
| from La Salle County, IL | |
| from Grundy County, IL |
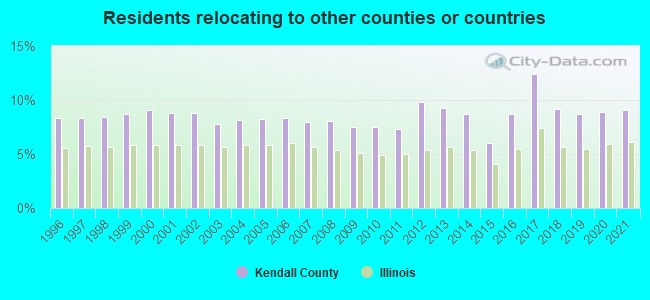
9.07% of this county's 2020 resident taxpayers moved to other counties in 2021 ($75,419 average adjusted gross income)
| Here: | 9.07% |
| Illinois average: | 6.10% |
10 or fewer of this county's residents moved to foreign countries.
6.00% relocated to other counties in Illinois ($45,026 average AGI)
3.07% relocated to other states ($30,393 average AGI)
Kendall County: 3.07% Illinois average: 3.06%
Top counties to which taxpayers relocated from this county between 2020 and 2021:
| to Kane County, IL | |
| to Will County, IL | |
| to DuPage County, IL | |
| to Cook County, IL | |
| to DeKalb County, IL | |
| to La Salle County, IL | |
| to Grundy County, IL |
Births per 1000 population from 1990 to 1999: 15.0
Births per 1000 population from 2000 to 2009: 12.2
Births per 1000 population from 2010 to 2022: 6.6

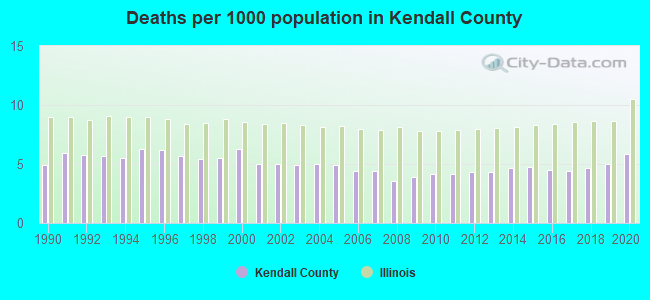
Deaths per 1000 population from 1990 to 1999: 5.7
Deaths per 1000 population from 2000 to 2009: 4.7
Deaths per 1000 population from 2010 to 2020: 4.6
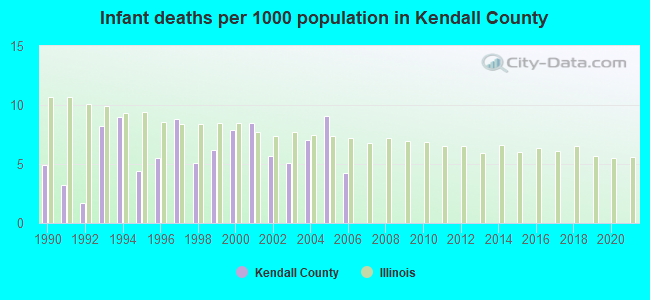
Infant deaths per 1000 live births from 1990 to 1999: 5.7
Infant deaths per 1000 live births from 2000 to 2006: 6.8
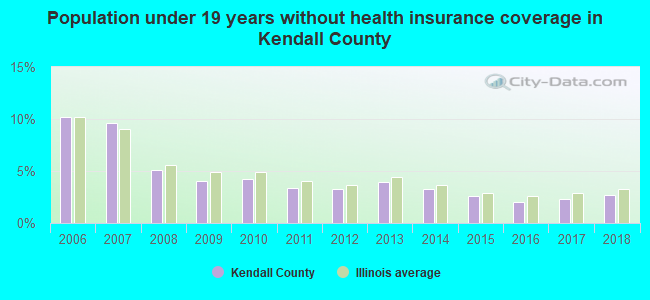
Persons under 19 years old without health insurance coverage in 2018: 2.7%

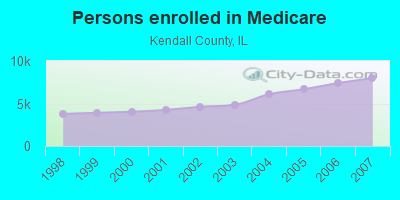
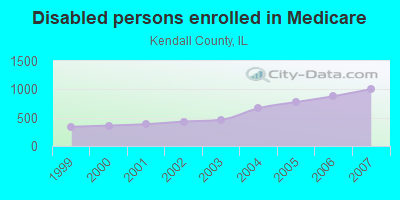
Persons enrolled in hospital insurance and/or supplemental medical insurance (Medicare) in July 1, 2007: 8,000 (6,996 aged, 1,004 disabled)
Children under 18 without health insurance coverage in 2007: 2,645 (8%)

Most common underlying causes of death in Kendall County, Illinois in 1999 - 2019:
- Atherosclerotic heart disease (694)
- Bronchus or lung, unspecified - Malignant neoplasms (630)
- Acute myocardial infarction, unspecified (391)
- Chronic obstructive pulmonary disease, unspecified (389)
- Unspecified dementia (349)
- Stroke, not specified as haemorrhage or infarction (211)
- Alzheimer disease, unspecified (145)
- Congestive heart failure (131)
- Breast, unspecified - Malignant neoplasms (101)
- Pancreas, unspecified - Malignant neoplasms (81)
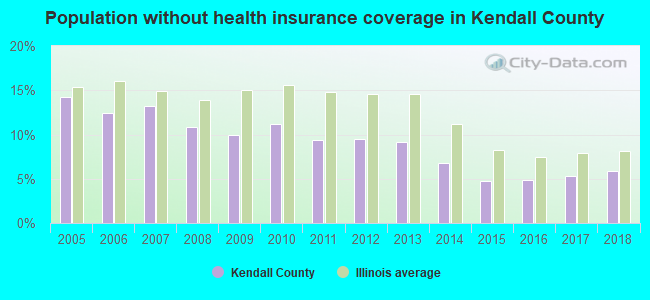
Population without health insurance coverage in 2000: 10%
Children under 18 without health insurance coverage in 2000: 8%
Medical specialist MDs per 100,000 population in 2005: 499
Dentists per 100,000 population in 1998: 6
Total births per 100,000 population, July 2005 - July 2006 : 33
Total deaths per 100,000 population, July 2005 - July 2006: 60
Limited-service eating places per 100,000 population in 2005 : 18
Beer, wine & liquor stores per 100,000 population in 2005: 1
Suicides per 1,000,000 population from 2000 to 2006: 74.9. This is less than state average.
Household type by relationship:
Households: 137,254- Male householders: 22,316 (3,526 living alone), Female householders: 22,847 (5,682 living alone)
25,492 spouses (25,203 opposite-sex spouses), 3,669 unmarried partners, (3,585 opposite-sex unmarried partners), 51,470 children (49,441 natural, 315 adopted, 1,714 stepchildren), 2,254 grandchildren, 1,907 brothers or sisters, 2,709 parents, 303 foster children, 1,628 other relatives, 2,257 non-relatives
- In group quarters: 402
Size of family households: 11,516 2-persons, 8,017 3-persons, 8,216 4-persons, 3,461 5-persons, 1,251 6-persons, 774 7-or-more-persons.
Size of nonfamily households: 9,208 1-person, 2,616 2-persons, 104 6-persons.
25,737 married couples with children.
8,555 single-parent households (1,787 men, 6,768 women).
79.7% of residents of Kendall speak English at home.
14.3% of residents speak Spanish at home (73% speak English very well, 15% speak English well, 12% speak English not well, 1% don't speak English at all).
3.6% of residents speak other Indo-European language at home (65% speak English very well, 23% speak English well, 13% speak English not well).
1.6% of residents speak Asian or Pacific Island language at home (56% speak English very well, 38% speak English well, 4% speak English not well, 2% don't speak English at all).
0.3% of residents speak other language at home (83% speak English very well, 17% speak English well).
In fiscal year 2004:
Federal Government expenditure: $168,585,000 ($2,324 per capita)
Department of Defense expenditure: $34,418,000
Federal direct payments to individuals for retirement and disability: $82,152,000
Federal other direct payments to individuals: $24,560,000
Federal direct payments not to individuals: $5,311,000
Federal grants: $15,839,000
Federal procurement contracts: $2,001,000 ($371,000 Department of Defense)
Federal salaries and wages: $38,723,000 ($32,271,000 Department of Defense)
Federal Government direct loans: $1,420,000
Federal guaranteed/insured loans: $132,229,000
Federal Government insurance: $60,167,000
Population change from April 1, 2000 to July 1, 2005:
Births: 5,571| Here: | 70 per 1000 residents |
| State: | 75 per 1000 residents |
Deaths: 1,681
| Here: | 21 per 1000 residents |
| State: | 43 per 1000 residents |
Net international migration: +382
| Here: | +5 per 1000 residents |
| State: | +26 per 1000 residents |
Net internal migration: +20,423
| Here: | |
| State: |

Total withdrawal of fresh water for public supply: 2.24 millions of gallons per day (all from ground)
| Here: | 7.4 |
| State: | 6.4 |
| Here: | 4.4 |
| State: | 4.1 |
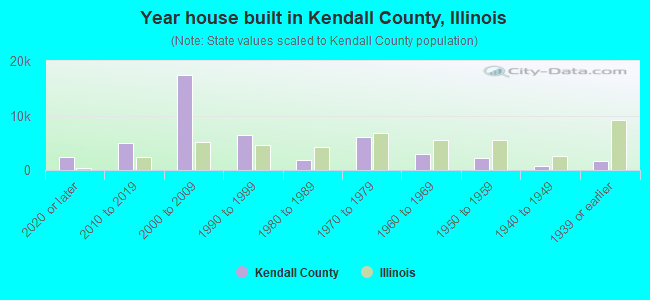
- Year house built in Kendall County, Illinois
- 2,3762020 or later
- 4,8992010 to 2019
- 17,4802000 to 2009
- 6,5101990 to 1999
- 1,7911980 to 1989
- 6,0191970 to 1979
- 2,9961960 to 1969
- 2,1121950 to 1959
- 6541940 to 1949
- 1,5821939 or earlier
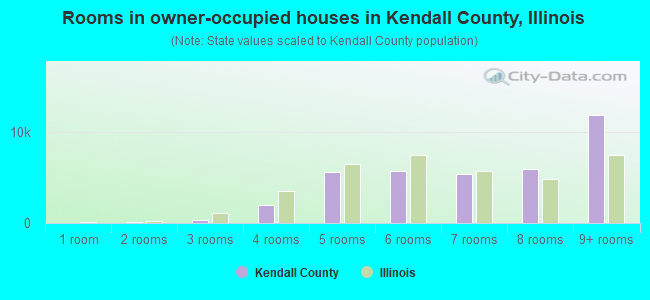
- Rooms in owner-occupied houses in Kendall County, Illinois
- 01 room
- 912 rooms
- 3163 rooms
- 2,0204 rooms
- 5,6225 rooms
- 5,6506 rooms
- 5,3137 rooms
- 5,9058 rooms
- 11,8269+ rooms
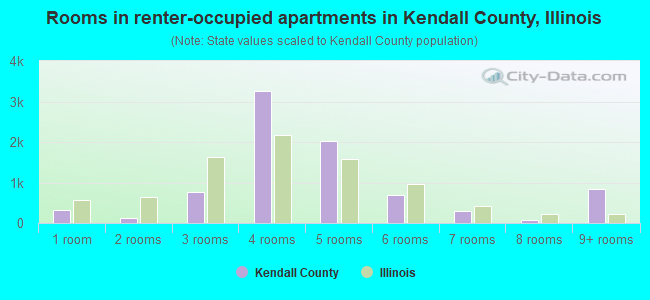
- Rooms in renter-occupied apartments in Kendall County, Illinois
- 3211 room
- 1342 rooms
- 7683 rooms
- 3,2474 rooms
- 2,0285 rooms
- 7036 rooms
- 3007 rooms
- 838 rooms
- 8369+ rooms
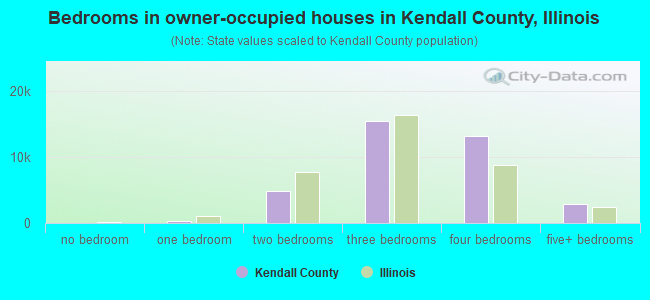
- Bedrooms in owner-occupied houses in Kendall County, Illinois
- 0no bedroom
- 2361 bedroom
- 4,9212 bedrooms
- 15,4473 bedrooms
- 13,2664 bedrooms
- 2,8735+ bedrooms
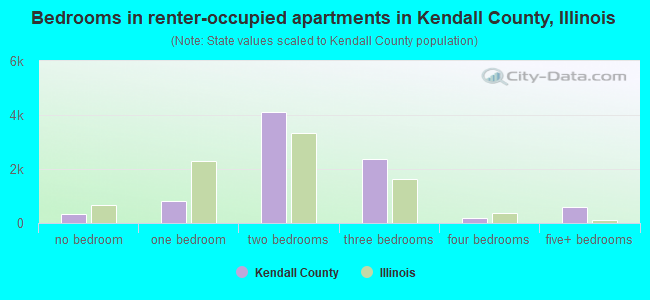
- Bedrooms in renter-occupied apartments in Kendall County, Illinois
- 321no bedroom
- 8281 bedroom
- 4,1172 bedrooms
- 2,3763 bedrooms
- 1974 bedrooms
- 5815+ bedrooms
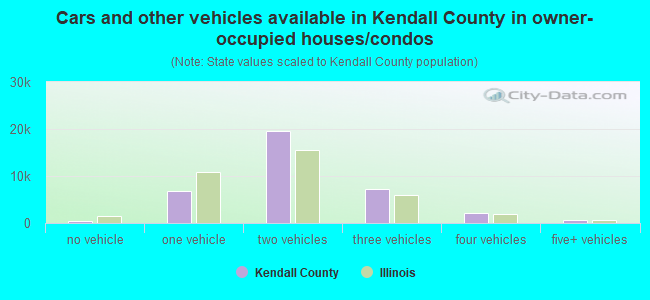
- Cars and other vehicles available in Kendall County in owner-occupied houses/condos
- 380no vehicle
- 6,8151 vehicle
- 19,4902 vehicles
- 7,3073 vehicles
- 2,1004 vehicles
- 6515+ vehicles
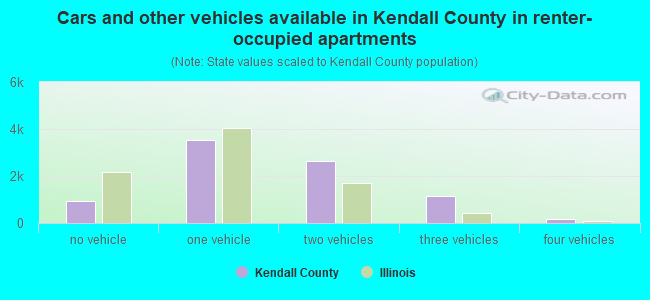
- Cars and other vehicles available in Kendall County in renter-occupied apartments
- 949no vehicle
- 3,5141 vehicle
- 2,6422 vehicles
- 1,1283 vehicles
- 1874 vehicles
- 05+ vehicles
90.5% of Kendall County residents lived in the same house 1 years ago.
Out of people who lived in different houses, 19% lived in this county.
Out of people who lived in different counties, 94% lived in Illinois.
| Kendall County: | 90.5% |
| State average: | 88.3% |
Place of birth for U.S.-born residents:
- This state: 98,997
- Other state: 24,428
- Northeast: 2,501
- Midwest: 9,826
- South: 6,198
- West: 5,903
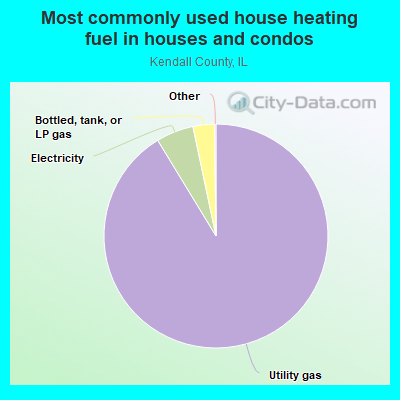
- 91.4%Utility gas
- 5.4%Electricity
- 3.1%Bottled, tank, or LP gas
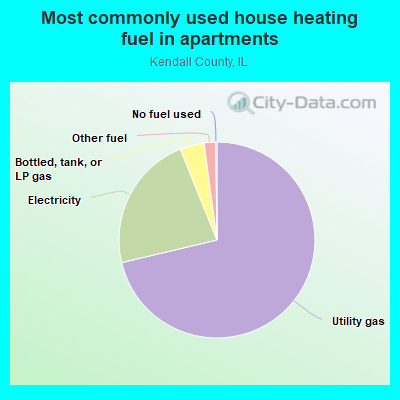
- 71.3%Utility gas
- 22.6%Electricity
- 4.0%Bottled, tank, or LP gas
- 1.9%Other fuel
- 0.2%No fuel used
Private vs. public school enrollment:
| Here: | 19.9% |
| Illinois: | 13.3% |
| Here: | 15.0% |
| Illinois: | 9.9% |
| Here: | 28.8% |
| Illinois: | 27.4% |

Kendall County government finances - Expenditure in 2018:
- Charges - Other: $7,001,000
Other: $6,602,000
Parks and Recreation: $358,000
Parks and Recreation: $304,000
- Construction - Regular Highways: $4,615,000
Police Protection: $2,408,000
Police Protection: $1,462,000
Central Staff Services: $276,000
Central Staff Services: $152,000
- Current Operations - Police Protection: $11,175,000
Police Protection: $10,422,000
Regular Highways: $9,668,000
Central Staff Services: $7,333,000
Judicial and Legal Services: $7,134,000
Central Staff Services: $6,908,000
Health - Other: $6,794,000
Judicial and Legal Services: $6,618,000
Correctional Institutions: $6,218,000
Regular Highways: $5,694,000
Health - Other: $5,590,000
General - Other: $4,877,000
Correctional Institutions: $4,788,000
General - Other: $4,505,000
Parks and Recreation: $1,406,000
Parks and Recreation: $1,349,000
- Federal Intergovernmental - Public Welfare: $2,213,000
Other: $1,668,000
Other: $1,332,000
Highways: $617,000
Health and Hospitals: $449,000
Health and Hospitals: $285,000
Public Welfare: $277,000
Transit Utilities: $190,000
General Local Government Support: $120,000
General Local Government Support: $37,000
- General - Interest on Debt: $3,126,000
Interest on Debt: $2,792,000
- Local Intergovernmental - Other: $293,000
Other: $129,000
- Long Term Debt - Beginning Outstanding - Unspecified Public Purpose: $32,354,000
Outstanding Unspecified Public Purpose: $29,675,000
Beginning Outstanding - Unspecified Public Purpose: $26,655,000
Outstanding Unspecified Public Purpose: $24,395,000
Retired Unspecified Public Purpose: $16,994,000
Issue, Unspecified Public Purpose: $14,315,000
Retired Unspecified Public Purpose: $8,270,000
Issue, Unspecified Public Purpose: $6,010,000
- Miscellaneous - Fines and Forfeits: $2,325,000
General Revenue - Other: $1,013,000
General Revenue - Other: $847,000
Interest Earnings: $651,000
Interest Earnings: $237,000
- Other Capital Outlay - Regular Highways: $7,886,000
Police Protection: $2,428,000
Central Staff Services: $1,286,000
Regular Highways: $647,000
Sewerage: $425,000
Central Staff Services: $121,000
- Other Funds - Cash and Securities: $58,729,000
Cash and Securities: $57,228,000
- State Intergovernmental - General Local Government Support: $19,803,000
General Local Government Support: $17,991,000
Health and Hospitals: $1,994,000
Highways: $1,962,000
Highways: $1,722,000
Transit Utilities: $1,233,000
Public Welfare: $713,000
Other: $174,000
Public Welfare: $162,000
Health and Hospitals: $150,000
- Tax - Property: $26,521,000
Property: $26,161,000
Other License: $810,000
Other License: $770,000
- Total Salaries and Wages: $21,548,000
: $20,654,000
Kendall County government finances - Revenue in 2018:
- Charges - Other: $7,001,000
Other: $6,602,000
Parks and Recreation: $358,000
Parks and Recreation: $304,000
- Construction - Regular Highways: $4,615,000
Police Protection: $2,408,000
Police Protection: $1,462,000
Central Staff Services: $276,000
Central Staff Services: $152,000
- Current Operations - Police Protection: $11,175,000
Police Protection: $10,422,000
Regular Highways: $9,668,000
Central Staff Services: $7,333,000
Judicial and Legal Services: $7,134,000
Central Staff Services: $6,908,000
Health - Other: $6,794,000
Judicial and Legal Services: $6,618,000
Correctional Institutions: $6,218,000
Regular Highways: $5,694,000
Health - Other: $5,590,000
General - Other: $4,877,000
Correctional Institutions: $4,788,000
General - Other: $4,505,000
Parks and Recreation: $1,406,000
Parks and Recreation: $1,349,000
- Federal Intergovernmental - Public Welfare: $2,213,000
Other: $1,668,000
Other: $1,332,000
Highways: $617,000
Health and Hospitals: $449,000
Health and Hospitals: $285,000
Public Welfare: $277,000
Transit Utilities: $190,000
General Local Government Support: $120,000
General Local Government Support: $37,000
- General - Interest on Debt: $3,126,000
Interest on Debt: $2,792,000
- Local Intergovernmental - Other: $293,000
Other: $129,000
- Long Term Debt - Beginning Outstanding - Unspecified Public Purpose: $32,354,000
Outstanding Unspecified Public Purpose: $29,675,000
Beginning Outstanding - Unspecified Public Purpose: $26,655,000
Outstanding Unspecified Public Purpose: $24,395,000
Retired Unspecified Public Purpose: $16,994,000
Issue, Unspecified Public Purpose: $14,315,000
Retired Unspecified Public Purpose: $8,270,000
Issue, Unspecified Public Purpose: $6,010,000
- Miscellaneous - Fines and Forfeits: $2,325,000
General Revenue - Other: $1,013,000
General Revenue - Other: $847,000
Interest Earnings: $651,000
Interest Earnings: $237,000
- Other Capital Outlay - Regular Highways: $7,886,000
Police Protection: $2,428,000
Central Staff Services: $1,286,000
Regular Highways: $647,000
Sewerage: $425,000
Central Staff Services: $121,000
- Other Funds - Cash and Securities: $58,729,000
Cash and Securities: $57,228,000
- State Intergovernmental - General Local Government Support: $19,803,000
General Local Government Support: $17,991,000
Health and Hospitals: $1,994,000
Highways: $1,962,000
Highways: $1,722,000
Transit Utilities: $1,233,000
Public Welfare: $713,000
Other: $174,000
Public Welfare: $162,000
Health and Hospitals: $150,000
- Tax - Property: $26,521,000
Property: $26,161,000
Other License: $810,000
Other License: $770,000
- Total Salaries and Wages: $21,548,000
: $20,654,000
Kendall County government finances - Debt in 2018:
- Charges - Other: $7,001,000
Other: $6,602,000
Parks and Recreation: $358,000
Parks and Recreation: $304,000
- Construction - Regular Highways: $4,615,000
Police Protection: $2,408,000
Police Protection: $1,462,000
Central Staff Services: $276,000
Central Staff Services: $152,000
- Current Operations - Police Protection: $11,175,000
Police Protection: $10,422,000
Regular Highways: $9,668,000
Central Staff Services: $7,333,000
Judicial and Legal Services: $7,134,000
Central Staff Services: $6,908,000
Health - Other: $6,794,000
Judicial and Legal Services: $6,618,000
Correctional Institutions: $6,218,000
Regular Highways: $5,694,000
Health - Other: $5,590,000
General - Other: $4,877,000
Correctional Institutions: $4,788,000
General - Other: $4,505,000
Parks and Recreation: $1,406,000
Parks and Recreation: $1,349,000
- Federal Intergovernmental - Public Welfare: $2,213,000
Other: $1,668,000
Other: $1,332,000
Highways: $617,000
Health and Hospitals: $449,000
Health and Hospitals: $285,000
Public Welfare: $277,000
Transit Utilities: $190,000
General Local Government Support: $120,000
General Local Government Support: $37,000
- General - Interest on Debt: $3,126,000
Interest on Debt: $2,792,000
- Local Intergovernmental - Other: $293,000
Other: $129,000
- Long Term Debt - Beginning Outstanding - Unspecified Public Purpose: $32,354,000
Outstanding Unspecified Public Purpose: $29,675,000
Beginning Outstanding - Unspecified Public Purpose: $26,655,000
Outstanding Unspecified Public Purpose: $24,395,000
Retired Unspecified Public Purpose: $16,994,000
Issue, Unspecified Public Purpose: $14,315,000
Retired Unspecified Public Purpose: $8,270,000
Issue, Unspecified Public Purpose: $6,010,000
- Miscellaneous - Fines and Forfeits: $2,325,000
General Revenue - Other: $1,013,000
General Revenue - Other: $847,000
Interest Earnings: $651,000
Interest Earnings: $237,000
- Other Capital Outlay - Regular Highways: $7,886,000
Police Protection: $2,428,000
Central Staff Services: $1,286,000
Regular Highways: $647,000
Sewerage: $425,000
Central Staff Services: $121,000
- Other Funds - Cash and Securities: $58,729,000
Cash and Securities: $57,228,000
- State Intergovernmental - General Local Government Support: $19,803,000
General Local Government Support: $17,991,000
Health and Hospitals: $1,994,000
Highways: $1,962,000
Highways: $1,722,000
Transit Utilities: $1,233,000
Public Welfare: $713,000
Other: $174,000
Public Welfare: $162,000
Health and Hospitals: $150,000
- Tax - Property: $26,521,000
Property: $26,161,000
Other License: $810,000
Other License: $770,000
- Total Salaries and Wages: $21,548,000
: $20,654,000
Kendall County government finances - Cash and Securities in 2018:
- Charges - Other: $7,001,000
Other: $6,602,000
Parks and Recreation: $358,000
Parks and Recreation: $304,000
- Construction - Regular Highways: $4,615,000
Police Protection: $2,408,000
Police Protection: $1,462,000
Central Staff Services: $276,000
Central Staff Services: $152,000
- Current Operations - Police Protection: $11,175,000
Police Protection: $10,422,000
Regular Highways: $9,668,000
Central Staff Services: $7,333,000
Judicial and Legal Services: $7,134,000
Central Staff Services: $6,908,000
Health - Other: $6,794,000
Judicial and Legal Services: $6,618,000
Correctional Institutions: $6,218,000
Regular Highways: $5,694,000
Health - Other: $5,590,000
General - Other: $4,877,000
Correctional Institutions: $4,788,000
General - Other: $4,505,000
Parks and Recreation: $1,406,000
Parks and Recreation: $1,349,000
- Federal Intergovernmental - Public Welfare: $2,213,000
Other: $1,668,000
Other: $1,332,000
Highways: $617,000
Health and Hospitals: $449,000
Health and Hospitals: $285,000
Public Welfare: $277,000
Transit Utilities: $190,000
General Local Government Support: $120,000
General Local Government Support: $37,000
- General - Interest on Debt: $3,126,000
Interest on Debt: $2,792,000
- Local Intergovernmental - Other: $293,000
Other: $129,000
- Long Term Debt - Beginning Outstanding - Unspecified Public Purpose: $32,354,000
Outstanding Unspecified Public Purpose: $29,675,000
Beginning Outstanding - Unspecified Public Purpose: $26,655,000
Outstanding Unspecified Public Purpose: $24,395,000
Retired Unspecified Public Purpose: $16,994,000
Issue, Unspecified Public Purpose: $14,315,000
Retired Unspecified Public Purpose: $8,270,000
Issue, Unspecified Public Purpose: $6,010,000
- Miscellaneous - Fines and Forfeits: $2,325,000
General Revenue - Other: $1,013,000
General Revenue - Other: $847,000
Interest Earnings: $651,000
Interest Earnings: $237,000
- Other Capital Outlay - Regular Highways: $7,886,000
Police Protection: $2,428,000
Central Staff Services: $1,286,000
Regular Highways: $647,000
Sewerage: $425,000
Central Staff Services: $121,000
- Other Funds - Cash and Securities: $58,729,000
Cash and Securities: $57,228,000
- State Intergovernmental - General Local Government Support: $19,803,000
General Local Government Support: $17,991,000
Health and Hospitals: $1,994,000
Highways: $1,962,000
Highways: $1,722,000
Transit Utilities: $1,233,000
Public Welfare: $713,000
Other: $174,000
Public Welfare: $162,000
Health and Hospitals: $150,000
- Tax - Property: $26,521,000
Property: $26,161,000
Other License: $810,000
Other License: $770,000
- Total Salaries and Wages: $21,548,000
: $20,654,000
Supplemental Security Income (SSI) in 2006:
- Total number of recipients: 401
- Number of aged recipients: 61
- Number of blind and disabled recipients: 340
- Number of recipients under 18: 97
- Number of recipients between 18 and 64: 217
- Number of recipients older than 64: 87
- Number of recipients also receiving OASDI: 108
- Amount of payments (thousands of dollars): 180
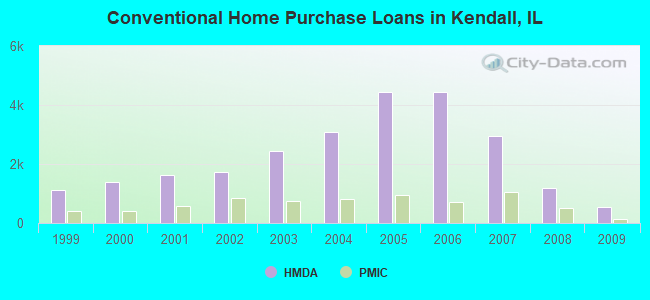
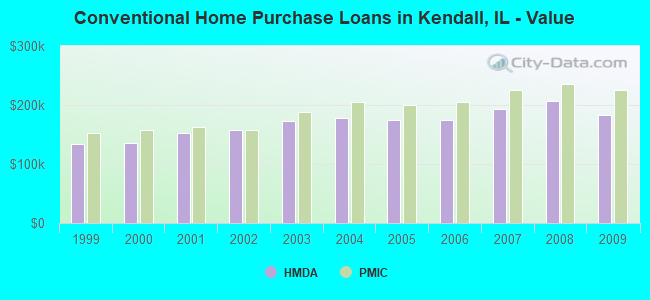
| Home Mortgage Disclosure Act Aggregated Statistics For Year 2009 (Based on 8 full tracts) | ||||||||||||||
| A) FHA, FSA/RHS & VA Home Purchase Loans | B) Conventional Home Purchase Loans | C) Refinancings | D) Home Improvement Loans | E) Loans on Dwellings For 5+ Families | F) Non-occupant Loans on < 5 Family Dwellings (A B C & D) | G) Loans On Manufactured Home Dwelling (A B C & D) | ||||||||
|---|---|---|---|---|---|---|---|---|---|---|---|---|---|---|
| Number | Average Value | Number | Average Value | Number | Average Value | Number | Average Value | Number | Average Value | Number | Average Value | Number | Average Value | |
| LOANS ORIGINATED | 928 | $185,588 | 542 | $183,640 | 4,393 | $206,140 | 53 | $92,000 | 5 | $1,569,400 | 135 | $139,578 | 13 | $179,923 |
| APPLICATIONS APPROVED, NOT ACCEPTED | 68 | $195,206 | 36 | $207,389 | 383 | $213,661 | 7 | $35,286 | 0 | $0 | 13 | $134,692 | 0 | $0 |
| APPLICATIONS DENIED | 146 | $185,014 | 84 | $172,310 | 1,184 | $220,431 | 75 | $54,440 | 0 | $0 | 40 | $153,375 | 2 | $105,500 |
| APPLICATIONS WITHDRAWN | 102 | $187,098 | 63 | $170,016 | 769 | $208,856 | 12 | $150,500 | 1 | $1,310,000 | 19 | $163,158 | 1 | $32,000 |
| FILES CLOSED FOR INCOMPLETENESS | 26 | $188,615 | 5 | $143,600 | 229 | $216,520 | 7 | $116,143 | 0 | $0 | 5 | $205,000 | 0 | $0 |
| Private Mortgage Insurance Companies Aggregated Statistics For Year 2009 (Based on 8 full tracts) | ||||||
| A) Conventional Home Purchase Loans | B) Refinancings | C) Non-occupant Loans on < 5 Family Dwellings (A & B) | ||||
|---|---|---|---|---|---|---|
| Number | Average Value | Number | Average Value | Number | Average Value | |
| LOANS ORIGINATED | 122 | $225,008 | 125 | $239,424 | 0 | $0 |
| APPLICATIONS APPROVED, NOT ACCEPTED | 46 | $220,587 | 63 | $244,587 | 1 | $160,000 |
| APPLICATIONS DENIED | 30 | $228,800 | 49 | $226,306 | 0 | $0 |
| APPLICATIONS WITHDRAWN | 8 | $255,500 | 28 | $262,643 | 0 | $0 |
| FILES CLOSED FOR INCOMPLETENESS | 9 | $240,222 | 4 | $287,750 | 0 | $0 |
| Most common first names in Kendall County, IL among deceased individuals | ||
| Name | Count | Lived (average) |
|---|---|---|
| John | 232 | 73.9 years |
| William | 201 | 74.6 years |
| Robert | 196 | 72.3 years |
| Mary | 164 | 80.6 years |
| James | 139 | 69.9 years |
| Charles | 106 | 74.2 years |
| Dorothy | 102 | 78.3 years |
| George | 102 | 75.9 years |
| Richard | 100 | 70.6 years |
| Donald | 99 | 70.5 years |
| Most common last names in Kendall County, IL among deceased individuals | ||
| Last name | Count | Lived (average) |
|---|---|---|
| Johnson | 136 | 76.4 years |
| Anderson | 89 | 77.7 years |
| Smith | 86 | 73.4 years |
| Miller | 66 | 76.8 years |
| Brown | 48 | 75.7 years |
| Nelson | 46 | 77.8 years |
| Peterson | 40 | 79.7 years |
| Olson | 37 | 78.4 years |
| Larson | 34 | 80.1 years |
| Thompson | 30 | 78.6 years |
| Businesses in Kendall County, IL | ||||
| Name | Count | Name | Count | |
|---|---|---|---|---|
| 7-Eleven | 1 | MasterBrand Cabinets | 4 | |
| ALDI | 3 | Maurices | 1 | |
| AT&T | 1 | McDonald's | 2 | |
| Ace Hardware | 1 | Menards | 2 | |
| Advance Auto Parts | 2 | New Balance | 1 | |
| Applebee's | 1 | Nike | 3 | |
| Arby's | 1 | Office Depot | 1 | |
| AutoZone | 3 | OfficeMax | 1 | |
| Baskin-Robbins | 1 | Panera Bread | 1 | |
| Blockbuster | 2 | Papa John's Pizza | 1 | |
| Burger King | 4 | Penske | 2 | |
| Circle K | 2 | PetSmart | 1 | |
| Cricket Wireless | 1 | Pizza Hut | 2 | |
| Curves | 1 | Quiznos | 1 | |
| Dairy Queen | 1 | RadioShack | 2 | |
| Decora Cabinetry | 1 | SAS Shoes | 1 | |
| Domino's Pizza | 1 | SONIC Drive-In | 1 | |
| Dunkin Donuts | 2 | Sears | 1 | |
| Famous Footwear | 1 | Sephora | 1 | |
| FedEx | 5 | Sprint Nextel | 2 | |
| Firestone Complete Auto Care | 1 | Starbucks | 2 | |
| GNC | 1 | Subway | 6 | |
| GameStop | 2 | Super 8 | 1 | |
| H&R Block | 2 | T-Mobile | 5 | |
| Hilton | 1 | Taco Bell | 2 | |
| Home Depot | 1 | Target | 1 | |
| JCPenney | 1 | True Value | 1 | |
| Jewel-Osco | 1 | U-Haul | 4 | |
| KFC | 2 | UPS | 5 | |
| Kincaid | 1 | Walgreens | 5 | |
| Kmart | 1 | Walmart | 2 | |
| Kohl's | 1 | Wendy's | 2 | |
| La-Z-Boy | 1 | World Gym | 1 | |
| Lane Furniture | 1 | YMCA | 5 | |
| Marshalls | 1 | |||
Kendall County on our top lists:
- #6 on the list of "Top 101 counties with the largest decrease in the number of deaths per 1000 residents 2000-2006 to 2007-2013 (pop. 50,000+)"
- #7 on the list of "Top 101 counties with the lowest number of deaths per 1000 residents 2007-2013 (pop. 50,000+)"
- #17 on the list of "Top 101 counties with the largest number of children under 18 without health insurance coverage in 2000 (pop. 50,000+)"
- #33 on the list of "Top 101 counties with the lowest total withdrawal of fresh water for public supply (pop. 50,000+)"
- #35 on the list of "Top 101 counties with the largest number of people without health insurance coverage in 2000 (pop. 50,000+)"
- #47 on the list of "Top 101 counties with the lowest number of deaths per 1000 residents 2007-2013"
- #68 on the list of "Top 101 counties with the lowest percentage of residents relocating from foreign countries between 2010 and 2011"
- #73 on the list of "Top 101 counties with the largest number of children under 18 without health insurance coverage in 2000"