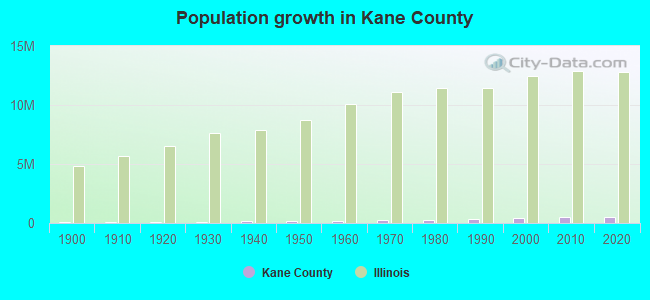
Kane County, Illinois (IL)
County owner-occupied free and clear houses and condos in 2010: 24,207
County owner-occupied houses and condos in 2000: 101,727
Renter-occupied apartments: 39,909 (it was 32,174 in 2000)
| % of renters here: | 24% |
| State: | 33% |
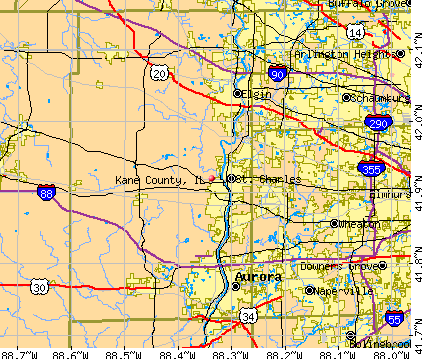
Land area: 520 sq. mi.
Water area: 3.6 sq. mi.
Population density: 988 people per square mile (very high).
Industries providing employment: Educational, health and social services (17.7%), Manufacturing (15.4%), Professional, scientific, management, administrative, and waste management services (13.4%), Retail trade (12.0%).
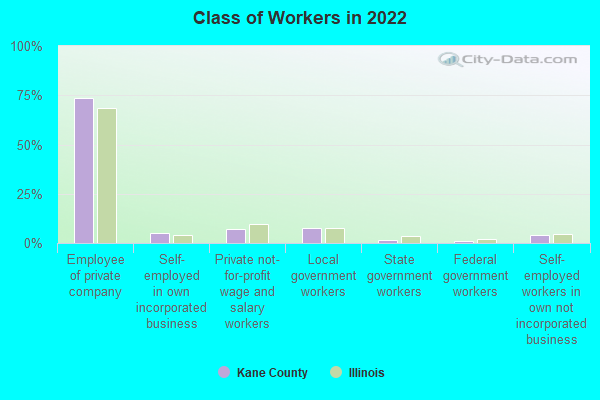
Type of workers:
- Private wage or salary: 86%
- Government: 10%
- Self-employed, not incorporated: 4%
- Unpaid family work: 0%
- OSM Map
- General Map
- Google Map
- MSN Map

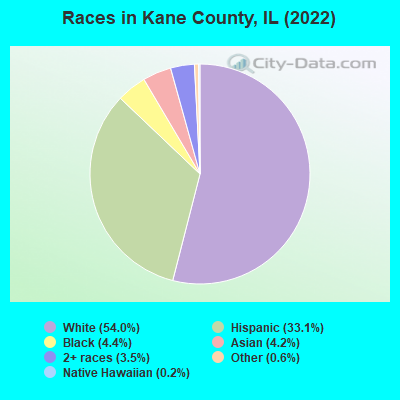
- 277,58054.0%White Non-Hispanic Alone
- 170,02833.1%Hispanic or Latino
- 22,7194.4%Black Non-Hispanic Alone
- 21,4114.2%Asian alone
- 17,8463.5%Two or more races
- 3,1800.6%Some other race alone
- 1,1080.2%Native Hawaiian and Other
Pacific Islander alone - 3100.06%American Indian and Alaska Native alone
| Median resident age: | 39.3 years |
| Illinois median age: | 39.1 years |
| Males: 258,142 | |
| Females: 256,040 |


| Kane County: | 2.0 people |
| Illinois: | 3 people |
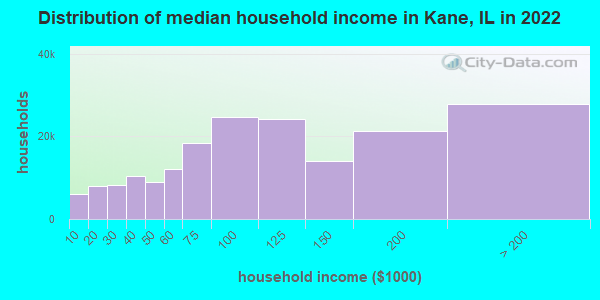
Estimated median household income in 2022: $93,343 ($59,351 in 1999)
| This county: | $93,343 |
| Illinois: | $76,708 |
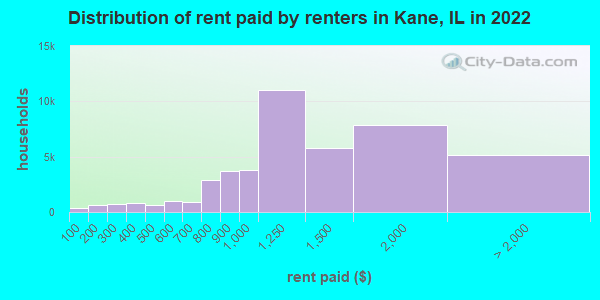
Median contract rent in 2022 for apartments: $1,146 (lower quartile is $880, upper quartile is $1,539)
| This county: | $1146 |
| State: | $1008 |
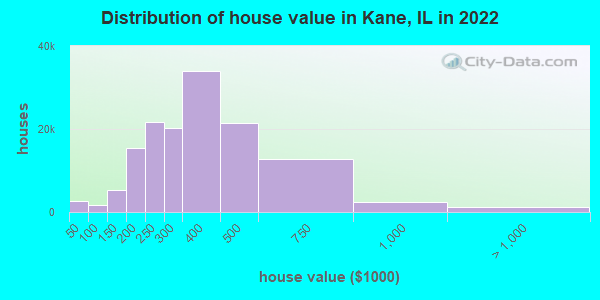
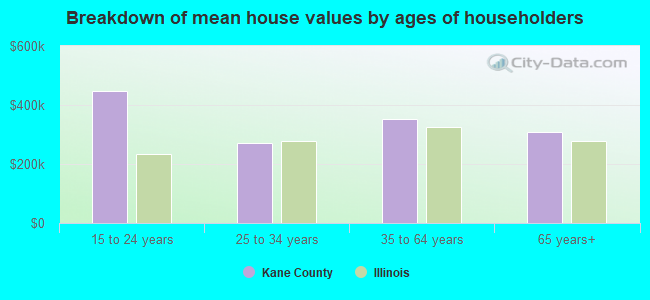
Estimated median house or condo value in 2022: $307,600 (it was $157,800 in 2000)
| Kane: | $307,600 |
| Illinois: | $251,600 |
Mean price in 2022:
Median monthly housing costs for homes and condos with a mortgage: $2,043Detached houses: $348,997
Here: $348,997 State: $310,164 Townhouses or other attached units: $264,487
Here: $264,487 State: $286,230 In 2-unit structures: $250,187
Here: $250,187 State: $299,638 In 3-to-4-unit structures: $224,806
Here: $224,806 State: $330,907 In 5-or-more-unit structures: $218,808
Here: $218,808 State: $318,887 Mobile homes: $76,141
Here: $76,141 State: $78,855
Median monthly housing costs for units without a mortgage: $881
Institutionalized population: 3,378
Crime in 2020 (reported by the sheriff's office or county police, not the county total):
- Murders: 0
- Rapes: 18
- Robberies: 12
- Assaults: 62
- Burglaries: 73
- Thefts: 751
- Auto thefts: 30
Crime in 2019 (reported by the sheriff's office or county police, not the county total):
- Murders: 1
- Rapes: 12
- Robberies: 9
- Assaults: 65
- Burglaries: 87
- Thefts: 171
- Auto thefts: 22
Health of residents in Kane County based on CDC Behavioral Risk Factor Surveillance System Survey Questionnaires from 2013 to 2021:
General health status score of residents in this county from 1 (poor) to 5 (excellent) is 3.5. This is about average.73.0% of residents exercised in the past month. This is about average.
40.5% of residents smoked 100+ cigarettes in their lives. This is less than average.
58.1% of adult residents drank alcohol in the past 30 days. This is less than average.
68.0% of residents visited a dentist within the past year. This is about average.
Average weight of males is 197 pounds. This is about average.
Average weight of females is 164 pounds. This is about average.
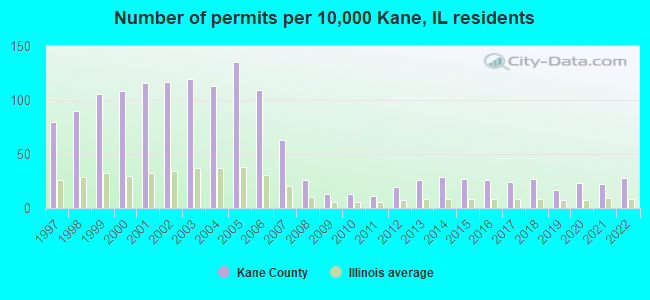
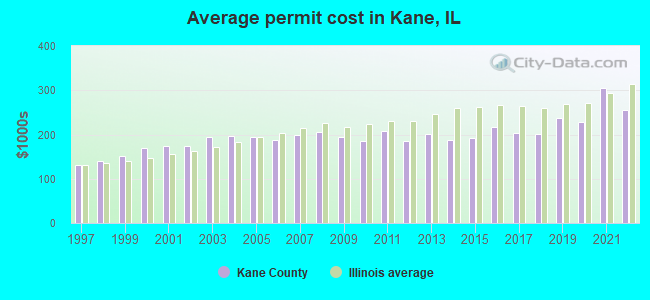
Single-family new house construction building permits:
- 2022: 1116 buildings, average cost: $255,100
- 2021: 894 buildings, average cost: $304,200
- 2020: 928 buildings, average cost: $229,400
- 2019: 697 buildings, average cost: $237,200
- 2018: 1073 buildings, average cost: $201,600
- 2017: 969 buildings, average cost: $202,600
- 2016: 1066 buildings, average cost: $215,800
- 2015: 1109 buildings, average cost: $192,600
- 2014: 1153 buildings, average cost: $188,100
- 2013: 1068 buildings, average cost: $201,700
- 2012: 788 buildings, average cost: $185,600
- 2011: 439 buildings, average cost: $208,500
- 2010: 527 buildings, average cost: $186,100
- 2009: 519 buildings, average cost: $193,600
- 2008: 1047 buildings, average cost: $205,800
- 2007: 2562 buildings, average cost: $197,500
- 2006: 4390 buildings, average cost: $188,300
- 2005: 5455 buildings, average cost: $194,100
- 2004: 4586 buildings, average cost: $196,000
- 2003: 4807 buildings, average cost: $195,100
- 2002: 4734 buildings, average cost: $174,100
- 2001: 4705 buildings, average cost: $173,100
- 2000: 4351 buildings, average cost: $170,400
- 1999: 4279 buildings, average cost: $151,500
- 1998: 3630 buildings, average cost: $139,700
- 1997: 3233 buildings, average cost: $132,300
Median real estate property taxes paid for housing units with mortgages in 2022: $7,080 (2.2%)
Median real estate property taxes paid for housing units with no mortgage in 2022: $6,239 (2.2%)
| Kane County: | 7.8% |
| Illinois: | 11.9% |
Median age of residents in 2022: 39.3 years old
(Males: 38.4 years old, Females: 40.1 years old)
(Median age for: White residents: 46.9 years old, Black residents: 36.4 years old, American Indian residents: 29.6 years old, Asian residents: 39.0 years old, Hispanic or Latino residents: 29.1 years old, Other race residents: 29.9 years old)
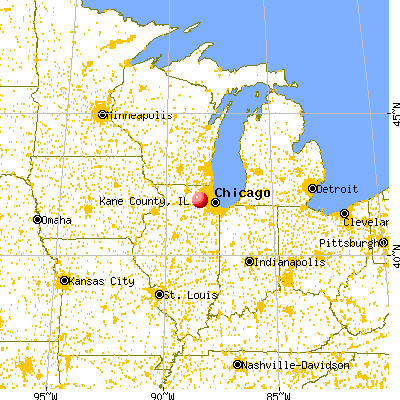
Area name: Chicago-Naperville-Joliet, IL HUD Metro FMR Area
Fair market rent in 2006 for a 1-bedroom apartment in Kane County is $802 a month.
Fair market rent for a 2-bedroom apartment is $901 a month.
Fair market rent for a 3-bedroom apartment is $1102 a month.
Cities in this county include: Aurora, Elgin, Carpentersville, St. Charles, Batavia, Geneva, South Elgin, Campton Hills, North Aurora, Montgomery.
2023 air pollution in Kane County:
Ozone (1-hour): 0.037 ppm (standard limit: 0.12 ppm). Near U.S. average.
Notable locations in this county outside city limits:
Notable locations in Kane County: Mid-Iron Golf Course (A), Whealan Camp (B), Knollwood Wastewater Treatment Plant (C), Camp Palos (D), Camp Kiwanis (E), Lakewood Country Club (F), Gleneagles Country Club (G), Cog Hill Country Club (H), Lemont Fire Protection District Station 2 (I), Lemont Fire Protection District Station 4 (J), Palos Fire Protection District Station 2 (K), Holy Family Villa (L). Display/hide their locations on the map
Churches in Kane County include: First Church of the Nazarene (A), Saint James at Sag Bridge Catholic Church (B), Welcome Hill Missionary Baptist Church (C), Emmanuel Christian Reformed Church (D), Peace Memorial Church (E), Saint Luke Church (F). Display/hide their locations on the map
Cemeteries: Mount Vernon Memorial Park (1), Sacred Heart Catholic Cemetery (2), Fairmount Cemetery (3). Display/hide their locations on the map
Lakes, reservoirs, and swamps: Pollywog Slough (A), Joes Pond (B), Tomahawk Slough (C), Belly Deep Slough (D), Hogwash Slough (E), Rainbarrel Slough (F), Katydid Slough (G), Longjohn Slough (H). Display/hide their locations on the map
Creeks: Mill Creek (A), Crooked Creek (B). Display/hide their locations on the map
Parks in Kane County include: Cap Sauers Holdings Nature Preserve (1), Cranberry Slough Nature Preserve (2), Paw Paw Woods Nature Preserve (3), Sagawau Canyon Nature Preserve (4), Plum Creek Forest Preserve (5). Display/hide their locations on the map
Neighboring counties: Modoc County, California  , Lucas County, Ohio
  , Lake County
  , Ulster County, New York , Porter County, Indiana
  , Winnebago County
  .
.
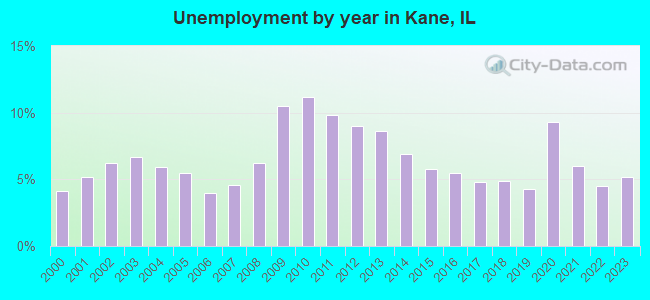
| Here: | 5.2% |
| Illinois: | 4.2% |
Current college students: 19,754
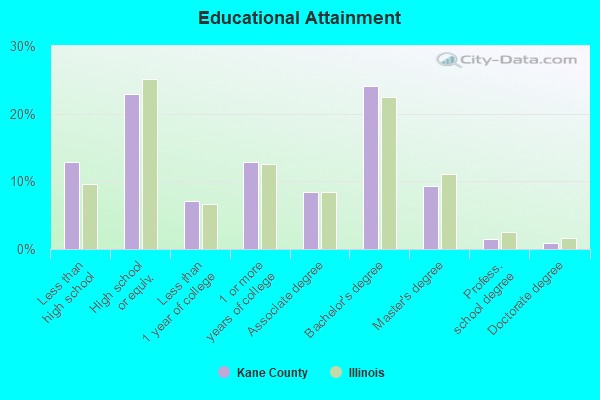
People 25 years of age or older with a high school degree or higher: 87.2%
People 25 years of age or older with a bachelor's degree or higher: 35.9%
Number of foreign born residents: 89,484 (50.6% naturalized citizens)
| Kane County: | 17.4% |
| Whole state: | 14.4% |
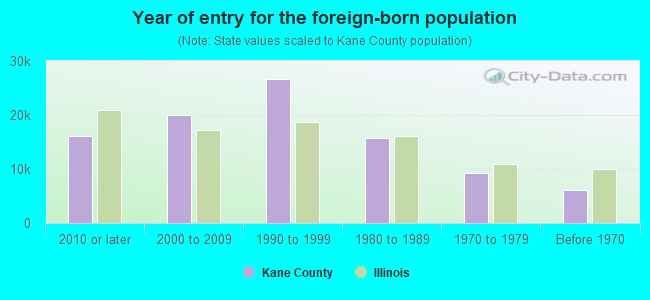
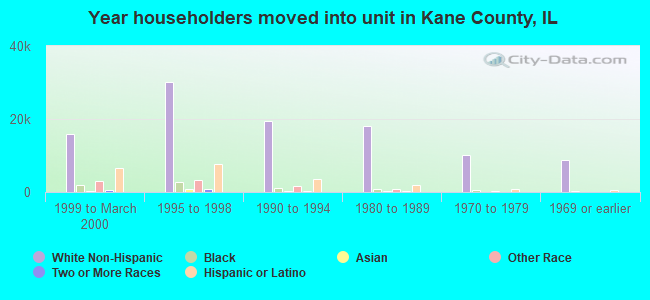
- Year of entry for the foreign-born population
- 16,1342010 or later
- 20,0822000 to 2009
- 26,6431990 to 1999
- 15,7401980 to 1989
- 9,3091970 to 1979
- 6,059Before 1970
Mean travel time to work (commute): minutes
Percentage of county residents living and working in this county: 99.6%
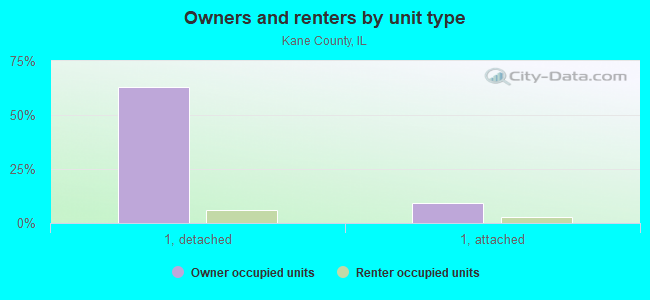
Housing units in structures:
- One, detached: 130,767
- One, attached: 23,032
- Two: 5,562
- 3 or 4: 6,325
- 5 to 9: 7,285
- 10 to 19: 5,735
- 20 to 49: 4,666
- 50 or more: 6,433
- Mobile homes: 963
- Boats, RVs, vans, etc.: 45
Housing units in Kane County with a mortgage: 91,062 (7,643 second mortgage, 110 home equity loan, 6,768 both second mortgage and home equity loan)
Houses without a mortgage: 1,950
| Here: | 98.9% with mortgage |
| State: | 97.4% with mortgage |
Religion statistics for Kane County
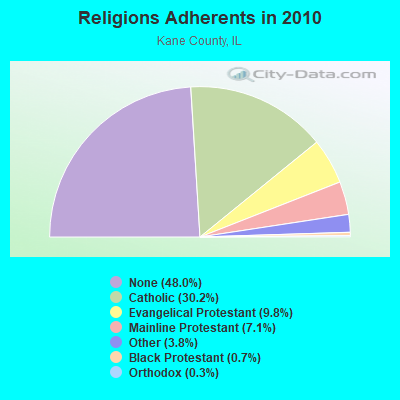
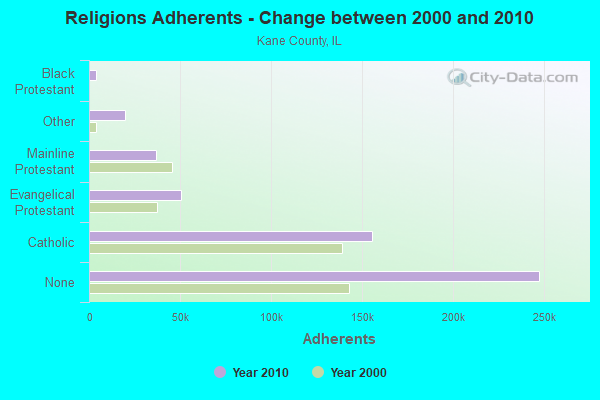
| Religion | Adherents | Congregations |
|---|---|---|
| Catholic | 155,391 | 28 |
| Evangelical Protestant | 50,728 | 184 |
| Mainline Protestant | 36,576 | 72 |
| Other | 19,744 | 30 |
| Black Protestant | 3,679 | 10 |
| Orthodox | 1,630 | 2 |
| None | 247,521 | - |
Source: Clifford Grammich, Kirk Hadaway, Richard Houseal, Dale E.Jones, Alexei Krindatch, Richie Stanley and Richard H.Taylor. 2012. 2010 U.S.Religion Census: Religious Congregations & Membership Study. Association of Statisticians of American Religious Bodies. Jones, Dale E., et al. 2002. Congregations and Membership in the United States 2000. Nashville, TN: Glenmary Research Center.
Food Environment Statistics:
| Kane County: | 1.61 / 10,000 pop. |
| State: | 2.24 / 10,000 pop. |
| Here: | 0.08 / 10,000 pop. |
| Illinois: | 0.08 / 10,000 pop. |
| This county: | 0.54 / 10,000 pop. |
| Illinois: | 0.75 / 10,000 pop. |
| Kane County: | 1.95 / 10,000 pop. |
| Illinois: | 2.61 / 10,000 pop. |
| This county: | 5.90 / 10,000 pop. |
| State: | 6.86 / 10,000 pop. |
| Kane County: | 7.2% |
| Illinois: | 8.3% |
| Kane County: | 27.2% |
| State: | 25.2% |
| Here: | 15.1% |
| State: | 14.5% |
Agriculture in Kane County:
Average size of farms: 320 acresAverage value of agricultural products sold per farm: $187,487
Average value of crops sold per acre for harvested cropland: $563.03
The value of nursery, greenhouse, floriculture, and sod as a percentage of the total market value of agricultural products sold: 48.07%
The value of livestock, poultry, and their products as a percentage of the total market value of agricultural products sold: 12.82%
Average total farm production expenses per farm: $170,686
Harvested cropland as a percentage of land in farms: 90.66%
Average market value of all machinery and equipment per farm: $124,787
The percentage of farms operated by a family or individual: 79.16%
Average age of principal farm operators: 55 years
Average number of cattle and calves per 100 acres of all land in farms: 4.81
Milk cows as a percentage of all cattle and calves: 13.29%
Corn for grain: 89250 harvested acres
All wheat for grain: 2800 harvested acres
Soybeans for beans: 77197 harvested acres
Vegetables: 671 harvested acres
Land in orchards: 74 acres
Tornado activity:
Kane County historical area-adjusted tornado activity is significantly below Illinois state average. It is 837150.8 times below overall U.S. average.Tornadoes in this county have caused 41 fatalities and 896 injuries recorded between 1950 and 2004.
On 4/21/1967, a category 4 (max. wind speeds 207-260 mph) tornado killed 33 people and injured 500 people and caused between $5,000,000 and $50,000,000 in damages.
Earthquake activity:
Kane County-area historical earthquake activity is significantly above Illinois state average. It is 50% greater than the overall U.S. average.On 4/18/2008 at 09:36:59, a magnitude 5.4 (5.1 MB, 4.8 MS, 5.4 MW, 5.2 MW, Class: Moderate, Intensity: VI - VII) earthquake occurred 240.9 miles away from Kane County center
On 6/10/1987 at 23:48:54, a magnitude 5.1 (4.9 MB, 4.4 MS, 4.6 MS, 5.1 LG) earthquake occurred 215.6 miles away from the county center
On 4/18/2008 at 09:36:59, a magnitude 5.2 (5.2 MW, Depth: 8.9 mi) earthquake occurred 241.0 miles away from the county center
On 6/28/2004 at 06:10:52, a magnitude 4.2 (4.2 MW, Depth: 6.2 mi, Class: Light, Intensity: IV - V) earthquake occurred 43.0 miles away from the county center
On 2/10/2010 at 09:59:35, a magnitude 3.8 (3.8 MW, Depth: 6.2 mi, Class: Light, Intensity: II - III) earthquake occurred 8.9 miles away from Kane County center
On 6/18/2002 at 17:37:15, a magnitude 5.0 (4.3 MB, 4.6 MW, 5.0 LG) earthquake occurred 273.5 miles away from the county center
Magnitude types: regional Lg-wave magnitude (LG), body-wave magnitude (MB), surface-wave magnitude (MS), moment magnitude (MW)
Most recent natural disasters:
- Illinois Covid-19 Pandemic, Incident Period: January 20, 2020, FEMA Id: 4489, Natural disaster type: Other
- Illinois Severe Storms, Straight-Line Winds and Flooding, Incident Period: April 16, 2013 to May 05, 2013, Major Disaster (Presidential) Declared DR-4116: May 10, 2013, FEMA Id: 4116, Natural disaster type: Storm, Flood, Wind
- Illinois Severe Winter Storm and Snowstorm, Incident Period: January 31, 2011 to February 03, 2011, Major Disaster (Presidential) Declared DR-1960: March 17, 2011, FEMA Id: 1960, Natural disaster type: Snowstorm, Winter Storm
- Illinois Severe Storms and Flooding, Incident Period: September 13, 2008 to October 05, 2008, Major Disaster (Presidential) Declared DR-1800: October 03, 2008, FEMA Id: 1800, Natural disaster type: Storm, Flood
- Illinois Severe Storms and Flooding, Incident Period: August 20, 2007 to August 31, 2007, Major Disaster (Presidential) Declared DR-1729: September 25, 2007, FEMA Id: 1729, Natural disaster type: Storm, Flood
- Illinois Hurricane Katrina Evacuation, Incident Period: August 29, 2005 to October 01, 2005, Emergency Declared EM-3230: September 07, 2005, FEMA Id: 3230, Natural disaster type: Hurricane
- Illinois Severe Winter Storm, Incident Period: December 11, 2000 to December 31, 2000, Emergency Declared EM-3161: January 17, 2001, FEMA Id: 3161, Natural disaster type: Winter Storm
- Illinois Winter Snow Storm, Incident Period: January 01, 1999 to January 15, 1999, Emergency Declared EM-3134: January 08, 1999, FEMA Id: 3134, Natural disaster type: Storm, Snow
- Illinois Flooding, Incident Period: July 17, 1996 to August 07, 1996, Major Disaster (Presidential) Declared DR-1129: July 25, 1996, FEMA Id: 1129, Natural disaster type: Flood
- Illinois Tornadoes, Incident Period: August 28, 1990, Major Disaster (Presidential) Declared DR-878: August 29, 1990, FEMA Id: 878, Natural disaster type: Tornado
- 5 other natural disasters have been reported since 1953.
The number of natural disasters in Kane County (15) is near the US average (15).
Major Disasters (Presidential) Declared: 10
Emergencies Declared: 4
Causes of natural disasters: Floods: 7, Storms: 7, Snowstorms: 2, Tornadoes: 2, Winter Storms: 2, Blizzard: 1, Hurricane: 1, Snow: 1, Wind: 1, Other: 1 (Note: some incidents may be assigned to more than one category).
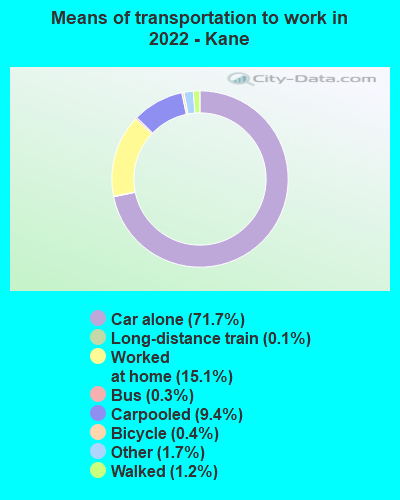
Means of transportation to work:
- Drove a car alone: 175,755 (71.7%)
- Carpooled: 23,033 (9.4%)
- Bus: 822 (0.3%)
- Subway or elevated rail: 88 (0.0%)
- Long-distance train or commuter rail: 327 (0.1%)
- Ferryboat: 83 (0.0%)
- Taxicab, motorcycle, or other means: 4,197 (1.7%)
- Bicycle: 915 (0.4%)
- Walked: 2,981 (1.2%)
- Worked at home: 36,972 (15.1%)

- Health care and social assistance (16%)
- Retail trade (11%)
- Manufacturing (10%)
- Educational services (9%)
- Accommodation and food services (8%)
- Professional, scientific, and technical services (6%)
- Other services, except public administration (5%)
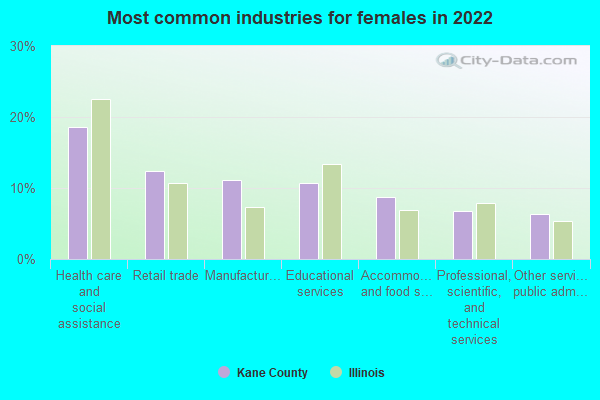
- Health care and social assistance (19%)
- Retail trade (12%)
- Manufacturing (11%)
- Educational services (11%)
- Accommodation and food services (9%)
- Professional, scientific, and technical services (7%)
- Other services, except public administration (6%)
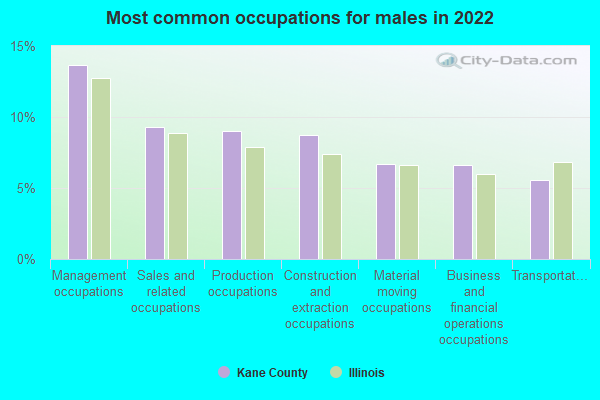
- Management occupations (14%)
- Sales and related occupations (9%)
- Production occupations (9%)
- Construction and extraction occupations (9%)
- Material moving occupations (7%)
- Business and financial operations occupations (7%)
- Transportation occupations (6%)
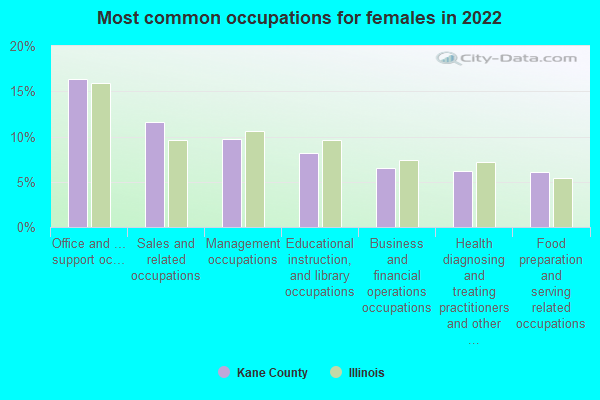
- Office and administrative support occupations (16%)
- Sales and related occupations (12%)
- Management occupations (10%)
- Educational instruction, and library occupations (8%)
- Business and financial operations occupations (6%)
- Health diagnosing and treating practitioners and other technical occupations (6%)
- Food preparation and serving related occupations (6%)
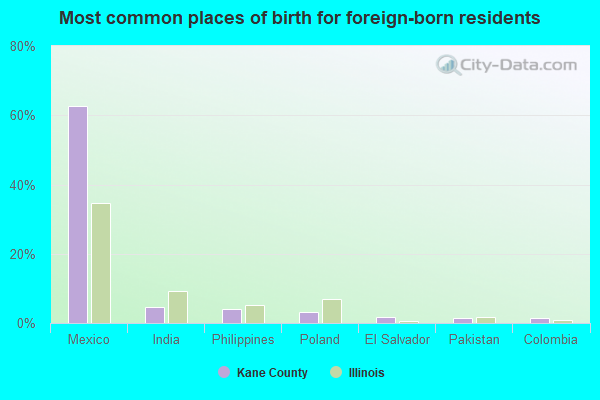
- Mexico (63%)
- India (5%)
- Philippines (4%)
- Poland (3%)
- El Salvador (2%)
- Pakistan (1%)
- Colombia (1%)
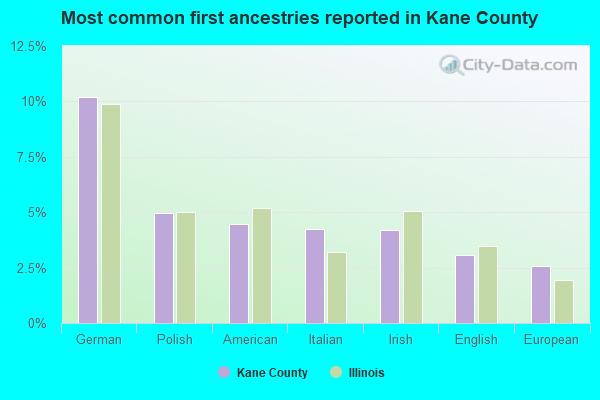
- German (10%)
- Polish (5%)
- American (4%)
- Italian (4%)
- Irish (4%)
- English (3%)
- European (3%)
People in group quarters in Kane County, Illinois in 2010:
- 1,812 people in nursing facilities/skilled-nursing facilities
- 1,116 people in college/university student housing
- 1,090 people in workers' group living quarters and job corps centers
- 644 people in local jails and other municipal confinement facilities
- 434 people in emergency and transitional shelters (with sleeping facilities) for people experiencing homelessness
- 316 people in correctional facilities intended for juveniles
- 308 people in mental (psychiatric) hospitals and psychiatric units in other hospitals
- 268 people in other noninstitutional facilities
- 265 people in residential treatment centers for adults
- 236 people in group homes intended for adults
- 134 people in state prisons
- 123 people in correctional residential facilities
- 29 people in group homes for juveniles (non-correctional)
- 12 people in residential treatment centers for juveniles (non-correctional)
People in group quarters in Kane County, Illinois in 2000:
- 2,274 people in nursing homes
- 787 people in college dormitories (includes college quarters off campus)
- 667 people in unknown juvenile institutions
- 580 people in short-term care, detention or diagnostic centers for delinquent children
- 387 people in local jails and other confinement facilities (including police lockups)
- 370 people in state prisons
- 324 people in other noninstitutional group quarters
- 302 people in mental (psychiatric) hospitals or wards
- 234 people in other nonhousehold living situations
- 144 people in homes or halfway houses for drug/alcohol abuse
- 132 people in religious group quarters
- 84 people in homes for the mentally retarded
- 82 people in homes for the mentally ill
- 51 people in halfway houses
- 51 people in agriculture workers' dormitories on farms
- 34 people in other group homes
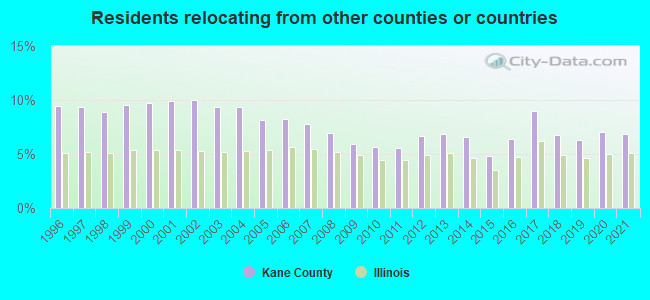
6.90% of this county's 2021 resident taxpayers lived in other counties in 2020 ($73,788 average adjusted gross income)
| Here: | 6.90% |
| Illinois average: | 5.09% |
10 or fewer of this county's residents moved from foreign countries.
5.56% relocated from other counties in Illinois ($59,436 average AGI)
1.33% relocated from other states ($14,352 average AGI)
Kane County: 1.33% Illinois average: 2.01%
Top counties from which taxpayers relocated into this county between 2020 and 2021:
| from Cook County, IL | |
| from DuPage County, IL | |
| from McHenry County, IL | |
| from Kendall County, IL | |
| from Will County, IL | |
| from DeKalb County, IL | |
| from Lake County, IL |
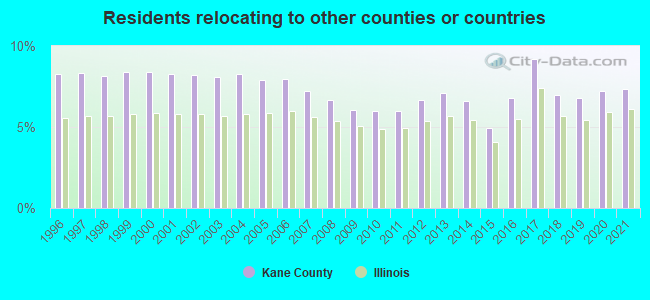
7.35% of this county's 2020 resident taxpayers moved to other counties in 2021 ($81,683 average adjusted gross income)
| Here: | 7.35% |
| Illinois average: | 6.10% |
0.01% of residents moved to foreign countries ($73 average AGI)
Kane County: 0.01% Illinois average: 0.01%
4.70% relocated to other counties in Illinois ($41,852 average AGI)
2.63% relocated to other states ($39,757 average AGI)
Kane County: 2.63% Illinois average: 3.06%
Top counties to which taxpayers relocated from this county between 2020 and 2021:
| to Cook County, IL | |
| to DuPage County, IL | |
| to McHenry County, IL | |
| to Kendall County, IL | |
| to DeKalb County, IL | |
| to Will County, IL | |
| to Maricopa County, AZ |
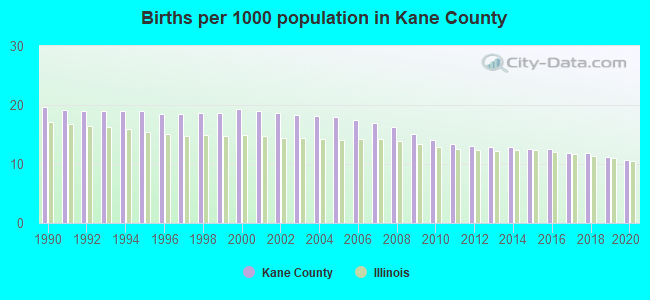
Births per 1000 population from 1990 to 1999: 18.9
Births per 1000 population from 2000 to 2009: 17.7
Births per 1000 population from 2010 to 2022: 10.6
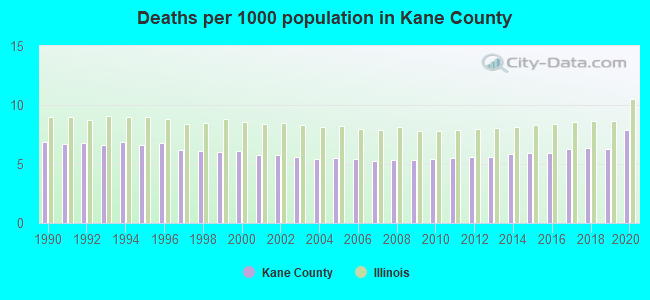
Deaths per 1000 population from 1990 to 1999: 6.6
Deaths per 1000 population from 2000 to 2009: 5.6
Deaths per 1000 population from 2010 to 2020: 6.1
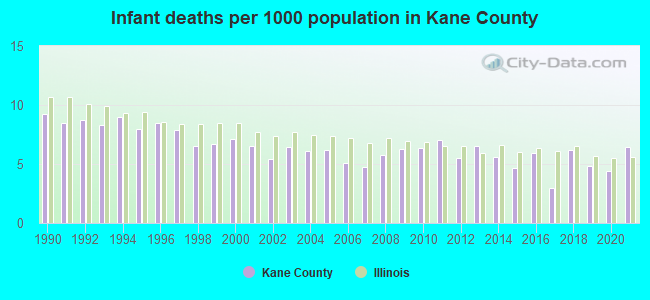
Infant deaths per 1000 live births from 1990 to 1999: 8.1
Infant deaths per 1000 live births from 2000 to 2009: 6.0
Infant deaths per 1000 live births from 2010 to 2021: 5.5
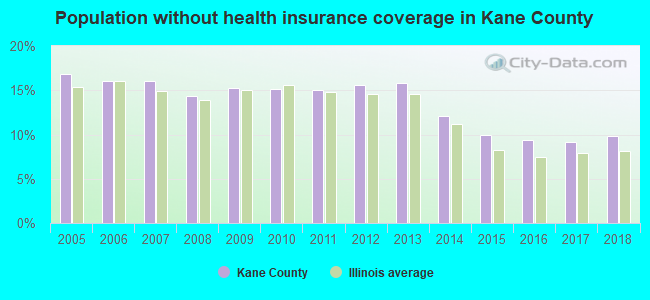
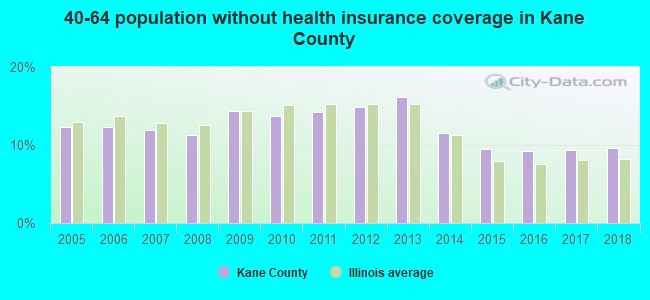
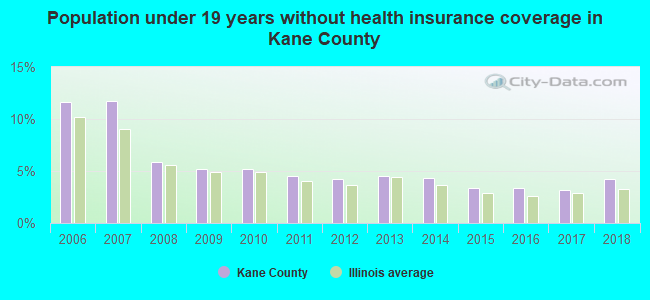
Persons under 19 years old without health insurance coverage in 2018: 4.2%
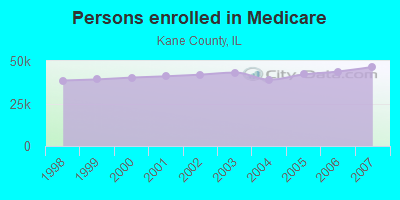
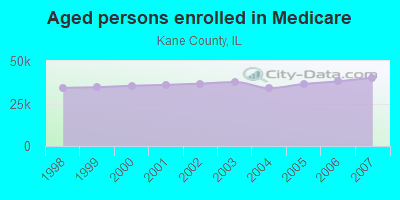
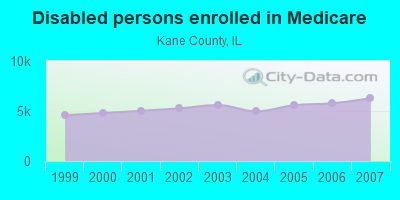
Persons enrolled in hospital insurance and/or supplemental medical insurance (Medicare) in July 1, 2007: 46,521 (40,239 aged, 6,282 disabled)
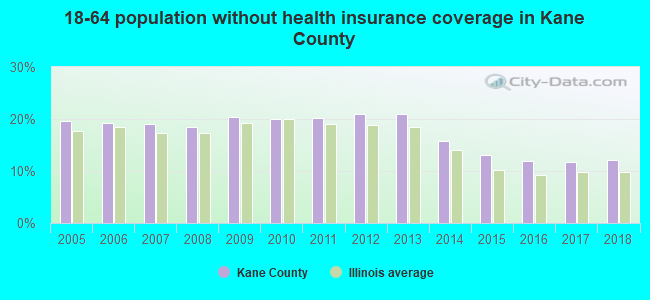
Children under 18 without health insurance coverage in 2007: 14,755 (9%)
Most common underlying causes of death in Kane County, Illinois in 1999 - 2019:
- Atherosclerotic heart disease (5,065)
- Bronchus or lung, unspecified - Malignant neoplasms (3,641)
- Unspecified dementia (2,771)
- Acute myocardial infarction, unspecified (2,393)
- Chronic obstructive pulmonary disease, unspecified (2,067)
- Stroke, not specified as haemorrhage or infarction (1,617)
- Congestive heart failure (1,502)
- Alzheimer disease, unspecified (1,360)
- Pneumonia, unspecified (1,321)
- Breast, unspecified - Malignant neoplasms (1,094)
Population without health insurance coverage in 2000: 13%
Children under 18 without health insurance coverage in 2000: 9%
Short term general hospital admissions per 100,000 population in 2004: 9,292
Short term general hospital beds per 100,000 population in 2004: 174
Emergency room visits per 100,000 population in 2004: 31,113
General practice office based MDs per 100,000 population in 2005: 1,756
Medical specialist MDs per 100,000 population in 2005: 556
Dentists per 100,000 population in 1998: 10
Total births per 100,000 population, July 2005 - July 2006 : 58
Total deaths per 100,000 population, July 2005 - July 2006: 75
Limited-service eating places per 100,000 population in 2005 : 11
Beer, wine & liquor stores per 100,000 population in 2005: 1
EPA green book nonattainment status in 2004-2006: 1
Homicides per 1,000,000 population from 2000 to 2006: 41.0. This is less than state average.
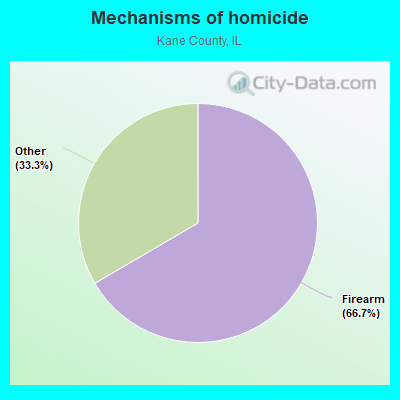
- Firearm - 27.3
- Other - 13.7
Suicides per 1,000,000 population from 2000 to 2006: 73.0. This is less than state average.
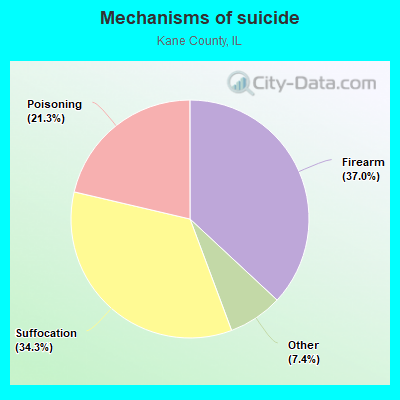
- Firearm - 27.0
- Suffocation - 25.1
- Poisoning - 15.6
- Other - 5.4
Household type by relationship:
Households: 514,182- Male householders: 96,947 (18,042 living alone), Female householders: 87,300 (22,419 living alone)
100,008 spouses (99,376 opposite-sex spouses), 15,170 unmarried partners, (14,548 opposite-sex unmarried partners), 166,635 children (156,344 natural, 2,896 adopted, 7,395 stepchildren), 10,328 grandchildren, 6,859 brothers or sisters, 9,406 parents, 1,041 foster children, 7,240 other relatives, 8,238 non-relatives
- In group quarters: 5,010
Size of family households: 51,141 2-persons, 30,182 3-persons, 30,598 4-persons, 12,156 5-persons, 5,905 6-persons, 3,856 7-or-more-persons.
Size of nonfamily households: 40,461 1-person, 8,478 2-persons, 1,164 3-persons, 268 4-persons, 38 7-or-more-persons.
78,356 married couples with children.
29,384 single-parent households (8,656 men, 20,728 women).
68.0% of residents of Kane speak English at home.
25.6% of residents speak Spanish at home (61% speak English very well, 20% speak English well, 14% speak English not well, 4% don't speak English at all).
3.6% of residents speak other Indo-European language at home (70% speak English very well, 19% speak English well, 9% speak English not well, 2% don't speak English at all).
2.3% of residents speak Asian or Pacific Island language at home (72% speak English very well, 20% speak English well, 8% speak English not well).
0.5% of residents speak other language at home (77% speak English very well, 16% speak English well, 7% speak English not well).
In fiscal year 2004:
Federal Government expenditure: $1,781,967,000 ($3,772 per capita)
Department of Defense expenditure: $58,381,000
Federal direct payments to individuals for retirement and disability: $684,427,000
Federal other direct payments to individuals: $314,100,000
Federal direct payments not to individuals: $10,990,000
Federal grants: $203,506,000
Federal procurement contracts: $393,894,000 ($44,867,000 Department of Defense)
Federal salaries and wages: $175,050,000 ($1,685,000 Department of Defense)
Federal Government direct loans: $15,943,000
Federal guaranteed/insured loans: $530,623,000
Federal Government insurance: $274,346,000
Population change from April 1, 2000 to July 1, 2005:
Births: 42,955| Here: | 89 per 1000 residents |
| State: | 75 per 1000 residents |
Deaths: 13,260
| Here: | 28 per 1000 residents |
| State: | 43 per 1000 residents |
Net international migration: +16,110
| Here: | +33 per 1000 residents |
| State: | +26 per 1000 residents |
Net internal migration: +31,486
| Here: | |
| State: |
Total withdrawal of fresh water for public supply: 52.71 millions of gallons per day (60% from ground, 40% from surface)
| Here: | 7.0 |
| State: | 6.4 |
| Here: | 4.1 |
| State: | 4.1 |
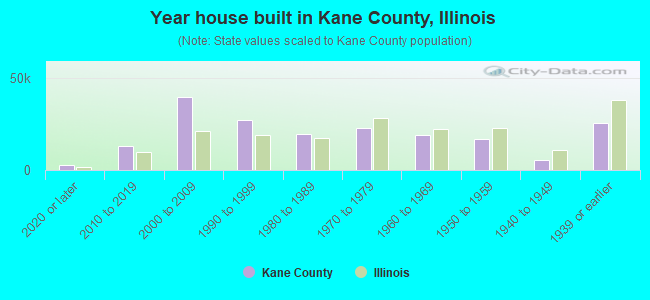
- Year house built in Kane County, Illinois
- 2,9292020 or later
- 12,8432010 to 2019
- 39,4172000 to 2009
- 26,8831990 to 1999
- 19,5811980 to 1989
- 22,8511970 to 1979
- 18,7971960 to 1969
- 16,7501950 to 1959
- 5,3521940 to 1949
- 25,4101939 or earlier
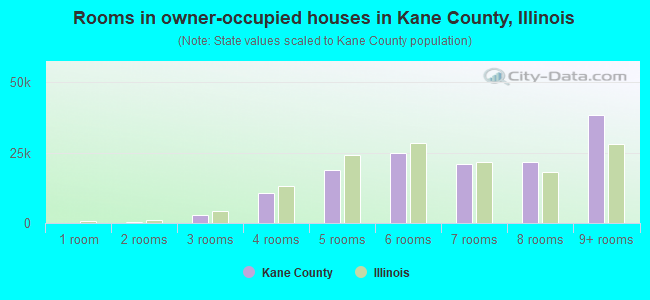
- Rooms in owner-occupied houses in Kane County, Illinois
- 721 room
- 3672 rooms
- 2,9963 rooms
- 10,7814 rooms
- 18,8355 rooms
- 24,9726 rooms
- 20,8777 rooms
- 21,6968 rooms
- 38,2999+ rooms
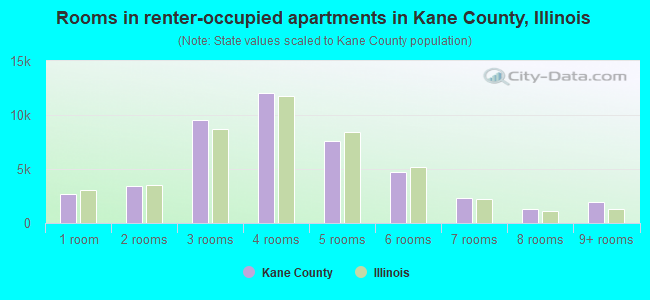
- Rooms in renter-occupied apartments in Kane County, Illinois
- 2,6981 room
- 3,3832 rooms
- 9,5333 rooms
- 12,0034 rooms
- 7,6035 rooms
- 4,6866 rooms
- 2,2807 rooms
- 1,2658 rooms
- 1,9019+ rooms
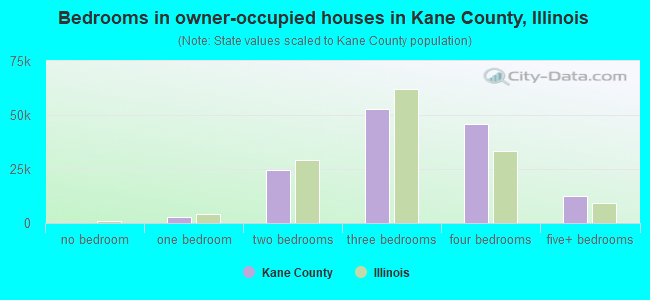
- Bedrooms in owner-occupied houses in Kane County, Illinois
- 72no bedroom
- 2,9781 bedroom
- 24,6222 bedrooms
- 52,8263 bedrooms
- 45,8724 bedrooms
- 12,5255+ bedrooms
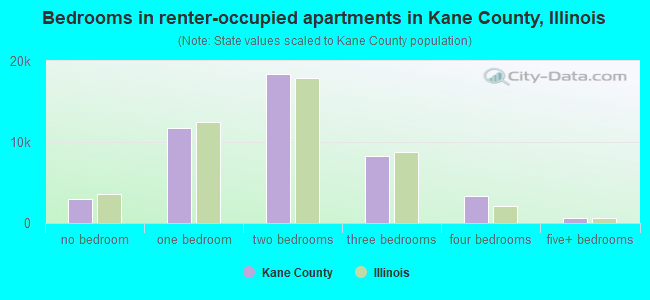
- Bedrooms in renter-occupied apartments in Kane County, Illinois
- 2,995no bedroom
- 11,7631 bedroom
- 18,3392 bedrooms
- 8,3073 bedrooms
- 3,3654 bedrooms
- 5835+ bedrooms
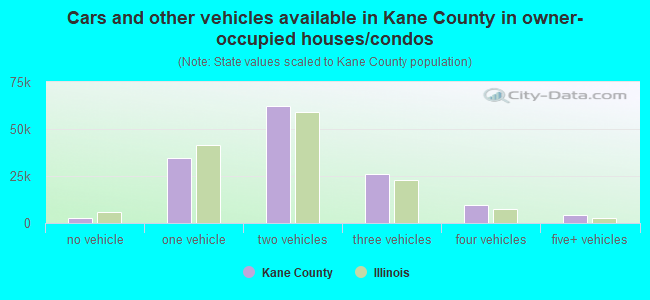
- Cars and other vehicles available in Kane County in owner-occupied houses/condos
- 2,549no vehicle
- 34,3421 vehicle
- 62,4742 vehicles
- 25,8703 vehicles
- 9,4284 vehicles
- 4,2325+ vehicles
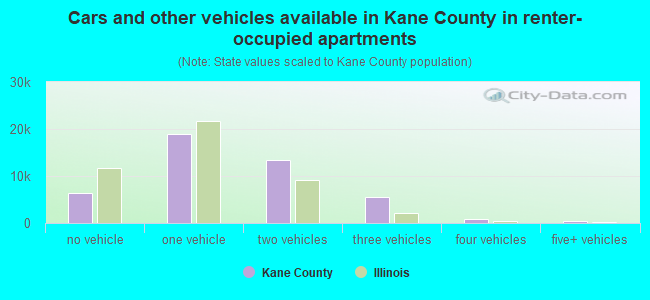
- Cars and other vehicles available in Kane County in renter-occupied apartments
- 6,311no vehicle
- 18,8891 vehicle
- 13,3512 vehicles
- 5,4643 vehicles
- 8654 vehicles
- 4725+ vehicles
90.5% of Kane County residents lived in the same house 1 years ago.
Out of people who lived in different houses, 29% lived in this county.
Out of people who lived in different counties, 81% lived in Illinois.
| Kane County: | 90.5% |
| State average: | 88.3% |
Place of birth for U.S.-born residents:
- This state: 344,717
- Other state: 71,744
- Northeast: 11,868
- Midwest: 30,993
- South: 16,726
- West: 12,157
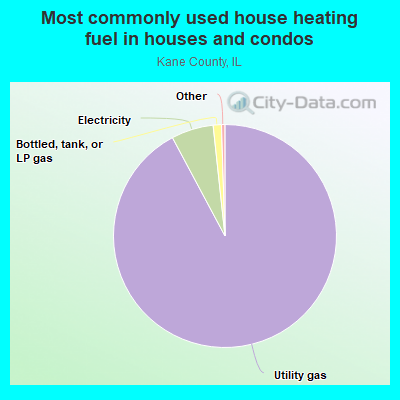
- 92.2%Utility gas
- 6.1%Electricity
- 1.2%Bottled, tank, or LP gas
- 0.2%Other fuel
- 0.2%No fuel used
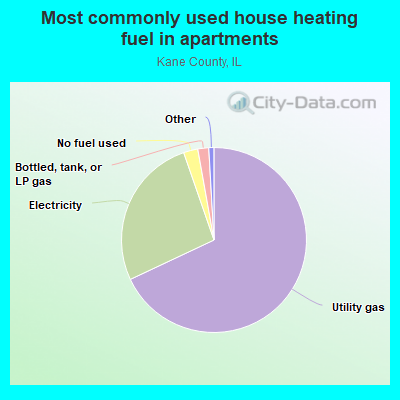
- 68.0%Utility gas
- 26.7%Electricity
- 2.5%No fuel used
- 1.9%Bottled, tank, or LP gas
- 0.7%Other fuel
- 0.1%Fuel oil, kerosene, etc.
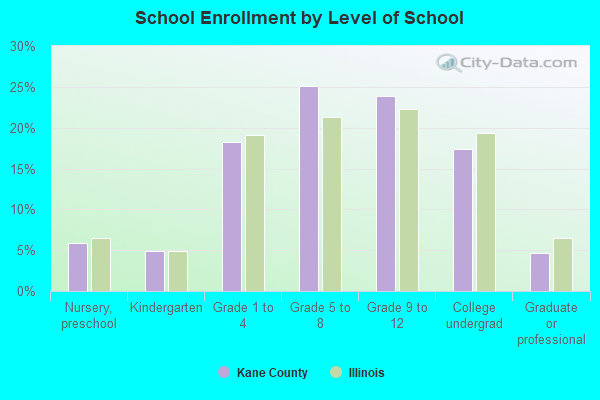
Private vs. public school enrollment:
| Here: | 7.0% |
| Illinois: | 13.3% |
| Here: | 7.5% |
| Illinois: | 9.9% |
| Here: | 24.5% |
| Illinois: | 27.4% |
Kane County government finances - Expenditure in 2018:
- Bond Funds - Cash and Securities: $22,838,000
- Charges - Other: $28,043,000
Other: $26,997,000
Natural Resources - Other: $3,399,000
Natural Resources - Other: $3,355,000
Parks and Recreation: $3,317,000
Parks and Recreation: $2,622,000
Solid Waste Management: $157,000
Solid Waste Management: $37,000
- Construction - Regular Highways: $40,731,000
Regular Highways: $11,550,000
Natural Resources - Other: $2,019,000
Natural Resources - Other: $1,733,000
Central Staff Services: $228,000
Central Staff Services: $205,000
Housing and Community Development: $1,000
- Current Operations - General - Other: $40,823,000
General - Other: $37,828,000
Regular Highways: $26,413,000
Judicial and Legal Services: $24,510,000
Judicial and Legal Services: $23,579,000
Correctional Institutions: $21,626,000
Correctional Institutions: $20,303,000
Regular Highways: $18,871,000
Police Protection: $16,701,000
Police Protection: $15,079,000
Central Staff Services: $11,933,000
Central Staff Services: $11,841,000
Natural Resources - Other: $11,454,000
Natural Resources - Other: $9,390,000
Solid Waste Management: $6,445,000
Public Welfare - Other: $6,233,000
Public Welfare - Other: $6,085,000
Health - Other: $5,551,000
Health - Other: $5,460,000
General Public Buildings: $4,721,000
General Public Buildings: $4,492,000
Housing and Community Development: $4,343,000
Housing and Community Development: $4,315,000
Financial Administration: $1,939,000
Financial Administration: $1,731,000
Parks and Recreation: $757,000
Solid Waste Management: $449,000
- Federal Intergovernmental - Public Welfare: $6,338,000
Public Welfare: $6,094,000
Other: $1,601,000
Housing and Community Development: $1,534,000
Other: $1,387,000
Housing and Community Development: $1,311,000
Health and Hospitals: $729,000
Health and Hospitals: $600,000
- General - Interest on Debt: $14,062,000
Interest on Debt: $12,870,000
- Intergovernmental to Local - Other - Natural Resources - Other: $300,000
Other - Natural Resources - Other: $124,000
- Local Intergovernmental - Other: $5,211,000
Other: $3,000
- Long Term Debt - Outstanding Unspecified Public Purpose: $433,979,000
Beginning Outstanding - Unspecified Public Purpose: $404,660,000
Outstanding Unspecified Public Purpose: $399,778,000
Beginning Outstanding - Unspecified Public Purpose: $380,853,000
Retired Unspecified Public Purpose: $143,982,000
Issue, Unspecified Public Purpose: $139,099,000
Issue, Unspecified Public Purpose: $113,072,000
Retired Unspecified Public Purpose: $59,946,000
- Miscellaneous - Interest Earnings: $9,518,000
General Revenue - Other: $5,985,000
General Revenue - Other: $5,073,000
Fines and Forfeits: $4,310,000
Fines and Forfeits: $4,103,000
Interest Earnings: $3,173,000
Sale of Property: $166,000
Sale of Property: $29,000
- Other Capital Outlay - Natural Resources - Other: $14,721,000
Natural Resources - Other: $4,080,000
Central Staff Services: $2,484,000
Police Protection: $2,015,000
Regular Highways: $1,597,000
Police Protection: $1,438,000
Regular Highways: $901,000
Central Staff Services: $813,000
General - Other: $152,000
General - Other: $87,000
Public Welfare - Other: $44,000
Housing and Community Development: $37,000
Public Welfare - Other: $30,000
- Other Funds - Cash and Securities: $372,798,000
Cash and Securities: $341,609,000
- Sinking Funds - Cash and Securities: $10,224,000
Cash and Securities: $10,097,000
- State Intergovernmental - General Local Government Support: $42,927,000
General Local Government Support: $40,943,000
Highways: $20,572,000
Highways: $20,307,000
Other: $9,269,000
Other: $7,050,000
Health and Hospitals: $1,732,000
Health and Hospitals: $1,251,000
Housing and Community Development: $1,211,000
Housing and Community Development: $940,000
- Tax - Property: $119,193,000
Property: $101,614,000
Other License: $3,347,000
Other Selective Sales: $2,762,000
Other License: $2,367,000
Other Selective Sales: $2,321,000
Other: $307,000
Other: $260,000
- Total Salaries and Wages: $75,236,000
: $73,862,000
Kane County government finances - Revenue in 2018:
- Bond Funds - Cash and Securities: $22,838,000
- Charges - Other: $28,043,000
Other: $26,997,000
Natural Resources - Other: $3,399,000
Natural Resources - Other: $3,355,000
Parks and Recreation: $3,317,000
Parks and Recreation: $2,622,000
Solid Waste Management: $157,000
Solid Waste Management: $37,000
- Construction - Regular Highways: $40,731,000
Regular Highways: $11,550,000
Natural Resources - Other: $2,019,000
Natural Resources - Other: $1,733,000
Central Staff Services: $228,000
Central Staff Services: $205,000
Housing and Community Development: $1,000
- Current Operations - General - Other: $40,823,000
General - Other: $37,828,000
Regular Highways: $26,413,000
Judicial and Legal Services: $24,510,000
Judicial and Legal Services: $23,579,000
Correctional Institutions: $21,626,000
Correctional Institutions: $20,303,000
Regular Highways: $18,871,000
Police Protection: $16,701,000
Police Protection: $15,079,000
Central Staff Services: $11,933,000
Central Staff Services: $11,841,000
Natural Resources - Other: $11,454,000
Natural Resources - Other: $9,390,000
Solid Waste Management: $6,445,000
Public Welfare - Other: $6,233,000
Public Welfare - Other: $6,085,000
Health - Other: $5,551,000
Health - Other: $5,460,000
General Public Buildings: $4,721,000
General Public Buildings: $4,492,000
Housing and Community Development: $4,343,000
Housing and Community Development: $4,315,000
Financial Administration: $1,939,000
Financial Administration: $1,731,000
Parks and Recreation: $757,000
Solid Waste Management: $449,000
- Federal Intergovernmental - Public Welfare: $6,338,000
Public Welfare: $6,094,000
Other: $1,601,000
Housing and Community Development: $1,534,000
Other: $1,387,000
Housing and Community Development: $1,311,000
Health and Hospitals: $729,000
Health and Hospitals: $600,000
- General - Interest on Debt: $14,062,000
Interest on Debt: $12,870,000
- Intergovernmental to Local - Other - Natural Resources - Other: $300,000
Other - Natural Resources - Other: $124,000
- Local Intergovernmental - Other: $5,211,000
Other: $3,000
- Long Term Debt - Outstanding Unspecified Public Purpose: $433,979,000
Beginning Outstanding - Unspecified Public Purpose: $404,660,000
Outstanding Unspecified Public Purpose: $399,778,000
Beginning Outstanding - Unspecified Public Purpose: $380,853,000
Retired Unspecified Public Purpose: $143,982,000
Issue, Unspecified Public Purpose: $139,099,000
Issue, Unspecified Public Purpose: $113,072,000
Retired Unspecified Public Purpose: $59,946,000
- Miscellaneous - Interest Earnings: $9,518,000
General Revenue - Other: $5,985,000
General Revenue - Other: $5,073,000
Fines and Forfeits: $4,310,000
Fines and Forfeits: $4,103,000
Interest Earnings: $3,173,000
Sale of Property: $166,000
Sale of Property: $29,000
- Other Capital Outlay - Natural Resources - Other: $14,721,000
Natural Resources - Other: $4,080,000
Central Staff Services: $2,484,000
Police Protection: $2,015,000
Regular Highways: $1,597,000
Police Protection: $1,438,000
Regular Highways: $901,000
Central Staff Services: $813,000
General - Other: $152,000
General - Other: $87,000
Public Welfare - Other: $44,000
Housing and Community Development: $37,000
Public Welfare - Other: $30,000
- Other Funds - Cash and Securities: $372,798,000
Cash and Securities: $341,609,000
- Sinking Funds - Cash and Securities: $10,224,000
Cash and Securities: $10,097,000
- State Intergovernmental - General Local Government Support: $42,927,000
General Local Government Support: $40,943,000
Highways: $20,572,000
Highways: $20,307,000
Other: $9,269,000
Other: $7,050,000
Health and Hospitals: $1,732,000
Health and Hospitals: $1,251,000
Housing and Community Development: $1,211,000
Housing and Community Development: $940,000
- Tax - Property: $119,193,000
Property: $101,614,000
Other License: $3,347,000
Other Selective Sales: $2,762,000
Other License: $2,367,000
Other Selective Sales: $2,321,000
Other: $307,000
Other: $260,000
- Total Salaries and Wages: $75,236,000
: $73,862,000
Kane County government finances - Debt in 2018:
- Bond Funds - Cash and Securities: $22,838,000
- Charges - Other: $28,043,000
Other: $26,997,000
Natural Resources - Other: $3,399,000
Natural Resources - Other: $3,355,000
Parks and Recreation: $3,317,000
Parks and Recreation: $2,622,000
Solid Waste Management: $157,000
Solid Waste Management: $37,000
- Construction - Regular Highways: $40,731,000
Regular Highways: $11,550,000
Natural Resources - Other: $2,019,000
Natural Resources - Other: $1,733,000
Central Staff Services: $228,000
Central Staff Services: $205,000
Housing and Community Development: $1,000
- Current Operations - General - Other: $40,823,000
General - Other: $37,828,000
Regular Highways: $26,413,000
Judicial and Legal Services: $24,510,000
Judicial and Legal Services: $23,579,000
Correctional Institutions: $21,626,000
Correctional Institutions: $20,303,000
Regular Highways: $18,871,000
Police Protection: $16,701,000
Police Protection: $15,079,000
Central Staff Services: $11,933,000
Central Staff Services: $11,841,000
Natural Resources - Other: $11,454,000
Natural Resources - Other: $9,390,000
Solid Waste Management: $6,445,000
Public Welfare - Other: $6,233,000
Public Welfare - Other: $6,085,000
Health - Other: $5,551,000
Health - Other: $5,460,000
General Public Buildings: $4,721,000
General Public Buildings: $4,492,000
Housing and Community Development: $4,343,000
Housing and Community Development: $4,315,000
Financial Administration: $1,939,000
Financial Administration: $1,731,000
Parks and Recreation: $757,000
Solid Waste Management: $449,000
- Federal Intergovernmental - Public Welfare: $6,338,000
Public Welfare: $6,094,000
Other: $1,601,000
Housing and Community Development: $1,534,000
Other: $1,387,000
Housing and Community Development: $1,311,000
Health and Hospitals: $729,000
Health and Hospitals: $600,000
- General - Interest on Debt: $14,062,000
Interest on Debt: $12,870,000
- Intergovernmental to Local - Other - Natural Resources - Other: $300,000
Other - Natural Resources - Other: $124,000
- Local Intergovernmental - Other: $5,211,000
Other: $3,000
- Long Term Debt - Outstanding Unspecified Public Purpose: $433,979,000
Beginning Outstanding - Unspecified Public Purpose: $404,660,000
Outstanding Unspecified Public Purpose: $399,778,000
Beginning Outstanding - Unspecified Public Purpose: $380,853,000
Retired Unspecified Public Purpose: $143,982,000
Issue, Unspecified Public Purpose: $139,099,000
Issue, Unspecified Public Purpose: $113,072,000
Retired Unspecified Public Purpose: $59,946,000
- Miscellaneous - Interest Earnings: $9,518,000
General Revenue - Other: $5,985,000
General Revenue - Other: $5,073,000
Fines and Forfeits: $4,310,000
Fines and Forfeits: $4,103,000
Interest Earnings: $3,173,000
Sale of Property: $166,000
Sale of Property: $29,000
- Other Capital Outlay - Natural Resources - Other: $14,721,000
Natural Resources - Other: $4,080,000
Central Staff Services: $2,484,000
Police Protection: $2,015,000
Regular Highways: $1,597,000
Police Protection: $1,438,000
Regular Highways: $901,000
Central Staff Services: $813,000
General - Other: $152,000
General - Other: $87,000
Public Welfare - Other: $44,000
Housing and Community Development: $37,000
Public Welfare - Other: $30,000
- Other Funds - Cash and Securities: $372,798,000
Cash and Securities: $341,609,000
- Sinking Funds - Cash and Securities: $10,224,000
Cash and Securities: $10,097,000
- State Intergovernmental - General Local Government Support: $42,927,000
General Local Government Support: $40,943,000
Highways: $20,572,000
Highways: $20,307,000
Other: $9,269,000
Other: $7,050,000
Health and Hospitals: $1,732,000
Health and Hospitals: $1,251,000
Housing and Community Development: $1,211,000
Housing and Community Development: $940,000
- Tax - Property: $119,193,000
Property: $101,614,000
Other License: $3,347,000
Other Selective Sales: $2,762,000
Other License: $2,367,000
Other Selective Sales: $2,321,000
Other: $307,000
Other: $260,000
- Total Salaries and Wages: $75,236,000
: $73,862,000
Kane County government finances - Cash and Securities in 2018:
- Bond Funds - Cash and Securities: $22,838,000
- Charges - Other: $28,043,000
Other: $26,997,000
Natural Resources - Other: $3,399,000
Natural Resources - Other: $3,355,000
Parks and Recreation: $3,317,000
Parks and Recreation: $2,622,000
Solid Waste Management: $157,000
Solid Waste Management: $37,000
- Construction - Regular Highways: $40,731,000
Regular Highways: $11,550,000
Natural Resources - Other: $2,019,000
Natural Resources - Other: $1,733,000
Central Staff Services: $228,000
Central Staff Services: $205,000
Housing and Community Development: $1,000
- Current Operations - General - Other: $40,823,000
General - Other: $37,828,000
Regular Highways: $26,413,000
Judicial and Legal Services: $24,510,000
Judicial and Legal Services: $23,579,000
Correctional Institutions: $21,626,000
Correctional Institutions: $20,303,000
Regular Highways: $18,871,000
Police Protection: $16,701,000
Police Protection: $15,079,000
Central Staff Services: $11,933,000
Central Staff Services: $11,841,000
Natural Resources - Other: $11,454,000
Natural Resources - Other: $9,390,000
Solid Waste Management: $6,445,000
Public Welfare - Other: $6,233,000
Public Welfare - Other: $6,085,000
Health - Other: $5,551,000
Health - Other: $5,460,000
General Public Buildings: $4,721,000
General Public Buildings: $4,492,000
Housing and Community Development: $4,343,000
Housing and Community Development: $4,315,000
Financial Administration: $1,939,000
Financial Administration: $1,731,000
Parks and Recreation: $757,000
Solid Waste Management: $449,000
- Federal Intergovernmental - Public Welfare: $6,338,000
Public Welfare: $6,094,000
Other: $1,601,000
Housing and Community Development: $1,534,000
Other: $1,387,000
Housing and Community Development: $1,311,000
Health and Hospitals: $729,000
Health and Hospitals: $600,000
- General - Interest on Debt: $14,062,000
Interest on Debt: $12,870,000
- Intergovernmental to Local - Other - Natural Resources - Other: $300,000
Other - Natural Resources - Other: $124,000
- Local Intergovernmental - Other: $5,211,000
Other: $3,000
- Long Term Debt - Outstanding Unspecified Public Purpose: $433,979,000
Beginning Outstanding - Unspecified Public Purpose: $404,660,000
Outstanding Unspecified Public Purpose: $399,778,000
Beginning Outstanding - Unspecified Public Purpose: $380,853,000
Retired Unspecified Public Purpose: $143,982,000
Issue, Unspecified Public Purpose: $139,099,000
Issue, Unspecified Public Purpose: $113,072,000
Retired Unspecified Public Purpose: $59,946,000
- Miscellaneous - Interest Earnings: $9,518,000
General Revenue - Other: $5,985,000
General Revenue - Other: $5,073,000
Fines and Forfeits: $4,310,000
Fines and Forfeits: $4,103,000
Interest Earnings: $3,173,000
Sale of Property: $166,000
Sale of Property: $29,000
- Other Capital Outlay - Natural Resources - Other: $14,721,000
Natural Resources - Other: $4,080,000
Central Staff Services: $2,484,000
Police Protection: $2,015,000
Regular Highways: $1,597,000
Police Protection: $1,438,000
Regular Highways: $901,000
Central Staff Services: $813,000
General - Other: $152,000
General - Other: $87,000
Public Welfare - Other: $44,000
Housing and Community Development: $37,000
Public Welfare - Other: $30,000
- Other Funds - Cash and Securities: $372,798,000
Cash and Securities: $341,609,000
- Sinking Funds - Cash and Securities: $10,224,000
Cash and Securities: $10,097,000
- State Intergovernmental - General Local Government Support: $42,927,000
General Local Government Support: $40,943,000
Highways: $20,572,000
Highways: $20,307,000
Other: $9,269,000
Other: $7,050,000
Health and Hospitals: $1,732,000
Health and Hospitals: $1,251,000
Housing and Community Development: $1,211,000
Housing and Community Development: $940,000
- Tax - Property: $119,193,000
Property: $101,614,000
Other License: $3,347,000
Other Selective Sales: $2,762,000
Other License: $2,367,000
Other Selective Sales: $2,321,000
Other: $307,000
Other: $260,000
- Total Salaries and Wages: $75,236,000
: $73,862,000
Supplemental Security Income (SSI) in 2006:
- Total number of recipients: 3,852
- Number of aged recipients: 578
- Number of blind and disabled recipients: 3,274
- Number of recipients under 18: 894
- Number of recipients between 18 and 64: 2,126
- Number of recipients older than 64: 832
- Number of recipients also receiving OASDI: 1,009
- Amount of payments (thousands of dollars): 1,793
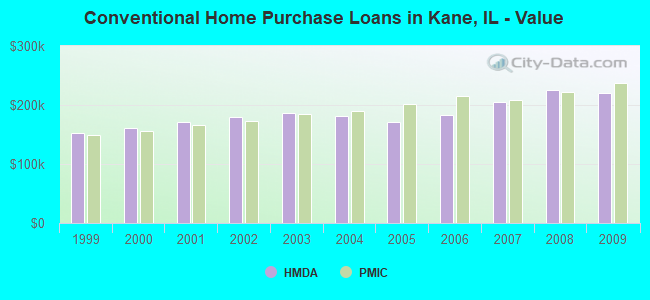
| Home Mortgage Disclosure Act Aggregated Statistics For Year 2009 (Based on 66 full tracts) | ||||||||||||||
| A) FHA, FSA/RHS & VA Home Purchase Loans | B) Conventional Home Purchase Loans | C) Refinancings | D) Home Improvement Loans | E) Loans on Dwellings For 5+ Families | F) Non-occupant Loans on < 5 Family Dwellings (A B C & D) | G) Loans On Manufactured Home Dwelling (A B C & D) | ||||||||
|---|---|---|---|---|---|---|---|---|---|---|---|---|---|---|
| Number | Average Value | Number | Average Value | Number | Average Value | Number | Average Value | Number | Average Value | Number | Average Value | Number | Average Value | |
| LOANS ORIGINATED | 1,993 | $187,562 | 1,923 | $219,999 | 15,665 | $217,699 | 271 | $101,598 | 27 | $1,640,407 | 522 | $144,966 | 26 | $264,654 |
| APPLICATIONS APPROVED, NOT ACCEPTED | 131 | $172,229 | 207 | $227,913 | 1,319 | $221,908 | 43 | $72,372 | 0 | $0 | 54 | $138,056 | 5 | $259,200 |
| APPLICATIONS DENIED | 359 | $176,418 | 336 | $197,818 | 4,288 | $229,196 | 250 | $60,520 | 10 | $705,500 | 221 | $136,937 | 13 | $86,000 |
| APPLICATIONS WITHDRAWN | 272 | $178,401 | 194 | $238,438 | 2,259 | $225,157 | 56 | $107,286 | 6 | $1,113,667 | 85 | $154,212 | 1 | $193,000 |
| FILES CLOSED FOR INCOMPLETENESS | 67 | $180,940 | 54 | $171,815 | 765 | $224,162 | 19 | $68,789 | 2 | $6,185,500 | 21 | $134,429 | 1 | $85,000 |
| Private Mortgage Insurance Companies Aggregated Statistics For Year 2009 (Based on 64 full tracts) | ||||||
| A) Conventional Home Purchase Loans | B) Refinancings | C) Non-occupant Loans on < 5 Family Dwellings (A & B) | ||||
|---|---|---|---|---|---|---|
| Number | Average Value | Number | Average Value | Number | Average Value | |
| LOANS ORIGINATED | 292 | $238,082 | 315 | $238,324 | 1 | $250,000 |
| APPLICATIONS APPROVED, NOT ACCEPTED | 156 | $240,974 | 156 | $247,590 | 4 | $142,250 |
| APPLICATIONS DENIED | 66 | $216,515 | 134 | $230,082 | 2 | $143,000 |
| APPLICATIONS WITHDRAWN | 34 | $274,588 | 61 | $274,770 | 1 | $288,000 |
| FILES CLOSED FOR INCOMPLETENESS | 16 | $204,375 | 22 | $199,682 | 1 | $130,000 |
| Most common first names in Kane County, IL among deceased individuals | ||
| Name | Count | Lived (average) |
|---|---|---|
| John | 2,106 | 74.5 years |
| Mary | 1,658 | 79.1 years |
| William | 1,619 | 74.6 years |
| Robert | 1,432 | 71.2 years |
| George | 1,075 | 76.1 years |
| James | 1,051 | 70.2 years |
| Helen | 1,025 | 81.3 years |
| Charles | 893 | 75.2 years |
| Margaret | 876 | 80.6 years |
| Dorothy | 821 | 78.2 years |
| Most common last names in Kane County, IL among deceased individuals | ||
| Last name | Count | Lived (average) |
|---|---|---|
| Johnson | 896 | 78.1 years |
| Anderson | 638 | 79.0 years |
| Smith | 590 | 73.9 years |
| Miller | 439 | 77.2 years |
| Nelson | 333 | 78.2 years |
| Carlson | 273 | 77.8 years |
| Brown | 259 | 76.2 years |
| Peterson | 246 | 79.3 years |
| Jones | 239 | 75.1 years |
| Williams | 213 | 72.5 years |
| Businesses in Kane County, IL | ||||
| Name | Count | Name | Count | |
|---|---|---|---|---|
| 7-Eleven | 24 | Johnny Rockets | 1 | |
| ALDI | 10 | Jones New York | 12 | |
| ALDO | 2 | Journeys | 3 | |
| AT&T | 9 | Just Tires | 3 | |
| Abercrombie & Fitch | 2 | Justice | 4 | |
| Abercrombie Kids | 1 | KFC | 6 | |
| Ace Hardware | 11 | Kmart | 1 | |
| Advance Auto Parts | 10 | Kohl's | 6 | |
| Aeropostale | 4 | Kroger | 1 | |
| Aerosoles | 1 | LA Fitness | 4 | |
| AmericInn | 1 | La-Z-Boy | 3 | |
| American Eagle Outfitters | 5 | Lane Bryant | 6 | |
| Ann Taylor | 3 | Lane Furniture | 4 | |
| Applebee's | 3 | LensCrafters | 4 | |
| Arby's | 6 | Levi Strauss & Co. | 1 | |
| Ashley Furniture | 1 | Little Caesars Pizza | 7 | |
| AutoZone | 10 | Long John Silver's | 2 | |
| Avenue | 1 | Lowe's | 5 | |
| Bakers | 1 | Macy's | 2 | |
| Bally Total Fitness | 1 | Marriott | 9 | |
| Banana Republic | 3 | Marshalls | 1 | |
| Barnes & Noble | 2 | MasterBrand Cabinets | 42 | |
| Baskin-Robbins | 14 | Maurices | 2 | |
| Bath & Body Works | 5 | McDonald's | 31 | |
| Baymont Inn | 1 | Meijer | 4 | |
| Bed Bath & Beyond | 2 | Men's Wearhouse | 6 | |
| Ben & Jerry's | 1 | Menards | 4 | |
| Best Western | 2 | Motel 6 | 1 | |
| Blockbuster | 9 | Motherhood Maternity | 5 | |
| Brooks Brothers | 1 | New Balance | 9 | |
| Budget Car Rental | 3 | New York & Co | 3 | |
| Buffalo Wild Wings | 6 | Nike | 41 | |
| Burger King | 15 | Nissan | 2 | |
| Buybuy BABY | 1 | Office Depot | 3 | |
| CVS | 7 | OfficeMax | 6 | |
| Cache | 1 | Old Country Buffet | 1 | |
| Caribou Coffee | 10 | Old Navy | 2 | |
| Carson Pirie Scott | 4 | Olive Garden | 3 | |
| Casual Male XL | 1 | On The Border | 1 | |
| Catherines | 1 | Outback | 1 | |
| Charlotte Russe | 2 | Outback Steakhouse | 1 | |
| Chevrolet | 2 | Pac Sun | 3 | |
| Chick-Fil-A | 1 | Panda Express | 8 | |
| Chico's | 2 | Panera Bread | 12 | |
| Chipotle | 6 | Papa John's Pizza | 4 | |
| Chuck E. Cheese's | 2 | Payless | 6 | |
| Cinnabon | 1 | Penske | 4 | |
| Circle K | 7 | PetSmart | 6 | |
| Clarks | 1 | Pier 1 Imports | 3 | |
| Cold Stone Creamery | 1 | Pizza Hut | 7 | |
| Coldwater Creek | 1 | Plato's Closet | 1 | |
| ColorTyme | 1 | Popeyes | 6 | |
| Comfort Inn | 1 | Pottery Barn | 1 | |
| Comfort Suites | 2 | Qdoba Mexican Grill | 2 | |
| Costco | 2 | Quality | 2 | |
| Cracker Barrel | 1 | Quiznos | 4 | |
| Crate & Barrel | 1 | RadioShack | 10 | |
| Cricket Wireless | 17 | Red Lobster | 3 | |
| Curves | 11 | Red Robin | 3 | |
| DHL | 4 | Red Roof Inn | 1 | |
| Dairy Queen | 17 | Ruby Tuesday | 1 | |
| Days Inn | 1 | Rue21 | 3 | |
| Deb | 2 | Ryder Rental & Truck Leasing | 1 | |
| Decora Cabinetry | 4 | SAS Shoes | 1 | |
| Dennys | 3 | SONIC Drive-In | 1 | |
| Discount Tire | 7 | Safeway | 6 | |
| Domino's Pizza | 5 | Sam's Club | 1 | |
| DressBarn | 4 | Sears | 13 | |
| Dressbarn | 4 | Sephora | 1 | |
| Dunkin Donuts | 25 | Shoe Carnival | 1 | |
| Eddie Bauer | 2 | Skechers USA | 1 | |
| Ethan Allen | 1 | Sleep Inn | 1 | |
| Express | 3 | Soma Intimates | 1 | |
| Extended Stay America | 1 | Spencer Gifts | 2 | |
| Famous Footwear | 8 | Sprint Nextel | 14 | |
| Fashion Bug | 2 | Staples | 3 | |
| FedEx | 93 | Starbucks | 29 | |
| Finish Line | 3 | Steak 'n Shake | 4 | |
| Firestone Complete Auto Care | 12 | Subaru | 2 | |
| Foot Locker | 2 | Subway | 32 | |
| Ford | 2 | Super 8 | 5 | |
| Forever 21 | 2 | T-Mobile | 29 | |
| GNC | 10 | T.G.I. Driday's | 4 | |
| GameStop | 10 | T.J.Maxx | 2 | |
| Gap | 5 | Taco Bell | 11 | |
| Goodwill | 1 | Talbots | 1 | |
| Gymboree | 5 | Target | 9 | |
| H&M | 2 | The Athlete's Foot | 1 | |
| H&R Block | 21 | The Limited | 2 | |
| Hilton | 4 | The Room Place | 4 | |
| Hobby Lobby | 4 | Torrid | 1 | |
| Holiday Inn | 8 | Toyota | 1 | |
| Hollister Co. | 2 | Toys"R"Us | 4 | |
| Home Depot | 6 | Trader Joe's | 1 | |
| Homestead Studio Suites | 1 | U-Haul | 20 | |
| Honda | 3 | U.S. Cellular | 5 | |
| Hot Topic | 2 | UPS | 105 | |
| Houlihan's | 2 | Value City Furniture | 1 | |
| Hyundai | 2 | Vans | 8 | |
| IHOP | 5 | Verizon Wireless | 12 | |
| IZOD | 1 | Victoria's Secret | 4 | |
| J. Jill | 1 | Vons | 6 | |
| J.Crew | 1 | Walgreens | 11 | |
| JCPenney | 3 | Walmart | 8 | |
| Jamba Juice | 3 | Wendy's | 14 | |
| Jewel-Osco | 14 | White Castle | 4 | |
| Jimmy John's | 1 | World Gym | 1 | |
| JoS. A. Bank | 1 | YMCA | 10 | |
Kane County on our top lists:
- #8 on the list of "Top 101 counties with the largest decrease in the number of births per 1000 residents 2000-2006 to 2007-2013 (pop 50,000+)"
- #58 on the list of "Top 101 counties with the lowest number of deaths per 1000 residents 2007-2013 (pop. 50,000+)"
- #65 on the list of "Top 101 counties with the largest increase in the number of infant deaths per 1000 residents 2000-2006 to 2007-2013 (pop. 50,000+)"
- #75 on the list of "Top 101 counties with the highest ground withdrawal of fresh water for public supply (pop. 50,000+)"
- #76 on the list of "Top 101 counties with the highest ground withdrawal of fresh water for public supply"
- #84 on the list of "Top 101 counties with the largest number of children under 18 without health insurance coverage in 2000 (pop. 50,000+)"
- #84 on the list of "Top 101 counties with the most Catholic adherents"
- #84 on the list of "Top 101 counties with the most Catholic adherents (pop. 50,000+)"