Geneva, Illinois Submit your own pictures of this city and show them to the world
OSM Map
General Map
Google Map
MSN Map
OSM Map
General Map
Google Map
MSN Map
OSM Map
General Map
Google Map
MSN Map
OSM Map
General Map
Google Map
MSN Map
Please wait while loading the map...
Population in 2022: 21,228 (100% urban, 0% rural). Population change since 2000: +8.8%Males: 9,955 Females: 11,273
March 2022 cost of living index in Geneva: 101.5 (near average, U.S. average is 100) Percentage of residents living in poverty in 2022: 2.6%for White Non-Hispanic residents , 0.9% for Hispanic or Latino residents , 3.3% for other race residents )
Profiles of local businesses
Business Search - 14 Million verified businesses
Data:
Median household income ($)
Median household income (% change since 2000)
Household income diversity
Ratio of average income to average house value (%)
Ratio of average income to average rent
Median household income ($) - White
Median household income ($) - Black or African American
Median household income ($) - Asian
Median household income ($) - Hispanic or Latino
Median household income ($) - American Indian and Alaska Native
Median household income ($) - Multirace
Median household income ($) - Other Race
Median household income for houses/condos with a mortgage ($)
Median household income for apartments without a mortgage ($)
Races - White alone (%)
Races - White alone (% change since 2000)
Races - Black alone (%)
Races - Black alone (% change since 2000)
Races - American Indian alone (%)
Races - American Indian alone (% change since 2000)
Races - Asian alone (%)
Races - Asian alone (% change since 2000)
Races - Hispanic (%)
Races - Hispanic (% change since 2000)
Races - Native Hawaiian and Other Pacific Islander alone (%)
Races - Native Hawaiian and Other Pacific Islander alone (% change since 2000)
Races - Two or more races (%)
Races - Two or more races (% change since 2000)
Races - Other race alone (%)
Races - Other race alone (% change since 2000)
Racial diversity
Unemployment (%)
Unemployment (% change since 2000)
Unemployment (%) - White
Unemployment (%) - Black or African American
Unemployment (%) - Asian
Unemployment (%) - Hispanic or Latino
Unemployment (%) - American Indian and Alaska Native
Unemployment (%) - Multirace
Unemployment (%) - Other Race
Population density (people per square mile)
Population - Males (%)
Population - Females (%)
Population - Males (%) - White
Population - Males (%) - Black or African American
Population - Males (%) - Asian
Population - Males (%) - Hispanic or Latino
Population - Males (%) - American Indian and Alaska Native
Population - Males (%) - Multirace
Population - Males (%) - Other Race
Population - Females (%) - White
Population - Females (%) - Black or African American
Population - Females (%) - Asian
Population - Females (%) - Hispanic or Latino
Population - Females (%) - American Indian and Alaska Native
Population - Females (%) - Multirace
Population - Females (%) - Other Race
Coronavirus confirmed cases (Apr 27, 2024)
Deaths caused by coronavirus (Apr 27, 2024)
Coronavirus confirmed cases (per 100k population) (Apr 27, 2024)
Deaths caused by coronavirus (per 100k population) (Apr 27, 2024)
Daily increase in number of cases (Apr 27, 2024)
Weekly increase in number of cases (Apr 27, 2024)
Cases doubled (in days) (Apr 27, 2024)
Hospitalized patients (Apr 18, 2022)
Negative test results (Apr 18, 2022)
Total test results (Apr 18, 2022)
COVID Vaccine doses distributed (per 100k population) (Sep 19, 2023)
COVID Vaccine doses administered (per 100k population) (Sep 19, 2023)
COVID Vaccine doses distributed (Sep 19, 2023)
COVID Vaccine doses administered (Sep 19, 2023)
Likely homosexual households (%)
Likely homosexual households (% change since 2000)
Likely homosexual households - Lesbian couples (%)
Likely homosexual households - Lesbian couples (% change since 2000)
Likely homosexual households - Gay men (%)
Likely homosexual households - Gay men (% change since 2000)
Cost of living index
Median gross rent ($)
Median contract rent ($)
Median monthly housing costs ($)
Median house or condo value ($)
Median house or condo value ($ change since 2000)
Mean house or condo value by units in structure - 1, detached ($)
Mean house or condo value by units in structure - 1, attached ($)
Mean house or condo value by units in structure - 2 ($)
Mean house or condo value by units in structure by units in structure - 3 or 4 ($)
Mean house or condo value by units in structure - 5 or more ($)
Mean house or condo value by units in structure - Boat, RV, van, etc. ($)
Mean house or condo value by units in structure - Mobile home ($)
Median house or condo value ($) - White
Median house or condo value ($) - Black or African American
Median house or condo value ($) - Asian
Median house or condo value ($) - Hispanic or Latino
Median house or condo value ($) - American Indian and Alaska Native
Median house or condo value ($) - Multirace
Median house or condo value ($) - Other Race
Median resident age
Resident age diversity
Median resident age - Males
Median resident age - Females
Median resident age - White
Median resident age - Black or African American
Median resident age - Asian
Median resident age - Hispanic or Latino
Median resident age - American Indian and Alaska Native
Median resident age - Multirace
Median resident age - Other Race
Median resident age - Males - White
Median resident age - Males - Black or African American
Median resident age - Males - Asian
Median resident age - Males - Hispanic or Latino
Median resident age - Males - American Indian and Alaska Native
Median resident age - Males - Multirace
Median resident age - Males - Other Race
Median resident age - Females - White
Median resident age - Females - Black or African American
Median resident age - Females - Asian
Median resident age - Females - Hispanic or Latino
Median resident age - Females - American Indian and Alaska Native
Median resident age - Females - Multirace
Median resident age - Females - Other Race
Commute - mean travel time to work (minutes)
Travel time to work - Less than 5 minutes (%)
Travel time to work - Less than 5 minutes (% change since 2000)
Travel time to work - 5 to 9 minutes (%)
Travel time to work - 5 to 9 minutes (% change since 2000)
Travel time to work - 10 to 19 minutes (%)
Travel time to work - 10 to 19 minutes (% change since 2000)
Travel time to work - 20 to 29 minutes (%)
Travel time to work - 20 to 29 minutes (% change since 2000)
Travel time to work - 30 to 39 minutes (%)
Travel time to work - 30 to 39 minutes (% change since 2000)
Travel time to work - 40 to 59 minutes (%)
Travel time to work - 40 to 59 minutes (% change since 2000)
Travel time to work - 60 to 89 minutes (%)
Travel time to work - 60 to 89 minutes (% change since 2000)
Travel time to work - 90 or more minutes (%)
Travel time to work - 90 or more minutes (% change since 2000)
Marital status - Never married (%)
Marital status - Now married (%)
Marital status - Separated (%)
Marital status - Widowed (%)
Marital status - Divorced (%)
Median family income ($)
Median family income (% change since 2000)
Median non-family income ($)
Median non-family income (% change since 2000)
Median per capita income ($)
Median per capita income (% change since 2000)
Median family income ($) - White
Median family income ($) - Black or African American
Median family income ($) - Asian
Median family income ($) - Hispanic or Latino
Median family income ($) - American Indian and Alaska Native
Median family income ($) - Multirace
Median family income ($) - Other Race
Median year house/condo built
Median year apartment built
Year house built - Built 2005 or later (%)
Year house built - Built 2000 to 2004 (%)
Year house built - Built 1990 to 1999 (%)
Year house built - Built 1980 to 1989 (%)
Year house built - Built 1970 to 1979 (%)
Year house built - Built 1960 to 1969 (%)
Year house built - Built 1950 to 1959 (%)
Year house built - Built 1940 to 1949 (%)
Year house built - Built 1939 or earlier (%)
Average household size
Household density (households per square mile)
Average household size - White
Average household size - Black or African American
Average household size - Asian
Average household size - Hispanic or Latino
Average household size - American Indian and Alaska Native
Average household size - Multirace
Average household size - Other Race
Occupied housing units (%)
Vacant housing units (%)
Owner occupied housing units (%)
Renter occupied housing units (%)
Vacancy status - For rent (%)
Vacancy status - For sale only (%)
Vacancy status - Rented or sold, not occupied (%)
Vacancy status - For seasonal, recreational, or occasional use (%)
Vacancy status - For migrant workers (%)
Vacancy status - Other vacant (%)
Residents with income below the poverty level (%)
Residents with income below 50% of the poverty level (%)
Children below poverty level (%)
Poor families by family type - Married-couple family (%)
Poor families by family type - Male, no wife present (%)
Poor families by family type - Female, no husband present (%)
Poverty status for native-born residents (%)
Poverty status for foreign-born residents (%)
Poverty among high school graduates not in families (%)
Poverty among people who did not graduate high school not in families (%)
Residents with income below the poverty level (%) - White
Residents with income below the poverty level (%) - Black or African American
Residents with income below the poverty level (%) - Asian
Residents with income below the poverty level (%) - Hispanic or Latino
Residents with income below the poverty level (%) - American Indian and Alaska Native
Residents with income below the poverty level (%) - Multirace
Residents with income below the poverty level (%) - Other Race
Air pollution - Air Quality Index (AQI)
Air pollution - CO
Air pollution - NO2
Air pollution - SO2
Air pollution - Ozone
Air pollution - PM10
Air pollution - PM25
Air pollution - Pb
Crime - Murders per 100,000 population
Crime - Rapes per 100,000 population
Crime - Robberies per 100,000 population
Crime - Assaults per 100,000 population
Crime - Burglaries per 100,000 population
Crime - Thefts per 100,000 population
Crime - Auto thefts per 100,000 population
Crime - Arson per 100,000 population
Crime - City-data.com crime index
Crime - Violent crime index
Crime - Property crime index
Crime - Murders per 100,000 population (5 year average)
Crime - Rapes per 100,000 population (5 year average)
Crime - Robberies per 100,000 population (5 year average)
Crime - Assaults per 100,000 population (5 year average)
Crime - Burglaries per 100,000 population (5 year average)
Crime - Thefts per 100,000 population (5 year average)
Crime - Auto thefts per 100,000 population (5 year average)
Crime - Arson per 100,000 population (5 year average)
Crime - City-data.com crime index (5 year average)
Crime - Violent crime index (5 year average)
Crime - Property crime index (5 year average)
1996 Presidential Elections Results (%) - Democratic Party (Clinton)
1996 Presidential Elections Results (%) - Republican Party (Dole)
1996 Presidential Elections Results (%) - Other
2000 Presidential Elections Results (%) - Democratic Party (Gore)
2000 Presidential Elections Results (%) - Republican Party (Bush)
2000 Presidential Elections Results (%) - Other
2004 Presidential Elections Results (%) - Democratic Party (Kerry)
2004 Presidential Elections Results (%) - Republican Party (Bush)
2004 Presidential Elections Results (%) - Other
2008 Presidential Elections Results (%) - Democratic Party (Obama)
2008 Presidential Elections Results (%) - Republican Party (McCain)
2008 Presidential Elections Results (%) - Other
2012 Presidential Elections Results (%) - Democratic Party (Obama)
2012 Presidential Elections Results (%) - Republican Party (Romney)
2012 Presidential Elections Results (%) - Other
2016 Presidential Elections Results (%) - Democratic Party (Clinton)
2016 Presidential Elections Results (%) - Republican Party (Trump)
2016 Presidential Elections Results (%) - Other
2020 Presidential Elections Results (%) - Democratic Party (Biden)
2020 Presidential Elections Results (%) - Republican Party (Trump)
2020 Presidential Elections Results (%) - Other
Ancestries Reported - Arab (%)
Ancestries Reported - Czech (%)
Ancestries Reported - Danish (%)
Ancestries Reported - Dutch (%)
Ancestries Reported - English (%)
Ancestries Reported - French (%)
Ancestries Reported - French Canadian (%)
Ancestries Reported - German (%)
Ancestries Reported - Greek (%)
Ancestries Reported - Hungarian (%)
Ancestries Reported - Irish (%)
Ancestries Reported - Italian (%)
Ancestries Reported - Lithuanian (%)
Ancestries Reported - Norwegian (%)
Ancestries Reported - Polish (%)
Ancestries Reported - Portuguese (%)
Ancestries Reported - Russian (%)
Ancestries Reported - Scotch-Irish (%)
Ancestries Reported - Scottish (%)
Ancestries Reported - Slovak (%)
Ancestries Reported - Subsaharan African (%)
Ancestries Reported - Swedish (%)
Ancestries Reported - Swiss (%)
Ancestries Reported - Ukrainian (%)
Ancestries Reported - United States (%)
Ancestries Reported - Welsh (%)
Ancestries Reported - West Indian (%)
Ancestries Reported - Other (%)
Educational Attainment - No schooling completed (%)
Educational Attainment - Less than high school (%)
Educational Attainment - High school or equivalent (%)
Educational Attainment - Less than 1 year of college (%)
Educational Attainment - 1 or more years of college (%)
Educational Attainment - Associate degree (%)
Educational Attainment - Bachelor's degree (%)
Educational Attainment - Master's degree (%)
Educational Attainment - Professional school degree (%)
Educational Attainment - Doctorate degree (%)
School Enrollment - Nursery, preschool (%)
School Enrollment - Kindergarten (%)
School Enrollment - Grade 1 to 4 (%)
School Enrollment - Grade 5 to 8 (%)
School Enrollment - Grade 9 to 12 (%)
School Enrollment - College undergrad (%)
School Enrollment - Graduate or professional (%)
School Enrollment - Not enrolled in school (%)
School enrollment - Public schools (%)
School enrollment - Private schools (%)
School enrollment - Not enrolled (%)
Median number of rooms in houses and condos
Median number of rooms in apartments
Housing units lacking complete plumbing facilities (%)
Housing units lacking complete kitchen facilities (%)
Density of houses
Urban houses (%)
Rural houses (%)
Households with people 60 years and over (%)
Households with people 65 years and over (%)
Households with people 75 years and over (%)
Households with one or more nonrelatives (%)
Households with no nonrelatives (%)
Population in households (%)
Family households (%)
Nonfamily households (%)
Population in families (%)
Family households with own children (%)
Median number of bedrooms in owner occupied houses
Mean number of bedrooms in owner occupied houses
Median number of bedrooms in renter occupied houses
Mean number of bedrooms in renter occupied houses
Median number of vehichles in owner occupied houses
Mean number of vehichles in owner occupied houses
Median number of vehichles in renter occupied houses
Mean number of vehichles in renter occupied houses
Mortgage status - with mortgage (%)
Mortgage status - with second mortgage (%)
Mortgage status - with home equity loan (%)
Mortgage status - with both second mortgage and home equity loan (%)
Mortgage status - without a mortgage (%)
Average family size
Average family size - White
Average family size - Black or African American
Average family size - Asian
Average family size - Hispanic or Latino
Average family size - American Indian and Alaska Native
Average family size - Multirace
Average family size - Other Race
Geographical mobility - Same house 1 year ago (%)
Geographical mobility - Moved within same county (%)
Geographical mobility - Moved from different county within same state (%)
Geographical mobility - Moved from different state (%)
Geographical mobility - Moved from abroad (%)
Place of birth - Born in state of residence (%)
Place of birth - Born in other state (%)
Place of birth - Native, outside of US (%)
Place of birth - Foreign born (%)
Housing units in structures - 1, detached (%)
Housing units in structures - 1, attached (%)
Housing units in structures - 2 (%)
Housing units in structures - 3 or 4 (%)
Housing units in structures - 5 to 9 (%)
Housing units in structures - 10 to 19 (%)
Housing units in structures - 20 to 49 (%)
Housing units in structures - 50 or more (%)
Housing units in structures - Mobile home (%)
Housing units in structures - Boat, RV, van, etc. (%)
House/condo owner moved in on average (years ago)
Renter moved in on average (years ago)
Year householder moved into unit - Moved in 1999 to March 2000 (%)
Year householder moved into unit - Moved in 1995 to 1998 (%)
Year householder moved into unit - Moved in 1990 to 1994 (%)
Year householder moved into unit - Moved in 1980 to 1989 (%)
Year householder moved into unit - Moved in 1970 to 1979 (%)
Year householder moved into unit - Moved in 1969 or earlier (%)
Means of transportation to work - Drove car alone (%)
Means of transportation to work - Carpooled (%)
Means of transportation to work - Public transportation (%)
Means of transportation to work - Bus or trolley bus (%)
Means of transportation to work - Streetcar or trolley car (%)
Means of transportation to work - Subway or elevated (%)
Means of transportation to work - Railroad (%)
Means of transportation to work - Ferryboat (%)
Means of transportation to work - Taxicab (%)
Means of transportation to work - Motorcycle (%)
Means of transportation to work - Bicycle (%)
Means of transportation to work - Walked (%)
Means of transportation to work - Other means (%)
Working at home (%)
Industry diversity
Most Common Industries - Agriculture, forestry, fishing and hunting, and mining (%)
Most Common Industries - Agriculture, forestry, fishing and hunting (%)
Most Common Industries - Mining, quarrying, and oil and gas extraction (%)
Most Common Industries - Construction (%)
Most Common Industries - Manufacturing (%)
Most Common Industries - Wholesale trade (%)
Most Common Industries - Retail trade (%)
Most Common Industries - Transportation and warehousing, and utilities (%)
Most Common Industries - Transportation and warehousing (%)
Most Common Industries - Utilities (%)
Most Common Industries - Information (%)
Most Common Industries - Finance and insurance, and real estate and rental and leasing (%)
Most Common Industries - Finance and insurance (%)
Most Common Industries - Real estate and rental and leasing (%)
Most Common Industries - Professional, scientific, and management, and administrative and waste management services (%)
Most Common Industries - Professional, scientific, and technical services (%)
Most Common Industries - Management of companies and enterprises (%)
Most Common Industries - Administrative and support and waste management services (%)
Most Common Industries - Educational services, and health care and social assistance (%)
Most Common Industries - Educational services (%)
Most Common Industries - Health care and social assistance (%)
Most Common Industries - Arts, entertainment, and recreation, and accommodation and food services (%)
Most Common Industries - Arts, entertainment, and recreation (%)
Most Common Industries - Accommodation and food services (%)
Most Common Industries - Other services, except public administration (%)
Most Common Industries - Public administration (%)
Occupation diversity
Most Common Occupations - Management, business, science, and arts occupations (%)
Most Common Occupations - Management, business, and financial occupations (%)
Most Common Occupations - Management occupations (%)
Most Common Occupations - Business and financial operations occupations (%)
Most Common Occupations - Computer, engineering, and science occupations (%)
Most Common Occupations - Computer and mathematical occupations (%)
Most Common Occupations - Architecture and engineering occupations (%)
Most Common Occupations - Life, physical, and social science occupations (%)
Most Common Occupations - Education, legal, community service, arts, and media occupations (%)
Most Common Occupations - Community and social service occupations (%)
Most Common Occupations - Legal occupations (%)
Most Common Occupations - Education, training, and library occupations (%)
Most Common Occupations - Arts, design, entertainment, sports, and media occupations (%)
Most Common Occupations - Healthcare practitioners and technical occupations (%)
Most Common Occupations - Health diagnosing and treating practitioners and other technical occupations (%)
Most Common Occupations - Health technologists and technicians (%)
Most Common Occupations - Service occupations (%)
Most Common Occupations - Healthcare support occupations (%)
Most Common Occupations - Protective service occupations (%)
Most Common Occupations - Fire fighting and prevention, and other protective service workers including supervisors (%)
Most Common Occupations - Law enforcement workers including supervisors (%)
Most Common Occupations - Food preparation and serving related occupations (%)
Most Common Occupations - Building and grounds cleaning and maintenance occupations (%)
Most Common Occupations - Personal care and service occupations (%)
Most Common Occupations - Sales and office occupations (%)
Most Common Occupations - Sales and related occupations (%)
Most Common Occupations - Office and administrative support occupations (%)
Most Common Occupations - Natural resources, construction, and maintenance occupations (%)
Most Common Occupations - Farming, fishing, and forestry occupations (%)
Most Common Occupations - Construction and extraction occupations (%)
Most Common Occupations - Installation, maintenance, and repair occupations (%)
Most Common Occupations - Production, transportation, and material moving occupations (%)
Most Common Occupations - Production occupations (%)
Most Common Occupations - Transportation occupations (%)
Most Common Occupations - Material moving occupations (%)
People in Group quarters - Institutionalized population (%)
People in Group quarters - Correctional institutions (%)
People in Group quarters - Federal prisons and detention centers (%)
People in Group quarters - Halfway houses (%)
People in Group quarters - Local jails and other confinement facilities (including police lockups) (%)
People in Group quarters - Military disciplinary barracks (%)
People in Group quarters - State prisons (%)
People in Group quarters - Other types of correctional institutions (%)
People in Group quarters - Nursing homes (%)
People in Group quarters - Hospitals/wards, hospices, and schools for the handicapped (%)
People in Group quarters - Hospitals/wards and hospices for chronically ill (%)
People in Group quarters - Hospices or homes for chronically ill (%)
People in Group quarters - Military hospitals or wards for chronically ill (%)
People in Group quarters - Other hospitals or wards for chronically ill (%)
People in Group quarters - Hospitals or wards for drug/alcohol abuse (%)
People in Group quarters - Mental (Psychiatric) hospitals or wards (%)
People in Group quarters - Schools, hospitals, or wards for the mentally retarded (%)
People in Group quarters - Schools, hospitals, or wards for the physically handicapped (%)
People in Group quarters - Institutions for the deaf (%)
People in Group quarters - Institutions for the blind (%)
People in Group quarters - Orthopedic wards and institutions for the physically handicapped (%)
People in Group quarters - Wards in general hospitals for patients who have no usual home elsewhere (%)
People in Group quarters - Wards in military hospitals for patients who have no usual home elsewhere (%)
People in Group quarters - Juvenile institutions (%)
People in Group quarters - Long-term care (%)
People in Group quarters - Homes for abused, dependent, and neglected children (%)
People in Group quarters - Residential treatment centers for emotionally disturbed children (%)
People in Group quarters - Training schools for juvenile delinquents (%)
People in Group quarters - Short-term care, detention or diagnostic centers for delinquent children (%)
People in Group quarters - Type of juvenile institution unknown (%)
People in Group quarters - Noninstitutionalized population (%)
People in Group quarters - College dormitories (includes college quarters off campus) (%)
People in Group quarters - Military quarters (%)
People in Group quarters - On base (%)
People in Group quarters - Barracks, unaccompanied personnel housing (UPH), (Enlisted/Officer), ;and similar group living quarters for military personnel (%)
People in Group quarters - Transient quarters for temporary residents (%)
People in Group quarters - Military ships (%)
People in Group quarters - Group homes (%)
People in Group quarters - Homes or halfway houses for drug/alcohol abuse (%)
People in Group quarters - Homes for the mentally ill (%)
People in Group quarters - Homes for the mentally retarded (%)
People in Group quarters - Homes for the physically handicapped (%)
People in Group quarters - Other group homes (%)
People in Group quarters - Religious group quarters (%)
People in Group quarters - Dormitories (%)
People in Group quarters - Agriculture workers' dormitories on farms (%)
People in Group quarters - Job Corps and vocational training facilities (%)
People in Group quarters - Other workers' dormitories (%)
People in Group quarters - Crews of maritime vessels (%)
People in Group quarters - Other nonhousehold living situations (%)
People in Group quarters - Other noninstitutional group quarters (%)
Residents speaking English at home (%)
Residents speaking English at home - Born in the United States (%)
Residents speaking English at home - Native, born elsewhere (%)
Residents speaking English at home - Foreign born (%)
Residents speaking Spanish at home (%)
Residents speaking Spanish at home - Born in the United States (%)
Residents speaking Spanish at home - Native, born elsewhere (%)
Residents speaking Spanish at home - Foreign born (%)
Residents speaking other language at home (%)
Residents speaking other language at home - Born in the United States (%)
Residents speaking other language at home - Native, born elsewhere (%)
Residents speaking other language at home - Foreign born (%)
Class of Workers - Employee of private company (%)
Class of Workers - Self-employed in own incorporated business (%)
Class of Workers - Private not-for-profit wage and salary workers (%)
Class of Workers - Local government workers (%)
Class of Workers - State government workers (%)
Class of Workers - Federal government workers (%)
Class of Workers - Self-employed workers in own not incorporated business and Unpaid family workers (%)
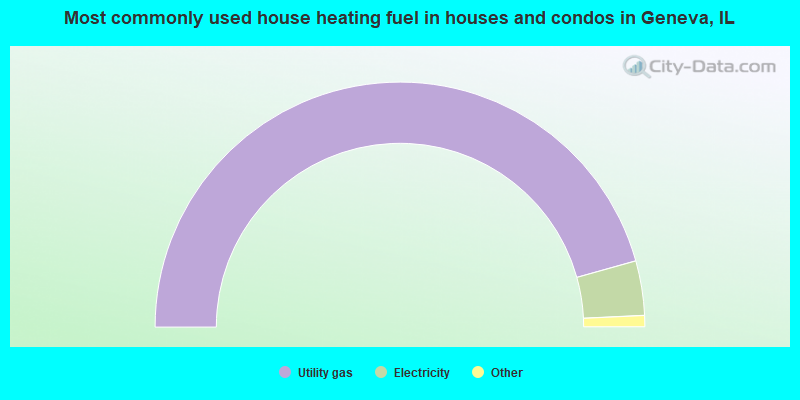
House heating fuel used in houses and condos - Utility gas (%)
House heating fuel used in houses and condos - Bottled, tank, or LP gas (%)
House heating fuel used in houses and condos - Electricity (%)
House heating fuel used in houses and condos - Fuel oil, kerosene, etc. (%)
House heating fuel used in houses and condos - Coal or coke (%)
House heating fuel used in houses and condos - Wood (%)
House heating fuel used in houses and condos - Solar energy (%)
House heating fuel used in houses and condos - Other fuel (%)
House heating fuel used in houses and condos - No fuel used (%)
House heating fuel used in apartments - Utility gas (%)
House heating fuel used in apartments - Bottled, tank, or LP gas (%)
House heating fuel used in apartments - Electricity (%)
House heating fuel used in apartments - Fuel oil, kerosene, etc. (%)
House heating fuel used in apartments - Coal or coke (%)
House heating fuel used in apartments - Wood (%)
House heating fuel used in apartments - Solar energy (%)
House heating fuel used in apartments - Other fuel (%)
House heating fuel used in apartments - No fuel used (%)
Armed forces status - In Armed Forces (%)
Armed forces status - Civilian (%)
Armed forces status - Civilian - Veteran (%)
Armed forces status - Civilian - Nonveteran (%)
Fatal accidents locations in years 2005-2021
Fatal accidents locations in 2005
Fatal accidents locations in 2006
Fatal accidents locations in 2007
Fatal accidents locations in 2008
Fatal accidents locations in 2009
Fatal accidents locations in 2010
Fatal accidents locations in 2011
Fatal accidents locations in 2012
Fatal accidents locations in 2013
Fatal accidents locations in 2014
Fatal accidents locations in 2015
Fatal accidents locations in 2016
Fatal accidents locations in 2017
Fatal accidents locations in 2018
Fatal accidents locations in 2019
Fatal accidents locations in 2020
Fatal accidents locations in 2021
Alcohol use - People drinking some alcohol every month (%)
Alcohol use - People not drinking at all (%)
Alcohol use - Average days/month drinking alcohol
Alcohol use - Average drinks/week
Alcohol use - Average days/year people drink much
Audiometry - Average condition of hearing (%)
Audiometry - People that can hear a whisper from across a quiet room (%)
Audiometry - People that can hear normal voice from across a quiet room (%)
Audiometry - Ears ringing, roaring, buzzing (%)
Audiometry - Had a job exposure to loud noise (%)
Audiometry - Had off-work exposure to loud noise (%)
Blood Pressure & Cholesterol - Has high blood pressure (%)
Blood Pressure & Cholesterol - Checking blood pressure at home (%)
Blood Pressure & Cholesterol - Frequently checking blood cholesterol (%)
Blood Pressure & Cholesterol - Has high cholesterol level (%)
Consumer Behavior - Money monthly spent on food at supermarket/grocery store
Consumer Behavior - Money monthly spent on food at other stores
Consumer Behavior - Money monthly spent on eating out
Consumer Behavior - Money monthly spent on carryout/delivered foods
Consumer Behavior - Income spent on food at supermarket/grocery store (%)
Consumer Behavior - Income spent on food at other stores (%)
Consumer Behavior - Income spent on eating out (%)
Consumer Behavior - Income spent on carryout/delivered foods (%)
Current Health Status - General health condition (%)
Current Health Status - Blood donors (%)
Current Health Status - Has blood ever tested for HIV virus (%)
Current Health Status - Left-handed people (%)
Dermatology - People using sunscreen (%)
Diabetes - Diabetics (%)
Diabetes - Had a blood test for high blood sugar (%)
Diabetes - People taking insulin (%)
Diet Behavior & Nutrition - Diet health (%)
Diet Behavior & Nutrition - Milk product consumption (# of products/month)
Diet Behavior & Nutrition - Meals not home prepared (#/week)
Diet Behavior & Nutrition - Meals from fast food or pizza place (#/week)
Diet Behavior & Nutrition - Ready-to-eat foods (#/month)
Diet Behavior & Nutrition - Frozen meals/pizza (#/month)
Drug Use - People that ever used marijuana or hashish (%)
Drug Use - Ever used hard drugs (%)
Drug Use - Ever used any form of cocaine (%)
Drug Use - Ever used heroin (%)
Drug Use - Ever used methamphetamine (%)
Health Insurance - People covered by health insurance (%)
Kidney Conditions-Urology - Avg. # of times urinating at night
Medical Conditions - People with asthma (%)
Medical Conditions - People with anemia (%)
Medical Conditions - People with psoriasis (%)
Medical Conditions - People with overweight (%)
Medical Conditions - Elderly people having difficulties in thinking or remembering (%)
Medical Conditions - People who ever received blood transfusion (%)
Medical Conditions - People having trouble seeing even with glass/contacts (%)
Medical Conditions - People with arthritis (%)
Medical Conditions - People with gout (%)
Medical Conditions - People with congestive heart failure (%)
Medical Conditions - People with coronary heart disease (%)
Medical Conditions - People with angina pectoris (%)
Medical Conditions - People who ever had heart attack (%)
Medical Conditions - People who ever had stroke (%)
Medical Conditions - People with emphysema (%)
Medical Conditions - People with thyroid problem (%)
Medical Conditions - People with chronic bronchitis (%)
Medical Conditions - People with any liver condition (%)
Medical Conditions - People who ever had cancer or malignancy (%)
Mental Health - People who have little interest in doing things (%)
Mental Health - People feeling down, depressed, or hopeless (%)
Mental Health - People who have trouble sleeping or sleeping too much (%)
Mental Health - People feeling tired or having little energy (%)
Mental Health - People with poor appetite or overeating (%)
Mental Health - People feeling bad about themself (%)
Mental Health - People who have trouble concentrating on things (%)
Mental Health - People moving or speaking slowly or too fast (%)
Mental Health - People having thoughts they would be better off dead (%)
Oral Health - Average years since last visit a dentist
Oral Health - People embarrassed because of mouth (%)
Oral Health - People with gum disease (%)
Oral Health - General health of teeth and gums (%)
Oral Health - Average days a week using dental floss/device
Oral Health - Average days a week using mouthwash for dental problem
Oral Health - Average number of teeth
Pesticide Use - Households using pesticides to control insects (%)
Pesticide Use - Households using pesticides to kill weeds (%)
Physical Activity - People doing vigorous-intensity work activities (%)
Physical Activity - People doing moderate-intensity work activities (%)
Physical Activity - People walking or bicycling (%)
Physical Activity - People doing vigorous-intensity recreational activities (%)
Physical Activity - People doing moderate-intensity recreational activities (%)
Physical Activity - Average hours a day doing sedentary activities
Physical Activity - Average hours a day watching TV or videos
Physical Activity - Average hours a day using computer
Physical Functioning - People having limitations keeping them from working (%)
Physical Functioning - People limited in amount of work they can do (%)
Physical Functioning - People that need special equipment to walk (%)
Physical Functioning - People experiencing confusion/memory problems (%)
Physical Functioning - People requiring special healthcare equipment (%)
Prescription Medications - Average number of prescription medicines taking
Preventive Aspirin Use - Adults 40+ taking low-dose aspirin (%)
Reproductive Health - Vaginal deliveries (%)
Reproductive Health - Cesarean deliveries (%)
Reproductive Health - Deliveries resulted in a live birth (%)
Reproductive Health - Pregnancies resulted in a delivery (%)
Reproductive Health - Women breastfeeding newborns (%)
Reproductive Health - Women that had a hysterectomy (%)
Reproductive Health - Women that had both ovaries removed (%)
Reproductive Health - Women that have ever taken birth control pills (%)
Reproductive Health - Women taking birth control pills (%)
Reproductive Health - Women that have ever used Depo-Provera or injectables (%)
Reproductive Health - Women that have ever used female hormones (%)
Sexual Behavior - People 18+ that ever had sex (vaginal, anal, or oral) (%)
Sexual Behavior - Males 18+ that ever had vaginal sex with a woman (%)
Sexual Behavior - Males 18+ that ever performed oral sex on a woman (%)
Sexual Behavior - Males 18+ that ever had anal sex with a woman (%)
Sexual Behavior - Males 18+ that ever had any sex with a man (%)
Sexual Behavior - Females 18+ that ever had vaginal sex with a man (%)
Sexual Behavior - Females 18+ that ever performed oral sex on a man (%)
Sexual Behavior - Females 18+ that ever had anal sex with a man (%)
Sexual Behavior - Females 18+ that ever had any kind of sex with a woman (%)
Sexual Behavior - Average age people first had sex
Sexual Behavior - Average number of female sex partners in lifetime (males 18+)
Sexual Behavior - Average number of female vaginal sex partners in lifetime (males 18+)
Sexual Behavior - Average age people first performed oral sex on a woman (18+)
Sexual Behavior - Average number of woman performed oral sex on in lifetime (18+)
Sexual Behavior - Average number of male sex partners in lifetime (males 18+)
Sexual Behavior - Average number of male anal sex partners in lifetime (males 18+)
Sexual Behavior - Average age people first performed oral sex on a man (18+)
Sexual Behavior - Average number of male oral sex partners in lifetime (18+)
Sexual Behavior - People using protection when performing oral sex (%)
Sexual Behavior - Average number of times people have vaginal or anal sex a year
Sexual Behavior - People having sex without condom (%)
Sexual Behavior - Average number of male sex partners in lifetime (females 18+)
Sexual Behavior - Average number of male vaginal sex partners in lifetime (females 18+)
Sexual Behavior - Average number of female sex partners in lifetime (females 18+)
Sexual Behavior - Circumcised males 18+ (%)
Sleep Disorders - Average hours sleeping at night
Sleep Disorders - People that has trouble sleeping (%)
Smoking-Cigarette Use - People smoking cigarettes (%)
Taste & Smell - People 40+ having problems with smell (%)
Taste & Smell - People 40+ having problems with taste (%)
Taste & Smell - People 40+ that ever had wisdom teeth removed (%)
Taste & Smell - People 40+ that ever had tonsils teeth removed (%)
Taste & Smell - People 40+ that ever had a loss of consciousness because of a head injury (%)
Taste & Smell - People 40+ that ever had a broken nose or other serious injury to face or skull (%)
Taste & Smell - People 40+ that ever had two or more sinus infections (%)
Weight - Average height (inches)
Weight - Average weight (pounds)
Weight - Average BMI
Weight - People that are obese (%)
Weight - People that ever were obese (%)
Weight - People trying to lose weight (%)
According to our research of Illinois and other state lists, there were 4 registered sex offenders living in Geneva, Illinois as of April 27, 2024 . The ratio of all residents to sex offenders in Geneva is 5,486 to 1.The ratio of registered sex offenders to all residents in this city is much lower than the state average.
Officers per 1,000 residents here:
1.61Illinois average:
2.84
Latest news from Geneva, IL collected exclusively by city-data.com from local newspapers, TV, and radio stations
Ancestries: German (18.9%), Italian (9.8%), Irish (8.8%), Polish (6.8%), European (6.7%), American (4.7%).
Current Local Time:
Incorporated on 05/27/1887
Land area: 8.41 square miles.
Population density: 2,525 people per square mile (average).
1,118 residents are foreign born (2.2% Latin America , 1.6% Asia , 1.0% Europe ).
This city:
5.3%Illinois:
14.1%
Median real estate property taxes paid for housing units with mortgages in 2022: $9,142 (2.1%)Median real estate property taxes paid for housing units with no mortgage in 2022: $8,953 (2.2%)
Nearest city with pop. 50,000+: Aurora, IL
Nearest city with pop. 200,000+: Chicago, IL
Nearest cities:
Latitude: 41.89 N, Longitude: 88.31 W
Daytime population change due to commuting: +6,500 (+30.6%)Workers who live and work in this city: 4,143 (35.7%)
Geneva tourist attractions:
Single-family new house construction building permits:
2022: 8 buildings , average cost: $692,5002021: 68 buildings , average cost: $277,3002020: 24 buildings , average cost: $299,7002019: 18 buildings , average cost: $341,9002018: 50 buildings , average cost: $236,4002017: 32 buildings , average cost: $310,6002016: 83 buildings , average cost: $239,1002015: 76 buildings , average cost: $277,8002014: 20 buildings , average cost: $399,2002013: 12 buildings , average cost: $517,6002012: 9 buildings , average cost: $387,2002011: 4 buildings , average cost: $295,0002010: 5 buildings , average cost: $347,0002009: 6 buildings , average cost: $463,3002008: 4 buildings , average cost: $434,2002007: 31 buildings , average cost: $412,4002006: 108 buildings , average cost: $275,2002005: 211 buildings , average cost: $283,0002004: 233 buildings , average cost: $282,4002003: 221 buildings , average cost: $285,4002002: 248 buildings , average cost: $272,6002001: 290 buildings , average cost: $281,8002000: 240 buildings , average cost: $277,1001999: 215 buildings , average cost: $255,0001998: 145 buildings , average cost: $267,3001997: 138 buildings , average cost: $253,000Unemployment in December 2023:
Population change in the 1990s: +6,643 (+51.6%).
Most common industries in Geneva, IL (%)
Both Males Females
Professional, scientific, technical services (12.0%)
Educational services (10.4%)
Finance & insurance (7.0%)
Health care (6.9%)
Construction (5.3%)
Accommodation & food services (4.1%)
Public administration (2.9%)
Professional, scientific, technical services (15.2%)
Construction (7.6%)
Finance & insurance (7.6%)
Accommodation & food services (4.5%)
Educational services (4.1%)
Public administration (3.1%)
Metal & metal products (3.0%)
Educational services (18.6%)
Health care (13.2%)
Professional, scientific, technical services (7.9%)
Finance & insurance (6.2%)
Social assistance (5.4%)
Accommodation & food services (3.6%)
Religious, grantmaking, civic, professional, similar organizations (3.1%)
Most common occupations in Geneva, IL (%)
Both Males Females
Other management occupations, except farmers and farm managers (6.9%)
Sales representatives, services, wholesale and manufacturing (5.9%)
Other sales and related occupations, including supervisors (5.1%)
Top executives (4.5%)
Preschool, kindergarten, elementary, and middle school teachers (4.3%)
Retail sales workers, except cashiers (3.8%)
Advertising, marketing, promotions, public relations, and sales managers (3.3%)
Other management occupations, except farmers and farm managers (8.5%)
Sales representatives, services, wholesale and manufacturing (7.4%)
Top executives (7.1%)
Other sales and related occupations, including supervisors (5.6%)
Retail sales workers, except cashiers (4.3%)
Computer specialists (3.9%)
Advertising, marketing, promotions, public relations, and sales managers (3.7%)
Preschool, kindergarten, elementary, and middle school teachers (9.4%)
Secretaries and administrative assistants (7.1%)
Registered nurses (5.3%)
Other office and administrative support workers, including supervisors (5.1%)
Other management occupations, except farmers and farm managers (4.9%)
Other sales and related occupations, including supervisors (4.5%)
Sales representatives, services, wholesale and manufacturing (4.0%)
Tornado activity:
Geneva-area historical tornado activity is slightly below Illinois state average. It is 49% greater than the overall U.S. average.
On 8/28/1990, a category F5 (max. wind speeds 261-318 mph) tornado 14.4 miles away from the Geneva city center killed 29 people and injured 350 people and caused between $50,000 and $500,000 in damages.
On 4/21/1967, a category F4 (max. wind speeds 207-260 mph) tornado 18.4 miles away from the city center killed one person and injured 100 people and caused between $500,000 and $5,000,000 in damages.
Earthquake activity:
Geneva-area historical earthquake activity is significantly above Illinois state average. It is 51% greater than the overall U.S. average. On 4/18/2008 at 09:36:59, a magnitude 5.4 (5.1 MB, 4.8 MS, 5.4 MW, 5.2 MW, Class: Moderate, Intensity: VI - VII) earthquake occurred 238.6 miles away from the city center On 6/10/1987 at 23:48:54, a magnitude 5.1 (4.9 MB, 4.4 MS, 4.6 MS, 5.1 LG) earthquake occurred 213.2 miles away from Geneva center On 4/18/2008 at 09:36:59, a magnitude 5.2 (5.2 MW, Depth: 8.9 mi) earthquake occurred 238.6 miles away from the city center On 6/28/2004 at 06:10:52, a magnitude 4.2 (4.2 MW, Depth: 6.2 mi, Class: Light, Intensity: IV - V) earthquake occurred 42.3 miles away from Geneva center On 2/10/2010 at 09:59:35, a magnitude 3.8 (3.8 MW, Depth: 6.2 mi, Class: Light, Intensity: II - III) earthquake occurred 11.2 miles away from the city center On 6/18/2002 at 17:37:15, a magnitude 5.0 (4.3 MB, 4.6 MW, 5.0 LG) earthquake occurred 271.1 miles away from Geneva center Magnitude types: regional Lg-wave magnitude (LG), body-wave magnitude (MB), surface-wave magnitude (MS), moment magnitude (MW) Natural disasters: The number of natural disasters in Kane County (15) is near the US average (15).Major Disasters (Presidential) Declared: 10Emergencies Declared: 4Floods: 7, Storms: 7, Snowstorms: 2, Tornadoes: 2, Winter Storms: 2, Blizzard: 1, Hurricane: 1, Snow: 1, Wind: 1, Other: 1 (Note: some incidents may be assigned to more than one category). Hospitals and medical centers in Geneva: DELNOR COMMUNITY HOSPITAL (Voluntary non-profit - Other, provides emergency services, 300 RANDALL RD) MARKLUND TOMMY HOME (15385 WYATT DRIVE) GENEVA NURSING AND REHAB CENTER (1101 EAST STATE STREET)
TRI CITIES DIALYSIS LLC (306 RANDALL RD)
LEDMAN HEALTH CARE, INC (825 W STATE ST, STE 109)
Heliports located in Geneva: Amtrak stations near Geneva: 12 miles: NAPERVILLE (E. 4TH & ELLSWORTH AVE.) Services: ticket office, partially wheelchair accessible, enclosed waiting area, public restrooms, public payphones, free short-term parking, free long-term parking, call for taxi service, public transit connection.
20 miles: PLANO (MAIN ST. WEST OF CENTER ST.) Colleges/universities with over 2000 students nearest to Geneva:
Elgin Community College (about 10 miles; Elgin, IL ; Full-time enrollment: 8,173)
Aurora University (about 10 miles; Aurora, IL ; FT enrollment: 4,596)
Waubonsee Community College (about 10 miles; Sugar Grove, IL ; FT enrollment: 7,698)
Wheaton College (about 12 miles; Wheaton, IL ; FT enrollment: 2,948)
North Central College (about 12 miles; Naperville, IL ; FT enrollment: 2,860)
College of DuPage (about 13 miles; Glen Ellyn, IL ; FT enrollment: 18,910)
Universal Technical Institute of Illinois Inc (about 13 miles; Glendale Heights, IL ; FT enrollment: 2,281)
Public high school in Geneva:
Public elementary/middle schools in Geneva: GENEVA MIDDLE SCH NORTH Students: 720, Location: 1357 VIKING DR, Grades: 6-8)GENEVA MIDDLE SCH SOUTH Students: 703, Location: 1415 VIKING DR, Grades: 6-8)WESTERN AVENUE ELEM SCHOOL Students: 590, Location: 1500 WESTERN AVE, Grades: KG-5)HARRISON STREET ELEM SCHOOL Students: 507, Location: 201 N HARRISON ST, Grades: KG-5)HEARTLAND ELEMENTARY SCHOOL Students: 488, Location: 3300 HEARTLAND DR, Grades: KG-5)MILL CREEK SCHOOL Students: 435, Location: N900 BRUNDIGE DR, Grades: KG-5)WILLIAMSBURG ELEM SCHOOL Location: 1812 WILLIAMSBURG AVE, Grades: KG-5)
FABYAN ELEMENTARY SCHOOL Location: OS350 GRENGS LN, Grades: KG-5)
Private elementary/middle schools in Geneva: ST PETER ELEMENTARY SCHOOL Students: 477, Location: 1881 KANEVILLE RD, Grades: PK-8)
FAITH CHRISTIAN ACADEMY Students: 88, Location: 1745 KANEVILLE RD STE 2, Grades: 1-8)
See full list of schools located in Geneva Library in Geneva: GENEVA PUBLIC LIBRARY DISTRICT Operating income: $4,064,068; Location: 127 JAMES STREET; 166,383 books ; 12,154 audio materials ; 10,055 video materials ; 33 local licensed databases ; 12 state licensed databases ; 1 other licensed databases ; 317 print serial subscriptions )
Notable locations in Geneva: (A) , Geneva Golf Club (B) , Geneva Fire Department Headquarters Station (C) , Geneva Fire Department Station 2 (D) , A - Tec Ambulance (E) , Tri - City Ambulance - Geneva (F) , Kane County Government Center (G) , Kane County Courthouse (H) , Kane County Correction Center (I) , Geneva City Hall (J) . Display/hide their locations on the map
Churches in Geneva include: (A) , First Baptist Church (B) , First Church of Christ Scientist (C) , First Congregational Church (D) , Saint Marks Episcopal Church (E) , Saint Peters Roman Catholic Church (F) , Unitarian Church (G) , Fox Valley Presbyterian Church (H) . Display/hide their locations on the map
Cemeteries: (1) , Westside Cemetery (2) , Resurrection Catholic Cemetery (3) . Display/hide their locations on the map
Parks in Geneva include: (1) , Sunset Park (2) , Riverside Park (3) , Elm Park (4) , Bennett Park (5) , Burgess Field (6) , Old Mill Park (7) , Island Park (8) , Dryden Park (9) . Display/hide their locations on the map
Tourist attraction:
Hotels:
Courts:
Birthplace of: Bob Woodward - (born 1943), journalist, Bobby Jameson - Male singer-songwriter, Edmund Beecher Wilson - Zoologist, Joan Taylor - Film actor, Gower Champion - (1919-1980), dancer, choreographer, Bob Zeman - Football safety, Christopher R. McCleary - Financial businessman, Milton L. Knudson - Navy Navy and Marine Corps Medal recipient, Stu Linder - Film editor, Timothy L. Schmitz - Politician.
Kane County has a predicted average indoor radon screening level greater than 4 pCi/L (pico curies per liter) - Highest Potential Drinking water stations with addresses in Geneva and their reported violations in the past:
RANDALL OAKS PARK COMM SHELTER (Population served: 500, Groundwater):
Past health violations:
MCL, Monthly (TCR) - Between JAN-2009 and DEC-2009, Contaminant: Coliform. Follow-up actions: St Compliance achieved (APR-23-2009)
MCL, Acute (TCR) - Between JAN-2008 and DEC-2008, Contaminant: Coliform. Follow-up actions: St Compliance achieved (APR-23-2009)
MCL, Monthly (TCR) - Between JAN-2006 and DEC-2006, Contaminant: Coliform. Follow-up actions: St Violation/Reminder Notice (AUG-02-2006), St Compliance achieved (SEP-06-2006)
Past monitoring violations:
Monitoring, Repeat Major (TCR) - Between JAN-2006 and DEC-2006, Contaminant: Coliform (TCR). Follow-up actions: St Site Visit (enforcement) (AUG-22-2006), St Compliance achieved (AUG-30-2006)
One regular monitoring violation
Population served: 450, Groundwater under infl of surface water):
Past monitoring violations:
One regular monitoring violation
Population served: 300, Groundwater):
Past monitoring violations:
One regular monitoring violation
Population served: 200, Groundwater):
Past monitoring violations:
One regular monitoring violation
Population served: 200, Groundwater):
Past monitoring violations:
Monitoring, Repeat Major (TCR) - Between JAN-2009 and DEC-2009, Contaminant: Coliform (TCR). Follow-up actions: St Violation/Reminder Notice (2 times from NOV-05-2009 to FEB-16-2010), St Compliance achieved (MAR-22-2010)
Population served: 200, Groundwater):
Past monitoring violations:
One routine major monitoring violation
One regular monitoring violation
Population served: 160, Groundwater):
Past monitoring violations:
Monitoring, Repeat Major (TCR) - Between JAN-2010 and DEC-2010, Contaminant: Coliform (TCR). Follow-up actions: St Violation/Reminder Notice (JAN-20-2010), St Compliance achieved (APR-06-2010)
One routine major monitoring violation
Population served: 100, Groundwater):
Past monitoring violations:
One regular monitoring violation
Drinking water stations with addresses in Geneva that have no violations reported:
PARKSIDE LANES (Population served: 750, Primary Water Source Type: Groundwater)
SORRENTOS RANCH (Population served: 200, Primary Water Source Type: Groundwater)
GASLITE MANOR (Population served: 200, Primary Water Source Type: Groundwater)
OAKHURST FOREST PRESERVE (Population served: 150, Primary Water Source Type: Groundwater)
SYBAQUAY GIRL SCOUT COUNCIL (Population served: 100, Primary Water Source Type: Groundwater)
STONEYS TAVERN (Population served: 100, Primary Water Source Type: Groundwater)
WATER OPTIONS MR JOHN MANNY (Population served: 80, Primary Water Source Type: Purch groundwater)
SAUER FAMILY FARM FOREST PRESERVE (Population served: 55, Primary Water Source Type: Groundwater)
RUTLAND FP CABIN (Population served: 25, Primary Water Source Type: Groundwater)
Average household size: This city:
2.7 peopleIllinois:
2.6 people
Percentage of family households: This city:
75.4%Whole state:
65.8%
Percentage of households with unmarried partners: This city:
3.9%Whole state:
6.3%
Likely homosexual households (counted as self-reported same-sex unmarried-partner households)
Lesbian couples: 0.3% of all households Gay men: 0.3% of all households
People in group quarters in Geneva in 2010:
82 people in nursing facilities/skilled-nursing facilities
50 people in group homes intended for adults
2 people in other noninstitutional facilities
People in group quarters in Geneva in 2000:
214 people in local jails and other confinement facilities (including police lockups)
95 people in nursing homes
74 people in short-term care, detention or diagnostic centers for delinquent children
Banks with most branches in Geneva (2011 data):
INLAND BANK & TRUST: Courier Services Branch at 1900 West State Street, branch established on 2001/09/25; First Choice Bank Branch at 1900 West State Street, branch established on 2001/07/02. Info updated 2011/08/22: Bank assets: $1,288.7 mil, Deposits: $1,091.2 mil, headquarters in Oak Brook, IL, positive income , Commercial Lending Specialization, 13 total offices , Holding Company: Inland Bancorp, Inc.
U.S. Bank National Association: Geneva Branch at 808 West State Street, branch established on 1907/01/01; East Geneva Branch at 1009 East State Street, branch established on 1981/09/11. Info updated 2012/01/30: Bank assets: $330,470.8 mil, Deposits: $236,091.5 mil, headquarters in Cincinnati, OH, positive income , 3121 total offices , Holding Company: U.S. Bancorp
Fifth Third Bank: Randall Square at 1776 South Randall Road, branch established on 1996/03/27; Geneva Downtown Branch at 629 West State Street, branch established on 1994/03/10. Info updated 2009/10/05: Bank assets: $114,540.4 mil, Deposits: $89,689.1 mil, headquarters in Cincinnati, OH, positive income , Commercial Lending Specialization, 1378 total offices , Holding Company: Fifth Third Bancorp
First American Bank: Geneva Branch at 1789 South Randall Road, branch established on 1998/05/14. Info updated 2010/01/19: Bank assets: $2,710.6 mil, Deposits: $2,213.4 mil, headquarters in Elk Grove Village, IL, negative income in the last year , Commercial Lending Specialization, 50 total offices , Holding Company: First American Bank Corporation
The PrivateBank and Trust Company: Geneva Branch at 501 West State Street, Suite 101, branch established on 2006/05/15. Info updated 2010/11/19: Bank assets: $12,392.4 mil, Deposits: $10,542.5 mil, headquarters in Chicago, IL, positive income , Commercial Lending Specialization, 30 total offices , Holding Company: Privatebancorp, Inc.
BMO Harris Bank National Association: Geneva Branch at 1399 East State Street, branch established on 1989/05/20. Info updated 2011/07/14: Bank assets: $97,264.0 mil, Deposits: $75,624.6 mil, headquarters in Chicago, IL, positive income , 717 total offices , Holding Company: Bank Of Montreal
St. Charles Bank & Trust Company: Geneva Branch at 2401 Kaneville Road, branch established on 2006/11/06. Info updated 2011/10/05: Bank assets: $614.3 mil, Deposits: $533.4 mil, headquarters in Saint Charles, IL, positive income , Commercial Lending Specialization, 5 total offices , Holding Company: Wintrust Financial Corporation
Bank of America, National Association: Geneva Banking Center Branch at 802 Commons Drive, branch established on 2003/12/08. Info updated 2009/11/18: Bank assets: $1,451,969.3 mil, Deposits: $1,077,176.8 mil, headquarters in Charlotte, NC, positive income , 5782 total offices , Holding Company: Bank Of America Corporation
American Bank and Trust Company, National Association: Geneva Branch at 1542 South Randall Road, branch established on 2001/02/20. Info updated 2006/11/03: Bank assets: $465.6 mil, Deposits: $412.7 mil, headquarters in Davenport, IA, negative income in the last year , Commercial Lending Specialization, 11 total offices , Holding Company: Ambank Holdings, Inc.
3 other banks with 3 local branches
For population 15 years and over in Geneva:
Never married: 26.4%Now married: 59.1%Separated: 0.5%Widowed: 5.2%Divorced: 8.8% For population 25 years and over in Geneva:
High school or higher: 97.4%Bachelor's degree or higher: 61.1%Graduate or professional degree: 24.8%Unemployed: 2.7%Mean travel time to work (commute): 21.8 minutes
Education Gini index (Inequality in education) Here:
8.9Illinois average:
12.5
Religion statistics for Geneva, IL (based on Kane County data)
Religion Adherents Congregations Catholic 155,391 28 Evangelical Protestant 50,728 184 Mainline Protestant 36,576 72 Other 19,744 30 Black Protestant 3,679 10 Orthodox 1,630 2 None 247,521 -
Source: Clifford Grammich, Kirk Hadaway, Richard Houseal, Dale E.Jones, Alexei Krindatch, Richie Stanley and Richard H.Taylor. 2012. 2010 U.S.Religion Census: Religious Congregations & Membership Study. Association of Statisticians of American Religious Bodies. Jones, Dale E., et al. 2002. Congregations and Membership in the United States 2000. Nashville, TN: Glenmary Research Center. Graphs represent county-level data
Food Environment Statistics: Number of grocery stores : 80Kane County :
1.61 / 10,000 pop.State :
2.24 / 10,000 pop.
Number of supercenters and club stores : 4Kane County :
0.08 / 10,000 pop.Illinois :
0.08 / 10,000 pop.
Number of convenience stores (no gas) : 27Kane County :
0.54 / 10,000 pop.Illinois :
0.75 / 10,000 pop.
Number of convenience stores (with gas) : 97Kane County :
1.95 / 10,000 pop.Illinois :
2.61 / 10,000 pop.
Number of full-service restaurants : 294This county :
5.90 / 10,000 pop.State :
6.86 / 10,000 pop.
Adult diabetes rate : This county :
7.2%Illinois :
8.3%
Adult obesity rate : Kane County :
27.2%Illinois :
25.2%
Low-income preschool obesity rate : Health and Nutrition: Healthy diet rate : Geneva:
50.1%Illinois:
49.5%
Average overall health of teeth and gums : Average BMI : This city:
28.8Illinois:
28.6
People feeling badly about themselves : Geneva:
22.5%Illinois:
20.5%
People not drinking alcohol at all : Geneva:
8.7%Illinois:
10.8%
Average hours sleeping at night : General health condition : Average condition of hearing : More about Health and Nutrition of Geneva, IL Residents
Local government employment and payroll (March 2022)
Function
Full-time employees
Monthly full-time payroll
Average yearly full-time wage
Part-time employees
Monthly part-time payroll
Police Protection - Officers
38 $363,664 $114,841 0 $0 Other and Unallocable
26 $175,467 $80,985 1 $3,756 Firefighters
21 $198,748 $113,570 24 $25,881 Streets and Highways
17 $185,712 $131,091 0 $0 Other Government Administration
16 $127,769 $95,827 4 $5,621 Electric Power
12 $127,622 $127,622 0 $0 Water Supply
11 $64,411 $70,267 0 $0 Police - Other
8 $46,467 $69,701 7 $19,093 Financial Administration
7 $51,324 $87,984 1 $1,569 Sewerage
5 $40,044 $96,106 0 $0 Fire - Other
2 $7,775 $46,650 0 $0
Totals for Government
163 $1,389,004 $102,258 37 $55,921
Geneva government finances - Expenditure in 2018 (per resident):
Construction - Parks and Recreation: $125,000 ($5.89)
Current Operations - Electric Utilities: $30,037,000 ($1414.97)
Police Protection: $7,181,000 ($338.28)General - Other: $5,669,000 ($267.05)Water Utilities: $5,173,000 ($243.69)Local Fire Protection: $4,556,000 ($214.62)Regular Highways: $2,069,000 ($97.47)Sewerage: $1,849,000 ($87.10)Parks and Recreation: $1,283,000 ($60.44)Central Staff Services: $1,115,000 ($52.52)Solid Waste Management: $536,000 ($25.25)Parking Facilities: $192,000 ($9.04)Miscellaneous Commercial Activities - Other: $71,000 ($3.34)General - Interest on Debt: $2,797,000 ($131.76)
Other Capital Outlay - Regular Highways: $2,280,000 ($107.41)
General - Other: $1,461,000 ($68.82)Water Utilities: $1,101,000 ($51.87)Police Protection: $239,000 ($11.26)Central Staff Services: $125,000 ($5.89)Total Salaries and Wages: $14,189,000 ($668.41)
Geneva government finances - Revenue in 2018 (per resident):
Charges - Sewerage: $37,044,000 ($1745.05)
Other: $1,101,000 ($51.87)Parking Facilities: $589,000 ($27.75)Solid Waste Management: $522,000 ($24.59)Miscellaneous - General Revenue - Other: $1,878,000 ($88.47)
Fines and Forfeits: $685,000 ($32.27)Interest Earnings: $212,000 ($9.99)Revenue - Water Utilities: $9,926,000 ($467.59)
State Intergovernmental - General Local Government Support: $7,402,000 ($348.69)
Other: $657,000 ($30.95)Highways: $549,000 ($25.86)Tax - Property: $7,653,000 ($360.51)
Public Utilities Sales: $4,646,000 ($218.86)Other License: $618,000 ($29.11)Other Selective Sales: $109,000 ($5.13)
Geneva government finances - Debt in 2018 (per resident):
Long Term Debt - Beginning Outstanding - Unspecified Public Purpose: $69,918,000 ($3293.67)
Outstanding Unspecified Public Purpose: $60,449,000 ($2847.61)Retired Unspecified Public Purpose: $15,267,000 ($719.19)Issue, Unspecified Public Purpose: $5,798,000 ($273.13)
Geneva government finances - Cash and Securities in 2018 (per resident):
Other Funds - Cash and Securities: $27,384,000 ($1289.99)
7.35% of this county's 2020 resident taxpayers moved to other counties in 2021 ($81,683 average adjusted gross income )
Here:
7.35%Illinois average:
6.10%
0.01% of residents moved to foreign countries ($73 average AGI )Kane County:
0.01%Illinois average:
0.01%
Top counties to which taxpayers relocated from this county between 2020 and 2021:
Businesses in Geneva, IL
Name Count Name Count
7-Eleven 2 Houlihan's 1 ALDI 1 J. Jill 1 Abercrombie & Fitch 1 Jamba Juice 1 Aeropostale 1 Jimmy John's 1 American Eagle Outfitters 1 JoS. A. Bank 1 Ann Taylor 2 Justice 1 Applebee's 1 KFC 1 Banana Republic 1 La-Z-Boy 1 Barnes & Noble 1 Lane Bryant 1 Bath & Body Works 1 Lane Furniture 1 Bed Bath & Beyond 1 Marshalls 1 Blockbuster 1 MasterBrand Cabinets 4 Buffalo Wild Wings 1 McDonald's 2 CVS 1 Men's Wearhouse 1 Caribou Coffee 1 Motherhood Maternity 1 Chico's 1 New Balance 3 Chipotle 1 New York & Co 1 Circle K 1 Nike 3 Coldwater Creek 1 Old Navy 1 Comfort Inn 1 Panera Bread 1 Crate & Barrel 1 Penske 1 Curves 1 PetSmart 1 Dairy Queen 1 Plato's Closet 1 DressBarn 1 Pottery Barn 1 Dressbarn 1 Red Lobster 1 Express 1 SAS Shoes 1 Famous Footwear 1 Safeway 1 FedEx 1 Sprint Nextel 1 Finish Line 1 Starbucks 3 Forever 21 1 Subway 3 GameStop 2 T-Mobile 1 Gap 1 Toys"R"Us 1 Gymboree 1 UPS 4 H&M 1 Victoria's Secret 1 H&R Block 1 Vons 1 Hollister Co. 1 Wendy's 1 Home Depot 1
Strongest AM radio stations in Geneva:
WSCR (670 AM; 50 kW; CHICAGO, IL; Owner: INFINITY BROADCASTING OPERATIONS, INC.)
WSPY (1480 AM; 1 kW; GENEVA, IL)
WGN (720 AM; 50 kW; CHICAGO, IL; Owner: WGN CONTINENTAL BROADCASTING CO.)
WBBM (780 AM; 50 kW; CHICAGO, IL; Owner: INFINITY BROADCASTING OPERATIONS, INC.)
WMVP (1000 AM; 50 kW; CHICAGO, IL; Owner: ABC, INC.)
WYLL (1160 AM; 50 kW; CHICAGO, IL; Owner: SCA LICENSE CORPORATION)
WLS (890 AM; 50 kW; CHICAGO, IL; Owner: WLS, INC.)
WTMJ (620 AM; 50 kW; MILWAUKEE, WI; Owner: JOURNAL BROADCAST CORPORATION)
WMBI (1110 AM; daytime; 5 kW; CHICAGO, IL; Owner: THE MOODY BIBLE INSTITUTE OF CHICAGO)
WISN (1130 AM; 50 kW; MILWAUKEE, WI; Owner: CAPSTAR TX LIMITED PARTNERSHIP)
WVIV (1200 AM; 20 kW; CHICAGO, IL; Owner: WLXX-AM LICENSE CORP.)
WAUR (930 AM; 4 kW; SANDWICH, IL; Owner: CHRISTIAN BROADCASTING SYSTEM, LTD.)
WRMN (1410 AM; 1 kW; ELGIN, IL; Owner: ELGIN BROADCASTING CO., INC.)
Strongest FM radio stations in Geneva:
WERV-FM (95.9 FM; AURORA, IL; Owner: NM LICENSING, LLC)
WJKL (94.3 FM; ELGIN, IL; Owner: ELGIN BROADCASTING CO., INC.)
WLEY-FM (107.9 FM; AURORA, IL; Owner: WLEY LICENSING, INC.)
WCKG (105.9 FM; ELMWOOD PARK, IL; Owner: INFINITY HOLDINGS CORPORATION OF ORLANDO)
WLIT-FM (93.9 FM; CHICAGO, IL; Owner: AMFM RADIO LICENSES, L.L.C.)
WJMK (104.3 FM; CHICAGO, IL; Owner: INFINITY BROADCASTING CORP. OF ILLINOIS)
WNUA (95.5 FM; CHICAGO, IL; Owner: AMFM RADIO LICENSES, L.L.C.)
WTMX (101.9 FM; SKOKIE, IL; Owner: BONNEVILLE HOLDING COMPANY)
WBBM-FM (96.3 FM; CHICAGO, IL; Owner: INFINITY BROADCASTING OPERATIONS, INC.)
WGCI-FM (107.5 FM; CHICAGO, IL; Owner: AMFM RADIO LICENSES, L.L.C.)
WKSC-FM (103.5 FM; CHICAGO, IL; Owner: AMFM RADIO LICENSES, L.L.C.)
WFMT (98.7 FM; CHICAGO, IL; Owner: WINDOW TO THE WORLD COMMUNICATIONS)
WZZN (94.7 FM; CHICAGO, IL; Owner: ABC CHICAGO FM RADIO,INC.)
WBEZ (91.5 FM; CHICAGO, IL; Owner: THE WBEZ ALLIANCE, INC.)
WKQX (101.1 FM; CHICAGO, IL; Owner: EMMIS RADIO LICENSE CORPORATION)
WLUP-FM (97.9 FM; CHICAGO, IL; Owner: BONNEVILLE HOLDING COMPANY)
WNND (100.3 FM; CHICAGO, IL; Owner: BONNEVILLE HOLDING COMPANY)
WOJO (105.1 FM; EVANSTON, IL; Owner: TICHENOR LICENSE CORPORATION ("TLC"))
WUSN (99.5 FM; CHICAGO, IL; Owner: INFINITY BROADCASTING CORPORATION OF CHICAGO)
WVAZ (102.7 FM; OAK PARK, IL; Owner: AMFM RADIO LICENSES, L.L.C.)
TV broadcast stations around Geneva:
W24AJ (Channel 24; AURORA, IL; Owner: NELSON TV, INC.)
W57DN (Channel 57; ELGIN, IL; Owner: TRINITY BROADCASTING NETWORK)
W34CK (Channel 34; ARLINGTON HEIGHTS, IL; Owner: FIRST UNITED, INC.)
WLS-TV (Channel 7; CHICAGO, IL; Owner: WLS TELEVISION, INC.)
WMAQ-TV (Channel 5; CHICAGO, IL; Owner: NBC SUBSIDIARY (WMAQ-TV), INC.)
WTTW (Channel 11; CHICAGO, IL; Owner: WINDOW TO THE WORLD COMMUNICATIONS, INC.)
WGN-TV (Channel 9; CHICAGO, IL; Owner: WGN CONTINENTAL BROADCASTING COMPANY)
WGBO-TV (Channel 66; JOLIET, IL; Owner: WGBO LICENSE PARTNERSHIP, G.P.)
WBBM-TV (Channel 2; CHICAGO, IL; Owner: CBS BROADCASTING INC.)
WPWR-TV (Channel 50; GARY, IN; Owner: FOX TELEVISION STATIONS, INC.)
WXFT (Channel 60; AURORA, IL; Owner: TELEFUTURA CHICAGO LLC)
WCIU-TV (Channel 26; CHICAGO, IL; Owner: WCIU-TV LIMITED PARTNERSHIP)
WCPX (Channel 38; CHICAGO, IL; Owner: PAXSON CHICAGO LICENSE, INC.)
WFLD (Channel 32; CHICAGO, IL; Owner: FOX TELEVISION STATIONS, INC.)
W68DO (Channel 68; PALATINE, IL; Owner: TRINITY BROADCASTING NETWORK)
WFBT-CA (Channel 23; CHICAGO, IL; Owner: CHANNEL 23 LIMITED PARTNERSHIP)
WSNS-TV (Channel 44; CHICAGO, IL; Owner: TELEMUNDO OF CHICAGO, INC.)
WJYS (Channel 62; HAMMOND, IN; Owner: JOVON BROADCASTING CORPORATION)
WOCH-LP (Channel 28; CHICAGO, IL; Owner: KM LPTV OF CHICAGO-28, L.L.C.)
WYCC (Channel 20; CHICAGO, IL; Owner: COLLEGE DIST. #508, COUNTY OF COOK)
W64CQ (Channel 64; ARLINGTON HEIGHTS, IL; Owner: TRINITY BROADCASTING NETWORK)
WOCK-CA (Channel 13; CHICAGO, IL; Owner: KM LPTV OF CHICAGO-13, L.L.C.)
W54BE (Channel 54; SUGAR GROVE, IL; Owner: WAUBONSEE COMMUNITY COLLEGE)
WSPY-LP (Channel 30; PLANO, IL; Owner: WSPY-TV, INC.)
National Bridge Inventory (NBI) Statistics 12 Number of bridges404ft / 123m Total length $1,589,000 Total costs229,500 Total average daily traffic15,668 Total average daily truck traffic
New bridges - historical statistics
1 1900-1909 2 1960-1969 3 1970-1979 2 1990-1999 3 2000-2009 1 2010-2019
See full National Bridge Inventory statistics for Geneva, IL
Home Mortgage Disclosure Act Aggregated Statistics For Year 2009(Based on 1 full and 3 partial tracts) A) FHA, FSA/RHS & VA B) Conventional C) Refinancings D) Home Improvement Loans F) Non-occupant Loans on G) Loans On Manufactured Number Average Value Number Average Value Number Average Value Number Average Value Number Average Value Number Average Value
LOANS ORIGINATED 44 $252,571 124 $273,860 909 $243,500 12 $132,266 24 $178,749 1 $411,350 APPLICATIONS APPROVED, NOT ACCEPTED 1 $111,930 10 $256,242 50 $267,377 1 $16,270 2 $189,105 0 $0 APPLICATIONS DENIED 8 $170,279 10 $221,835 170 $274,831 4 $90,345 6 $189,087 0 $0 APPLICATIONS WITHDRAWN 6 $242,605 16 $199,749 101 $259,486 3 $131,150 9 $165,750 0 $0 FILES CLOSED FOR INCOMPLETENESS 1 $347,640 2 $233,675 23 $287,115 1 $27,070 0 $0 0 $0
Aggregated Statistics For Year 2008(Based on 1 full and 3 partial tracts) A) FHA, FSA/RHS & VA B) Conventional C) Refinancings D) Home Improvement Loans E) Loans on Dwellings For 5+ Families F) Non-occupant Loans on Number Average Value Number Average Value Number Average Value Number Average Value Number Average Value Number Average Value
LOANS ORIGINATED 24 $240,933 220 $258,037 380 $248,799 17 $189,208 1 $16,290,220 31 $192,834 APPLICATIONS APPROVED, NOT ACCEPTED 2 $182,890 11 $299,696 48 $272,834 3 $45,370 0 $0 3 $194,830 APPLICATIONS DENIED 6 $226,927 19 $271,391 91 $265,072 13 $143,534 0 $0 7 $181,594 APPLICATIONS WITHDRAWN 3 $319,197 19 $229,195 48 $260,119 4 $127,202 0 $0 5 $156,382 FILES CLOSED FOR INCOMPLETENESS 1 $348,790 2 $274,335 16 $238,610 1 $97,780 0 $0 1 $254,280
Aggregated Statistics For Year 2007(Based on 1 full and 3 partial tracts) A) FHA, FSA/RHS & VA B) Conventional C) Refinancings D) Home Improvement Loans E) Loans on Dwellings For 5+ Families F) Non-occupant Loans on Number Average Value Number Average Value Number Average Value Number Average Value Number Average Value Number Average Value
LOANS ORIGINATED 6 $256,337 265 $255,871 415 $235,149 42 $90,282 2 $1,748,455 45 $210,405 APPLICATIONS APPROVED, NOT ACCEPTED 0 $0 25 $197,966 50 $201,483 7 $110,950 0 $0 6 $199,663 APPLICATIONS DENIED 2 $191,815 34 $230,083 114 $243,899 22 $78,670 0 $0 26 $250,004 APPLICATIONS WITHDRAWN 0 $0 21 $263,112 54 $251,261 2 $268,705 0 $0 7 $232,654 FILES CLOSED FOR INCOMPLETENESS 0 $0 3 $130,903 25 $341,366 1 $74,480 0 $0 1 $174,620
Aggregated Statistics For Year 2006(Based on 1 full and 3 partial tracts) A) FHA, FSA/RHS & VA B) Conventional C) Refinancings D) Home Improvement Loans F) Non-occupant Loans on Number Average Value Number Average Value Number Average Value Number Average Value Number Average Value
LOANS ORIGINATED 4 $222,170 377 $230,549 399 $210,344 50 $94,189 54 $201,116 APPLICATIONS APPROVED, NOT ACCEPTED 0 $0 38 $240,452 54 $192,852 13 $72,926 4 $219,862 APPLICATIONS DENIED 0 $0 32 $250,818 127 $215,373 18 $138,262 7 $254,223 APPLICATIONS WITHDRAWN 0 $0 25 $245,894 74 $211,545 4 $92,835 3 $275,503 FILES CLOSED FOR INCOMPLETENESS 0 $0 3 $240,683 35 $244,863 1 $29,980 3 $208,873
Aggregated Statistics For Year 2005(Based on 1 full and 3 partial tracts) A) FHA, FSA/RHS & VA B) Conventional C) Refinancings D) Home Improvement Loans E) Loans on Dwellings For 5+ Families F) Non-occupant Loans on G) Loans On Manufactured Number Average Value Number Average Value Number Average Value Number Average Value Number Average Value Number Average Value Number Average Value
LOANS ORIGINATED 10 $206,360 522 $218,078 523 $219,786 49 $83,518 1 $5,522,720 63 $191,479 1 $38,370 APPLICATIONS APPROVED, NOT ACCEPTED 0 $0 40 $217,568 46 $211,521 5 $96,656 0 $0 6 $175,615 0 $0 APPLICATIONS DENIED 0 $0 35 $202,298 143 $217,611 20 $85,918 0 $0 10 $188,681 1 $194,880 APPLICATIONS WITHDRAWN 1 $142,890 32 $209,981 109 $220,833 4 $110,152 0 $0 5 $213,132 0 $0 FILES CLOSED FOR INCOMPLETENESS 0 $0 10 $237,840 23 $217,712 2 $44,300 0 $0 0 $0 0 $0
Aggregated Statistics For Year 2004(Based on 1 full and 3 partial tracts) A) FHA, FSA/RHS & VA B) Conventional C) Refinancings D) Home Improvement Loans E) Loans on Dwellings For 5+ Families F) Non-occupant Loans on G) Loans On Manufactured Number Average Value Number Average Value Number Average Value Number Average Value Number Average Value Number Average Value Number Average Value
LOANS ORIGINATED 12 $195,997 515 $221,121 616 $211,504 53 $82,620 1 $2,598,440 67 $181,058 1 $88,280 APPLICATIONS APPROVED, NOT ACCEPTED 0 $0 45 $239,889 59 $210,428 3 $61,367 0 $0 4 $189,598 0 $0 APPLICATIONS DENIED 0 $0 30 $185,850 152 $214,648 15 $76,607 0 $0 7 $246,956 0 $0 APPLICATIONS WITHDRAWN 2 $182,305 40 $212,880 132 $229,847 7 $118,751 0 $0 2 $258,150 0 $0 FILES CLOSED FOR INCOMPLETENESS 0 $0 9 $225,536 38 $215,194 4 $145,295 0 $0 1 $202,210 0 $0
Aggregated Statistics For Year 2003(Based on 1 full and 3 partial tracts) A) FHA, FSA/RHS & VA B) Conventional C) Refinancings D) Home Improvement Loans E) Loans on Dwellings For 5+ Families F) Non-occupant Loans on Number Average Value Number Average Value Number Average Value Number Average Value Number Average Value Number Average Value
LOANS ORIGINATED 23 $196,357 489 $223,426 1,894 $190,741 29 $47,386 1 $774,930 73 $169,190 APPLICATIONS APPROVED, NOT ACCEPTED 0 $0 34 $243,253 141 $189,674 6 $42,860 0 $0 5 $207,204 APPLICATIONS DENIED 3 $198,843 18 $250,001 221 $184,798 26 $43,125 0 $0 12 $162,597 APPLICATIONS WITHDRAWN 1 $256,930 54 $211,837 199 $186,623 9 $58,340 0 $0 6 $179,812 FILES CLOSED FOR INCOMPLETENESS 1 $278,790 9 $211,726 40 $226,200 2 $38,475 0 $0 2 $253,875
Aggregated Statistics For Year 2002(Based on 2 partial tracts) A) FHA, FSA/RHS & VA B) Conventional C) Refinancings D) Home Improvement Loans F) Non-occupant Loans on Number Average Value Number Average Value Number Average Value Number Average Value Number Average Value
LOANS ORIGINATED 13 $161,623 65 $179,200 244 $139,638 4 $39,202 15 $147,404 APPLICATIONS APPROVED, NOT ACCEPTED 0 $0 5 $136,292 26 $126,215 2 $70,020 1 $143,990 APPLICATIONS DENIED 1 $171,600 7 $150,396 40 $115,324 6 $25,970 1 $141,030 APPLICATIONS WITHDRAWN 0 $0 5 $147,436 36 $141,903 3 $25,477 1 $110,450 FILES CLOSED FOR INCOMPLETENESS 0 $0 1 $329,390 7 $159,341 0 $0 0 $0
Aggregated Statistics For Year 2001(Based on 2 partial tracts) A) FHA, FSA/RHS & VA B) Conventional C) Refinancings D) Home Improvement Loans F) Non-occupant Loans on Number Average Value Number Average Value Number Average Value Number Average Value Number Average Value
LOANS ORIGINATED 19 $157,999 65 $156,813 173 $131,518 10 $23,767 9 $119,221 APPLICATIONS APPROVED, NOT ACCEPTED 0 $0 4 $193,665 16 $94,582 2 $60,900 0 $0 APPLICATIONS DENIED 1 $170,610 2 $295,120 18 $90,731 3 $23,670 0 $0 APPLICATIONS WITHDRAWN 1 $156,310 4 $191,200 21 $141,097 1 $36,980 0 $0 FILES CLOSED FOR INCOMPLETENESS 0 $0 0 $0 7 $131,940 0 $0 0 $0
Aggregated Statistics For Year 2000(Based on 2 partial tracts) A) FHA, FSA/RHS & VA B) Conventional C) Refinancings D) Home Improvement Loans F) Non-occupant Loans on Number Average Value Number Average Value Number Average Value Number Average Value Number Average Value
LOANS ORIGINATED 12 $141,931 67 $127,058 49 $91,062 12 $26,298 5 $110,060 APPLICATIONS APPROVED, NOT ACCEPTED 0 $0 2 $110,210 5 $79,980 0 $0 0 $0 APPLICATIONS DENIED 0 $0 3 $82,183 16 $68,664 6 $40,023 1 $50,300 APPLICATIONS WITHDRAWN 1 $241,130 4 $151,258 11 $103,193 5 $26,430 0 $0 FILES CLOSED FOR INCOMPLETENESS 0 $0 1 $186,390 2 $171,350 0 $0 0 $0
Aggregated Statistics For Year 1999(Based on 3 partial tracts) A) FHA, FSA/RHS & VA B) Conventional C) Refinancings D) Home Improvement Loans F) Non-occupant Loans on Number Average Value Number Average Value Number Average Value Number Average Value Number Average Value
LOANS ORIGINATED 32 $144,397 357 $191,945 294 $142,160 47 $41,995 19 $130,291 APPLICATIONS APPROVED, NOT ACCEPTED 0 $0 22 $187,808 35 $143,944 9 $54,949 2 $118,655 APPLICATIONS DENIED 2 $177,705 19 $151,800 58 $129,356 14 $37,581 2 $163,005 APPLICATIONS WITHDRAWN 0 $0 19 $178,323 47 $146,716 12 $98,986 3 $167,060 FILES CLOSED FOR INCOMPLETENESS 0 $0 4 $226,858 10 $137,240 1 $55,500 0 $0
Detailed HMDA statistics for the following Tracts:
8525.00
, 8526.01 , 8526.02
Private Mortgage Insurance Companies Aggregated Statistics For Year 2009(Based on 1 full and 3 partial tracts) A) Conventional B) Refinancings Number Average Value Number Average Value
LOANS ORIGINATED 16 $276,092 14 $287,509 APPLICATIONS APPROVED, NOT ACCEPTED 6 $312,240 6 $281,422 APPLICATIONS DENIED 1 $313,860 3 $277,137 APPLICATIONS WITHDRAWN 1 $558,110 1 $233,390 FILES CLOSED FOR INCOMPLETENESS 0 $0 0 $0
Aggregated Statistics For Year 2008(Based on 1 full and 3 partial tracts) A) Conventional B) Refinancings C) Non-occupant Loans on Number Average Value Number Average Value Number Average Value
LOANS ORIGINATED 41 $262,225 28 $287,108 3 $224,993 APPLICATIONS APPROVED, NOT ACCEPTED 9 $297,204 11 $321,879 0 $0 APPLICATIONS DENIED 5 $294,044 4 $259,483 1 $205,400 APPLICATIONS WITHDRAWN 6 $250,093 2 $250,740 1 $268,990 FILES CLOSED FOR INCOMPLETENESS 1 $303,430 0 $0 0 $0
Aggregated Statistics For Year 2007(Based on 1 full and 3 partial tracts) A) Conventional B) Refinancings C) Non-occupant Loans on Number Average Value Number Average Value Number Average Value
LOANS ORIGINATED 41 $263,405 28 $294,249 5 $236,282 APPLICATIONS APPROVED, NOT ACCEPTED 5 $247,868 10 $281,163 0 $0 APPLICATIONS DENIED 1 $199,880 2 $501,385 0 $0 APPLICATIONS WITHDRAWN 1 $275,720 1 $223,400 0 $0 FILES CLOSED FOR INCOMPLETENESS 0 $0 1 $417,750 0 $0
Aggregated Statistics For Year 2006(Based on 1 full and 3 partial tracts) A) Conventional B) Refinancings C) Non-occupant Loans on Number Average Value Number Average Value Number Average Value
LOANS ORIGINATED 28 $298,686 9 $262,167 3 $323,887 APPLICATIONS APPROVED, NOT ACCEPTED 7 $347,860 9 $258,383 0 $0 APPLICATIONS DENIED 1 $303,820 0 $0 0 $0 APPLICATIONS WITHDRAWN 2 $352,425 0 $0 0 $0 FILES CLOSED FOR INCOMPLETENESS 0 $0 0 $0 0 $0
Aggregated Statistics For Year 2005(Based on 1 full and 3 partial tracts) A) Conventional B) Refinancings C) Non-occupant Loans on Number Average Value Number Average Value Number Average Value
LOANS ORIGINATED 47 $253,269 18 $244,315 4 $205,340 APPLICATIONS APPROVED, NOT ACCEPTED 7 $276,771 5 $273,140 0 $0 APPLICATIONS DENIED 0 $0 0 $0 0 $0 APPLICATIONS WITHDRAWN 4 $202,292 3 $289,567 0 $0 FILES CLOSED FOR INCOMPLETENESS 0 $0 0 $0 0 $0
Aggregated Statistics For Year 2004(Based on 1 full and 3 partial tracts) A) Conventional B) Refinancings C) Non-occupant Loans on Number Average Value Number Average Value Number Average Value
LOANS ORIGINATED 60 $238,974 34 $223,275 4 $172,350 APPLICATIONS APPROVED, NOT ACCEPTED 11 $262,965 10 $218,210 1 $190,090 APPLICATIONS DENIED 1 $175,180 0 $0 0 $0 APPLICATIONS WITHDRAWN 3 $316,130 1 $360,610 1 $200,780 FILES CLOSED FOR INCOMPLETENESS 1 $185,760 0 $0 0 $0
Aggregated Statistics For Year 2003(Based on 1 full and 3 partial tracts) A) Conventional B) Refinancings C) Non-occupant Loans on Number Average Value Number Average Value Number Average Value
LOANS ORIGINATED 94 $241,986 95 $220,432 7 $183,353 APPLICATIONS APPROVED, NOT ACCEPTED 15 $241,614 22 $225,879 0 $0 APPLICATIONS DENIED 1 $297,360 2 $242,115 1 $157,790 APPLICATIONS WITHDRAWN 4 $284,528 7 $180,054 0 $0 FILES CLOSED FOR INCOMPLETENESS 0 $0 0 $0 0 $0
Aggregated Statistics For Year 2002(Based on 2 partial tracts) A) Conventional B) Refinancings Number Average Value Number Average Value
LOANS ORIGINATED 22 $167,676 22 $167,923 APPLICATIONS APPROVED, NOT ACCEPTED 4 $230,030 7 $159,976 APPLICATIONS DENIED 0 $0 1 $179,000 APPLICATIONS WITHDRAWN 2 $169,875 1 $232,740 FILES CLOSED FOR INCOMPLETENESS 0 $0 0 $0
Aggregated Statistics For Year 2001(Based on 2 partial tracts) A) Conventional B) Refinancings Number Average Value Number Average Value
LOANS ORIGINATED 22 $161,737 23 $155,027 APPLICATIONS APPROVED, NOT ACCEPTED 4 $196,622 2 $162,230 APPLICATIONS DENIED 0 $0 0 $0 APPLICATIONS WITHDRAWN 1 $136,100 1 $147,930 FILES CLOSED FOR INCOMPLETENESS 0 $0 0 $0
Aggregated Statistics For Year 2000(Based on 2 partial tracts) A) Conventional B) Refinancings C) Non-occupant Loans on Number Average Value Number Average Value Number Average Value
LOANS ORIGINATED 25 $148,956 4 $141,028 1 $103,060 APPLICATIONS APPROVED, NOT ACCEPTED 1 $143,490 2 $189,350 0 $0 APPLICATIONS DENIED 1 $108,480 0 $0 0 $0 APPLICATIONS WITHDRAWN 0 $0 0 $0 0 $0 FILES CLOSED FOR INCOMPLETENESS 0 $0 0 $0 0 $0
Aggregated Statistics For Year 1999(Based on 3 partial tracts) A) Conventional B) Refinancings C) Non-occupant Loans on Number Average Value Number Average Value Number Average Value
LOANS ORIGINATED 71 $199,201 38 $162,579 2 $151,410 APPLICATIONS APPROVED, NOT ACCEPTED 9 $183,041 4 $198,780 0 $0 APPLICATIONS DENIED 2 $211,310 2 $165,195 0 $0 APPLICATIONS WITHDRAWN 2 $180,720 3 $167,547 0 $0 FILES CLOSED FOR INCOMPLETENESS 1 $224,780 0 $0 0 $0
Detailed PMIC statistics for the following Tracts:
8525.00
, 8526.01 , 8526.02 Fire-safe hotels and motels in Geneva, Illinois:
Herrington Inn & Spa, 15 S River Ln, Geneva, Illinois 60134 Phone: (630) 208-7433, Fax: (630) 208-6987
Comfort Inn Geneva, 1555 W Fabyan Pkwy, Geneva, Illinois 60134 Phone: (630) 208-8811, Fax: (630) 208-7844
All 2 fire-safe hotels and motels in Geneva, Illinois
Most common first names in Geneva, IL among deceased individuals Name Count Lived (average)
John 85 77.7 years Mary 82 80.4 years William 71 76.7 years Robert 60 72.0 years Helen 59 80.9 years James 49 72.4 years Dorothy 46 79.2 years Ruth 42 82.2 years Charles 40 77.9 years George 38 75.9 years
Most common last names in Geneva, IL among deceased individuals Last name Count Lived (average)
Johnson 76 80.4 years Carlson 36 82.3 years Anderson 33 80.8 years Smith 26 77.7 years Nelson 22 77.6 years Peterson 17 82.2 years Thompson 16 79.7 years Larson 15 76.5 years Miller 15 76.6 years Swanson 13 84.0 years
Geneva compared to Illinois state average:
Median household income above state average. Median house value above state average. Unemployed percentage significantly below state average. Black race population percentage significantly below state average. Hispanic race population percentage below state average. Foreign-born population percentage significantly below state average. Renting percentage below state average. Length of stay since moving in above state average. Number of rooms per house above state average. House age below state average. Percentage of population with a bachelor's degree or higher significantly above state average.
#67 on the list of "Top 101 cities with the largest percentage of people in short-term care, detention or diagnostic centers for delinquent children (population 1,000+)"
#8 on the list of "Top 101 counties with the largest decrease in the number of births per 1000 residents 2000-2006 to 2007-2013 (pop 50,000+)"
#58 on the list of "Top 101 counties with the lowest number of deaths per 1000 residents 2007-2013 (pop. 50,000+)"
#65 on the list of "Top 101 counties with the largest increase in the number of infant deaths per 1000 residents 2000-2006 to 2007-2013 (pop. 50,000+)"
#76 on the list of "Top 101 counties with the highest ground withdrawal of fresh water for public supply"
#84 on the list of "Top 101 counties with the largest number of children under 18 without health insurance coverage in 2000 (pop. 50,000+)"
Top Patent Applicants
Mark E. Boduch (31)
John Dallesasse (26)
Michael J. Mccall (21)
James M. Bowman (18)
Daniel Stellick (16)
John F. Trout (9)
Glenn A. Moore (9)
Kent W. Schulz (9)
Karine Luetgert (8)
Daniel J. Masterson (8)
Total of 535 patent applications in 2008-2024.


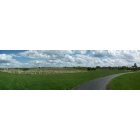
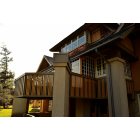


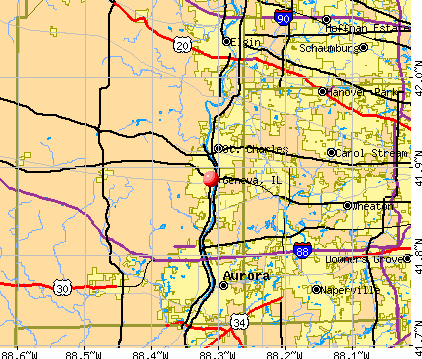


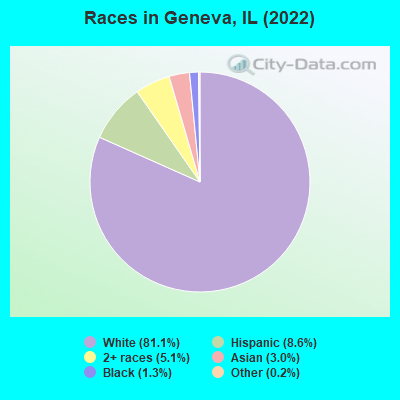
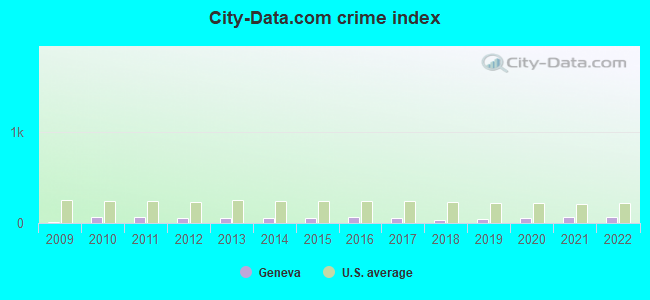
 Recent articles from our blog. Our writers, many of them Ph.D. graduates or candidates, create easy-to-read articles on a wide variety of topics.

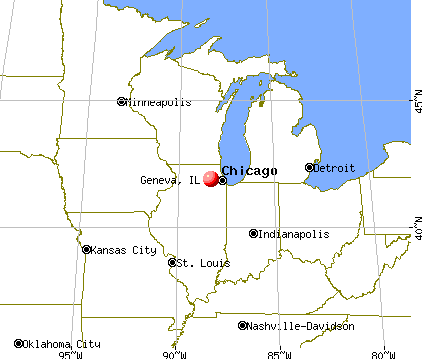
 (8.7 miles
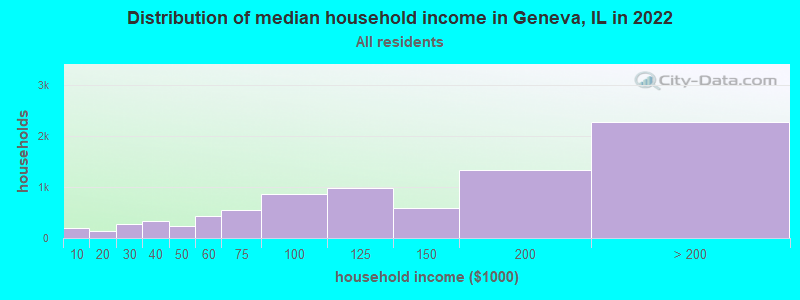
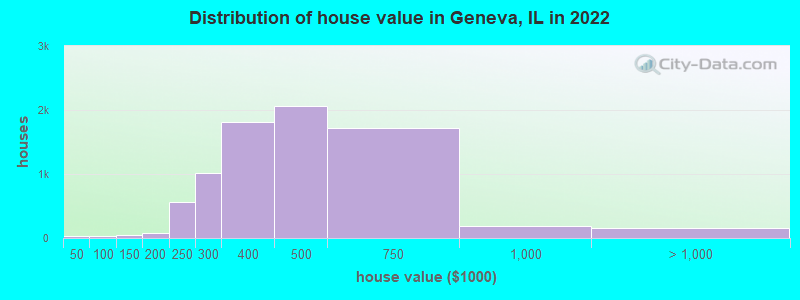

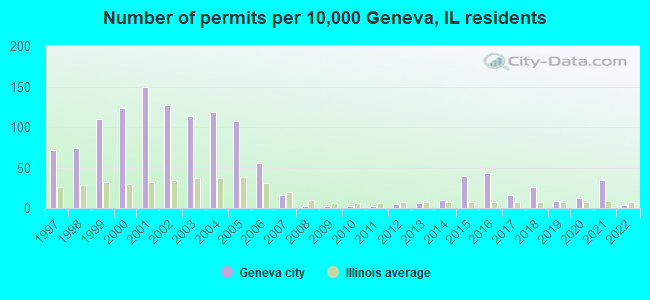
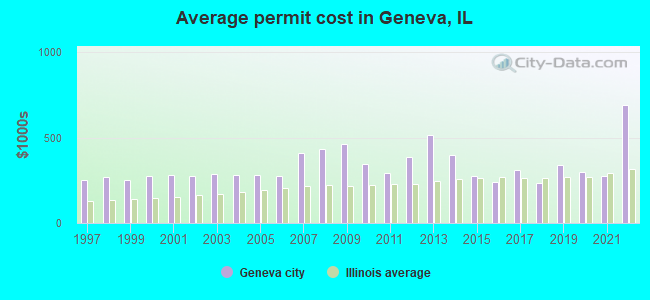
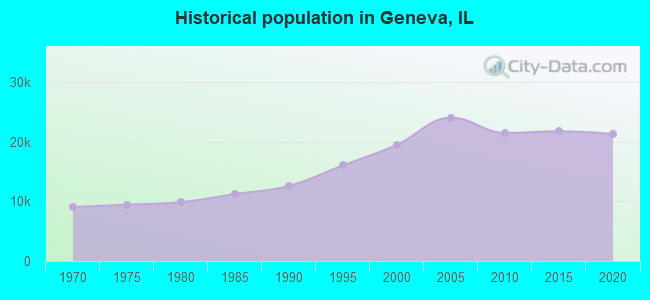
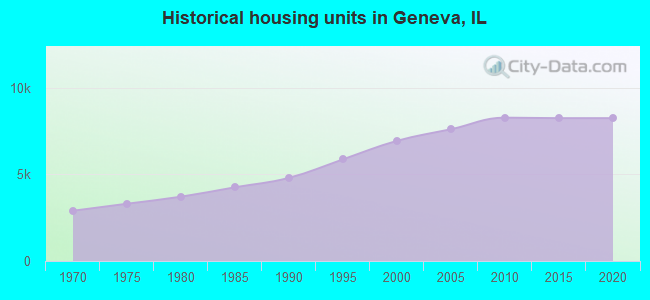
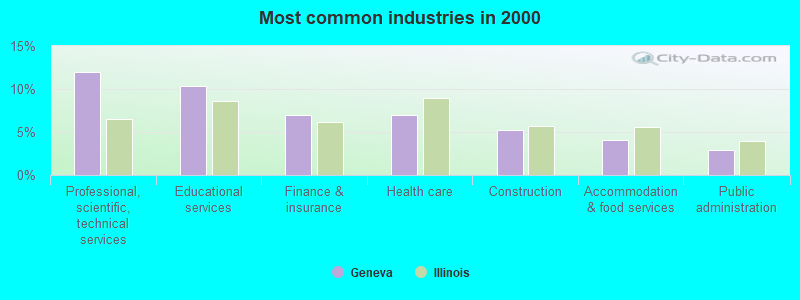
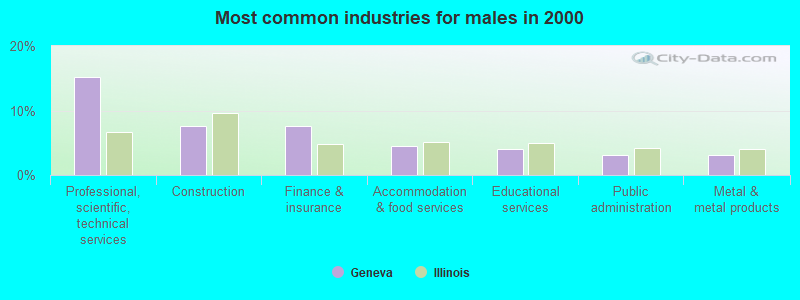
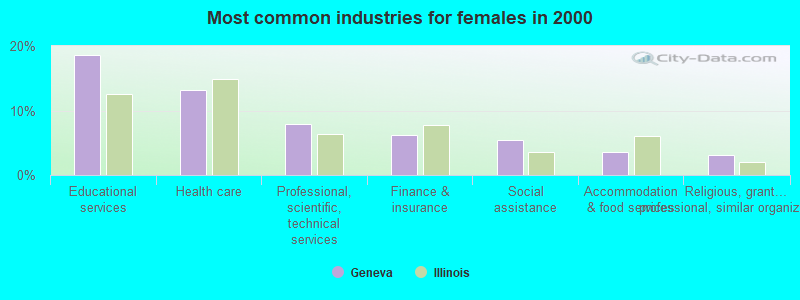
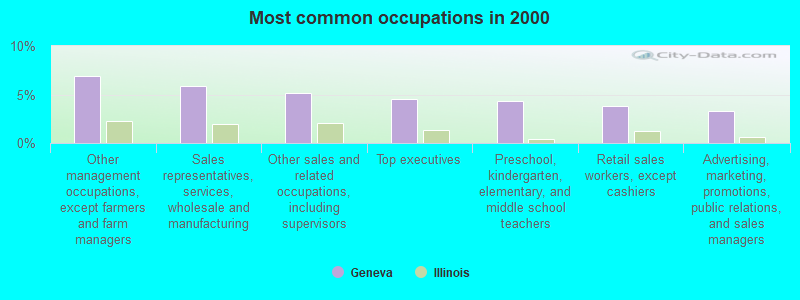
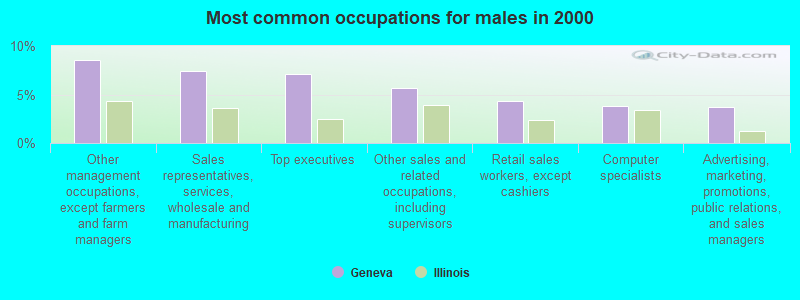
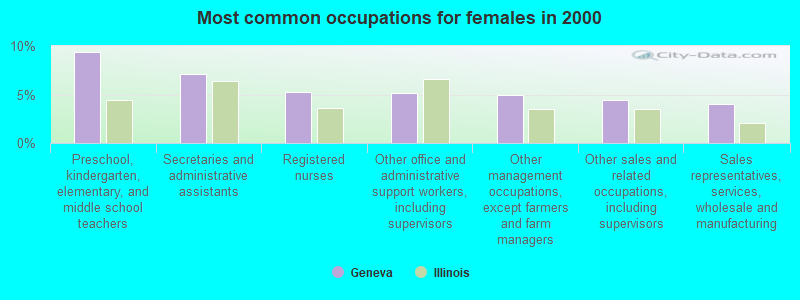
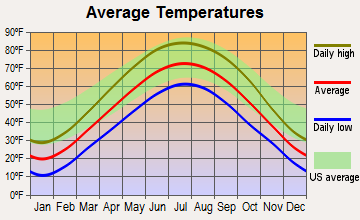
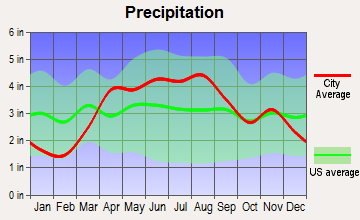
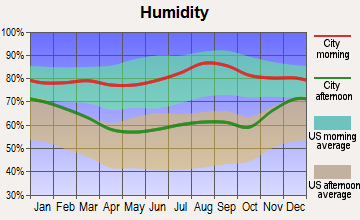
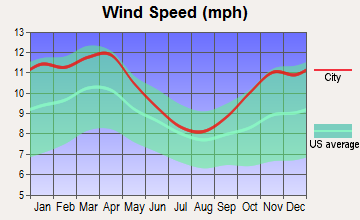
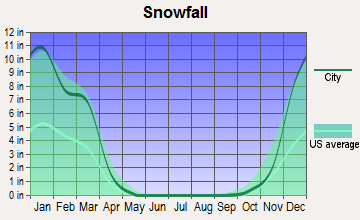
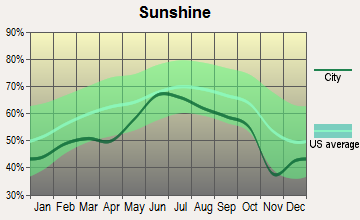
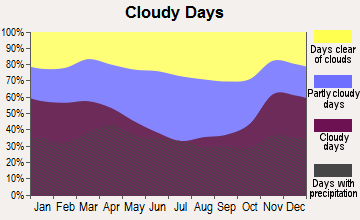


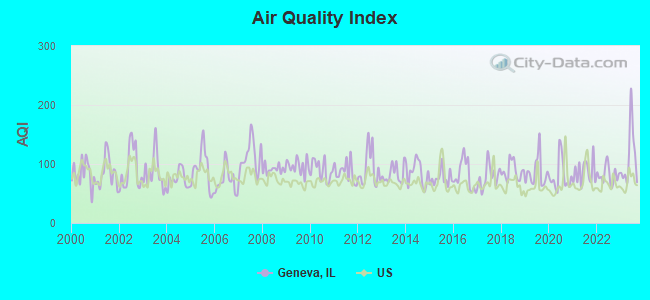
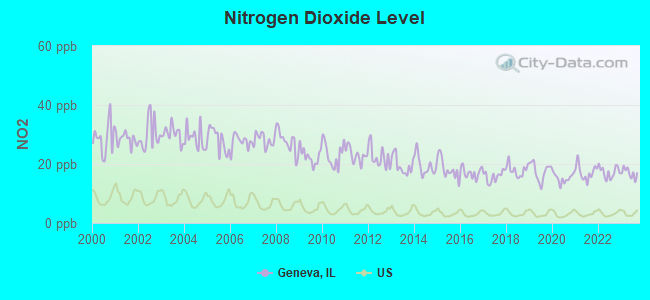
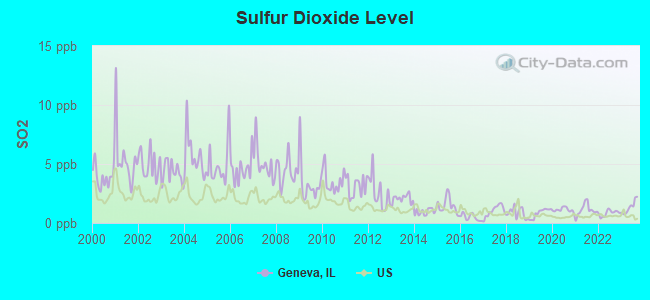
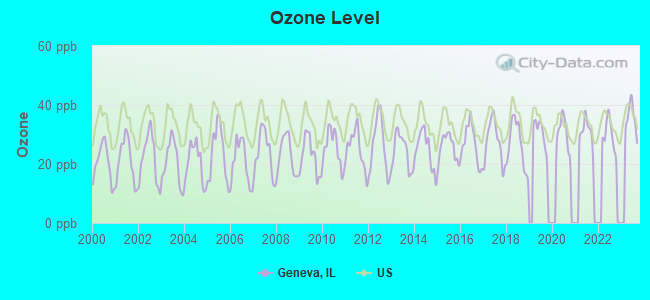
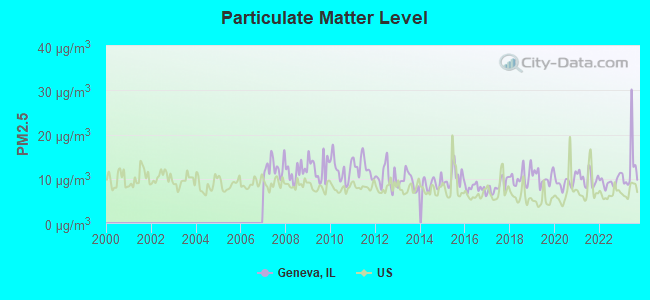
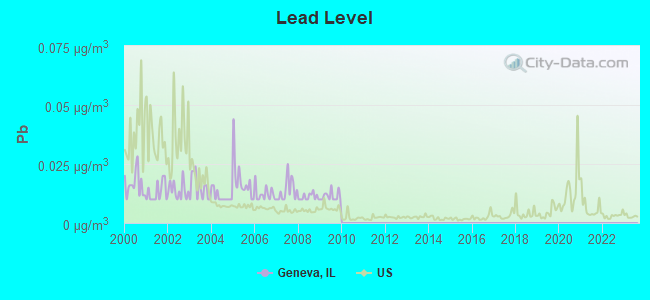

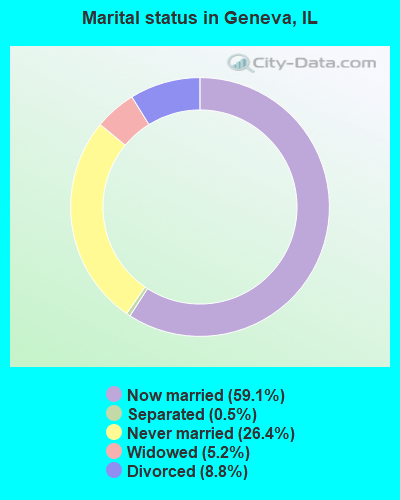
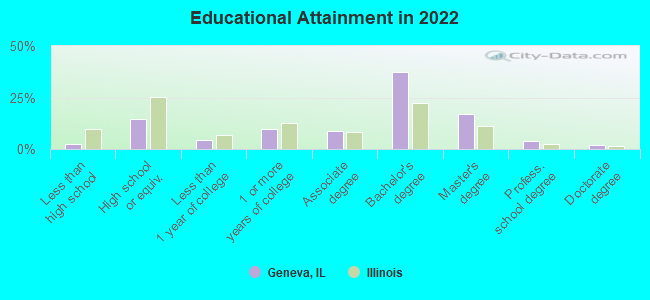
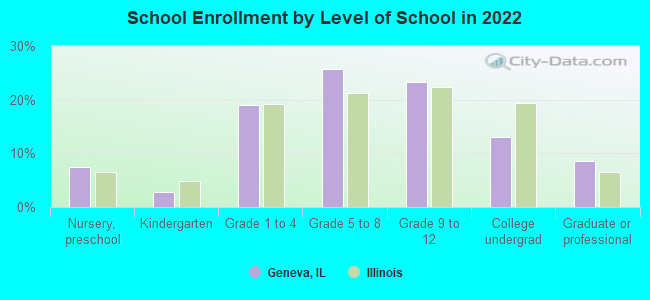
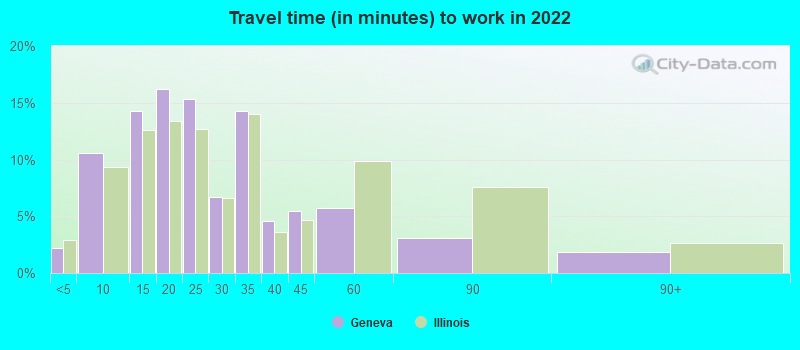
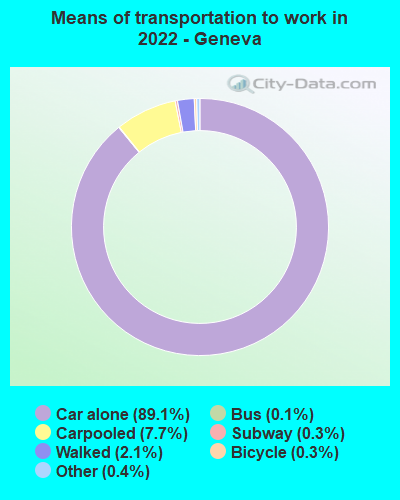
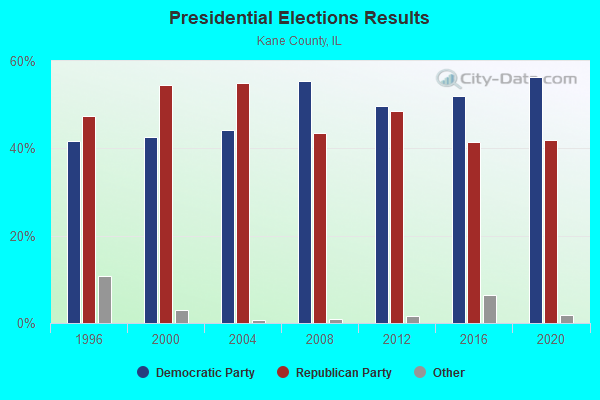
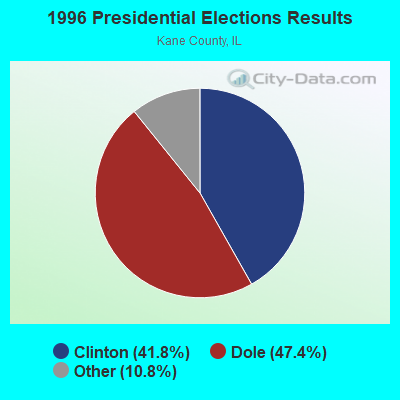
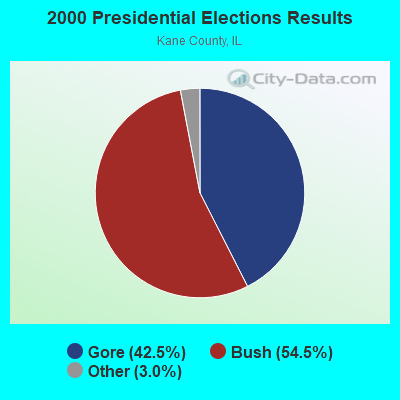
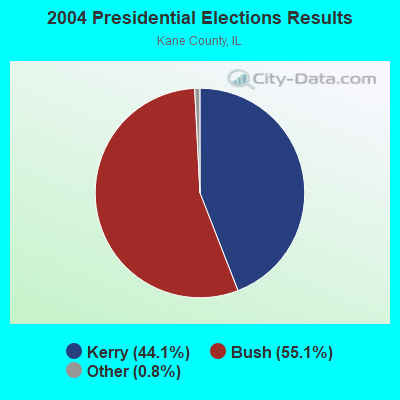
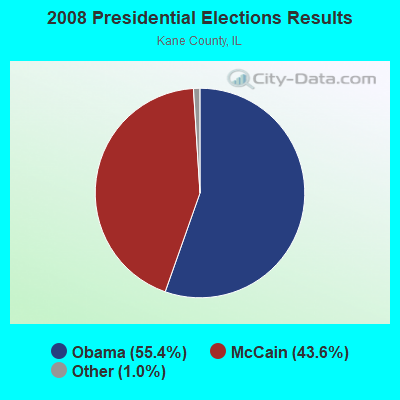
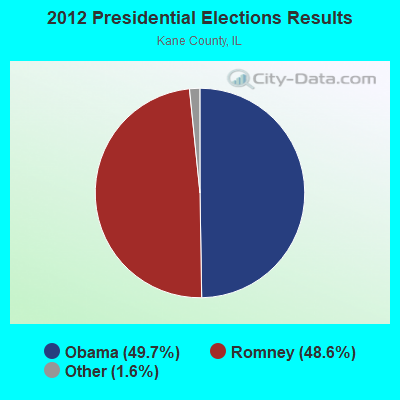
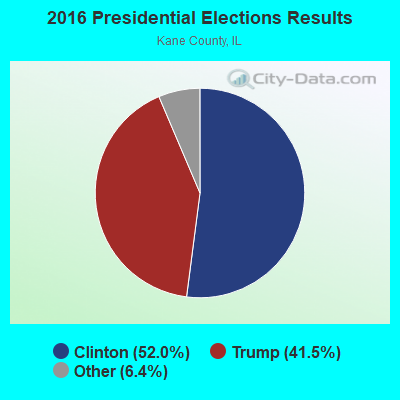
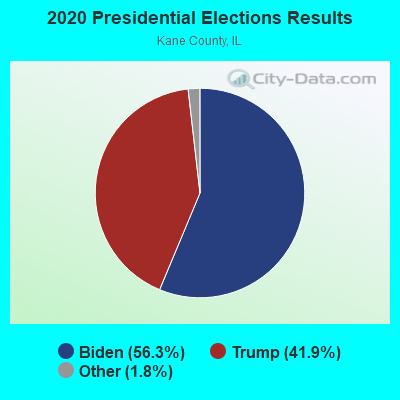
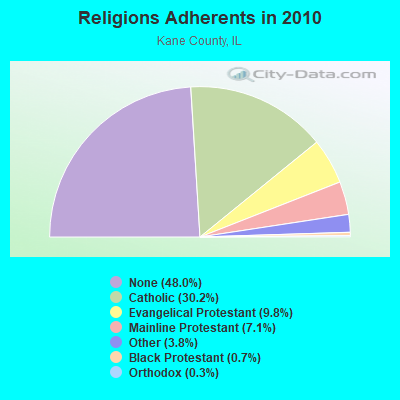
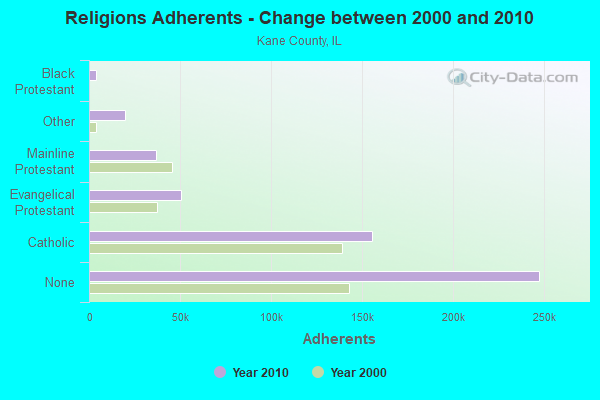
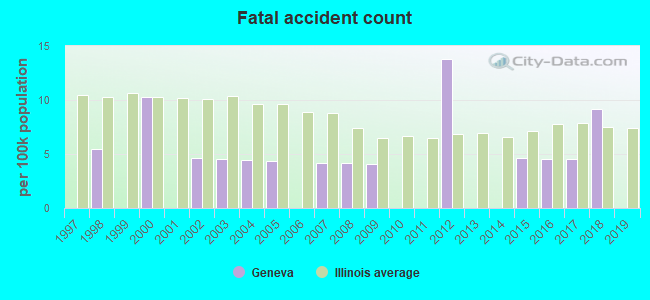
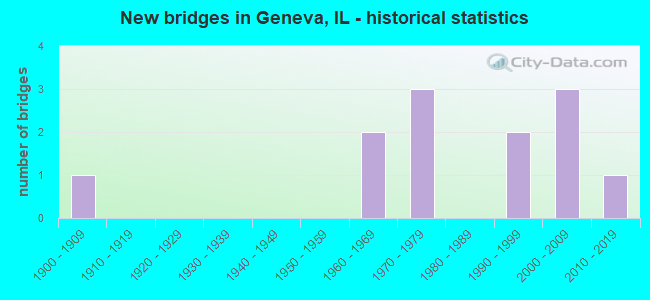
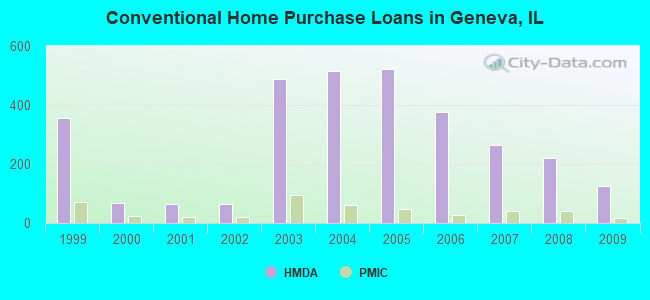
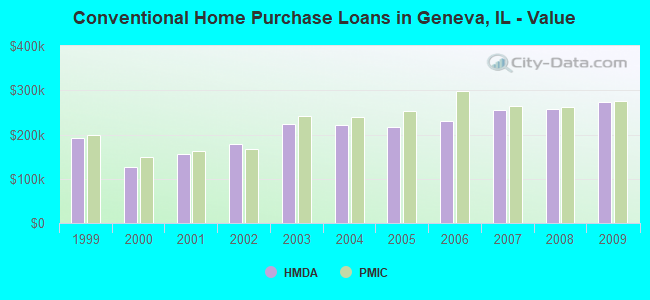
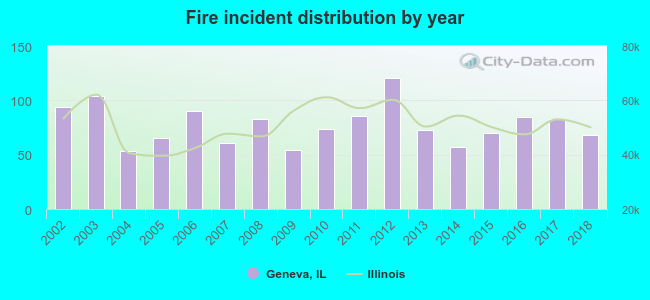 According to the data from the years 2002 - 2018 the average number of fires per year is 78. The highest number of reported fire incidents - 121 took place in 2012, and the least - 53 in 2004. The data has a dropping trend.
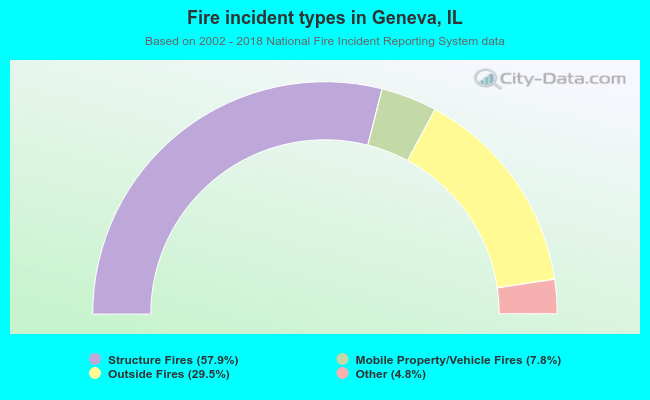 When looking into fire subcategories, the most reports belonged to: Structure Fires (57.9%), and Outside Fires (29.5%).