Aurora, Illinois
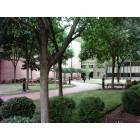
Aurora: Downtown Aurora Park
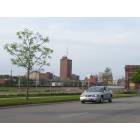
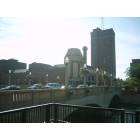
Aurora: downtown

Aurora: Prisco Community Center on banks of the Fox River Version 2

Aurora: Sunken Gardens at Phillips Park, Aurora

Aurora: tulips from the Sunken Gardens at Phillips Park, Aurora
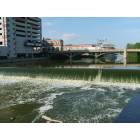
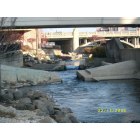
Aurora: Fox River Dam
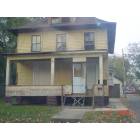
Aurora: Abandoned House on Avon St.
Aurora: New York St on the Fox River
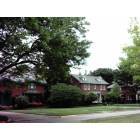
Aurora: An upscale neighborhood in Aurora
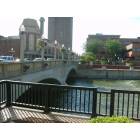
Aurora: New York St on the Fox River
Aurora: canoe chute between new york brige n galena bridge
- see
49
more - add
your
Submit your own pictures of this city and show them to the world
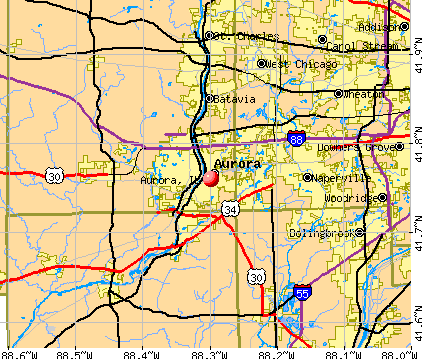
- OSM Map
- General Map
- Google Map
- MSN Map
Population change since 2000: +24.4%
| Males: 88,018 | |
| Females: 89,848 |
| Median resident age: | 35.6 years |
| Illinois median age: | 39.1 years |
Zip codes: 60502, 60503, 60504, 60505, 60506, 60510, 60519, 60538, 60542, 60543, 60554, 60563, 60564, 60585.
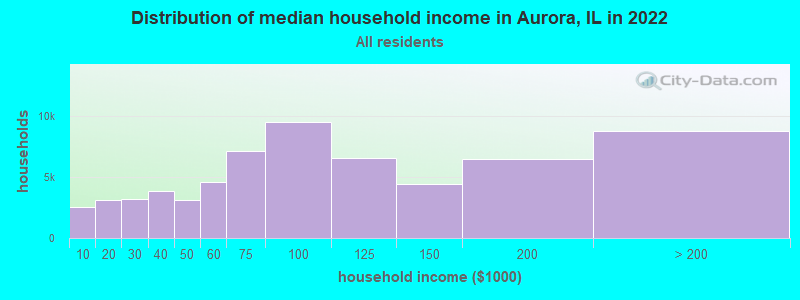
Aurora Zip Code Map| Aurora: | $84,578 |
| IL: | $76,708 |
Estimated per capita income in 2022: $39,414 (it was $22,131 in 2000)
Aurora city income, earnings, and wages data
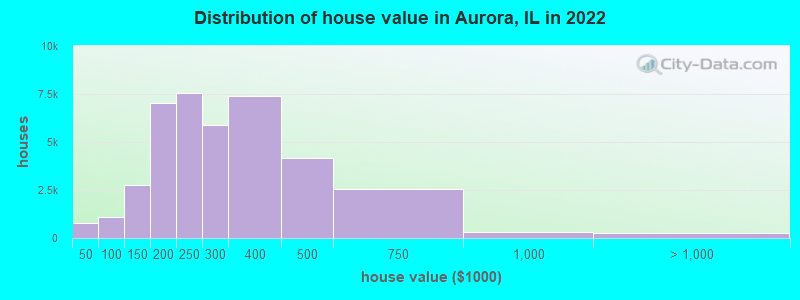
Estimated median house or condo value in 2022: $267,100 (it was $132,400 in 2000)
| Aurora: | $267,100 |
| IL: | $251,600 |
Mean prices in 2022: all housing units: $273,944; detached houses: $289,567; townhouses or other attached units: $220,840; in 2-unit structures: $218,412; in 3-to-4-unit structures: $123,779; in 5-or-more-unit structures: $141,320
Median gross rent in 2022: $1,388.
(5.6% for White Non-Hispanic residents, 13.3% for Black residents, 9.7% for Hispanic or Latino residents, 15.1% for American Indian residents, 13.6% for other race residents, 10.1% for two or more races residents)
Detailed information about poverty and poor residents in Aurora, IL

Compare current foreclosures in Aurora, IL:
| Photo | Address | Area | Beds / Baths | Price | Details |
|---|---|---|---|---|---|

|
#1
Tall Oaks Dr
Aurora, IL 60505
|
685 sq. feet
|
1 baths 1 beds |
$127,000
|
show details |

|
#2
Serendipity Dr
Aurora, IL 60504
|
- sq. feet
|
1 baths 3 beds |
$213,200
|
show details |

|
#3
N River St
Aurora, IL 60506
|
2,240 sq. feet
|
2 baths 4 beds |
show details | |

|
#4
2nd Ave
Aurora, IL 60505
|
864 sq. feet
|
1 baths 3 beds |
show details | |

|
#5
Foran Ln
Aurora, IL 60506
|
864 sq. feet
|
1 baths 3 beds |
show details | |

|
#6
Star Grass Ln
Aurora, IL 60506
|
2,607 sq. feet
|
3 baths 3 beds |
show details | |

|
#7
N May St
Aurora, IL 60506
|
822 sq. feet
|
1 baths 2 beds |
show details | |

|
#8
Laurel Dr
Aurora, IL 60506
|
1,600 sq. feet
|
2 baths 4 beds |
show details | |

|
#9
Stoughton Dr
Aurora, IL 60502
|
1,585 sq. feet
|
2 baths 2 beds |
show details | |

|
#10
Hudson Cir
Aurora, IL 60502
|
1,588 sq. feet
|
2 baths 3 beds |
show details |
| Photo | Address | Area | Beds / Baths | Price | Details |
|---|---|---|---|---|---|

|
#11
Foxmoor Ln
Aurora, IL 60502
|
1,614 sq. feet
|
2 baths 2 beds |
show details | |

|
#12
Winchester Ct W
Aurora, IL 60504
|
1,194 sq. feet
|
1 baths 3 beds |
show details | |

|
#13
Norwood Ln
Aurora, IL 60504
|
1,296 sq. feet
|
1 baths 3 beds |
show details | |

|
#14
Wilshire Ct
Aurora, IL 60502
|
890 sq. feet
|
1 baths 2 beds |
show details | |

|
#15
Ravinia Cir
Aurora, IL 60504
|
1,806 sq. feet
|
1 baths 2 beds |
show details | |

|
#16
Yorkshire Ct
Aurora, IL 60502
|
1,276 sq. feet
|
1 baths 3 beds |
show details | |

|
#17
Aspen Ln
Aurora, IL 60504
|
4,537 sq. feet
|
2 baths 4 beds |
show details | |

|
#18
Shadybrook Ln
Aurora, IL 60504
|
1,142 sq. feet
|
1 baths 2 beds |
show details | |

|
#19
Cane Garden Cir
Aurora, IL 60504
|
1,126 sq. feet
|
1 baths 2 beds |
show details | |

|
#20
Belvedere Ln
Aurora, IL 60502
|
1,698 sq. feet
|
1 baths 3 beds |
show details |
| Photo | Address | Area | Beds / Baths | Price | Details |
|---|---|---|---|---|---|

|
#21
Raintree Ct
Aurora, IL 60504
|
1,480 sq. feet
|
1 baths 3 beds |
show details | |

|
#22
Conservatory Ln
Aurora, IL 60502
|
2,019 sq. feet
|
2 baths 2 beds |
show details | |

|
#23
Cove Ct
Aurora, IL 60504
|
1,716 sq. feet
|
2 baths 3 beds |
show details | |

|
#24
Stoughton Dr
Aurora, IL 60502
|
1,534 sq. feet
|
2 baths 2 beds |
show details | |

|
#25
Norwood Ln
Aurora, IL 60504
|
1,228 sq. feet
|
1 baths 3 beds |
show details | |

|
#26
Raintree Ct
Aurora, IL 60504
|
1,480 sq. feet
|
1 baths 3 beds |
show details | |

|
#27
Long Grove Ln
Aurora, IL 60504
|
980 sq. feet
|
1 baths 2 beds |
show details | |

|
#28
Hudson Cir
Aurora, IL 60502
|
1,498 sq. feet
|
1 baths 2 beds |
show details | |

|
#29
Aspen Ln
Aurora, IL 60504
|
3,565 sq. feet
|
2 baths 4 beds |
show details | |

|
#30
Brockton Ct
Aurora, IL 60504
|
1,194 sq. feet
|
1 baths 3 beds |
show details |
| Photo | Address | Area | Beds / Baths | Price | Details |
|---|---|---|---|---|---|

|
#31
Richland Ln
Aurora, IL 60504
|
1,476 sq. feet
|
1 baths 3 beds |
show details | |

|
#32
Oakland Ln
Aurora, IL 60504
|
1,810 sq. feet
|
2 baths 4 beds |
show details | |

|
#33
Leyland Ln
Aurora, IL 60504
|
828 sq. feet
|
1 baths 2 beds |
show details | |

|
#34
Reflections Dr
Aurora, IL 60502
|
1,404 sq. feet
|
2 baths 2 beds |
show details | |

|
#35
Cerena Ct
Aurora, IL 60504
|
1,500 sq. feet
|
1 baths 3 beds |
show details | |

|
#36
Andover Dr
Aurora, IL 60504
|
1,194 sq. feet
|
1 baths 3 beds |
show details | |

|
#37
Lawrence Ct
Aurora, IL 60504
|
1,480 sq. feet
|
1 baths 3 beds |
show details | |

|
#38
Rosefield Ln
Aurora, IL 60504
|
2,116 sq. feet
|
2 baths 4 beds |
show details | |

|
#39
Camden Ln
Aurora, IL 60504
|
1,746 sq. feet
|
2 baths 4 beds |
show details | |

|
#40
Prairieview Ln
Aurora, IL 60502
|
828 sq. feet
|
1 baths 2 beds |
show details |
| Photo | Address | Area | Beds / Baths | Price | Details |
|---|---|---|---|---|---|

|
#41
Prairieview Ln S
Aurora, IL 60502
|
1,276 sq. feet
|
1 baths 3 beds |
show details | |

|
#42
Diane Dr
Aurora, IL 60504
|
1,866 sq. feet
|
2 baths 3 beds |
show details | |

|
#43
Stoughton Cir
Aurora, IL 60502
|
1,668 sq. feet
|
2 baths 3 beds |
show details | |

|
#44
Cranbrook Cir
Aurora, IL 60502
|
2,880 sq. feet
|
3 baths 4 beds |
show details | |

|
#45
Blackstone Dr
Aurora, IL 60504
|
1,456 sq. feet
|
2 baths 3 beds |
show details | |

|
#46
Ravinia Cir
Aurora, IL 60504
|
1,806 sq. feet
|
2 baths 2 beds |
show details | |

|
#47
Primrose 258
Aurora, IL 60504
|
1,102 sq. feet
|
2 baths 2 beds |
show details | |

|
#48
Tremont Ave
Aurora, IL 60502
|
1,812 sq. feet
|
2 baths 3 beds |
show details | |

|
#49
Milford Ln
Aurora, IL 60504
|
2,104 sq. feet
|
2 baths 3 beds |
show details | |

|
Check over 1 million property listings on Foreclosure.com!
|
browse all offers | |||


- 78,11142.8%Hispanic
- 57,53131.6%White alone
- 22,62212.4%Asian alone
- 15,7948.7%Black alone
- 6,5373.6%Two or more races
- 1,1330.6%Native Hawaiian and Other
Pacific Islander alone - 5730.3%Other race alone
- 350.02%American Indian alone
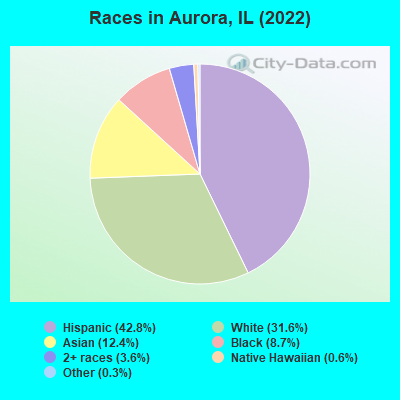
Races in Aurora detailed stats: ancestries, foreign born residents, place of birth
According to our research of Illinois and other state lists, there were 253 registered sex offenders living in Aurora, Illinois as of April 27, 2024.
The ratio of all residents to sex offenders in Aurora is 779 to 1.
The ratio of registered sex offenders to all residents in this city is near the state average.
The City-Data.com crime index weighs serious crimes and violent crimes more heavily. Higher means more crime, U.S. average is 246.1. It adjusts for the number of visitors and daily workers commuting into cities.
- means the value is smaller than the state average.- means the value is about the same as the state average.
- means the value is bigger than the state average.
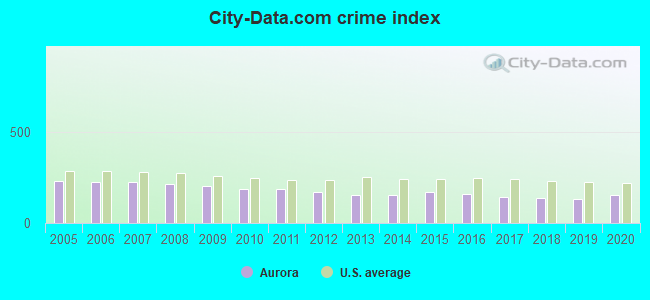
Crime rate in Aurora detailed stats: murders, rapes, robberies, assaults, burglaries, thefts, arson
Full-time law enforcement employees in 2020, including police officers: 352 (291 officers - 254 male; 37 female).
| Officers per 1,000 residents here: | 1.47 |
| Illinois average: | 3.04 |
 Recent articles from our blog. Our writers, many of them Ph.D. graduates or candidates, create easy-to-read articles on a wide variety of topics.

 | Naperville, Aurora, Bolingbrook SD 204 concerns (2 replies) |
| Mover Recommendations in Napervill, Aurora, North Aurora (0 replies) |
| Is is Aurora downtown good to invest in real estate now? (1 reply) |
| Bad parts of Aurora (9 replies) |
| Advice on 60505 Marywood Meadows aurora IL (4 replies) |
| Where could I live that's a short commute to Aurora? (25 replies) |
Latest news from Aurora, IL collected exclusively by city-data.com from local newspapers, TV, and radio stations
Ancestries: German (5.2%), Italian (2.4%), Irish (2.3%), American (2.1%), Polish (2.1%), European (1.7%).
Current Local Time: CST time zone
Incorporated on 04/08/1887
Elevation: 676 feet
Land area: 38.5 square miles.
Population density: 4,617 people per square mile (average).
46,538 residents are foreign born (15.6% Latin America, 7.6% Asia).
| This city: | 25.8% |
| Illinois: | 14.1% |
Median real estate property taxes paid for housing units with mortgages in 2022: $6,333 (2.3%)
Median real estate property taxes paid for housing units with no mortgage in 2022: $5,058 (2.1%)
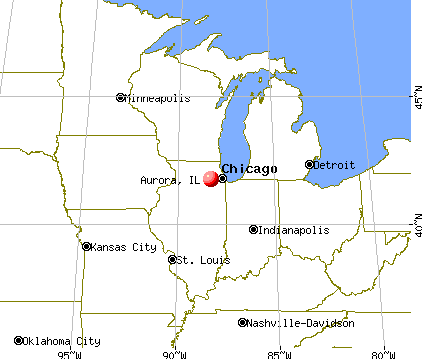
Nearest city with pop. 200,000+: Chicago, IL  (32.4 miles , pop. 2,896,016).
Nearest cities:
), ), Latitude: 41.76 N, Longitude: 88.30 W
Daytime population change due to commuting: -23,374 (-12.8%)
Workers who live and work in this city: 34,056 (35.1%)
Area code: 630
Detailed articles:
- Aurora: Introduction
- Aurora Basic Facts
- Aurora: Communications
- Aurora: Convention Facilities
- Aurora: Economy
- Aurora: Education and Research
- Aurora: Geography and Climate
- Aurora: Health Care
- Aurora: History
- Aurora: Municipal Government
- Aurora: Population Profile
- Aurora: Recreation
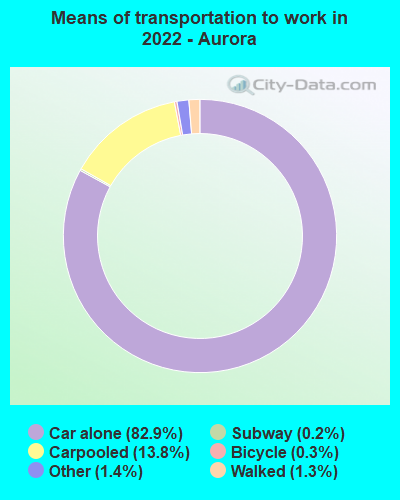
- Aurora: Transportation
Aurora tourist attractions:
Aurora, Illinois accommodation & food services, waste management - Economy and Business Data
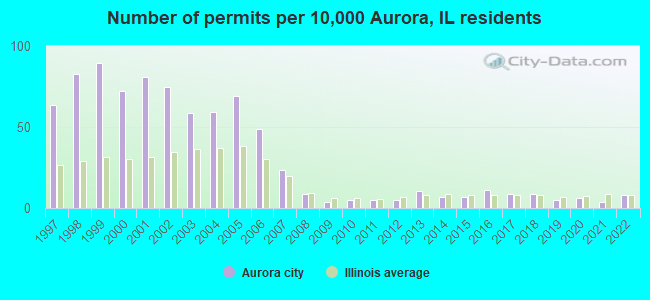
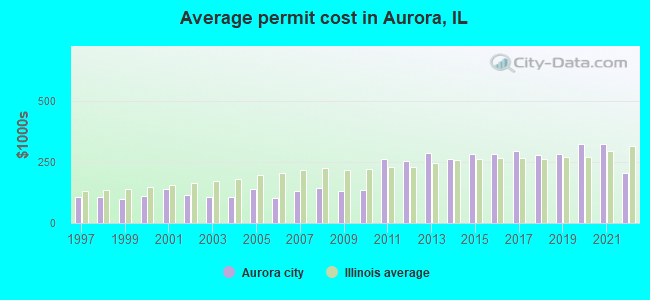
Single-family new house construction building permits:
- 2022: 113 buildings, average cost: $205,500
- 2021: 55 buildings, average cost: $322,000
- 2020: 91 buildings, average cost: $322,000
- 2019: 72 buildings, average cost: $281,500
- 2018: 121 buildings, average cost: $278,100
- 2017: 127 buildings, average cost: $295,500
- 2016: 155 buildings, average cost: $282,900
- 2015: 95 buildings, average cost: $284,000
- 2014: 101 buildings, average cost: $260,200
- 2013: 154 buildings, average cost: $284,500
- 2012: 74 buildings, average cost: $252,100
- 2011: 67 buildings, average cost: $261,000
- 2010: 71 buildings, average cost: $136,000
- 2009: 49 buildings, average cost: $129,500
- 2008: 127 buildings, average cost: $143,000
- 2007: 338 buildings, average cost: $130,100
- 2006: 696 buildings, average cost: $102,600
- 2005: 989 buildings, average cost: $137,800
- 2004: 843 buildings, average cost: $105,900
- 2003: 836 buildings, average cost: $106,900
- 2002: 1067 buildings, average cost: $112,900
- 2001: 1156 buildings, average cost: $137,900
- 2000: 1030 buildings, average cost: $109,800
- 1999: 1284 buildings, average cost: $97,800
- 1998: 1183 buildings, average cost: $107,800
- 1997: 908 buildings, average cost: $106,800
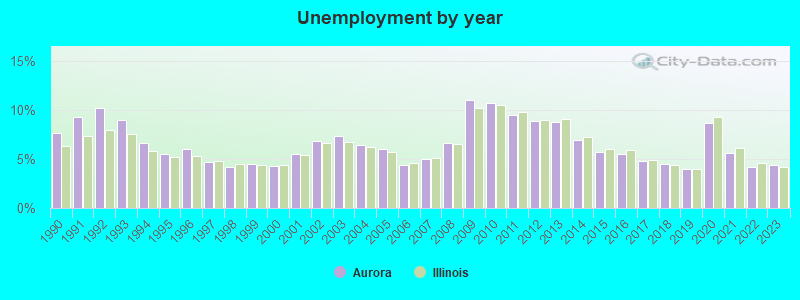
| Here: | 4.4% |
| Illinois: | 4.2% |
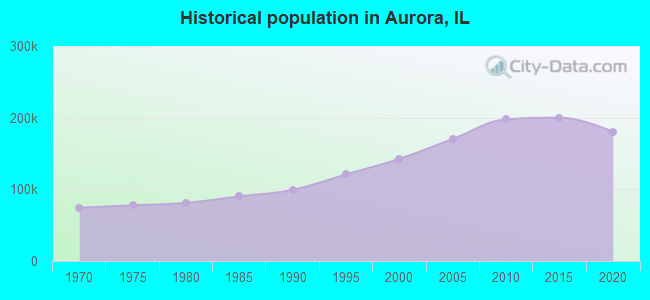

Population change in the 1990s: +42,004 (+41.6%).
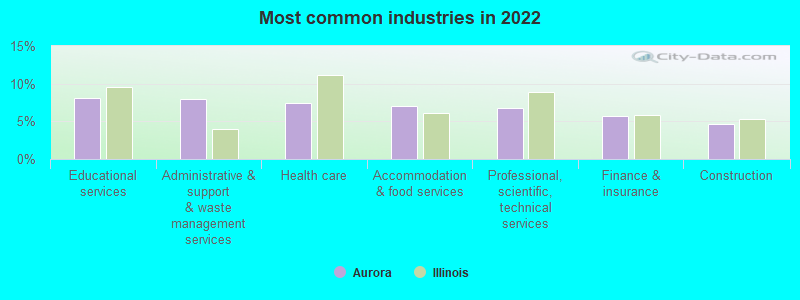
- Educational services (8.1%)
- Administrative & support & waste management services (8.0%)
- Health care (7.4%)
- Accommodation & food services (7.0%)
- Professional, scientific, technical services (6.7%)
- Finance & insurance (5.6%)
- Construction (4.6%)
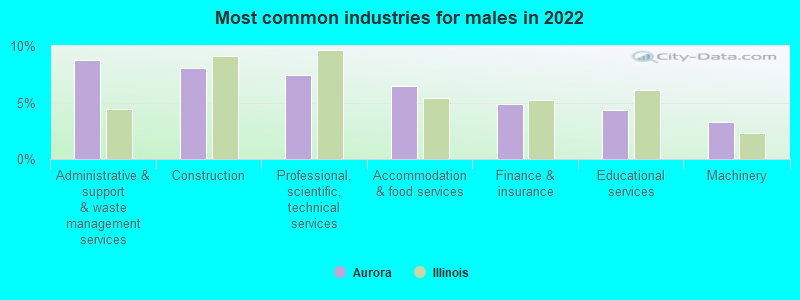
- Administrative & support & waste management services (8.7%)
- Construction (8.0%)
- Professional, scientific, technical services (7.5%)
- Accommodation & food services (6.4%)
- Finance & insurance (4.9%)
- Educational services (4.4%)
- Machinery (3.3%)
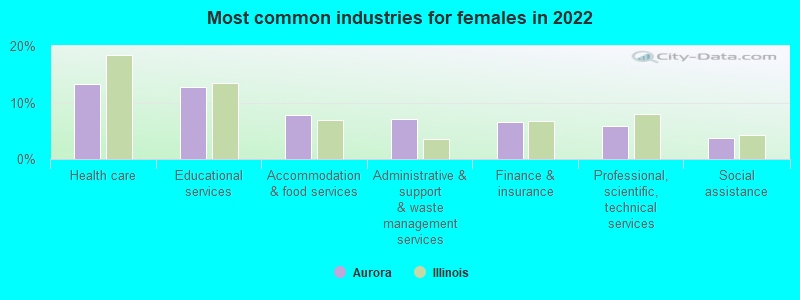
- Health care (13.3%)
- Educational services (12.7%)
- Accommodation & food services (7.7%)
- Administrative & support & waste management services (7.1%)
- Finance & insurance (6.6%)
- Professional, scientific, technical services (5.8%)
- Social assistance (3.8%)
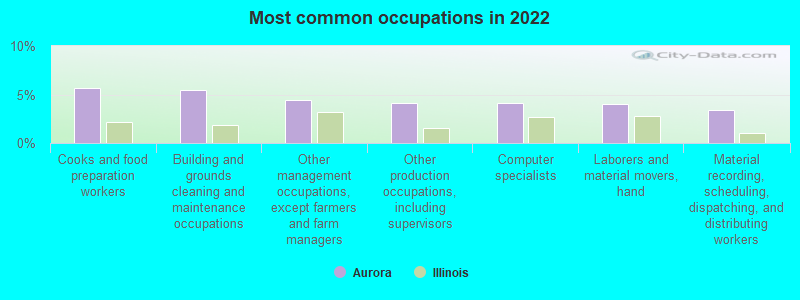
- Cooks and food preparation workers (5.7%)
- Building and grounds cleaning and maintenance occupations (5.4%)
- Other management occupations, except farmers and farm managers (4.4%)
- Other production occupations, including supervisors (4.2%)
- Computer specialists (4.1%)
- Laborers and material movers, hand (4.0%)
- Material recording, scheduling, dispatching, and distributing workers (3.4%)
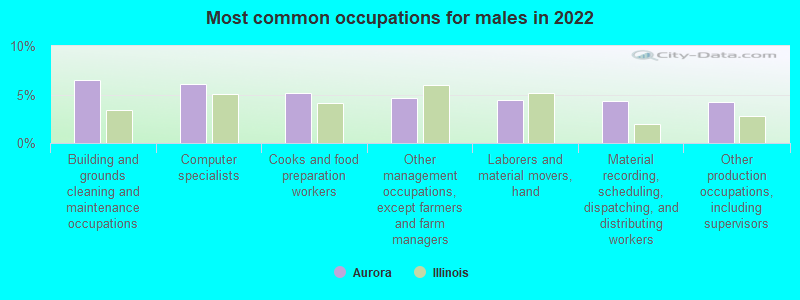
- Building and grounds cleaning and maintenance occupations (6.5%)
- Computer specialists (6.1%)
- Cooks and food preparation workers (5.2%)
- Other management occupations, except farmers and farm managers (4.6%)
- Laborers and material movers, hand (4.4%)
- Material recording, scheduling, dispatching, and distributing workers (4.3%)
- Other production occupations, including supervisors (4.3%)
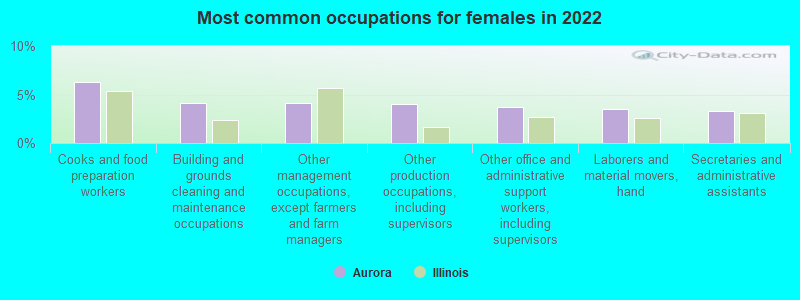
- Cooks and food preparation workers (6.2%)
- Building and grounds cleaning and maintenance occupations (4.2%)
- Other management occupations, except farmers and farm managers (4.1%)
- Other production occupations, including supervisors (4.0%)
- Other office and administrative support workers, including supervisors (3.7%)
- Laborers and material movers, hand (3.5%)
- Secretaries and administrative assistants (3.3%)
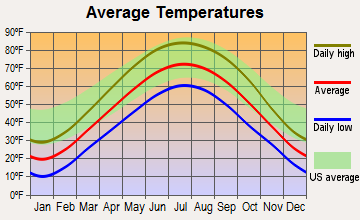
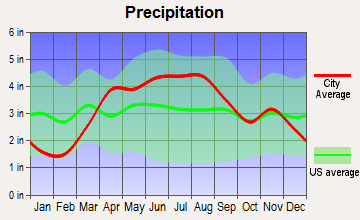
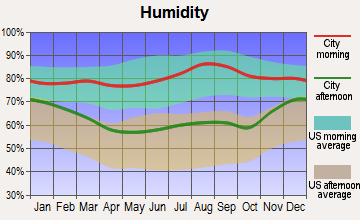
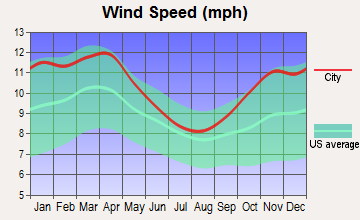
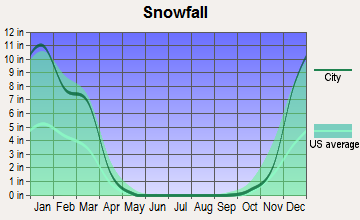
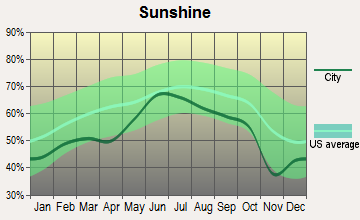
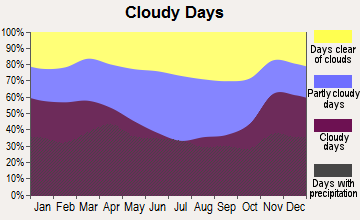
Average climate in Aurora, Illinois
Based on data reported by over 4,000 weather stations
|
|

(lower is better)
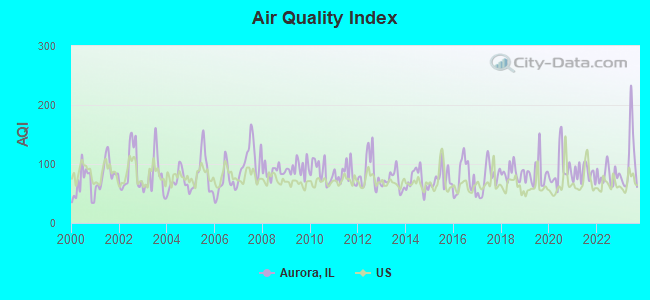
Air Quality Index (AQI) level in 2023 was 104. This is significantly worse than average.
| City: | 104 |
| U.S.: | 73 |
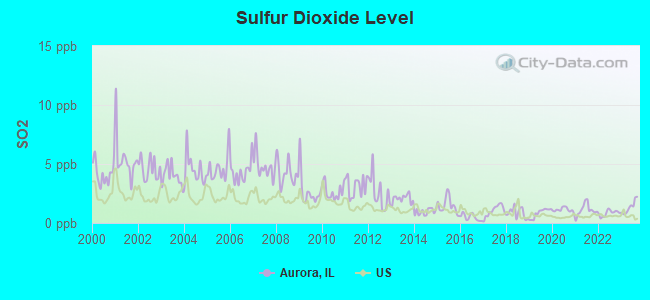
Sulfur Dioxide (SO2) [ppb] level in 2023 was 1.34. This is about average. Closest monitor was 12.0 miles away from the city center.
| City: | 1.34 |
| U.S.: | 1.51 |
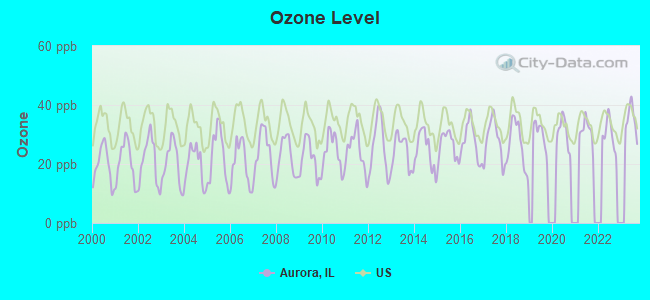
Ozone [ppb] level in 2023 was 35.1. This is about average. Closest monitor was 3.0 miles away from the city center.
| City: | 35.1 |
| U.S.: | 33.3 |
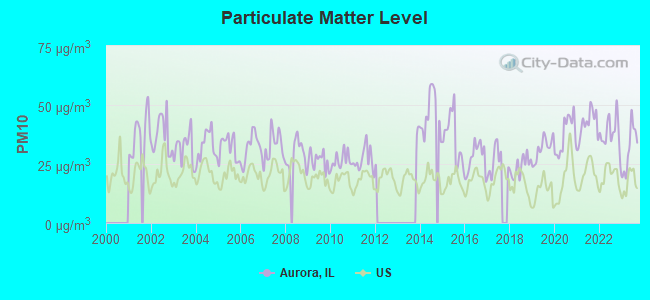
Particulate Matter (PM10) [µg/m3] level in 2023 was 31.4. This is significantly worse than average. Closest monitor was 7.6 miles away from the city center.
| City: | 31.4 |
| U.S.: | 19.2 |
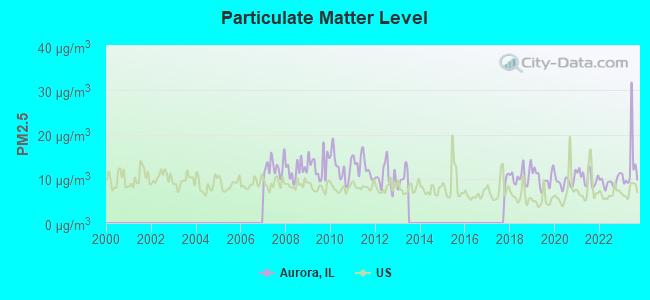
Particulate Matter (PM2.5) [µg/m3] level in 2023 was 12.8. This is significantly worse than average. Closest monitor was 2.3 miles away from the city center.
| City: | 12.8 |
| U.S.: | 8.1 |
Tornado activity:
Aurora-area historical tornado activity is near Illinois state average. It is 53% greater than the overall U.S. average.
On 8/28/1990, a category F5 (max. wind speeds 261-318 mph) tornado 6.1 miles away from the Aurora city center killed 29 people and injured 350 people and caused between $50,000 and $500,000 in damages.
On 6/13/1976, a category F4 (max. wind speeds 207-260 mph) tornado 16.6 miles away from the city center killed 2 people and injured 23 people and caused between $500,000 and $5,000,000 in damages.
Earthquake activity:
Aurora-area historical earthquake activity is significantly above Illinois state average. It is 54% greater than the overall U.S. average.On 4/18/2008 at 09:36:59, a magnitude 5.4 (5.1 MB, 4.8 MS, 5.4 MW, 5.2 MW, Class: Moderate, Intensity: VI - VII) earthquake occurred 229.8 miles away from the city center
On 6/10/1987 at 23:48:54, a magnitude 5.1 (4.9 MB, 4.4 MS, 4.6 MS, 5.1 LG) earthquake occurred 204.4 miles away from Aurora center
On 4/18/2008 at 09:36:59, a magnitude 5.2 (5.2 MW, Depth: 8.9 mi) earthquake occurred 229.9 miles away from the city center
On 6/28/2004 at 06:10:52, a magnitude 4.2 (4.2 MW, Depth: 6.2 mi, Class: Light, Intensity: IV - V) earthquake occurred 37.4 miles away from Aurora center
On 2/10/2010 at 09:59:35, a magnitude 3.8 (3.8 MW, Depth: 6.2 mi, Class: Light, Intensity: II - III) earthquake occurred 17.7 miles away from the city center
On 6/18/2002 at 17:37:15, a magnitude 5.0 (4.3 MB, 4.6 MW, 5.0 LG) earthquake occurred 262.4 miles away from Aurora center
Magnitude types: regional Lg-wave magnitude (LG), body-wave magnitude (MB), surface-wave magnitude (MS), moment magnitude (MW)
Natural disasters:
The number of natural disasters in Kane County (15) is near the US average (15).Major Disasters (Presidential) Declared: 10
Emergencies Declared: 4
Causes of natural disasters: Floods: 7, Storms: 7, Snowstorms: 2, Tornadoes: 2, Winter Storms: 2, Blizzard: 1, Hurricane: 1, Snow: 1, Wind: 1, Other: 1 (Note: some incidents may be assigned to more than one category).
Main business address for: OLD SECOND BANCORP INC (STATE COMMERCIAL BANKS), WESTELL TECHNOLOGIES INC (TELEPHONE & TELEGRAPH APPARATUS), CABOT MICROELECTRONICS CORP (SEMICONDUCTORS & RELATED DEVICES).
Hospitals in Aurora:
- BETHESDA LUTHERAN-AURORA (1480 RECKINGER ROAD)
- BETHESDA LUTHERAN-MONTGOMERY (1205 SOUTH SPENCER)
- COPLEY MEMORIAL HOSPITAL (Voluntary non-profit - Private, 2000 OGDEN AVENUE)
- PRESENCE MERCY MEDICAL CENTER (Voluntary non-profit - Church, 1325 N HIGHLAND AVENUE)
- TAC HOUSE (421 CONSTITUTION DRIVE)
Nursing Homes in Aurora:
- ALDEN OF WATERFORD (2021 RANDI DRIVE)
- AURORA MANOR (1601 N FARNSWORTH)
- AURORA REHAB AND LIVING CENTER (1601 NORTH FARNSWORTH AVENUE)
- COUNTRYSIDE CARE CENTRE (2330 WEST GALENA BOULEVARD)
- ELMWOOD TERRACE HEALTHCARE CTR (1017 WEST GALENA BOULEVARD)
- FOX RIVER PAVILION (400 EAST NEW YORK STREET)
- JENNINGS TERRACE (275 SOUTH LASALLE)
- PARKVIEW EAST (400 E NEW YORK ST)
- PROVENA MCAULEY MANOR (400 WEST SULLIVAN ROAD)
- RUSH-COPLEY MEDICAL CENTER (2000 OGDEN AVENUE)
Dialysis Facilities in Aurora:
Home Health Centers in Aurora:
Airports and heliports located in Aurora:
- Aurora Municipal Airport (ARR) (Runways: 3, Air Taxi Ops: 580, Itinerant Ops: 39,970, Local Ops: 34,368, Military Ops: 410)
- Provena Mercy Medical Center Heliport (IL21)
- Rush-Copley Medical Center Heliport (7IS8)
Amtrak stations near Aurora:
- 9 miles: NAPERVILLE (E. 4TH & ELLSWORTH AVE.) . Services: ticket office, partially wheelchair accessible, enclosed waiting area, public restrooms, public payphones, free short-term parking, free long-term parking, call for taxi service, public transit connection.
- 15 miles: PLANO (MAIN ST. WEST OF CENTER ST.)
- 20 miles: JOLIET (50 E. JEFFERSON ST.) . Services: ticket office, partially wheelchair accessible, enclosed waiting area, public restrooms, public payphones, vending machines, paid short-term parking, paid long-term parking, public transit connection.
Colleges/Universities in Aurora:
Other colleges/universities with over 2000 students near Aurora:
- North Central College (about 9 miles; Naperville, IL; Full-time enrollment: 2,860)
- Waubonsee Community College (about 9 miles; Sugar Grove, IL; FT enrollment: 7,698)
- Benedictine University (about 11 miles; Lisle, IL; FT enrollment: 5,694)
- Wheaton College (about 13 miles; Wheaton, IL; FT enrollment: 2,948)
- College of DuPage (about 13 miles; Glen Ellyn, IL; FT enrollment: 18,910)
- Lewis University (about 16 miles; Romeoville, IL; FT enrollment: 5,739)
- Universal Technical Institute of Illinois Inc (about 17 miles; Glendale Heights, IL; FT enrollment: 2,281)
Biggest public high schools in Aurora:
- WAUBONSIE VALLEY HIGH SCHOOL (Students: 3,694, Location: 2590 OGDEN AVE, Grades: 9-12)
- WEST AURORA HIGH SCHOOL (Students: 3,312, Location: 1201 W NEW YORK ST, Grades: 9-12)
- EAST HIGH SCHOOL (Students: 2,816, Location: 500 TOMCAT LN, Grades: 9-12)
- IL MATHEMATICS & SCIENCE ACADEMY (Students: 639, Location: 1500 SULLIVAN RD, Grades: 10-12)
- HOPE D WALL TMH CHILD DEV CTR (Students: 190, Location: 449 NEW INDIAN TRL CT, Grades: PK-12)
- INDIAN PLAINS ALTERNATIVE SCHOOL (Students: 62, Location: 1322 N EOLA RD, Grades: 7-12)
- EAST AURORA HS RSSP (Location: 500 TOMCAT LN, Grades: 9-12)
- WEST AURORA HS RSSP (Location: 1201 W NEW YORK ST, Grades: 9-12)
- SUCCESS ACADEMY (Location: 1720 N RANDALL RD, Grades: 6-12)
- METEA VALLEY HIGH SCHOOL (Location: 1801 N EOLA RD, Grades: 9-12)
Private high schools in Aurora:
- AURORA CHRISTIAN SCHOOLS (Students: 628, Location: 2255 SULLIVAN RD, Grades: PK-12)
- AURORA CENTRAL CATHOLIC HIGH SCHOOL (Students: 561, Location: 1255 N EDGELAWN DR, Grades: 9-12)
- MARMION ACADEMY (Students: 513, Location: 1000 BUTTERFIELD RD, Grades: 9-12, Boys only)
- ROSARY HIGH SCHOOL (Students: 427, Location: 901 N EDGELAWN DR, Grades: 9-12, Girls only)
Biggest public elementary/middle schools in Aurora:
- FRANCIS GRANGER MIDDLE SCHOOL (Students: 1,178, Location: 2721 STONEBRIDGE BLVD, Grades: 6-8)
- STILL MIDDLE SCHOOL (Students: 1,150, Location: 787 MEADOWRIDGE DR, Grades: 6-8)
- C M BARDWELL ELEM SCHOOL (Students: 1,032, Location: 550 S LINCOLN AVE, Grades: PK-5)
- K D WALDO MIDDLE SCHOOL (Students: 982, Location: 56 JACKSON ST, Grades: 6-8)
- C F SIMMONS MIDDLE SCHOOL (Students: 960, Location: 1130 SHEFFER RD, Grades: 6-8)
- HENRY W COWHERD MIDDLE SCHOOL (Students: 924, Location: 441 N FARNSWORTH AVE, Grades: 6-8)
- NICHOLAS A HERMES ELEM SCHOOL (Students: 887, Location: 1000 JUNGLES AVE, Grades: PK-5)
- OLNEY C ALLEN ELEM SCHOOL (Students: 886, Location: 700 S FARNSWORTH AVE, Grades: PK-5)
- JEFFERSON MIDDLE SCHOOL (Students: 784, Location: 1151 PLUM ST, Grades: 6-8)
- BEDNARCIK JUNIOR HIGH SCHOOL (Students: 758, Location: 3025 HEGGS RD, Grades: 6-8)
Biggest private elementary/middle schools in Aurora:
- HOLY ANGELS CATHOLIC SCHOOL (Students: 522, Location: 720 KENSINGTON PL, Grades: PK-8)
- OUR LADY OF GOOD COUNSEL SCHOOL (Students: 255, Location: 601 TALMA ST, Grades: PK-8)
- ST RITA OF CASCIA SCHOOL (Students: 243, Location: 770 OLD INDIAN TRL, Grades: PK-8)
- ST JOSEPH CATHOLIC SCHOOL (Students: 202, Location: 706 HIGH ST, Grades: PK-8)
- ST PETER SCHOOL (Students: 142, Location: 915 SARD AVE, Grades: KG-8)
- ST PAULS LUTHERAN SCHOOL (Students: 136, Location: 85 S CONSTITUTION DR, Grades: PK-8)
- FOX VALLEY MONTESSORI SCHOOL (Students: 104, Location: 850 N COMMONWEALTH AVE, Grades: PK-4)
- COVENANT CHRISTIAN SCHOOL (Students: 100, Location: 10 N EDGELAWN DR, Grades: PK-8)
- ST THERESE OF JESUS SCHOOL (Students: 69, Location: 255 N FARNSWORTH AVE, Grades: PK-8)
- RESURRECTION LUTHERAN SCHOOL (Students: 68, Location: 2567 W SULLIVAN RD, Grades: UG-8)
Library in Aurora:
- AURORA PUBLIC LIBRARY (Operating income: $10,161,162; Location: 1 EAST BENTON STREET; 441,903 books; 52,166 audio materials; 22,206 video materials; 27 local licensed databases; 15 state licensed databases; 2 other licensed databases; 878 print serial subscriptions; 5 electronic serial subscriptions)
User-submitted facts and corrections:
- Birthplace of: Tim Mahoney - U.S. Representative (Florida's 16th District, born: August 15, 1956)
- There is now a zip code of 60502 in Aurora! We are growing!!
- Aurora is also in Dupage and Kendall counties as well as Kane which you have listed.
Points of interest:
Notable locations in Aurora: Bowman Corporate Center (A), Landmark Industrial Park (B), Phillips Park Golf Course (C), Aurora Country Club (D), Aurora Public Library (E), Aurora Fire Department Station 3 (F), Aurora Fire Department Station 4 (G), Aurora Fire Department Station 5 (H), Aurora Fire Department Station 7 (I), Aurora Fire Department Station 8 (J), Aurora Fire Department Station 10 (K), Aurora Fire Department Station 9 (L), Aurora Fire Department Station 12 (M), First Care Health Services (N), Alumni Hall (O), Charles B Phillips Library (P), Davis Hall (Q), Dunham Hall (R), Eckhart Hall (S), Jenks Hall (T). Display/hide their locations on the map
Shopping Centers: Village Mart Shopping Center (1), Randall Plaza Shopping Center (2), Fox Valley Mall (3), Indian Trail Shopping Center (4), Indian Trail Court Shopping Center (5), Northgate Shopping Center (6), Yorkshire Shopping Center (7), West Aurora Plaza Shopping Center (8). Display/hide their locations on the map
Main business address in Aurora include: OLD SECOND BANCORP INC (A), WESTELL TECHNOLOGIES INC (B), CABOT MICROELECTRONICS CORP (C). Display/hide their locations on the map
Churches in Aurora include: Bethany of Fox Valley United Methodist Church (A), Butterfield Community Church (B), Claim Street Baptist Church (C), Emmanuel Evangelical Lutheran Church (D), First Baptist Church (E), First Presbyterian Church of Aurora (F), Fourth Street United Methodist Church (G), Grace Lutheran Church (H), Holy Angels Roman Catholic Church (I). Display/hide their locations on the map
Cemeteries: West Aurora Cemetery (1), Mount Olivet Catholic Cemetery (2), Marmion Academy Cemetery (3), Marywood Catholic Cemetery (4), Big Woods Cemetery (5), Saint Joseph Catholic Cemetery (6), Saint Michael Cemetery (7). Display/hide their locations on the map
Lakes and reservoirs: Mastodon Lake (A), Willow Lake (B), Spring Lake (C), Foxcroft Lake (D). Display/hide their locations on the map
Streams, rivers, and creeks: East Run (A). Display/hide its location on the map
Parks in Aurora include: Phillips Park (1), Pigeon Hill Park (2), Clearwood Park (3), Randall Park (4), Waubonsie Lake Park (5), Wheatland Park (6), Prairie Path Woodland Swamp County Forest Preserve (7), Blackberry Farms Historic Site (8), Culver Forest Preserve (9). Display/hide their locations on the map
Tourist attractions: Aurora Historical Society (Museums; 305 Cedar Street) (1), Aurora Regional Fire Museum (53 North Broadway) (2), Grand Army of the Republic Memo & Vtrn's Mltry MSM (Cultural Attractions- Events- & Facilities; 23 East Downer Place) (3), Enchanted Castle (Amusement & Theme Parks; 4034 Fox Valley Drive) (4), Aurora Roller Skate Center (Amusement & Theme Parks; 34W113 Montgomery Road) (5), Grand Productions (Tours & Charters; 2051 Constitution Court) (6). Display/hide their approximate locations on the map
Hotels: Comfort Suites Aurora (111 North Broadway) (1), Galena Hotel (116 West Galena Boulevard) (2), Comfort Inn (4005 Gabrielle Dr) (3), Hampton Inn & Suites Chicago (2423 Bushwood Drive) (4), Comfort Suites (111 N Broadway) (5), Hansen's Motel (1057 E Benton St) (6), Fox River Hotel (306 North River Street) (7), Comfort Inn Aurora (4005 Gabrielle Lane) (8), Fox Valley Inn (2450 N Farnsworth Ave) (9). Display/hide their approximate locations on the map
Court: Kane County Government - Court Services Dept- Adult Court Services (122 West Downer Place) (1). Display/hide its approximate location on the map
Birthplace of: Phillip E. Johnson - Non-fiction writer, Clive Cussler - Novelist, Dennis Hastert - Politician, Chick Hearn - Basketball sportscaster, Andrea Evans - Actress, Tim Mahoney - Politician, Mark Catlin, Sr. - Politician, Chris Lauzen - Politician, Andy Gustafson - College football coach, Anna Meyer - Baseball player.
Drinking water stations with addresses in Aurora and their reported violations in the past:
RUDYS PLACE - LA MINA (Address: 900 HILL AVENUE , Population served: 140, Groundwater):Past monitoring violations:RED OAK NATURE CENTER (Population served: 40, Groundwater):
- 2 regular monitoring violations
Past health violations:Past monitoring violations:
- MCL, Monthly (TCR) - Between JAN-2006 and DEC-2006, Contaminant: Coliform. Follow-up actions: St Violation/Reminder Notice (JUN-13-2006), St Site Visit (enforcement) (AUG-01-2006), St Compliance achieved (AUG-23-2006)
- Monitoring, Repeat Major (TCR) - Between JAN-2009 and DEC-2009, Contaminant: Coliform (TCR). Follow-up actions: St Violation/Reminder Notice (NOV-05-2009), St Compliance achieved (MAR-08-2010)
- Monitoring, Repeat Major (TCR) - Between JAN-2008 and DEC-2008, Contaminant: Coliform (TCR). Follow-up actions: St Violation/Reminder Notice (JAN-02-2009)
- Monitoring, Repeat Major (TCR) - Between JAN-2006 and DEC-2006, Contaminant: Coliform (TCR). Follow-up actions: St Site Visit (enforcement) (JUL-10-2006), St Compliance achieved (JUL-13-2006)
- One regular monitoring violation
Drinking water stations with addresses in Aurora that have no violations reported:
- AURORA (Address: 44 E DOWNER PLACE , Population served: 199,000, Primary Water Source Type: Surface water)
- AURORA COMMUNITY WATER ASSN (Population served: 150, Primary Water Source Type: Groundwater)
- MARK HALL (Population served: 150, Primary Water Source Type: Groundwater)
- SUPERMERCADO LA CHIQUITA (Address: 651 E ASHLAND AVENUE , Population served: 96, Primary Water Source Type: Purch groundwater)
| This city: | 3.1 people |
| Illinois: | 2.6 people |
| This city: | 74.2% |
| Whole state: | 65.8% |
| This city: | 7.4% |
| Whole state: | 6.3% |
Likely homosexual households (counted as self-reported same-sex unmarried-partner households)
- Lesbian couples: 0.4% of all households
- Gay men: 0.4% of all households
People in group quarters in Aurora in 2010:
- 666 people in workers' group living quarters and job corps centers
- 577 people in nursing facilities/skilled-nursing facilities
- 528 people in college/university student housing
- 315 people in emergency and transitional shelters (with sleeping facilities) for people experiencing homelessness
- 123 people in correctional residential facilities
- 95 people in residential treatment centers for adults
- 64 people in other noninstitutional facilities
- 58 people in group homes intended for adults
- 51 people in correctional facilities intended for juveniles
People in group quarters in Aurora in 2000:
- 824 people in nursing homes
- 293 people in college dormitories (includes college quarters off campus)
- 192 people in other noninstitutional group quarters
- 127 people in state prisons
- 121 people in homes or halfway houses for drug/alcohol abuse
- 110 people in religious group quarters
- 62 people in homes for the mentally retarded
- 61 people in other nonhousehold living situations
- 45 people in mental (psychiatric) hospitals or wards
- 35 people in homes for the mentally ill
- 19 people in halfway houses
Banks with most branches in Aurora (2011 data):
- JPMorgan Chase Bank, National Association: West Aurora Banking Center Branch, Aurora Fox Valley Commerical Branch, Fox Valley Branch, Eola & Indian Trail Banking Center, Aurora Dominicks, Aurora Farnsworth Bkg. Ctr. Branch. Info updated 2011/11/10: Bank assets: $1,811,678.0 mil, Deposits: $1,190,738.0 mil, headquarters in Columbus, OH, positive income, International Specialization, 5577 total offices, Holding Company: Jpmorgan Chase & Co.
- Old Second National Bank: Orchard Branch, West Aurora-Redwood Drive Branch, Fox Valley Center Branch, at 37-39 South River Street, Farnsworth Branch. Info updated 2008/03/03: Bank assets: $1,939.3 mil, Deposits: $1,741.1 mil, local headquarters, positive income, Commercial Lending Specialization, 27 total offices, Holding Company: Old Second Bancorp, Inc.
- BMO Harris Bank National Association: North Lake Branch, Harris Bank Aurora Branch, Harris Bk Aurora Na Branch, Aurora-Farnsworth Avenue Branch, Eola Branch. Info updated 2011/07/14: Bank assets: $97,264.0 mil, Deposits: $75,624.6 mil, headquarters in Chicago, IL, positive income, 717 total offices, Holding Company: Bank Of Montreal
- West Suburban Bank: Lake Street Facility, Eola Facility, Aurora Facility, West Galena Facility. Info updated 2011/02/23: Bank assets: $1,927.7 mil, Deposits: $1,744.7 mil, headquarters in Lombard, IL, positive income, Commercial Lending Specialization, 44 total offices, Holding Company: West Suburban Bancorp, Inc.
- PNC Bank, National Association: Aurora Drive-In Branch, West Aurora Branch, Aurora Branch, Aurora-Eola Branch. Info updated 2012/03/20: Bank assets: $263,309.6 mil, Deposits: $197,343.0 mil, headquarters in Wilmington, DE, positive income, Commercial Lending Specialization, 3085 total offices, Holding Company: Pnc Financial Services Group, Inc., The
- Fifth Third Bank: West Plaza Branch, Aurora Motor Bank Branch, Fox Valley Villages Branch, Aurora Downtown Branch. Info updated 2009/10/05: Bank assets: $114,540.4 mil, Deposits: $89,689.1 mil, headquarters in Cincinnati, OH, positive income, Commercial Lending Specialization, 1378 total offices, Holding Company: Fifth Third Bancorp
- TCF National Bank: Aurora & Eola Jewel #2337, Aurora Jewel Branch #2295, Galena Blvd Jewel Branch #2317. Info updated 2009/11/23: Bank assets: $19,007.0 mil, Deposits: $12,377.0 mil, headquarters in Sioux Falls, SD, positive income, Commercial Lending Specialization, 441 total offices, Holding Company: Tcf Financial Corporation
- Bank of America, National Association: Aurora Banking Center Branch at 896 North Route 59, branch established on 2004/03/29; Aurora - Indian Trail Branch at 2390 West Indian Trail, branch established on 2005/05/23. Info updated 2009/11/18: Bank assets: $1,451,969.3 mil, Deposits: $1,077,176.8 mil, headquarters in Charlotte, NC, positive income, 5782 total offices, Holding Company: Bank Of America Corporation
- MB Financial Bank, National Association: West Aurora Branch at One North Constitution Drive, branch established on 1898/01/01; Aurora Branch at 2992 Indian Trail Road, branch established on 1998/01/07. Info updated 2010/04/27: Bank assets: $9,792.4 mil, Deposits: $7,757.4 mil, headquarters in Chicago, IL, positive income, Commercial Lending Specialization, 93 total offices, Holding Company: Mb Financial, Inc
- 10 other banks with 10 local branches
For population 15 years and over in Aurora:
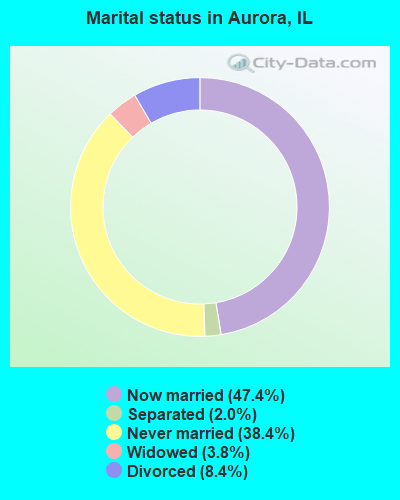
- Never married: 38.4%
- Now married: 47.4%
- Separated: 2.0%
- Widowed: 3.8%
- Divorced: 8.4%
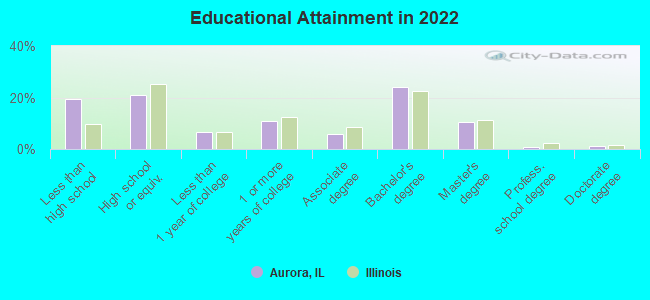
For population 25 years and over in Aurora:
- High school or higher: 80.7%
- Bachelor's degree or higher: 36.5%
- Graduate or professional degree: 12.5%
- Unemployed: 5.8%
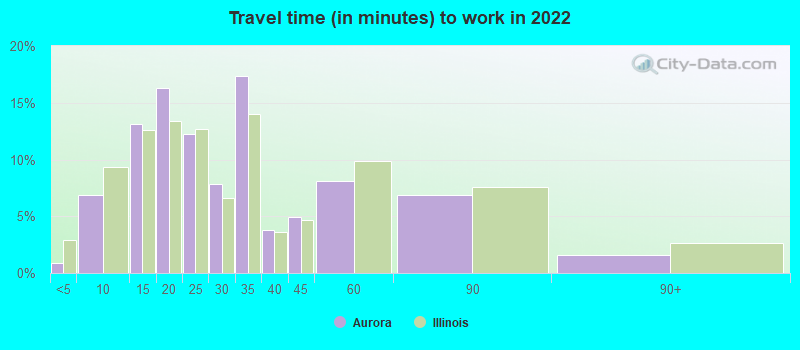
- Mean travel time to work (commute): 23.3 minutes
| Here: | 17.0 |
| Illinois average: | 12.5 |
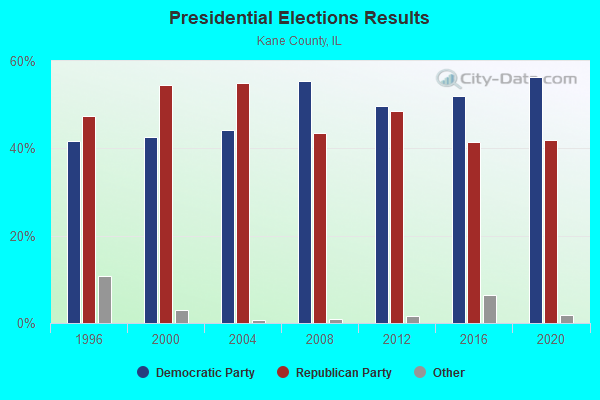
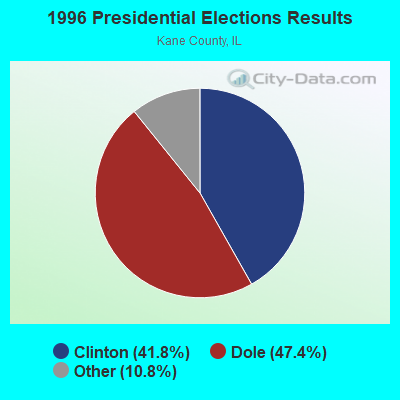
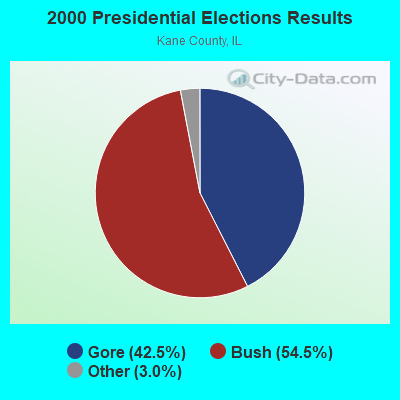
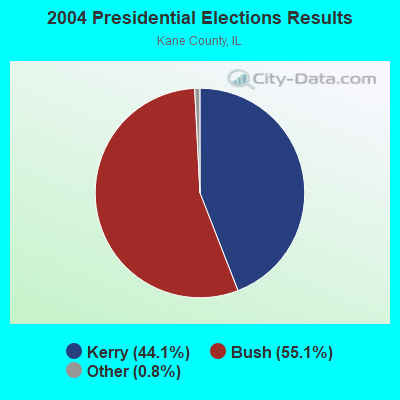
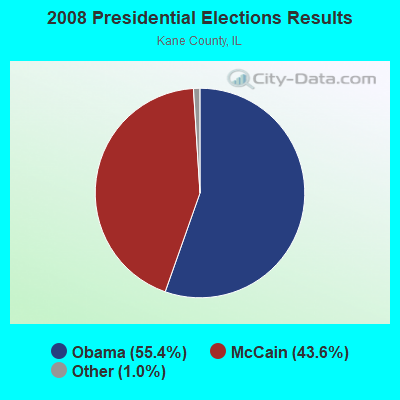
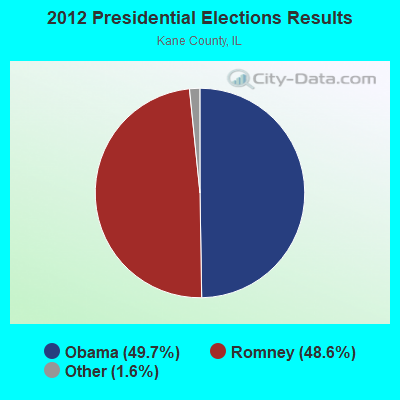
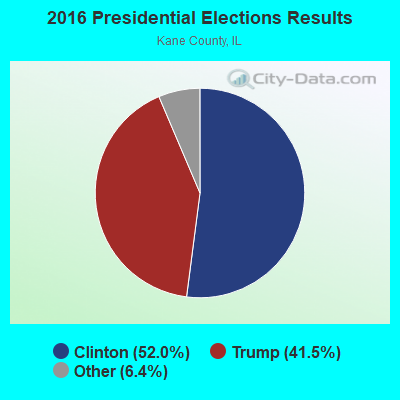
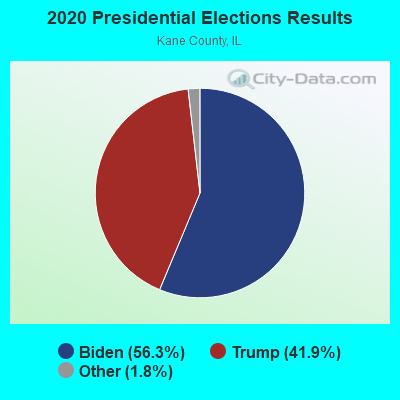
Graphs represent county-level data. Detailed 2008 Election Results
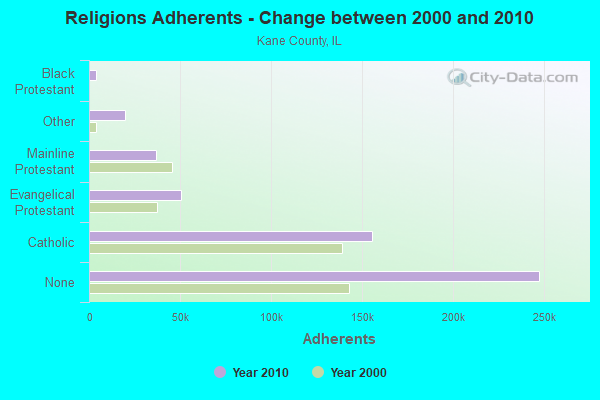
Religion statistics for Aurora, IL (based on Kane County data)
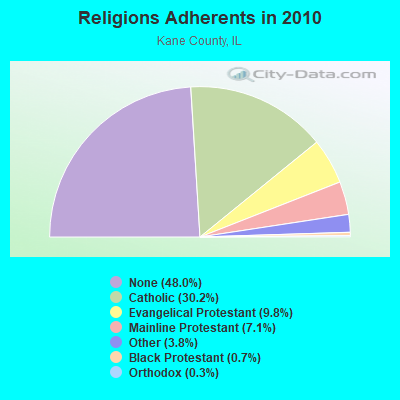
| Religion | Adherents | Congregations |
|---|---|---|
| Catholic | 155,391 | 28 |
| Evangelical Protestant | 50,728 | 184 |
| Mainline Protestant | 36,576 | 72 |
| Other | 19,744 | 30 |
| Black Protestant | 3,679 | 10 |
| Orthodox | 1,630 | 2 |
| None | 247,521 | - |
Food Environment Statistics:
| This county: | 1.61 / 10,000 pop. |
| Illinois: | 2.24 / 10,000 pop. |
| This county: | 0.08 / 10,000 pop. |
| Illinois: | 0.08 / 10,000 pop. |
| Kane County: | 0.54 / 10,000 pop. |
| Illinois: | 0.75 / 10,000 pop. |
| Kane County: | 1.95 / 10,000 pop. |
| Illinois: | 2.61 / 10,000 pop. |
| Kane County: | 5.90 / 10,000 pop. |
| State: | 6.86 / 10,000 pop. |
| Kane County: | 7.2% |
| State: | 8.3% |
| Here: | 27.2% |
| Illinois: | 25.2% |
| Kane County: | 15.1% |
| Illinois: | 14.5% |
Health and Nutrition:
| Aurora: | 47.0% |
| Illinois: | 49.5% |
| Aurora: | 46.1% |
| Illinois: | 47.2% |
| Here: | 28.4 |
| Illinois: | 28.6 |
| Aurora: | 20.4% |
| State: | 20.5% |
| This city: | 9.9% |
| Illinois: | 10.8% |
| Aurora: | 6.7 |
| Illinois: | 6.8 |
| Here: | 31.2% |
| Illinois: | 33.4% |
| Aurora: | 56.4% |
| Illinois: | 56.4% |
| This city: | 81.7% |
| Illinois: | 79.9% |
More about Health and Nutrition of Aurora, IL Residents
| Local government employment and payroll (March 2022) | |||||
| Function | Full-time employees | Monthly full-time payroll | Average yearly full-time wage | Part-time employees | Monthly part-time payroll |
|---|---|---|---|---|---|
| Police Protection - Officers | 292 | $3,299,286 | $135,587 | 0 | $0 |
| Firefighters | 201 | $2,467,762 | $147,329 | 0 | $0 |
| Other and Unallocable | 115 | $1,004,480 | $104,815 | 8 | $34,494 |
| Local Libraries | 80 | $398,689 | $59,803 | 60 | $84,617 |
| Financial Administration | 68 | $576,337 | $101,707 | 2 | $5,093 |
| Streets and Highways | 63 | $515,785 | $98,245 | 1 | $745 |
| Sewerage | 38 | $282,671 | $89,265 | 2 | $1,479 |
| Police - Other | 35 | $249,683 | $85,606 | 28 | $36,742 |
| Water Supply | 27 | $234,378 | $104,168 | 0 | $0 |
| Other Government Administration | 24 | $209,607 | $104,804 | 11 | $57,656 |
| Parks and Recreation | 19 | $136,152 | $85,991 | 4 | $3,295 |
| Solid Waste Management | 8 | $49,058 | $73,587 | 2 | $2,549 |
| Housing and Community Development (Local) | 6 | $56,666 | $113,332 | 1 | $874 |
| Judicial and Legal | 6 | $47,986 | $95,972 | 0 | $0 |
| Fire - Other | 5 | $35,311 | $84,746 | 3 | $1,962 |
| Airports | 2 | $9,479 | $56,874 | 0 | $0 |
| Totals for Government | 989 | $9,573,326 | $116,158 | 122 | $229,505 |
Aurora government finances - Expenditure in 2021 (per resident):
- Construction - Regular Highways: $8,532,000 ($47.97)
Housing and Community Development: $1,646,000 ($9.25)
Police Protection: $1,033,000 ($5.81)
General - Other: $933,000 ($5.25)
Central Staff Services: $927,000 ($5.21)
Parks and Recreation: $781,000 ($4.39)
Water Utilities: $17,000 ($0.10)
- Current Operations - Police Protection: $82,576,000 ($464.26)
Local Fire Protection: $54,766,000 ($307.91)
Water Utilities: $25,645,000 ($144.18)
Central Staff Services: $22,004,000 ($123.71)
General - Other: $19,068,000 ($107.20)
Regular Highways: $14,558,000 ($81.85)
Parks and Recreation: $6,487,000 ($36.47)
Public Welfare - Other: $5,539,000 ($31.14)
Libraries: $5,155,000 ($28.98)
Housing and Community Development: $4,909,000 ($27.60)
Financial Administration: $4,766,000 ($26.80)
Parking Facilities: $3,017,000 ($16.96)
Air Transportation: $1,030,000 ($5.79)
- General - Interest on Debt: $36,343,000 ($204.33)
- Intergovernmental to Local - Other - General - Other: $1,661,000 ($9.34)
- Other Capital Outlay - Water Utilities: $2,853,000 ($16.04)
Regular Highways: $2,041,000 ($11.47)
Sewerage: $1,596,000 ($8.97)
Police Protection: $1,366,000 ($7.68)
Central Staff Services: $515,000 ($2.90)
Housing and Community Development: $111,000 ($0.62)
- Total Salaries and Wages: $110,700,000 ($622.38)
Aurora government finances - Revenue in 2021 (per resident):
- Charges - Other: $8,192,000 ($46.06)
Solid Waste Management: $2,367,000 ($13.31)
Parks and Recreation: $1,106,000 ($6.22)
Parking Facilities: $421,000 ($2.37)
Housing and Community Development: $246,000 ($1.38)
- Federal Intergovernmental - Housing and Community Development: $1,875,000 ($10.54)
Highways: $1,714,000 ($9.64)
Public Welfare: $329,000 ($1.85)
Other: $227,000 ($1.28)
- Local Intergovernmental - Other: $1,859,000 ($10.45)
- Miscellaneous - Fines and Forfeits: $3,167,000 ($17.81)
General Revenue - Other: $1,884,000 ($10.59)
Interest Earnings: $1,290,000 ($7.25)
- Revenue - Water Utilities: $38,434,000 ($216.08)
Transit Utilities: $1,056,000 ($5.94)
- State Intergovernmental - General Local Government Support: $72,952,000 ($410.15)
Highways: $12,335,000 ($69.35)
Other: $32,000 ($0.18)
- Tax - Property: $87,695,000 ($493.04)
Other Selective Sales: $28,518,000 ($160.33)
Public Utilities Sales: $19,694,000 ($110.72)
Other License: $7,401,000 ($41.61)
Aurora government finances - Debt in 2021 (per resident):
- Long Term Debt - Outstanding Unspecified Public Purpose: $1,041,695,000 ($5856.63)
Beginning Outstanding - Unspecified Public Purpose: $908,568,000 ($5108.16)
Issue, Unspecified Public Purpose: $173,337,000 ($974.54)
Retired Unspecified Public Purpose: $40,210,000 ($226.07)
Aurora government finances - Cash and Securities in 2021 (per resident):
- Bond Funds - Cash and Securities: $110,777,000 ($622.81)
- Other Funds - Cash and Securities: $201,696,000 ($1133.98)
7.35% of this county's 2020 resident taxpayers moved to other counties in 2021 ($81,683 average adjusted gross income)
| Here: | 7.35% |
| Illinois average: | 6.10% |
0.01% of residents moved to foreign countries ($73 average AGI)
Kane County: 0.01% Illinois average: 0.01%
Top counties to which taxpayers relocated from this county between 2020 and 2021:
| to Cook County, IL | |
| to DuPage County, IL | |
| to McHenry County, IL |
| Businesses in Aurora, IL | ||||
| Name | Count | Name | Count | |
|---|---|---|---|---|
| 7-Eleven | 7 | Jewel-Osco | 3 | |
| ALDI | 3 | Jimmy John's | 3 | |
| ALDO | 2 | Jones New York | 7 | |
| AT&T | 2 | Journeys | 2 | |
| Abercrombie & Fitch | 1 | Juicy Couture | 1 | |
| Abercrombie Kids | 1 | Just Tires | 1 | |
| Ace Hardware | 3 | Justice | 2 | |
| Advance Auto Parts | 2 | KFC | 2 | |
| Aeropostale | 2 | Kohl's | 1 | |
| Aerosoles | 1 | Lane Bryant | 2 | |
| American Eagle Outfitters | 2 | Lane Furniture | 1 | |
| Ann Taylor | 1 | LensCrafters | 1 | |
| Applebee's | 1 | Levi Strauss & Co. | 1 | |
| Arby's | 2 | Little Caesars Pizza | 2 | |
| AutoZone | 4 | Long John Silver's | 2 | |
| Avenue | 1 | Lowe's | 1 | |
| Bakers | 1 | Macy's | 1 | |
| Banana Republic | 2 | MasterBrand Cabinets | 6 | |
| Baskin-Robbins | 4 | McDonald's | 10 | |
| Bath & Body Works | 1 | Meijer | 1 | |
| Blockbuster | 2 | Men's Wearhouse | 2 | |
| Brooks Brothers | 1 | Motel 6 | 1 | |
| Budget Car Rental | 1 | Motherhood Maternity | 3 | |
| Buffalo Wild Wings | 1 | New York & Co | 2 | |
| Burger King | 5 | Nike | 14 | |
| CVS | 4 | Office Depot | 1 | |
| Cache | 1 | OfficeMax | 1 | |
| Caribou Coffee | 1 | Pac Sun | 2 | |
| Carson Pirie Scott | 2 | Panda Express | 2 | |
| Charlotte Russe | 1 | Panera Bread | 3 | |
| Chevrolet | 1 | Papa John's Pizza | 1 | |
| Chick-Fil-A | 1 | Payless | 2 | |
| Chico's | 1 | Penske | 1 | |
| Chipotle | 2 | PetSmart | 1 | |
| Cinnabon | 1 | Pier 1 Imports | 1 | |
| Circle K | 4 | Pizza Hut | 3 | |
| Clarks | 1 | Qdoba Mexican Grill | 1 | |
| ColorTyme | 1 | Quality | 1 | |
| Comfort Suites | 1 | Quiznos | 2 | |
| Cricket Wireless | 11 | RadioShack | 4 | |
| Curves | 1 | Red Lobster | 1 | |
| Dairy Queen | 5 | Ruby Tuesday | 1 | |
| Deb | 1 | Rue21 | 2 | |
| Decora Cabinetry | 2 | SONIC Drive-In | 1 | |
| Dennys | 1 | Safeway | 1 | |
| Discount Tire | 1 | Sears | 3 | |
| Domino's Pizza | 2 | Skechers USA | 1 | |
| DressBarn | 1 | Soma Intimates | 1 | |
| Dressbarn | 1 | Spencer Gifts | 1 | |
| Dunkin Donuts | 8 | Sprint Nextel | 5 | |
| Eddie Bauer | 2 | Starbucks | 7 | |
| Express | 1 | Steak 'n Shake | 1 | |
| Famous Footwear | 2 | Subway | 12 | |
| Fashion Bug | 1 | Super 8 | 1 | |
| FedEx | 21 | T-Mobile | 9 | |
| Finish Line | 1 | T.G.I. Driday's | 1 | |
| Firestone Complete Auto Care | 3 | Taco Bell | 3 | |
| Foot Locker | 1 | Talbots | 1 | |
| Forever 21 | 1 | The Athlete's Foot | 1 | |
| GNC | 3 | The Limited | 1 | |
| GameStop | 3 | The Room Place | 3 | |
| Gap | 4 | Torrid | 1 | |
| Gymboree | 2 | Toys"R"Us | 1 | |
| H&M | 1 | U-Haul | 7 | |
| H&R Block | 7 | U.S. Cellular | 1 | |
| Hilton | 1 | UPS | 19 | |
| Hobby Lobby | 2 | Value City Furniture | 1 | |
| Holiday Inn | 3 | Vans | 6 | |
| Hollister Co. | 1 | Verizon Wireless | 2 | |
| Home Depot | 1 | Victoria's Secret | 1 | |
| Honda | 1 | Vons | 1 | |
| Hot Topic | 1 | Walgreens | 2 | |
| Hyundai | 1 | Walmart | 2 | |
| IHOP | 2 | Wendy's | 3 | |
| IZOD | 1 | White Castle | 2 | |
| J.Crew | 1 | World Gym | 1 | |
| JCPenney | 1 | YMCA | 1 | |
| Jamba Juice | 1 | |||
Strongest AM radio stations in Aurora:
- WSCR (670 AM; 50 kW; CHICAGO, IL; Owner: INFINITY BROADCASTING OPERATIONS, INC.)
- WMVP (1000 AM; 50 kW; CHICAGO, IL; Owner: ABC, INC.)
- WBBM (780 AM; 50 kW; CHICAGO, IL; Owner: INFINITY BROADCASTING OPERATIONS, INC.)
- WGN (720 AM; 50 kW; CHICAGO, IL; Owner: WGN CONTINENTAL BROADCASTING CO.)
- WYLL (1160 AM; 50 kW; CHICAGO, IL; Owner: SCA LICENSE CORPORATION)
- WBIG (1280 AM; 1 kW; AURORA, IL; Owner: BIG BROADCASTING COMAPNY, INC.)
- WLS (890 AM; 50 kW; CHICAGO, IL; Owner: WLS, INC.)
- WKKD (1580 AM; 0 kW; AURORA, IL; Owner: KOVAS COMMUNICATIONS OF INDIANA, INC.)
- WAUR (930 AM; 4 kW; SANDWICH, IL; Owner: CHRISTIAN BROADCASTING SYSTEM, LTD.)
- WTMJ (620 AM; 50 kW; MILWAUKEE, WI; Owner: JOURNAL BROADCAST CORPORATION)
- WVIV (1200 AM; 20 kW; CHICAGO, IL; Owner: WLXX-AM LICENSE CORP.)
- WMBI (1110 AM; daytime; 5 kW; CHICAGO, IL; Owner: THE MOODY BIBLE INSTITUTE OF CHICAGO)
- WISN (1130 AM; 50 kW; MILWAUKEE, WI; Owner: CAPSTAR TX LIMITED PARTNERSHIP)
Strongest FM radio stations in Aurora:
- WERV-FM (95.9 FM; AURORA, IL; Owner: NM LICENSING, LLC)
- WLEY-FM (107.9 FM; AURORA, IL; Owner: WLEY LICENSING, INC.)
- WONC (89.1 FM; NAPERVILLE, IL; Owner: NORTH CENTRAL COLLEGE)
- WCKG (105.9 FM; ELMWOOD PARK, IL; Owner: INFINITY HOLDINGS CORPORATION OF ORLANDO)
- WLIT-FM (93.9 FM; CHICAGO, IL; Owner: AMFM RADIO LICENSES, L.L.C.)
- WSPY-FM (107.1 FM; PLANO, IL; Owner: NELSON ENTERPRISES, INC.)
- WJMK (104.3 FM; CHICAGO, IL; Owner: INFINITY BROADCASTING CORP. OF ILLINOIS)
- WNUA (95.5 FM; CHICAGO, IL; Owner: AMFM RADIO LICENSES, L.L.C.)
- WTMX (101.9 FM; SKOKIE, IL; Owner: BONNEVILLE HOLDING COMPANY)
- WBBM-FM (96.3 FM; CHICAGO, IL; Owner: INFINITY BROADCASTING OPERATIONS, INC.)
- WGCI-FM (107.5 FM; CHICAGO, IL; Owner: AMFM RADIO LICENSES, L.L.C.)
- WKSC-FM (103.5 FM; CHICAGO, IL; Owner: AMFM RADIO LICENSES, L.L.C.)
- WFMT (98.7 FM; CHICAGO, IL; Owner: WINDOW TO THE WORLD COMMUNICATIONS)
- WZZN (94.7 FM; CHICAGO, IL; Owner: ABC CHICAGO FM RADIO,INC.)
- WBEZ (91.5 FM; CHICAGO, IL; Owner: THE WBEZ ALLIANCE, INC.)
- WKQX (101.1 FM; CHICAGO, IL; Owner: EMMIS RADIO LICENSE CORPORATION)
- WLUP-FM (97.9 FM; CHICAGO, IL; Owner: BONNEVILLE HOLDING COMPANY)
- WNND (100.3 FM; CHICAGO, IL; Owner: BONNEVILLE HOLDING COMPANY)
- WOJO (105.1 FM; EVANSTON, IL; Owner: TICHENOR LICENSE CORPORATION ("TLC"))
- WUSN (99.5 FM; CHICAGO, IL; Owner: INFINITY BROADCASTING CORPORATION OF CHICAGO)
TV broadcast stations around Aurora:
- W24AJ (Channel 24; AURORA, IL; Owner: NELSON TV, INC.)
- WLS-TV (Channel 7; CHICAGO, IL; Owner: WLS TELEVISION, INC.)
- WMAQ-TV (Channel 5; CHICAGO, IL; Owner: NBC SUBSIDIARY (WMAQ-TV), INC.)
- WTTW (Channel 11; CHICAGO, IL; Owner: WINDOW TO THE WORLD COMMUNICATIONS, INC.)
- WGN-TV (Channel 9; CHICAGO, IL; Owner: WGN CONTINENTAL BROADCASTING COMPANY)
- W34CK (Channel 34; ARLINGTON HEIGHTS, IL; Owner: FIRST UNITED, INC.)
- WGBO-TV (Channel 66; JOLIET, IL; Owner: WGBO LICENSE PARTNERSHIP, G.P.)
- WBBM-TV (Channel 2; CHICAGO, IL; Owner: CBS BROADCASTING INC.)
- WPWR-TV (Channel 50; GARY, IN; Owner: FOX TELEVISION STATIONS, INC.)
- WXFT (Channel 60; AURORA, IL; Owner: TELEFUTURA CHICAGO LLC)
- WCIU-TV (Channel 26; CHICAGO, IL; Owner: WCIU-TV LIMITED PARTNERSHIP)
- WCPX (Channel 38; CHICAGO, IL; Owner: PAXSON CHICAGO LICENSE, INC.)
- WFLD (Channel 32; CHICAGO, IL; Owner: FOX TELEVISION STATIONS, INC.)
- W68DO (Channel 68; PALATINE, IL; Owner: TRINITY BROADCASTING NETWORK)
- WFBT-CA (Channel 23; CHICAGO, IL; Owner: CHANNEL 23 LIMITED PARTNERSHIP)
- WSNS-TV (Channel 44; CHICAGO, IL; Owner: TELEMUNDO OF CHICAGO, INC.)
- WJYS (Channel 62; HAMMOND, IN; Owner: JOVON BROADCASTING CORPORATION)
- WSPY-LP (Channel 30; PLANO, IL; Owner: WSPY-TV, INC.)
- W54BE (Channel 54; SUGAR GROVE, IL; Owner: WAUBONSEE COMMUNITY COLLEGE)
- W57DN (Channel 57; ELGIN, IL; Owner: TRINITY BROADCASTING NETWORK)
- WOCH-LP (Channel 28; CHICAGO, IL; Owner: KM LPTV OF CHICAGO-28, L.L.C.)
- WYCC (Channel 20; CHICAGO, IL; Owner: COLLEGE DIST. #508, COUNTY OF COOK)
- WOCK-CA (Channel 13; CHICAGO, IL; Owner: KM LPTV OF CHICAGO-13, L.L.C.)
- W64CQ (Channel 64; ARLINGTON HEIGHTS, IL; Owner: TRINITY BROADCASTING NETWORK)
- WWTO-TV (Channel 35; LASALLE, IL; Owner: TRINITY BROADCASTING NETWORK)
Medal of Honor Recipients
Medal of Honor Recipients born in Aurora: James H. Monroe, Lester W. Weber, Walter E. Truemper.
- National Bridge Inventory (NBI) Statistics
- 66Number of bridges
- 974ft / 297mTotal length
- $29,993,000Total costs
- 1,249,875Total average daily traffic
- 160,249Total average daily truck traffic
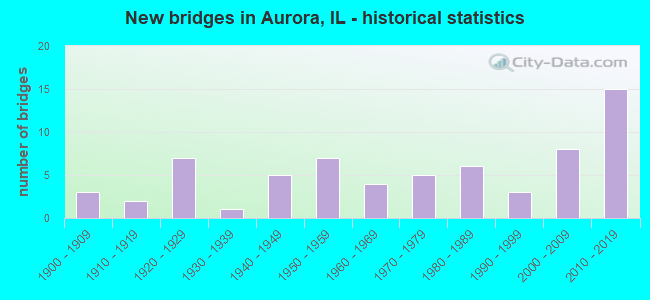
- New bridges - historical statistics
- 31900-1909
- 21910-1919
- 71920-1929
- 11930-1939
- 51940-1949
- 71950-1959
- 41960-1969
- 51970-1979
- 61980-1989
- 31990-1999
- 82000-2009
- 152010-2019
FCC Registered Antenna Towers: 226 (See the full list of FCC Registered Antenna Towers)
FCC Registered Commercial Land Mobile Towers: 2 (See the full list of FCC Registered Commercial Land Mobile Towers in Aurora, IL)
FCC Registered Private Land Mobile Towers: 12 (See the full list of FCC Registered Private Land Mobile Towers)
FCC Registered Broadcast Land Mobile Towers: 88 (See the full list of FCC Registered Broadcast Land Mobile Towers)
FCC Registered Microwave Towers: 97 (See the full list of FCC Registered Microwave Towers in this town)
FCC Registered Paging Towers: 20 (See the full list of FCC Registered Paging Towers)
FCC Registered Maritime Coast & Aviation Ground Towers: 1 (See the full list of FCC Registered Maritime Coast & Aviation Ground Towers)
FCC Registered Amateur Radio Licenses: 393 (See the full list of FCC Registered Amateur Radio Licenses in Aurora)
FAA Registered Aircraft: 30 (See the full list of FAA Registered Aircraft in Aurora)
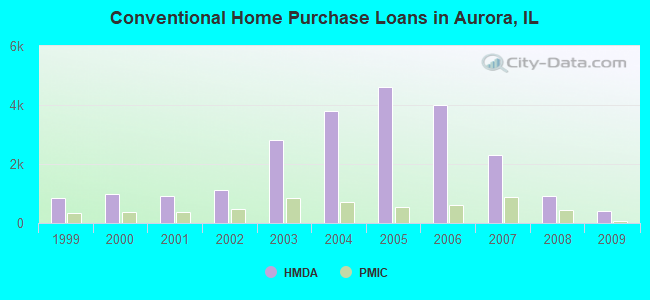
| Home Mortgage Disclosure Act Aggregated Statistics For Year 2009 (Based on 15 full and 12 partial tracts) | ||||||||||||||
| A) FHA, FSA/RHS & VA Home Purchase Loans | B) Conventional Home Purchase Loans | C) Refinancings | D) Home Improvement Loans | E) Loans on Dwellings For 5+ Families | F) Non-occupant Loans on < 5 Family Dwellings (A B C & D) | G) Loans On Manufactured Home Dwelling (A B C & D) | ||||||||
|---|---|---|---|---|---|---|---|---|---|---|---|---|---|---|
| Number | Average Value | Number | Average Value | Number | Average Value | Number | Average Value | Number | Average Value | Number | Average Value | Number | Average Value | |
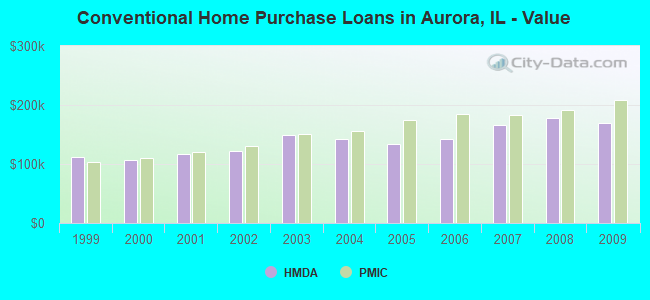
| LOANS ORIGINATED | 617 | $156,966 | 417 | $169,042 | 3,415 | $188,747 | 85 | $75,158 | 9 | $1,673,080 | 183 | $122,474 | 11 | $228,391 |
| APPLICATIONS APPROVED, NOT ACCEPTED | 38 | $133,962 | 33 | $172,896 | 342 | $183,973 | 16 | $23,355 | 0 | $0 | 10 | $92,647 | 0 | $0 |
| APPLICATIONS DENIED | 105 | $145,345 | 89 | $122,328 | 1,095 | $170,417 | 93 | $39,333 | 3 | $633,333 | 106 | $122,847 | 5 | $43,510 |
| APPLICATIONS WITHDRAWN | 82 | $142,367 | 32 | $156,497 | 567 | $194,734 | 14 | $113,524 | 0 | $0 | 26 | $138,699 | 0 | $0 |
| FILES CLOSED FOR INCOMPLETENESS | 18 | $145,099 | 11 | $130,484 | 202 | $181,861 | 5 | $112,964 | 1 | $1,371,000 | 12 | $139,479 | 0 | $0 |
Detailed mortgage data for all 27 tracts in Aurora, IL
| Private Mortgage Insurance Companies Aggregated Statistics For Year 2009 (Based on 14 full and 12 partial tracts) | ||||||
| A) Conventional Home Purchase Loans | B) Refinancings | C) Non-occupant Loans on < 5 Family Dwellings (A & B) | ||||
|---|---|---|---|---|---|---|
| Number | Average Value | Number | Average Value | Number | Average Value | |
| LOANS ORIGINATED | 84 | $208,325 | 81 | $215,064 | 1 | $218,320 |
| APPLICATIONS APPROVED, NOT ACCEPTED | 32 | $185,652 | 35 | $209,057 | 1 | $113,090 |
| APPLICATIONS DENIED | 14 | $185,770 | 33 | $198,673 | 0 | $0 |
| APPLICATIONS WITHDRAWN | 14 | $245,735 | 14 | $186,010 | 0 | $0 |
| FILES CLOSED FOR INCOMPLETENESS | 4 | $192,238 | 6 | $192,285 | 1 | $114,710 |
2002 - 2018 National Fire Incident Reporting System (NFIRS) incidents
- Fire incident types reported to NFIRS in Aurora, IL
- 1,93444.9%Structure Fires
- 1,08525.2%Outside Fires
- 91721.3%Mobile Property/Vehicle Fires
- 3728.6%Other
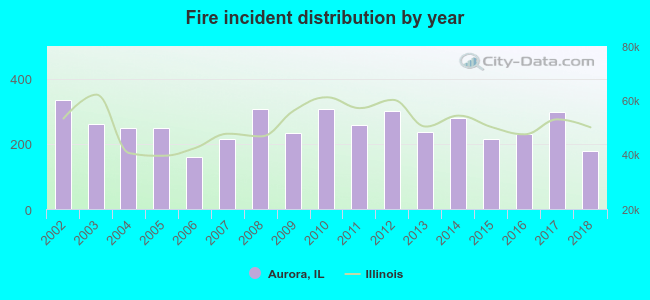 According to the data from the years 2002 - 2018 the average number of fires per year is 253. The highest number of fire incidents - 334 took place in 2002, and the least - 159 in 2006. The data has a dropping trend.
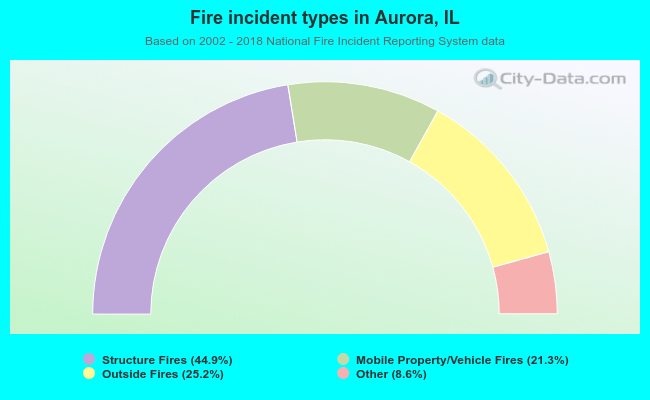 When looking into fire subcategories, the most incidents belonged to: Structure Fires (44.9%), and Outside Fires (25.2%).
Fire-safe hotels and motels in Aurora, Illinois:
- Comfort Inn Aurora, 4005 Gabrielle Ln, Aurora, Illinois 60504 , Phone: (630) 820-3400, Fax: (630) 820-7081
- Holiday Inn Express and Suites, 111 N Broadway Ave, Aurora, Illinois 60505 , Phone: (630) 896-2800, Fax: (630) 896-2887
- Columbia Hotel, 114 E Galena Blvd, Aurora, Illinois 60505 , Phone: (630) 859-9669
- Super 8 Aurora/Naporville, 4228 Long Mdw Dr, Aurora, Illinois 60504 , Phone: (630) 898-5419, Fax: (630) 898-6087
- Homewood Suites Aurora Naperville, 4320 Meridian Pkwy, Aurora, Illinois 60504 , Phone: (630) 978-2222, Fax: (630) 978-2215
- Hampton Inn & Suites, 2423 Bushwood Dr, Aurora, Illinois 60506 , Phone: (630) 907-2600, Fax: (630) 907-2919
- Holiday Inn Chicago/Aurora, 2424 Sullivan Rd, Aurora, Illinois 60506 , Phone: (630) 896-0898
- Candlewood Suites, 2625 W Sullivan Rd, Aurora, Illinois 60506 , Phone: (630) 907-9977, Fax: (630) 907-9988
| Most common first names in Aurora, IL among deceased individuals | ||
| Name | Count | Lived (average) |
|---|---|---|
| John | 707 | 74.4 years |
| Mary | 608 | 78.6 years |
| William | 511 | 74.6 years |
| Robert | 425 | 70.5 years |
| James | 342 | 69.3 years |
| George | 341 | 76.1 years |
| Helen | 309 | 81.3 years |
| Margaret | 306 | 81.4 years |
| Joseph | 268 | 76.1 years |
| Charles | 251 | 74.0 years |
| Most common last names in Aurora, IL among deceased individuals | ||
| Last name | Count | Lived (average) |
|---|---|---|
| Johnson | 236 | 75.4 years |
| Smith | 223 | 72.6 years |
| Anderson | 134 | 77.3 years |
| Miller | 132 | 76.1 years |
| Jones | 96 | 72.5 years |
| Brown | 96 | 74.8 years |
| Williams | 77 | 72.4 years |
| Moore | 66 | 72.2 years |
| Nelson | 63 | 75.8 years |
| Davis | 61 | 68.4 years |
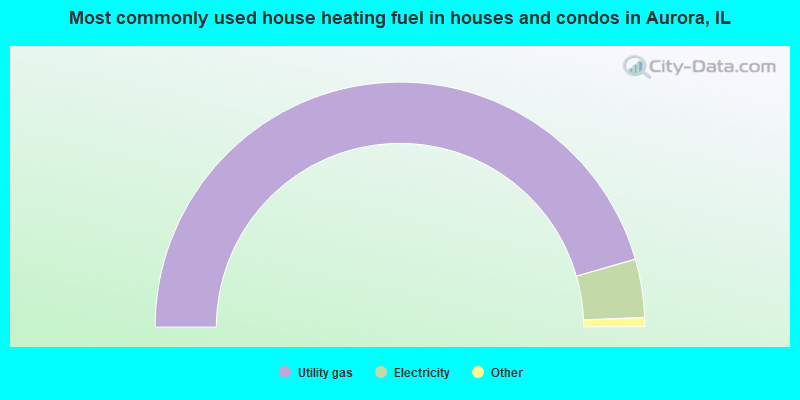
- 91.1%Utility gas
- 7.7%Electricity
- 0.8%Bottled, tank, or LP gas
- 0.3%No fuel used
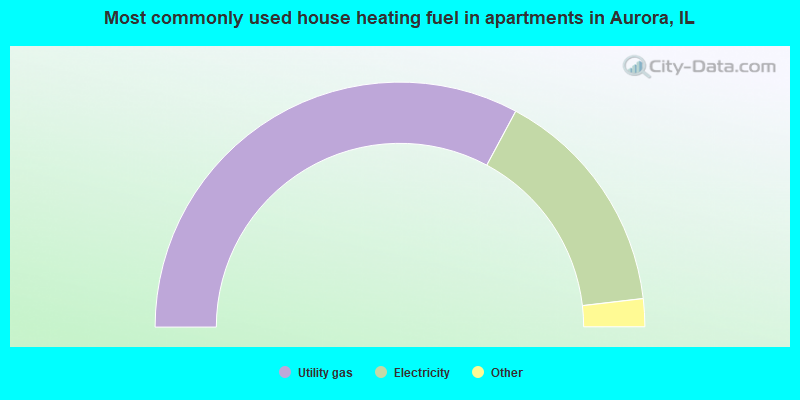
- 65.7%Utility gas
- 30.6%Electricity
- 1.7%No fuel used
- 1.3%Bottled, tank, or LP gas
- 0.7%Other fuel
Aurora compared to Illinois state average:
- Unemployed percentage below state average.
- Hispanic race population percentage significantly above state average.
- Median age significantly below state average.
- Foreign-born population percentage significantly above state average.
Aurora, IL compared to other similar cities:
Aurora on our top lists:
- #10 on the list of "Top 101 cities with the largest city-data.com crime index decrease from 2002 to 2012 (population 50,000+)"
- #14 on the list of "Top 101 cities with the smallest percentages of current college students (population 100,000+)"
- #16 on the list of "Top 101 cities with the most people below the poverty level, excluding cities with 15% or more of residents in college and with the median age below 28 (population 50,000+)"
- #23 on the list of "Top 101 cities with the largest racial income disparity between any two races with at least 2,000 householders"
- #26 on the list of "Top 101 cities with largest percentage of females in occupations: material moving occupations (population 50,000+)"
- #30 on the list of "Top 101 cities with the largest city-data.com crime index decrease from 2011 to 2012 (population 50,000+)"
- #31 on the list of "Top 101 cities with the most people below 50% of the poverty level, excluding cities with 15% or more of residents in college and with the median age below 28 (population 50,000+)"
- #33 on the list of "Top 101 cities with largest percentage of females in occupations: extraction workers (population 50,000+)"
- #33 on the list of "Top 101 cities with largest percentage of females in occupations: fishing and hunting, and forest and logging workers (population 50,000+)"
- #33 on the list of "Top 101 cities with largest percentage of females in industries: farm product raw materials merchant wholesalers (population 50,000+)"
- #34 on the list of "Top 101 cities with largest percentage of females in occupations: fire fighting and prevention workers including supervisors (population 50,000+)"
- #34 on the list of "Top 101 cities with largest percentage of males in industries: broadcasting, internet publishing, and telecommunications services (population 50,000+)"
- #34 on the list of "Top 101 cities with largest percentage of females in industries: broadcasting, internet publishing, and telecommunications services (population 50,000+)"
- #34 on the list of "Top 101 cities with largest percentage of males in industries: wholesale electronic markets and agents and brokers (population 50,000+)"
- #34 on the list of "Top 101 cities with largest percentage of females in industries: wholesale electronic markets and agents and brokers (population 50,000+)"
- #40 on the list of "Top 101 cities with the lowest daily low temperatures (population 50,000+)"
- #44 on the list of "Top 101 cities with largest percentage of males in occupations: material moving occupations (population 50,000+)"
- #48 on the list of "Top 101 cities with largest percentage of females in occupations: production occupations (population 50,000+)"
- #48 on the list of "Top 101 cities with the coldest winters (population 50,000+)"
- #49 on the list of "Top 101 cities with the lowest number of auto thefts per 100,000 residents (population 50,000+)"
- #72 (60563) on the list of "Top 101 zip codes with the largest percentage of Lithuanian first ancestries (pop 5,000+)"
- #8 on the list of "Top 101 counties with the largest decrease in the number of births per 1000 residents 2000-2006 to 2007-2013 (pop 50,000+)"
- #58 on the list of "Top 101 counties with the lowest number of deaths per 1000 residents 2007-2013 (pop. 50,000+)"
- #65 on the list of "Top 101 counties with the largest increase in the number of infant deaths per 1000 residents 2000-2006 to 2007-2013 (pop. 50,000+)"
- #76 on the list of "Top 101 counties with the highest ground withdrawal of fresh water for public supply"
- #84 on the list of "Top 101 counties with the largest number of children under 18 without health insurance coverage in 2000 (pop. 50,000+)"

|
|
Total of 1498 patent applications in 2008-2024.