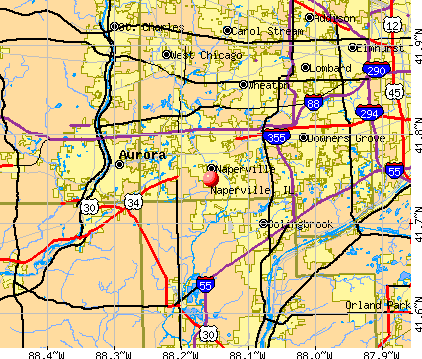
Naperville, Illinois

Naperville: Naperville Riverwalk

Naperville: 911 Memorial

Naperville: December in Naperville
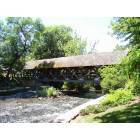
Naperville: Riverwalk Bridge

Naperville: Lakewood Crossing Pond
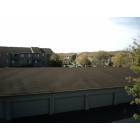
Naperville: Naperville Housing Fall
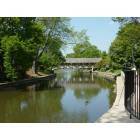
Naperville: Riverwalk
Naperville: Naperville housing

Naperville: Fall Color in Naperville

Naperville: Arial Photo from the Carillon

Naperville: Fall colors in Naperville Neighbourhood
- see
21
more - add
your
Submit your own pictures of this city and show them to the world
- OSM Map
- General Map
- Google Map
- MSN Map
Population change since 2000: +16.8%
 |
| Males: 75,109 | |
| Females: 74,827 |
| Median resident age: | 41.2 years |
| Illinois median age: | 39.1 years |
Zip codes: 60540.
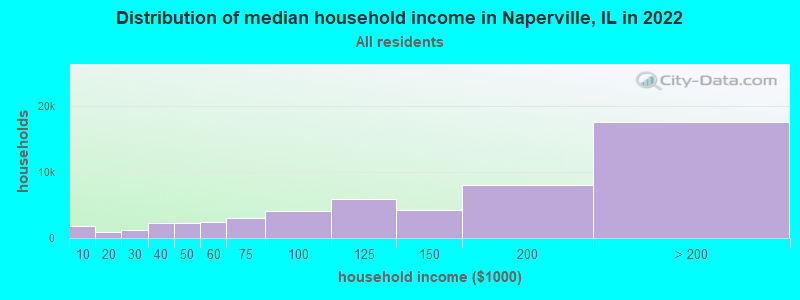
| Naperville: | $140,831 |
| IL: | $76,708 |
Estimated per capita income in 2022: $67,807 (it was $35,551 in 2000)
Naperville city income, earnings, and wages data
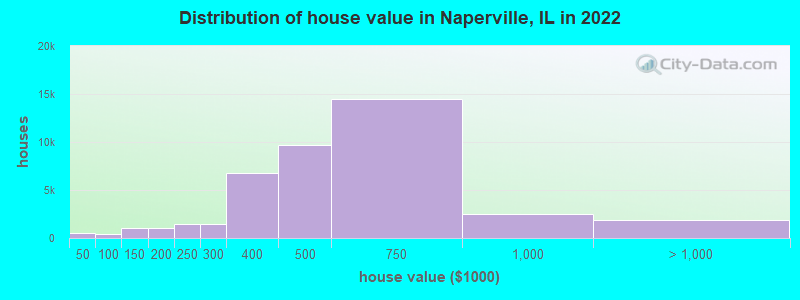
Estimated median house or condo value in 2022: $484,400 (it was $248,200 in 2000)
| Naperville: | $484,400 |
| IL: | $251,600 |
Mean prices in 2022: all housing units: $512,049; detached houses: $576,418; townhouses or other attached units: $304,725; in 2-unit structures: $583,588; in 3-to-4-unit structures: $250,263; in 5-or-more-unit structures: $182,300; mobile homes: $64,171
Median gross rent in 2022: $1,761.
(3.5% for White Non-Hispanic residents, 9.3% for Black residents, 5.6% for Hispanic or Latino residents, 8.0% for American Indian residents, 100.0% for Native Hawaiian and other Pacific Islander residents, 15.8% for other race residents, 1.5% for two or more races residents)
Detailed information about poverty and poor residents in Naperville, IL


Compare current foreclosures in Naperville, IL:
| Photo | Address | Area | Beds / Baths | Price | Details |
|---|---|---|---|---|---|

|
#1
Palomino Dr.
Naperville, IL 60540
|
2,550 sq. feet
|
5 baths 5 beds |
show details | |

|
#2
Royal Saint George Dr
Naperville, IL 60563
|
2,732 sq. feet
|
2 baths 2 beds |
show details | |

|
#3
Normantown Rd
Naperville, IL 60564
|
1,052 sq. feet
|
1 baths 2 beds |
show details | |

|
#4
Grand Lake Ct
Naperville, IL 60540
|
1,298 sq. feet
|
2 baths 2 beds |
show details | |

|
#5
Jefferson Ave
Naperville, IL 60540
|
992 sq. feet
|
1 baths 2 beds |
show details | |

|
#6
Ogden Ave
Naperville, IL 60563
|
1,050 sq. feet
|
2 baths 2 beds |
show details | |

|
#7
Woodewind Dr
Naperville, IL 60563
|
1,196 sq. feet
|
2 baths 2 beds |
show details | |

|
#8
N Mill St
Naperville, IL 60563
|
1,592 sq. feet
|
2 baths 3 beds |
show details | |

|
#9
Chippewa Dr
Naperville, IL 60563
|
2,831 sq. feet
|
2 baths - beds |
show details | |

|
#10
Stableford Ln
Naperville, IL 60564
|
2,401 sq. feet
|
2 baths 3 beds |
show details |
| Photo | Address | Area | Beds / Baths | Price | Details |
|---|---|---|---|---|---|

|
#11
Creek Dr
Naperville, IL 60540
|
1,235 sq. feet
|
1 baths - beds |
show details | |

|
#12
Greenbriar Drive
Naperville, IL 60540
|
1,235 sq. feet
|
2 baths - beds |
show details | |

|
#13
Sycamore Dr
Naperville, IL 60540
|
2,754 sq. feet
|
2 baths 3 beds |
show details | |

|
#14
Crossing Ln
Naperville, IL 60540
|
2,147 sq. feet
|
2 baths 3 beds |
show details | |

|
#15
Crossing Ct
Naperville, IL 60540
|
3,608 sq. feet
|
2 baths 4 beds |
show details | |

|
#16
N Mill St
Naperville, IL 60563
|
798 sq. feet
|
1 baths 1 beds |
show details | |

|
#17
Raymond Dr Apt 201
Naperville, IL 60563
|
809 sq. feet
|
1 baths 1 beds |
show details | |

|
#18
Pearson Cir
Naperville, IL 60563
|
1,512 sq. feet
|
2 baths - beds |
show details | |

|
#19
Chickasaw Dr
Naperville, IL 60563
|
1,887 sq. feet
|
2 baths - beds |
show details | |

|
#20
Menominee Ln
Naperville, IL 60563
|
2,386 sq. feet
|
3 baths - beds |
show details |
| Photo | Address | Area | Beds / Baths | Price | Details |
|---|---|---|---|---|---|

|
#21
E Bailey Rd
Naperville, IL 60565
|
2,974 sq. feet
|
2 baths - beds |
show details | |

|
#22
Needham Rd
Naperville, IL 60563
|
1,559 sq. feet
|
2 baths - beds |
show details | |

|
#23
Camarie Ct
Naperville, IL 60540
|
1,755 sq. feet
|
2 baths - beds |
show details | |

|
#24
Springside Dr
Naperville, IL 60565
|
2,209 sq. feet
|
2 baths - beds |
show details | |

|
#25
Terrance Dr
Naperville, IL 60565
|
2,369 sq. feet
|
2 baths - beds |
show details | |

|
#26
Bay Ct
Naperville, IL 60565
|
1,162 sq. feet
|
1 baths - beds |
show details | |

|
#27
Auburn Ave
Naperville, IL 60565
|
3,756 sq. feet
|
2 baths - beds |
show details | |

|
#28
Killdeer Dr
Naperville, IL 60565
|
1,431 sq. feet
|
1 baths - beds |
show details | |

|
#29
Haverhill Cir
Naperville, IL 60563
|
1,213 sq. feet
|
1 baths - beds |
show details | |

|
#30
W Gartner Rd
Naperville, IL 60540
|
1,509 sq. feet
|
2 baths - beds |
show details |
| Photo | Address | Area | Beds / Baths | Price | Details |
|---|---|---|---|---|---|

|
#31
Laura Ct
Naperville, IL 60563
|
1,656 sq. feet
|
1 baths - beds |
show details | |

|
#32
Laurel Ln
Naperville, IL 60540
|
2,015 sq. feet
|
1 baths - beds |
show details | |

|
#33
Paddington Ave
Naperville, IL 60563
|
1,955 sq. feet
|
2 baths - beds |
show details | |

|
#34
Estate Cir
Naperville, IL 60565
|
1,383 sq. feet
|
2 baths - beds |
show details | |

|
#35
Kiowa Dr Apt 102
Naperville, IL 60565
|
1,026 sq. feet
|
2 baths - beds |
show details | |

|
#36
Pawnee Ln
Naperville, IL 60563
|
2,181 sq. feet
|
2 baths - beds |
show details | |

|
#37
Chippewa Dr
Naperville, IL 60563
|
2,831 sq. feet
|
2 baths - beds |
show details | |

|
#38
Edward Rd
Naperville, IL 60540
|
2,721 sq. feet
|
3 baths - beds |
show details | |

|
#39
Foxcroft Rd Apt 139
Naperville, IL 60565
|
889 sq. feet
|
1 baths - beds |
show details | |

|
#40
Gladstone Dr
Naperville, IL 60565
|
3,929 sq. feet
|
3 baths - beds |
show details |
| Photo | Address | Area | Beds / Baths | Price | Details |
|---|---|---|---|---|---|

|
#41
Lisson Rd
Naperville, IL 60565
|
2,534 sq. feet
|
2 baths - beds |
show details | |

|
#42
Indian Knoll Rd
Naperville, IL 60565
|
2,750 sq. feet
|
2 baths - beds |
show details | |

|
#43
Whispering Hls Dr
Naperville, IL 60540
|
1,092 sq. feet
|
1 baths - beds |
show details | |

|
#44
Orleans Ave
Naperville, IL 60565
|
2,110 sq. feet
|
2 baths - beds |
show details | |

|
#45
Durango Ln Apt 108
Naperville, IL 60564
|
- sq. feet
|
- baths - beds |
show details | |

|
#46
Wagner Rd
Naperville, IL 60564
|
- sq. feet
|
- baths - beds |
show details | |

|
#47
Inland Cir Apt 102
Naperville, IL 60563
|
- sq. feet
|
- baths - beds |
show details | |

|
#48
E Bailey Rd Apt D
Naperville, IL 60565
|
- sq. feet
|
- baths - beds |
show details | |

|
#49
Fairmeadow Ln
Naperville, IL 60563
|
- sq. feet
|
- baths - beds |
show details | |

|
Check over 1 million property listings on Foreclosure.com!
|
browse all offers | |||


- 91,61261.7%White alone
- 32,01521.6%Asian alone
- 9,7546.6%Hispanic
- 8,6905.9%Black alone
- 5,1883.5%Two or more races
- 1,2220.8%Other race alone
- 270.02%American Indian alone
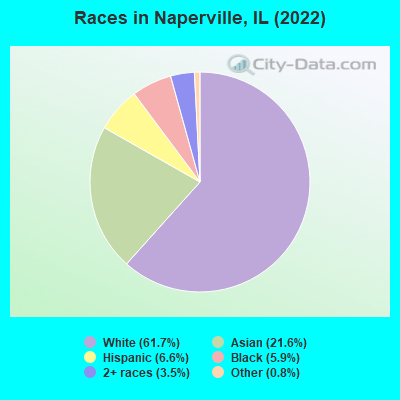
Races in Naperville detailed stats: ancestries, foreign born residents, place of birth
According to our research of Illinois and other state lists, there were 26 registered sex offenders living in Naperville, Illinois as of April 27, 2024.
The ratio of all residents to sex offenders in Naperville is 5,695 to 1.
The ratio of registered sex offenders to all residents in this city is much lower than the state average.
The City-Data.com crime index weighs serious crimes and violent crimes more heavily. Higher means more crime, U.S. average is 246.1. It adjusts for the number of visitors and daily workers commuting into cities.
- means the value is smaller than the state average.- means the value is much bigger than the state average.
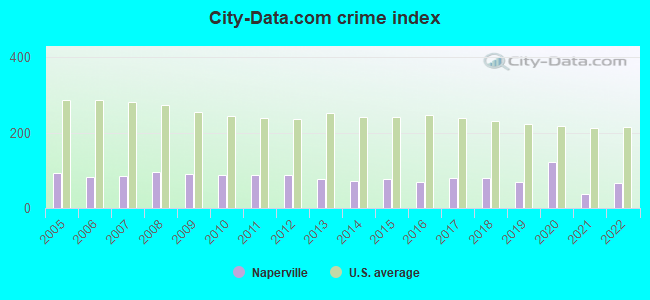
Crime rate in Naperville detailed stats: murders, rapes, robberies, assaults, burglaries, thefts, arson
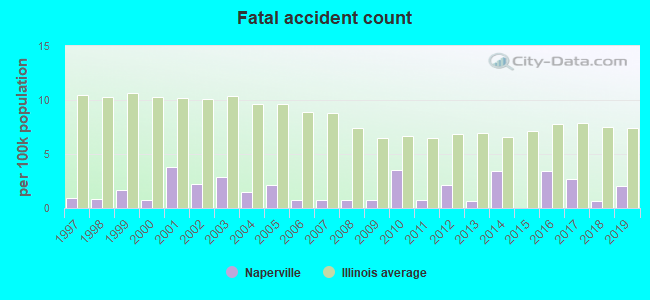
Full-time law enforcement employees in 2020, including police officers: 264 (174 officers - 153 male; 21 female).
| Officers per 1,000 residents here: | 1.17 |
| Illinois average: | 3.04 |
 Recent articles from our blog. Our writers, many of them Ph.D. graduates or candidates, create easy-to-read articles on a wide variety of topics.

 | Naperville vs. Hinsdale (42 replies) |
| Naperville vs Geneva vs St Charles (Moving from TX) (10 replies) |
| Questions about taking the train downtown from Lisle/Naperville (13 replies) |
| Moving to Naperville by April 2019 - Need help!!! (21 replies) |
| Best Elementary Schools in Naperville? (59 replies) |
| Naperville getting more liberal/progressive? (24 replies) |
Latest news from Naperville, IL collected exclusively by city-data.com from local newspapers, TV, and radio stations
Ancestries: German (8.2%), Irish (7.1%), Polish (5.1%), Italian (4.6%), American (3.9%), European (3.6%).
Current Local Time: CST time zone
Incorporated on 03/24/1890
Elevation: 700 feet
Land area: 35.4 square miles.
Population density: 4,238 people per square mile (average).
32,789 residents are foreign born (14.6% Asia, 4.2% Europe).
| This city: | 22.2% |
| Illinois: | 14.1% |
Median real estate property taxes paid for housing units with mortgages in 2022: $10,001 (2.0%)
Median real estate property taxes paid for housing units with no mortgage in 2022: $9,225 (2.0%)
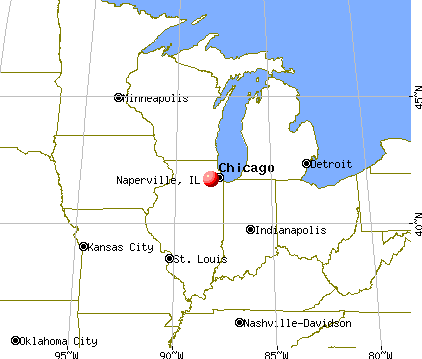
Nearest city with pop. 200,000+: Chicago, IL  (25.4 miles , pop. 2,896,016).
Nearest cities:
)Latitude: 41.75 N, Longitude: 88.16 W
Daytime population change due to commuting: +17,159 (+11.6%)
Workers who live and work in this city: 35,178 (46.5%)
Area code: 630
Naperville tourist attractions:
Naperville, Illinois accommodation & food services, waste management - Economy and Business Data
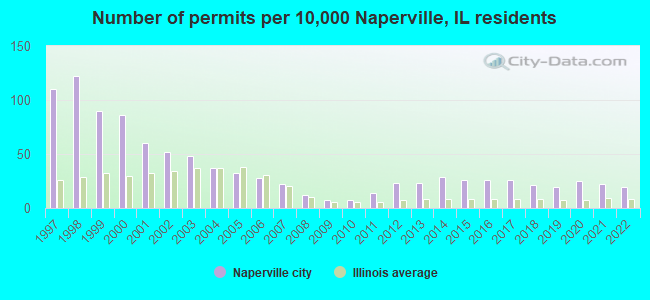
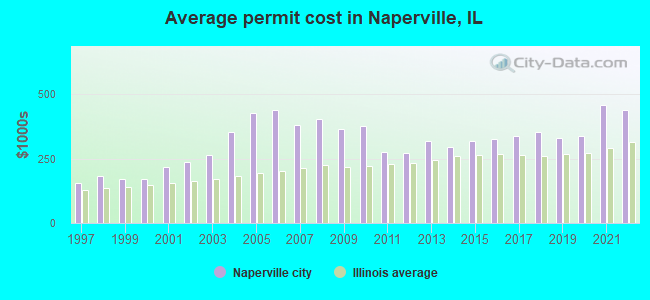
Single-family new house construction building permits:
- 2022: 247 buildings, average cost: $439,400
- 2021: 276 buildings, average cost: $458,800
- 2020: 319 buildings, average cost: $339,100
- 2019: 246 buildings, average cost: $331,100
- 2018: 273 buildings, average cost: $352,600
- 2017: 337 buildings, average cost: $335,900
- 2016: 335 buildings, average cost: $325,900
- 2015: 328 buildings, average cost: $318,900
- 2014: 375 buildings, average cost: $295,400
- 2013: 297 buildings, average cost: $318,800
- 2012: 295 buildings, average cost: $271,400
- 2011: 186 buildings, average cost: $273,500
- 2010: 94 buildings, average cost: $377,100
- 2009: 86 buildings, average cost: $362,800
- 2008: 154 buildings, average cost: $401,600
- 2007: 281 buildings, average cost: $378,500
- 2006: 364 buildings, average cost: $437,700
- 2005: 407 buildings, average cost: $427,700
- 2004: 481 buildings, average cost: $351,700
- 2003: 614 buildings, average cost: $264,800
- 2002: 671 buildings, average cost: $235,300
- 2001: 764 buildings, average cost: $216,900
- 2000: 1107 buildings, average cost: $168,500
- 1999: 1152 buildings, average cost: $172,100
- 1998: 1565 buildings, average cost: $180,800
- 1997: 1406 buildings, average cost: $155,200
| Here: | 3.1% |
| Illinois: | 4.2% |
Population change in the 1990s: +40,868 (+46.7%).
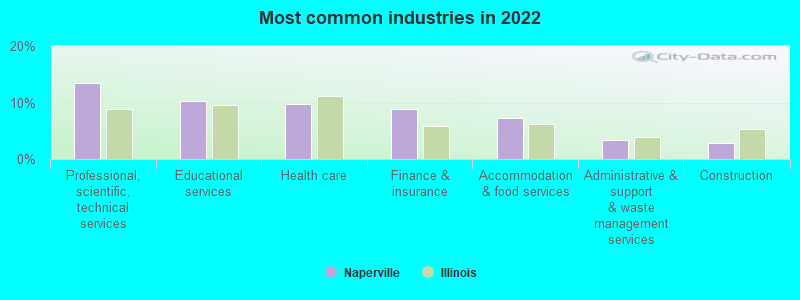
- Professional, scientific, technical services (13.5%)
- Educational services (10.2%)
- Health care (9.7%)
- Finance & insurance (8.9%)
- Accommodation & food services (7.2%)
- Administrative & support & waste management services (3.3%)
- Construction (2.9%)
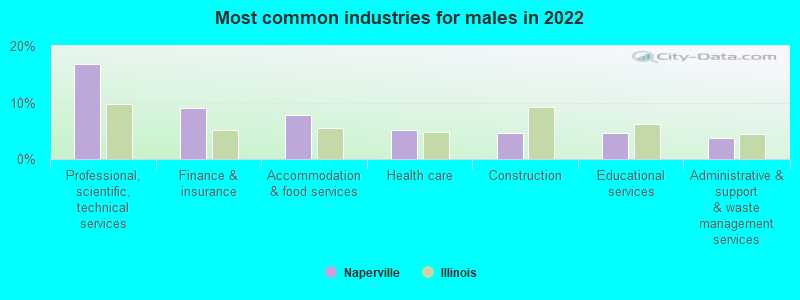
- Professional, scientific, technical services (16.8%)
- Finance & insurance (9.1%)
- Accommodation & food services (7.8%)
- Health care (5.2%)
- Construction (4.7%)
- Educational services (4.6%)
- Administrative & support & waste management services (3.7%)
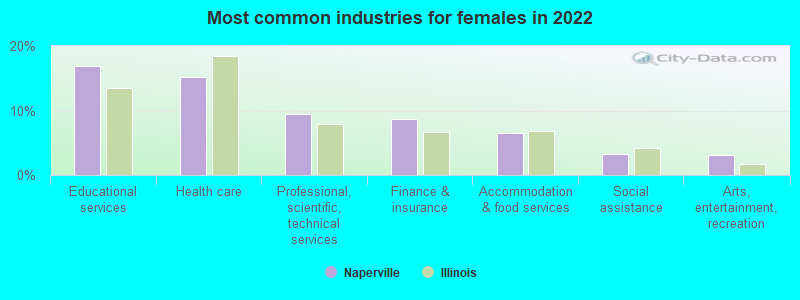
- Educational services (17.0%)
- Health care (15.2%)
- Professional, scientific, technical services (9.4%)
- Finance & insurance (8.7%)
- Accommodation & food services (6.6%)
- Social assistance (3.3%)
- Arts, entertainment, recreation (3.1%)
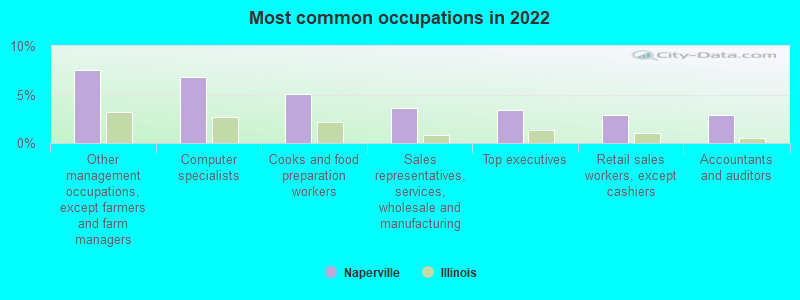
- Other management occupations, except farmers and farm managers (7.5%)
- Computer specialists (6.8%)
- Cooks and food preparation workers (5.0%)
- Sales representatives, services, wholesale and manufacturing (3.6%)
- Top executives (3.4%)
- Retail sales workers, except cashiers (2.8%)
- Accountants and auditors (2.8%)
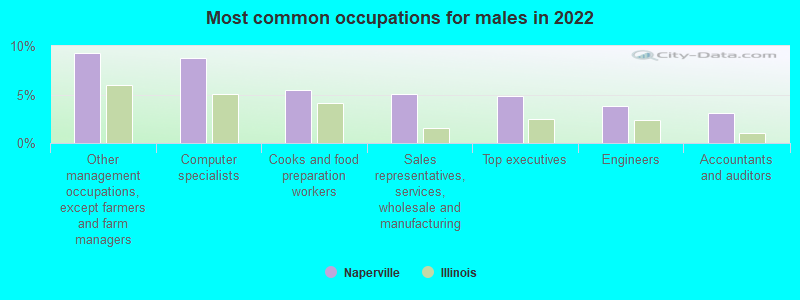
- Other management occupations, except farmers and farm managers (9.3%)
- Computer specialists (8.8%)
- Cooks and food preparation workers (5.4%)
- Sales representatives, services, wholesale and manufacturing (5.0%)
- Top executives (4.9%)
- Engineers (3.8%)
- Accountants and auditors (3.1%)
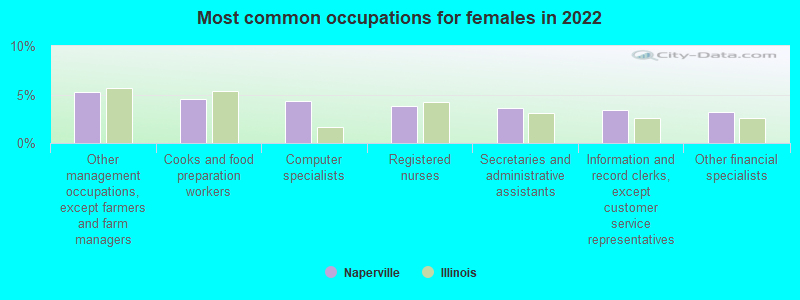
- Other management occupations, except farmers and farm managers (5.3%)
- Cooks and food preparation workers (4.6%)
- Computer specialists (4.3%)
- Registered nurses (3.8%)
- Secretaries and administrative assistants (3.6%)
- Information and record clerks, except customer service representatives (3.4%)
- Other financial specialists (3.2%)
Average climate in Naperville, Illinois
Based on data reported by over 4,000 weather stations

|
|

(lower is better)
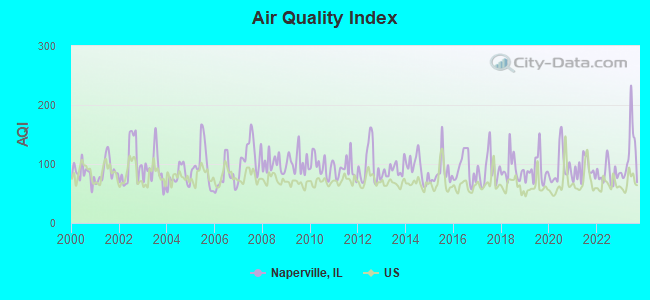
Air Quality Index (AQI) level in 2023 was 117. This is significantly worse than average.
| City: | 117 |
| U.S.: | 73 |
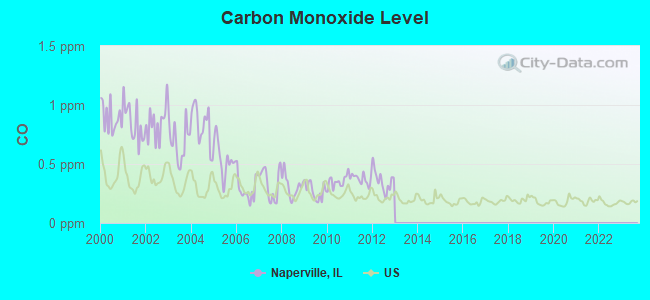
Carbon Monoxide (CO) [ppm] level in 2012 was 0.358. This is significantly worse than average. Closest monitor was 15.5 miles away from the city center.
| City: | 0.358 |
| U.S.: | 0.251 |
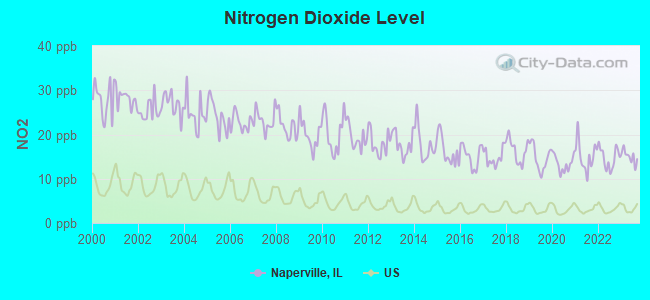
Nitrogen Dioxide (NO2) [ppb] level in 2023 was 15.0. This is significantly worse than average. Closest monitor was 7.3 miles away from the city center.
| City: | 15.0 |
| U.S.: | 5.1 |

Sulfur Dioxide (SO2) [ppb] level in 2023 was 1.39. This is about average. Closest monitor was 6.1 miles away from the city center.
| City: | 1.39 |
| U.S.: | 1.51 |
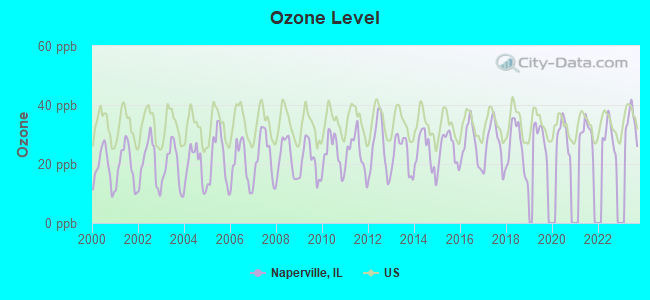
Ozone [ppb] level in 2023 was 34.3. This is about average. Closest monitor was 6.1 miles away from the city center.
| City: | 34.3 |
| U.S.: | 33.3 |
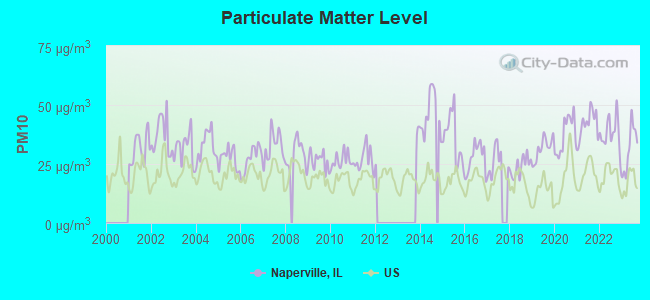
Particulate Matter (PM10) [µg/m3] level in 2023 was 31.4. This is significantly worse than average. Closest monitor was 1.5 miles away from the city center.
| City: | 31.4 |
| U.S.: | 19.2 |
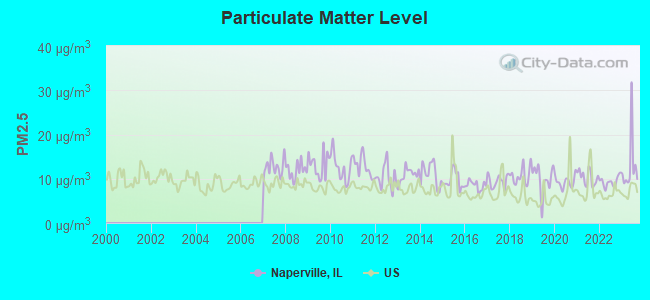
Particulate Matter (PM2.5) [µg/m3] level in 2023 was 12.8. This is significantly worse than average. Closest monitor was 1.5 miles away from the city center.
| City: | 12.8 |
| U.S.: | 8.1 |
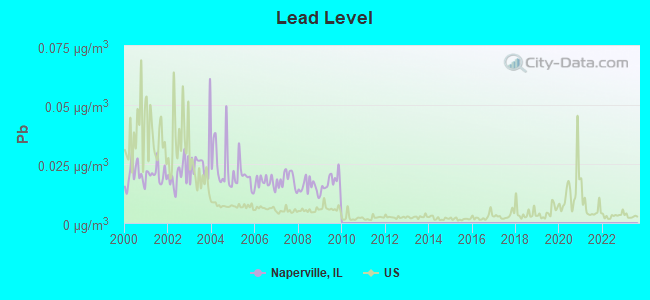
Lead (Pb) [µg/m3] level in 2009 was 0.0171. This is significantly worse than average. Closest monitor was 1.6 miles away from the city center.
| City: | 0.0171 |
| U.S.: | 0.0093 |
Tornado activity:
Naperville-area historical tornado activity is near Illinois state average. It is 53% greater than the overall U.S. average.
On 8/28/1990, a category F5 (max. wind speeds 261-318 mph) tornado 11.1 miles away from the Naperville city center killed 29 people and injured 350 people and caused between $50,000 and $500,000 in damages.
On 6/13/1976, a category F4 (max. wind speeds 207-260 mph) tornado 9.8 miles away from the city center killed 2 people and injured 23 people and caused between $500,000 and $5,000,000 in damages.
Earthquake activity:
Naperville-area historical earthquake activity is significantly above Illinois state average. It is 51% greater than the overall U.S. average.On 4/18/2008 at 09:36:59, a magnitude 5.4 (5.1 MB, 4.8 MS, 5.4 MW, 5.2 MW, Class: Moderate, Intensity: VI - VII) earthquake occurred 228.5 miles away from Naperville center
On 6/10/1987 at 23:48:54, a magnitude 5.1 (4.9 MB, 4.4 MS, 4.6 MS, 5.1 LG) earthquake occurred 203.1 miles away from the city center
On 4/18/2008 at 09:36:59, a magnitude 5.2 (5.2 MW, Depth: 8.9 mi) earthquake occurred 228.6 miles away from Naperville center
On 6/28/2004 at 06:10:52, a magnitude 4.2 (4.2 MW, Depth: 6.2 mi, Class: Light, Intensity: IV - V) earthquake occurred 43.4 miles away from the city center
On 6/18/2002 at 17:37:15, a magnitude 5.0 (4.3 MB, 4.6 MW, 5.0 LG) earthquake occurred 261.0 miles away from Naperville center
On 2/10/2010 at 09:59:35, a magnitude 3.8 (3.8 MW, Depth: 6.2 mi, Class: Light, Intensity: II - III) earthquake occurred 23.3 miles away from the city center
Magnitude types: regional Lg-wave magnitude (LG), body-wave magnitude (MB), surface-wave magnitude (MS), moment magnitude (MW)
Natural disasters:
The number of natural disasters in DuPage County (15) is near the US average (15).Major Disasters (Presidential) Declared: 10
Emergencies Declared: 4
Causes of natural disasters: Floods: 8, Storms: 8, Snowstorms: 2, Tornadoes: 2, Winter Storms: 2, Blizzard: 1, Hurricane: 1, Snow: 1, Wind: 1, Other: 1 (Note: some incidents may be assigned to more than one category).
Main business address for: FACTORY CARD OUTLET CORP (RETAIL-MISCELLANEOUS SHOPPING GOODS STORES), Calamos Asset Management, Inc. /DE/ (SECURITY BROKERS, DEALERS & FLOTATION COMPANIES), Nalco Holding CO (MISCELLANEOUS CHEMICAL PRODUCTS), Visco Products CO (MISCELLANEOUS CHEMICAL PRODUCTS), Nalco Finance Holdings LLC (MISCELLANEOUS CHEMICAL PRODUCTS), Nalco Holdings LLC (MISCELLANEOUS CHEMICAL PRODUCTS), NICOR INC (NATURAL GAS DISTRIBUTION), LAIDLAW INTERNATIONAL INC (LOCAL & SUBURBAN TRANSIT & INTERURBAN HWY PASSENGER TRAINS) and 3 other public companies.
Hospitals in Naperville:
- CENTER FOR SURGERY, THE (475 E DIEHL RD)
- EDWARD HOSPITAL (Voluntary non-profit - Private, provides emergency services, 801 SOUTH WASHINGTON)
- LINDEN OAKS HOSPITAL (provides emergency services, 801 SOUTH WASHINGTON ST)
Nursing Homes in Naperville:
- ALDEN ESTATES OF NAPERVILLE (1525 SOUTH OXFORD LANE)
- COMMUNITY CONVALESCENT CENTER (1136 N MILL STREET)
- COMMUNITY NURSING AND REHAB CTR (1136 NORTH MILL STREET)
- EDWARD HOSPITAL SKILLED NSG UNIT (801 S WASHINGTON ST)
- MANORCARE OF NAPERVILLE (200 MARTIN AVENUE)
- MEADOWBROOK MANOR - NAPERVILLE (720 RAYMOND DRIVE)
- OXFORD LANE LTD (1525 OXFORD LANE)
- ST PATRICK'S RESIDENCE (1400 BROOKDALE ROAD)
- TABOR HILLS HEALTH CARE FAC (1347 CRYSTAL COURT)
Dialysis Facilities in Naperville:
- FMC - NAPERVILLE DIALYSIS CENTER (100 SPALDING DR STE 108)
- FMC - NAPERVILLE NORTH DIALYSIS CENTER (516 W 5TH AVE.)
- SUMMIT MEDICAL CARE (640 S. WASHINGTON STREET, SUITE 110)
Home Health Centers in Naperville:
- ACCESS CARE, LLC (1100 SHERMAN AVENUE)
- ADVANCE REHAB NETWORK, INC (1240 IROQUOIS AVENUE, STE 500)
- AMMA HOME HEALTH CARE, INC (1620 PEBBLEWOOD LANE, STE 216)
- AUTUMN HOME CARE OF NAPERVILLE, INC (1030 AURORA AVENUE)
- ELITE CARE AT HOME, INC (568 S WASHINGTON STREET)
- ESSENTIAL HOME HEALTHCARE, INC (4003 PLAINFIELD/NAPERVILLE RD, STE 201)
- INNOVATIVE SENIOR CARE HOME HEALTH (1952 MCDOWELL RD, STE 207)
- LIFE CARE HOME HEALTH SERVICES LLC (2255 ERICKSON DRIVE)
- TENDER LOVING CARE HEALTHCARE SERVICES MIDWEST, LL (1230 E DIEHL ROAD, STE 202)
- TURNING POINT HOME HEALTH, INC (3580 SCOTTSDALE CIRCLE)
Airports and heliports located in Naperville:
See details about Airports and heliports located in Naperville, ILCollege/University in Naperville:
Other colleges/universities with over 2000 students near Naperville:
- Benedictine University (about 4 miles; Lisle, IL; Full-time enrollment: 5,694)
- College of DuPage (about 8 miles; Glen Ellyn, IL; FT enrollment: 18,910)
- Wheaton College (about 9 miles; Wheaton, IL; FT enrollment: 2,948)
- Aurora University (about 11 miles; Aurora, IL; FT enrollment: 4,596)
- Lewis University (about 11 miles; Romeoville, IL; FT enrollment: 5,739)
- Universal Technical Institute of Illinois Inc (about 14 miles; Glendale Heights, IL; FT enrollment: 2,281)
- Elmhurst College (about 15 miles; Elmhurst, IL; FT enrollment: 3,364)
Public high schools in Naperville:
- NEUQUA VALLEY HIGH SCHOOL (Students: 4,474, Location: 2360 95TH ST, Grades: 9-12)
- NAPERVILLE NORTH HIGH SCHOOL (Students: 3,086, Location: 899 N MILL ST, Grades: 9-12)
- NAPERVILLE CENTRAL HIGH SCHOOL (Students: 3,056, Location: 440 AURORA AVE, Grades: 9-12)
- STEPS PROGRAM (Location: 3003 103RD ST, Grades: 12)
Private high schools in Naperville:
- SS PETER & PAUL SCHOOL (Students: 620, Location: 201 E FRANKLIN AVE, Grades: KG-9)
- COVENANT CLASSICAL SCHOOL (Students: 130, Location: 2035 E 75TH ST STE B, Grades: KG-9)
- KREJCI ACADEMY (Students: 116, Location: 619 E FRANKLIN AVE, Grades: PK-12)
- CAMELOT SCHOOLS (Students: 104, Location: 1220 BOND ST, Grades: 1-12)
- NAPERVILLE CHRISTIAN ACADEMY (Students: 47, Location: 1451 RAYMOND DR STE 200, Grades: KG-11)
Biggest public elementary/middle schools in Naperville:
- SCULLEN MIDDLE SCHOOL (Students: 1,447, Location: 2815 MISTFLOWER LN, Grades: 6-8)
- CLIFFORD CRONE MIDDLE SCHOOL (Students: 1,194, Location: 4020 111TH ST, Grades: 6-8)
- GORDON GREGORY MIDDLE SCHOOL (Students: 1,132, Location: 2621 SPRINGDALE CIR, Grades: 6-8)
- THAYER J HILL MIDDLE SCHOOL (Students: 924, Location: 1836 BROOKDALE RD, Grades: 6-8)
- JEFFERSON JR HIGH SCHOOL (Students: 922, Location: 1525 N LOOMIS ST, Grades: 6-8)
- FRY ELEMENTARY SCHOOL (Students: 871, Location: 3204 TALL GRASS DR, Grades: KG-5)
- ARLENE WELCH ELEMENTARY SCHOOL (Students: 833, Location: 2620 LEVERENZ RD, Grades: KG-5)
- MADISON JR HIGH SCHOOL (Students: 797, Location: 1000 RIVER OAK DR, Grades: 6-8)
- MILL STREET ELEM SCHOOL (Students: 779, Location: 1300 N MILL ST, Grades: KG-5)
- BEEBE ELEM SCHOOL (Students: 758, Location: 110 E 11TH AVE, Grades: KG-5)
Private elementary/middle schools in Naperville:
- ALL SAINTS CATHOLIC ACADEMY (Students: 532, Location: 1155 AURORA AVE, Grades: PK-8)
- ST RAPHAEL CATHOLIC SCHOOL (Students: 310, Location: 1215 MODAFF RD, Grades: KG-8)
- CALVARY CHRISTIAN SCHOOL (Students: 283, Location: 9S200 ROUTE 59, Grades: KG-8)
- BETHANY LUTHERAN SCHOOL (Students: 258, Location: 1550 MODAFF RD, Grades: PK-8)
- DUPAGE MONTESSORI SCHOOL - NAPERVILLE (Students: 201, Location: 24W500 MAPLE AVE STE 219, Grades: PK-6)
- CHESTERBROOK ACADEMY ELEMENTARY SCHOOL (Students: 82, Location: 1571 OSWEGO RD, Grades: KG-5)
- TURNING POINTE AUTISM FOUNDATION (Students: 6, Location: 3749 TRAMORE CT, Grades: 8)
User-submitted facts and corrections:
- Northern Illinois University has a site in Naperville offering Business & IT courses including master's programs.
- we have 3 pubilc libraries, nichols library, 95th street library and the naper blvd library, also 98.3 WCCQ out of joliet comes in as just fine on the FM radio
- Jerry Hairston's brother (don't recall his name) is also a major league baseball player with the Arizona Diamondbacks.
Points of interest:
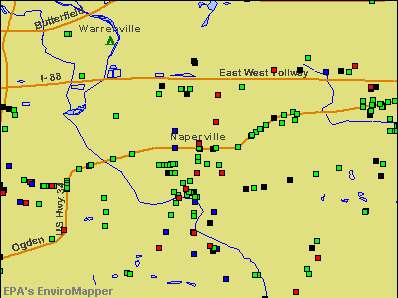
Notable locations in Naperville: Spring Brook Golf Course (A), Naperville Office Park (B), High Grove Business Park (C), Cress Creek Country Club (D), Springbrook Water Reclamation Center (E), Country Lakes Golf Course (F), White Eagle Golf Course (G), Prairie Point Business Park (H), Amoco Research Center (I), Center Point Business Park (J), Naperville Corporate Park (K), Diehl Office Campus (L), Carol Acres Commercial Park (M), Burlington Northern Industrial Park (N), Wheatland Crossing Commercial Center (O), Weston Ridge Industrial Park (P), Naperville Center for Commerce and Industry (Q), East West Technology Center (R), Bolten Hall (S), Carnegie Library (T). Display/hide their locations on the map
Shopping Centers: West Ridge Court Shopping Center (1), Pebblewood Plaza Shopping Center (2), Naperville Plaza Shopping Center (3), Naper West Plaza Shopping Center (4), Wheatland Marketplace Shopping Center (5), Jewel-Osco Shopping Center (6), Hobson West Commons Shopping Center (7), Hawthorne Square Shopping Center (8), Fox River Commons Shopping Center (9). Display/hide their locations on the map
Main business address in Naperville include: FACTORY CARD OUTLET CORP (A), Calamos Asset Management, Inc. /DE/ (B), Nalco Holding CO (C), Visco Products CO (D), Nalco Finance Holdings LLC (E), Nalco Holdings LLC (F), NICOR INC (G), LAIDLAW INTERNATIONAL INC (H). Display/hide their locations on the map
Churches in Naperville include: Brethren Church (A), Church of the Brethren (B), First Congregational Church (C), First Evangelical Church (D), Grace Evangelical Church (E), Saints Peter and Paul Roman Catholic Church (F), Zion Church (G), The Church of Jesus Christ of Latter Day Saints (H), Grace Pointe Church (I). Display/hide their locations on the map
Cemeteries: Wheatland Cemetery (1), Erb Cemetery (2), Saints Peter and Paul Cemetery (3), Zion Lutheran Church Cemetery (4), Naperville Cemetery (5). Display/hide their locations on the map
Lakes and reservoirs: Quarry Lake (A), Lake Osborne (B). Display/hide their locations on the map
Parks in Naperville include: Wil-O-Way Park (1), Arbor Way Park (2), Campus Green Park (3), Eagle Park (4), Fender County Forest Preserve (5), Gartner Park (6), Goodrich Woods County Forest Preserve (7), Hunter Woods Park (8), Ranchview Park (9). Display/hide their locations on the map
Beach: Centennial Beach (A). Display/hide its location on the map
Tourist attractions: Dupage Children's Museum (301 North Washington Street) (1), Great Odyssey Family Fun Center (Amusement & Theme Parks; 1515 Aurora Avenue) (2), Brunswick Zone-Naperville (Amusement & Theme Parks; 1515 Aurora Avenue) (3), Coriolis Effect (Arcades & Amusements; 455 Westglen Drive) (4), Fancy Free Holidays (Tours & Charters; 24W500 Maple Avenue Suite 217) (5). Display/hide their approximate locations on the map
Hotels: Fairfield Inn by Marriott (1820 Abriter Court) (1), EXEL Inns of Chicago (1585 North Naperville Wheaton R) (2), Country Inn Suites Naperville (1837 Centre Point Circle) (3), Execustay at Marriot (1112 South Washington Street) (4), Hampton Inn Chicago-Naperville (1087 Diehl Road) (5), Habitat Corporate Suites (1101 Iroquois Avenue) (6), D'Oro Suite (1495 Georgia Court Apt 101) (7), Best Western Naperville Inn (1617 North Naperville Wheaton R) (8), Executive Suites of Naperplace (608 South Washington Street) (9). Display/hide their approximate locations on the map
Birthplace of: Anthony Parker - Basketball player, Harry Kalas - Radio sports announcer, Robert Zoellick - 11th President of the World Bank Group, Dave Allen (actor) - Actor, Drew Crawford - Basketball player, J.J. Furmaniak - 2005 Major League Baseball player (Pittsburgh Pirates, born: Jul 31, 1979), Jerry Hairston Jr. - 2005 Major League Baseball player (Chicago Cubs, born: May 29, 1976), Kent Kinnear - Male tennis player, Mary Beth Marley - Figure skater, Matt Mullins - Martial artist.
Drinking water stations with addresses in Naperville and their reported violations in the past:
WORLD MISSION SOCIETY CHURCH OF GOD - SO (Population served: 150, Groundwater):Past monitoring violations:TAMARACK MEDICAL CENTER (Population served: 115, Groundwater):
- Monitoring, Repeat Major (TCR) - In SEP-2010, Contaminant: Coliform (TCR). Follow-up actions: St Compliance achieved (AUG-07-2010)
Past monitoring violations:NAPERVILLE C. C. CLUBHOUSE (Address: 25W570 CHICAGO AVENUE , Population served: 100, Groundwater):
- One regular monitoring violation
Past health violations:HOBSON CO-OP NURSERY SCHOOL (Address: 25W463 HOBSON ROAD , Population served: 40, Groundwater):
- MCL, Monthly (TCR) - Between JAN-2009 and DEC-2009, Contaminant: Coliform. Follow-up actions: St Formal NOV issued (MAR-19-2009), St Compliance achieved (MAR-25-2009)
Past monitoring violations:
- Monitoring, Repeat Major (TCR) - In DEC-2010, Contaminant: Coliform (TCR). Follow-up actions: St Compliance achieved (JAN-27-2011)
Drinking water stations with addresses in Naperville that have no violations reported:
- TAMARACK GOLF CLUB LTD (Population served: 400, Primary Water Source Type: Groundwater)
- ZION LUTHERAN CHURCH (25015) (Population served: 350, Primary Water Source Type: Groundwater)
- NAPERVILLE SPORTSMANS CLUB (Population served: 200, Primary Water Source Type: Groundwater)
- WORLD MISSION SOCIETY CHURCH OF GOD - NO (Population served: 150, Primary Water Source Type: Groundwater)
- SCIENCE OF SPIRITUALITY (Address: 4S175 NAPERVILLE ROAD , Population served: 150, Primary Water Source Type: Groundwater)
- NAPERVILLE C. C. MAINTENANCE BLDG (Address: 25W570 CHICAGO AVENUE , Population served: 100, Primary Water Source Type: Groundwater)
- NEW DAY MONTESSORI (Population served: 70, Primary Water Source Type: Groundwater)
- ISKCON TEMPLE OF GREATER CHICAGO (Population served: 30, Primary Water Source Type: Groundwater)
| This city: | 2.8 people |
| Illinois: | 2.6 people |
| This city: | 75.1% |
| Whole state: | 65.8% |
| This city: | 3.8% |
| Whole state: | 6.3% |
Likely homosexual households (counted as self-reported same-sex unmarried-partner households)
- Lesbian couples: 0.3% of all households
- Gay men: 0.2% of all households
People in group quarters in Naperville in 2010:
- 1,274 people in college/university student housing
- 1,108 people in nursing facilities/skilled-nursing facilities
- 75 people in hospitals with patients who have no usual home elsewhere
- 14 people in other noninstitutional facilities
- 7 people in group homes intended for adults
- 6 people in residential treatment centers for adults
- 5 people in residential treatment centers for juveniles (non-correctional)
People in group quarters in Naperville in 2000:
- 812 people in nursing homes
- 811 people in college dormitories (includes college quarters off campus)
- 213 people in religious group quarters
- 118 people in training schools for juvenile delinquents
- 13 people in mental (psychiatric) hospitals or wards
- 7 people in homes or halfway houses for drug/alcohol abuse
- 7 people in other noninstitutional group quarters
- 5 people in other group homes
Banks with most branches in Naperville (2011 data):
- JPMorgan Chase Bank, National Association: 9 branches. Info updated 2011/11/10: Bank assets: $1,811,678.0 mil, Deposits: $1,190,738.0 mil, headquarters in Columbus, OH, positive income, International Specialization, 5577 total offices, Holding Company: Jpmorgan Chase & Co.
- BMO Harris Bank National Association: Brighton Commons Facility, Naperville Branch, Community Service Facility, Remote Facility, Hawthorne Square Shpg Ctr Facility, Harris Bk Naperville Branch. Info updated 2011/07/14: Bank assets: $97,264.0 mil, Deposits: $75,624.6 mil, headquarters in Chicago, IL, positive income, 717 total offices, Holding Company: Bank Of Montreal
- PNC Bank, National Association: Naperville 75th Branch, Naperville South Branch, North Naperville Branch, Fox Run Branch, Naperville-Book Road Branch. Info updated 2012/03/20: Bank assets: $263,309.6 mil, Deposits: $197,343.0 mil, headquarters in Wilmington, DE, positive income, Commercial Lending Specialization, 3085 total offices, Holding Company: Pnc Financial Services Group, Inc., The
- TCF National Bank: 95th St/Rte 59 Jewel Branch #2278, Naperville Branch #2114, Ogden/Railroad Jewel Branch #2250, Ogden/Washington Jewel Branch #2252, Naper /75th St Jewel Branch #2248. Info updated 2009/11/23: Bank assets: $19,007.0 mil, Deposits: $12,377.0 mil, headquarters in Sioux Falls, SD, positive income, Commercial Lending Specialization, 441 total offices, Holding Company: Tcf Financial Corporation
- RBS Citizens, National Association: Naperville Office Branch, Naperville/Butera Branch, Naperville / Diehl Rd. Branch, Naperville Branch. Info updated 2007/09/19: Bank assets: $106,940.6 mil, Deposits: $75,690.2 mil, headquarters in Providence, RI, positive income, 1135 total offices, Holding Company: Uk Financial Investments Limited
- Bank of America, National Association: Naperville-Fort Hill And 75th Branch, Naperville Branch, Naperville Downtown Branch, Naperville South Branch. Info updated 2009/11/18: Bank assets: $1,451,969.3 mil, Deposits: $1,077,176.8 mil, headquarters in Charlotte, NC, positive income, 5782 total offices, Holding Company: Bank Of America Corporation
- Fifth Third Bank: Naperville South, Naperville Branch, Naperville East Banking Center. Info updated 2009/10/05: Bank assets: $114,540.4 mil, Deposits: $89,689.1 mil, headquarters in Cincinnati, OH, positive income, Commercial Lending Specialization, 1378 total offices, Holding Company: Fifth Third Bancorp
- U.S. Bank National Association: White Eagle Branch, Naperville Branch, Market Meadows Branch. Info updated 2012/01/30: Bank assets: $330,470.8 mil, Deposits: $236,091.5 mil, headquarters in Cincinnati, OH, positive income, 3121 total offices, Holding Company: U.S. Bancorp
- Citibank, National Association: Aurora Ave. Branch, 2775 Forgue Drive, Naperville Branch. Info updated 2012/01/10: Bank assets: $1,288,658.0 mil, Deposits: $882,541.0 mil, headquarters in Sioux Falls, SD, positive income, International Specialization, 1048 total offices, Holding Company: Citigroup Inc.
- 15 other banks with 22 local branches
For population 15 years and over in Naperville:
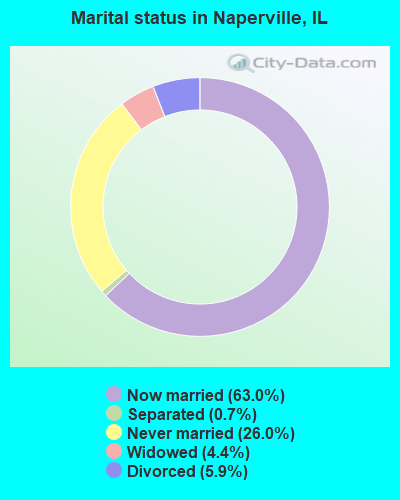
- Never married: 26.0%
- Now married: 63.0%
- Separated: 0.7%
- Widowed: 4.4%
- Divorced: 5.9%
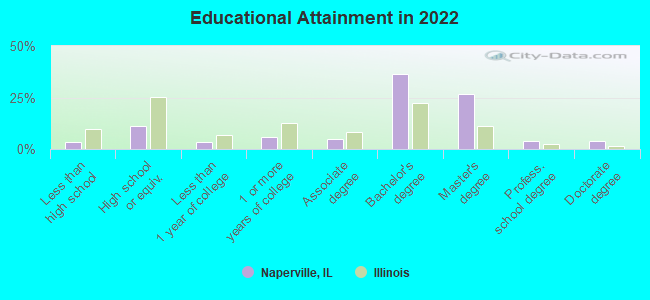
For population 25 years and over in Naperville:
- High school or higher: 96.6%
- Bachelor's degree or higher: 71.3%
- Graduate or professional degree: 35.0%
- Unemployed: 3.6%
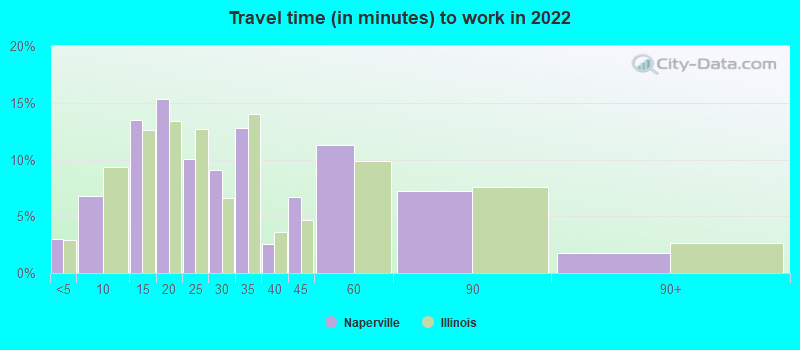
- Mean travel time to work (commute): 20.9 minutes
| Here: | 10.1 |
| Illinois average: | 12.5 |
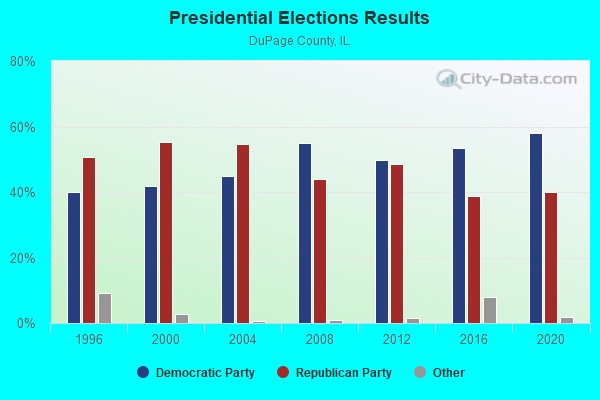
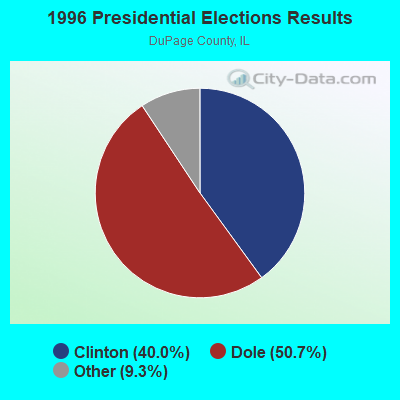
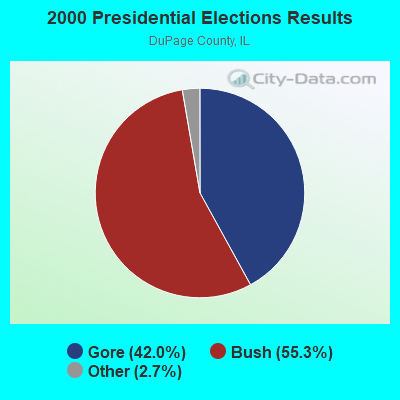
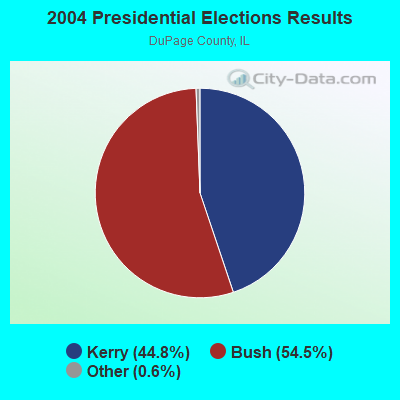
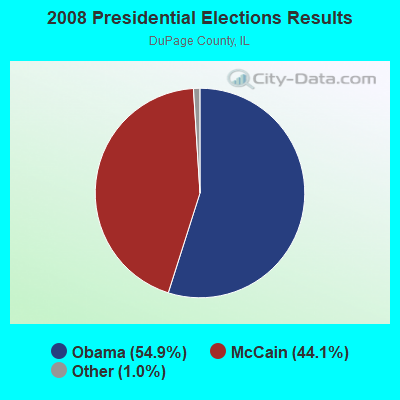
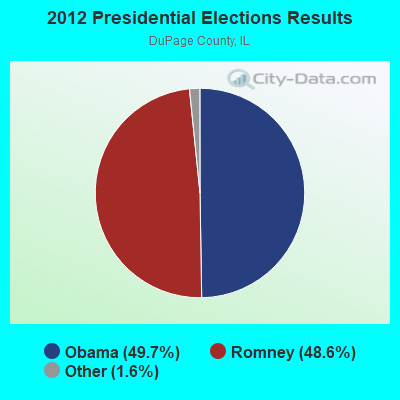
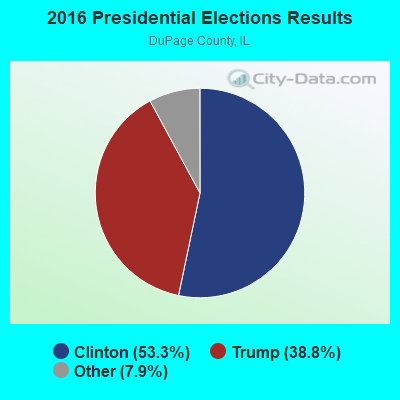
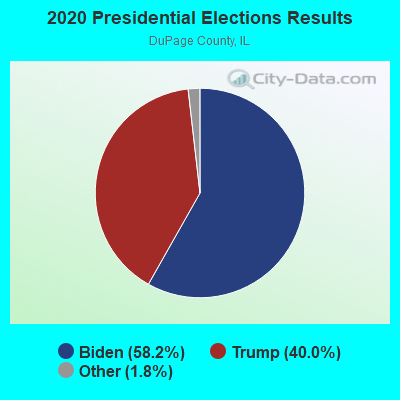
Graphs represent county-level data. Detailed 2008 Election Results
Neighborhoods in Naperville:
(Naperville, Illinois Neighborhood Map)- Ashbury neighborhood
- Autumn Run neighborhood
- Bridgewater neighborhood
- Bristol Station neighborhood
- Brook Crossing neighborhood
- Brookdale neighborhood
- Brookwood Trace neighborhood
- Brush Hill neighborhood
- Burlington Woods neighborhood
- Buttonwood neighborhood
- Century Farms neighborhood
- Century Hill neighborhood
- Chantecleer Lakes neighborhood
- Charles Place neighborhood
- Charlestone Woods neighborhood
- Cleander Farm neighborhood
- Columbia Estates neighborhood
- Country Lakes neighborhood
- Countryside neighborhood
- Cress Creek neighborhood
- Cress Creek Commons neighborhood
- Danada Woods neighborhood
- Downtown Naperville (Downtown) neighborhood
- Eagle Chase neighborhood
- East Highlands neighborhood
- Edgewood neighborhood
- Fairmeadow neighborhood
- Farmington neighborhood
- Flynn Lauth (Flynn-Lauth) neighborhood
- Fontenaix neighborhood
- Green Acres neighborhood
- Harmony Grove neighborhood
- Heritage Knolls neighborhood
- High Meadow neighborhood
- Hobson Mill neighborhood
- Hobson Village neighborhood
- Hobson West neighborhood
- Hunters Woods neighborhood
- Huntington neighborhood
- Huntington Commons neighborhood
- Huntington Estates neighborhood
- Huntington Hill neighborhood
- Huntington Ridge neighborhood
- Indian Hill neighborhood
- Kimball Mill neighborhood
- Kings Terrace neighborhood
- Kingspointe neighborhood
- Knights neighborhood
- Knolls of Huntington neighborhood
- Maple Terrace neighborhood
- Maplebrook neighborhood
- Miledje Farm neighborhood
- Naper Carriage Hill neighborhood
- Naperville Country Estates neighborhood
- Naperville Heights neighborhood
- Oak Creek neighborhood
- Old Farm neighborhood
- Olesen Estates neighborhood
- Park Place neighborhood
- Pebblewood East neighborhood
- Pebblewood Estates neighborhood
- Pembroke Commons neighborhood
- Pembrooke Greens neighborhood
- Pleasant Glen neighborhood
- Prairie Lake Manor neighborhood
- River Bend Heights neighborhood
- River Run neighborhood
- Riverbrook neighborhood
- Riverbrook West neighborhood
- Saddle Creek neighborhood
- Saybrook neighborhood
- Scots Plains neighborhood
- Signal Point neighborhood
- South Pointe neighborhood
- Spring Hill neighborhood
- Steeple Run neighborhood
- Tabor Hills neighborhood
- Tall Grass neighborhood
- Tamarack Fairways neighborhood
- University Heights neighborhood
- Washington Commons neighborhood
- West Highlands neighborhood
- Willow Way (Will-O-Way) neighborhood
- Willowbend neighborhood
- Winding Creek Estates neighborhood
- Yorkshire Manor neighborhood
Religion statistics for Naperville, IL (based on DuPage County data)
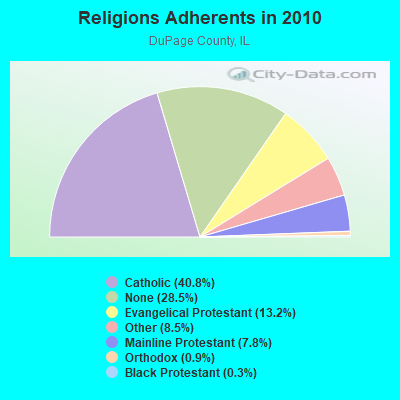
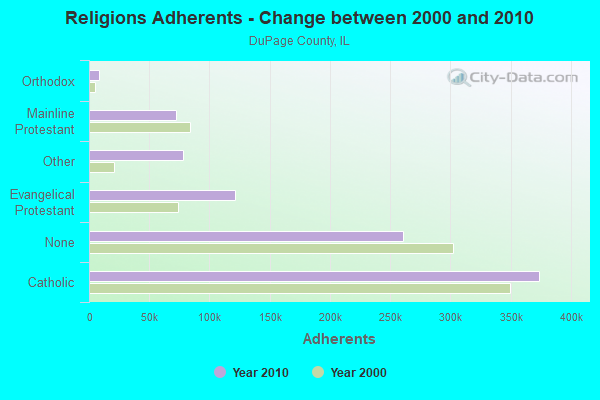
| Religion | Adherents | Congregations |
|---|---|---|
| Catholic | 373,823 | 54 |
| Evangelical Protestant | 120,953 | 247 |
| Other | 77,889 | 80 |
| Mainline Protestant | 71,909 | 126 |
| Orthodox | 8,460 | 10 |
| Black Protestant | 3,014 | 5 |
| None | 260,876 | - |
Food Environment Statistics:
| DuPage County: | 1.89 / 10,000 pop. |
| Illinois: | 2.24 / 10,000 pop. |
| This county: | 0.09 / 10,000 pop. |
| Illinois: | 0.08 / 10,000 pop. |
| This county: | 1.05 / 10,000 pop. |
| State: | 0.75 / 10,000 pop. |
| Here: | 2.16 / 10,000 pop. |
| Illinois: | 2.61 / 10,000 pop. |
| Here: | 7.24 / 10,000 pop. |
| State: | 6.86 / 10,000 pop. |
| Here: | 7.1% |
| State: | 8.3% |
| DuPage County: | 24.0% |
| State: | 25.2% |
| DuPage County: | 13.2% |
| Illinois: | 14.5% |
Health and Nutrition:
| Here: | 52.7% |
| Illinois: | 49.5% |
| Naperville: | 51.8% |
| State: | 47.2% |
| Here: | 28.2 |
| Illinois: | 28.6 |
| Naperville: | 20.3% |
| State: | 20.5% |
| Here: | 10.0% |
| State: | 10.8% |
| Naperville: | 6.8 |
| Illinois: | 6.8 |
| This city: | 33.1% |
| Illinois: | 33.4% |
| Here: | 60.0% |
| State: | 56.4% |
| Naperville: | 81.6% |
| State: | 79.9% |
More about Health and Nutrition of Naperville, IL Residents
| Local government employment and payroll (March 2022) | |||||
| Function | Full-time employees | Monthly full-time payroll | Average yearly full-time wage | Part-time employees | Monthly part-time payroll |
|---|---|---|---|---|---|
| Police Protection - Officers | 197 | $1,978,743 | $120,533 | 4 | $14,391 |
| Firefighters | 192 | $1,890,858 | $118,179 | 0 | $0 |
| Streets and Highways | 128 | $977,674 | $91,657 | 5 | $22,683 |
| Electric Power | 96 | $945,046 | $118,131 | 0 | $0 |
| Financial Administration | 82 | $540,753 | $79,135 | 0 | $0 |
| Water Supply | 80 | $619,743 | $92,961 | 0 | $0 |
| Local Libraries | 79 | $423,024 | $64,257 | 146 | $313,596 |
| Police - Other | 59 | $401,370 | $81,635 | 4 | $8,219 |
| Solid Waste Management | 35 | $142,963 | $49,016 | 1 | $1,398 |
| Parks and Recreation | 35 | $167,703 | $57,498 | 0 | $0 |
| Other Government Administration | 21 | $121,792 | $69,595 | 0 | $0 |
| Judicial and Legal | 9 | $87,783 | $117,044 | 0 | $0 |
| Totals for Government | 1,013 | $8,297,453 | $98,292 | 160 | $360,287 |
Naperville government finances - Expenditure in 2021 (per resident):
- Current Operations - Electric Utilities: $138,709,000 ($925.12)
Water Utilities: $53,414,000 ($356.25)
Police Protection: $43,212,000 ($288.20)
Local Fire Protection: $38,572,000 ($257.26)
Regular Highways: $21,762,000 ($145.14)
General - Other: $18,797,000 ($125.37)
Libraries: $14,267,000 ($95.15)
Central Staff Services: $13,709,000 ($91.43)
Parks and Recreation: $7,456,000 ($49.73)
Solid Waste Management: $6,841,000 ($45.63)
- General - Interest on Debt: $4,198,000 ($28.00)
- Other Capital Outlay - Water Utilities: $8,985,000 ($59.93)
Central Staff Services: $7,614,000 ($50.78)
- Total Salaries and Wages: $97,700,000 ($651.61)
Naperville government finances - Revenue in 2021 (per resident):
- Charges - Other: $23,509,000 ($156.79)
Solid Waste Management: $6,752,000 ($45.03)
Parks and Recreation: $149,000 ($0.99)
- Federal Intergovernmental - Other: $7,970,000 ($53.16)
- Local Intergovernmental - Other: $13,806,000 ($92.08)
- Miscellaneous - Interest Earnings: $7,252,000 ($48.37)
General Revenue - Other: $4,980,000 ($33.21)
Fines and Forfeits: $1,166,000 ($7.78)
- Revenue - Electric Utilities: $150,717,000 ($1005.21)
Water Utilities: $65,129,000 ($434.38)
- State Intergovernmental - General Local Government Support: $57,278,000 ($382.02)
Highways: $8,945,000 ($59.66)
Other: $8,000 ($0.05)
- Tax - Property: $53,337,000 ($355.73)
Public Utilities Sales: $14,764,000 ($98.47)
Other Selective Sales: $11,376,000 ($75.87)
Other License: $2,006,000 ($13.38)
Naperville government finances - Debt in 2021 (per resident):
- Long Term Debt - Beginning Outstanding - Unspecified Public Purpose: $119,755,000 ($798.71)
Outstanding Unspecified Public Purpose: $118,005,000 ($787.04)
Retired Unspecified Public Purpose: $38,175,000 ($254.61)
Issue, Unspecified Public Purpose: $36,425,000 ($242.94)
Naperville government finances - Cash and Securities in 2021 (per resident):
- Other Funds - Cash and Securities: $164,226,000 ($1095.31)
7.06% of this county's 2021 resident taxpayers lived in other counties in 2020 ($90,805 average adjusted gross income)
| Here: | 7.06% |
| Illinois average: | 5.09% |
0.01% of residents moved from foreign countries ($57 average AGI)
DuPage County: 0.01% Illinois average: 0.01%
Top counties from which taxpayers relocated into this county between 2020 and 2021:
| from Cook County, IL | |
| from Will County, IL | |
| from Kane County, IL |
8.01% of this county's 2020 resident taxpayers moved to other counties in 2021 ($102,485 average adjusted gross income)
| Here: | 8.01% |
| Illinois average: | 6.10% |
0.01% of residents moved to foreign countries ($42 average AGI)
DuPage County: 0.01% Illinois average: 0.01%
Top counties to which taxpayers relocated from this county between 2020 and 2021:
| to Cook County, IL | |
| to Will County, IL | |
| to Kane County, IL |
| Businesses in Naperville, IL | ||||
| Name | Count | Name | Count | |
|---|---|---|---|---|
| 7-Eleven | 5 | Justice | 1 | |
| ALDI | 1 | KFC | 2 | |
| AT&T | 2 | Kincaid | 1 | |
| Ace Hardware | 4 | Kmart | 1 | |
| Advance Auto Parts | 2 | LA Fitness | 2 | |
| Ann Taylor | 2 | La-Z-Boy | 2 | |
| Apple Store | 1 | Lane Furniture | 2 | |
| Arby's | 2 | Little Caesars Pizza | 2 | |
| Ashley Furniture | 1 | Lowe's | 1 | |
| Audi | 1 | Macy's | 1 | |
| AutoZone | 1 | Marriott | 4 | |
| BMW | 1 | Marshalls | 1 | |
| Bakers Square | 1 | MasterBrand Cabinets | 10 | |
| Bally Total Fitness | 1 | Mazda | 1 | |
| Barnes & Noble | 1 | McDonald's | 5 | |
| Baskin-Robbins | 4 | Men's Wearhouse | 1 | |
| Bath & Body Works | 1 | Menards | 1 | |
| Bed Bath & Beyond | 1 | Motherhood Maternity | 2 | |
| Best Western | 1 | New Balance | 5 | |
| Blockbuster | 3 | Nike | 5 | |
| Brunswick Bowling & Billiards | 1 | Nissan | 1 | |
| Budget Car Rental | 1 | Nordstrom | 1 | |
| Buffalo Wild Wings | 1 | Office Depot | 2 | |
| Burger King | 4 | OfficeMax | 1 | |
| Burlington Coat Factory | 1 | Old Country Buffet | 1 | |
| CVS | 2 | Old Navy | 1 | |
| CarMax | 1 | Olive Garden | 1 | |
| Caribou Coffee | 3 | On The Border | 1 | |
| Carson Pirie Scott | 1 | Outback | 1 | |
| Casual Male XL | 1 | Outback Steakhouse | 1 | |
| Catherines | 1 | Panera Bread | 2 | |
| Chevrolet | 1 | Payless | 1 | |
| Chico's | 1 | Penske | 1 | |
| Chipotle | 1 | PetSmart | 1 | |
| Chuck E. Cheese's | 1 | Pizza Hut | 1 | |
| Circle K | 1 | Plato's Closet | 1 | |
| Clarks | 1 | Popeyes | 1 | |
| Cold Stone Creamery | 1 | Pottery Barn | 1 | |
| Coldwater Creek | 2 | Quiznos | 2 | |
| Costco | 1 | RadioShack | 3 | |
| Cracker Barrel | 1 | Red Roof Inn | 1 | |
| Crate & Barrel | 1 | SAS Shoes | 1 | |
| Cricket Wireless | 2 | Safeway | 3 | |
| Curves | 2 | Sam's Club | 1 | |
| DHL | 2 | Sears | 2 | |
| Dairy Queen | 5 | Shoe Carnival | 1 | |
| Decora Cabinetry | 2 | Sleep Inn | 1 | |
| Discount Tire | 3 | Sprint Nextel | 1 | |
| Domino's Pizza | 1 | Staples | 2 | |
| Dunkin Donuts | 8 | Starbucks | 13 | |
| Eddie Bauer | 1 | Steak 'n Shake | 1 | |
| Ethan Allen | 1 | Subaru | 1 | |
| Extended Stay America | 1 | Subway | 12 | |
| FedEx | 21 | T-Mobile | 5 | |
| Firestone Complete Auto Care | 1 | T.J.Maxx | 1 | |
| Ford | 1 | Taco Bell | 3 | |
| GNC | 3 | Talbots | 1 | |
| GameStop | 2 | Target | 1 | |
| Gap | 1 | Toyota | 1 | |
| H&R Block | 5 | Toys"R"Us | 1 | |
| Hilton | 1 | Trader Joe's | 1 | |
| Holiday Inn | 1 | U-Haul | 3 | |
| Home Depot | 1 | U.S. Cellular | 1 | |
| Homestead Studio Suites | 1 | UPS | 28 | |
| Houlihan's | 1 | Verizon Wireless | 2 | |
| J. Jill | 1 | Volkswagen | 1 | |
| Jamba Juice | 1 | Vons | 3 | |
| Jewel-Osco | 4 | Walgreens | 7 | |
| Jimmy John's | 3 | Walmart | 1 | |
| JoS. A. Bank | 1 | Wendy's | 5 | |
| Johnny Rockets | 1 | Whole Foods Market | 1 | |
| Jones New York | 2 | YMCA | 5 | |
Strongest AM radio stations in Naperville:
- WMVP (1000 AM; 50 kW; CHICAGO, IL; Owner: ABC, INC.)
- WSCR (670 AM; 50 kW; CHICAGO, IL; Owner: INFINITY BROADCASTING OPERATIONS, INC.)
- WYLL (1160 AM; 50 kW; CHICAGO, IL; Owner: SCA LICENSE CORPORATION)
- WBBM (780 AM; 50 kW; CHICAGO, IL; Owner: INFINITY BROADCASTING OPERATIONS, INC.)
- WGN (720 AM; 50 kW; CHICAGO, IL; Owner: WGN CONTINENTAL BROADCASTING CO.)
- WLS (890 AM; 50 kW; CHICAGO, IL; Owner: WLS, INC.)
- WBIG (1280 AM; 1 kW; AURORA, IL; Owner: BIG BROADCASTING COMAPNY, INC.)
- WVIV (1200 AM; 20 kW; CHICAGO, IL; Owner: WLXX-AM LICENSE CORP.)
- WMBI (1110 AM; daytime; 5 kW; CHICAGO, IL; Owner: THE MOODY BIBLE INSTITUTE OF CHICAGO)
- WTMJ (620 AM; 50 kW; MILWAUKEE, WI; Owner: JOURNAL BROADCAST CORPORATION)
- WAUR (930 AM; 4 kW; SANDWICH, IL; Owner: CHRISTIAN BROADCASTING SYSTEM, LTD.)
- WCSN (820 AM; 5 kW; CHICAGO, IL; Owner: WYPA, INC.)
- WISN (1130 AM; 50 kW; MILWAUKEE, WI; Owner: CAPSTAR TX LIMITED PARTNERSHIP)
Strongest FM radio stations in Naperville:
- WERV-FM (95.9 FM; AURORA, IL; Owner: NM LICENSING, LLC)
- WONC (89.1 FM; NAPERVILLE, IL; Owner: NORTH CENTRAL COLLEGE)
- WLEY-FM (107.9 FM; AURORA, IL; Owner: WLEY LICENSING, INC.)
- WDCB (90.9 FM; GLEN ELLYN, IL; Owner: COLLEGE OF DU PAGE, DISTRICT 502)
- WCKG (105.9 FM; ELMWOOD PARK, IL; Owner: INFINITY HOLDINGS CORPORATION OF ORLANDO)
- WLIT-FM (93.9 FM; CHICAGO, IL; Owner: AMFM RADIO LICENSES, L.L.C.)
- WJMK (104.3 FM; CHICAGO, IL; Owner: INFINITY BROADCASTING CORP. OF ILLINOIS)
- WNUA (95.5 FM; CHICAGO, IL; Owner: AMFM RADIO LICENSES, L.L.C.)
- WTMX (101.9 FM; SKOKIE, IL; Owner: BONNEVILLE HOLDING COMPANY)
- WBBM-FM (96.3 FM; CHICAGO, IL; Owner: INFINITY BROADCASTING OPERATIONS, INC.)
- WGCI-FM (107.5 FM; CHICAGO, IL; Owner: AMFM RADIO LICENSES, L.L.C.)
- WKSC-FM (103.5 FM; CHICAGO, IL; Owner: AMFM RADIO LICENSES, L.L.C.)
- WFMT (98.7 FM; CHICAGO, IL; Owner: WINDOW TO THE WORLD COMMUNICATIONS)
- WZZN (94.7 FM; CHICAGO, IL; Owner: ABC CHICAGO FM RADIO,INC.)
- WBEZ (91.5 FM; CHICAGO, IL; Owner: THE WBEZ ALLIANCE, INC.)
- WKQX (101.1 FM; CHICAGO, IL; Owner: EMMIS RADIO LICENSE CORPORATION)
- WLUP-FM (97.9 FM; CHICAGO, IL; Owner: BONNEVILLE HOLDING COMPANY)
- WNND (100.3 FM; CHICAGO, IL; Owner: BONNEVILLE HOLDING COMPANY)
- WOJO (105.1 FM; EVANSTON, IL; Owner: TICHENOR LICENSE CORPORATION ("TLC"))
- WUSN (99.5 FM; CHICAGO, IL; Owner: INFINITY BROADCASTING CORPORATION OF CHICAGO)
TV broadcast stations around Naperville:
- W24AJ (Channel 24; AURORA, IL; Owner: NELSON TV, INC.)
- WLS-TV (Channel 7; CHICAGO, IL; Owner: WLS TELEVISION, INC.)
- WMAQ-TV (Channel 5; CHICAGO, IL; Owner: NBC SUBSIDIARY (WMAQ-TV), INC.)
- WTTW (Channel 11; CHICAGO, IL; Owner: WINDOW TO THE WORLD COMMUNICATIONS, INC.)
- WGN-TV (Channel 9; CHICAGO, IL; Owner: WGN CONTINENTAL BROADCASTING COMPANY)
- WGBO-TV (Channel 66; JOLIET, IL; Owner: WGBO LICENSE PARTNERSHIP, G.P.)
- WBBM-TV (Channel 2; CHICAGO, IL; Owner: CBS BROADCASTING INC.)
- WPWR-TV (Channel 50; GARY, IN; Owner: FOX TELEVISION STATIONS, INC.)
- W34CK (Channel 34; ARLINGTON HEIGHTS, IL; Owner: FIRST UNITED, INC.)
- WXFT (Channel 60; AURORA, IL; Owner: TELEFUTURA CHICAGO LLC)
- WCIU-TV (Channel 26; CHICAGO, IL; Owner: WCIU-TV LIMITED PARTNERSHIP)
- WCPX (Channel 38; CHICAGO, IL; Owner: PAXSON CHICAGO LICENSE, INC.)
- WFLD (Channel 32; CHICAGO, IL; Owner: FOX TELEVISION STATIONS, INC.)
- W68DO (Channel 68; PALATINE, IL; Owner: TRINITY BROADCASTING NETWORK)
- WFBT-CA (Channel 23; CHICAGO, IL; Owner: CHANNEL 23 LIMITED PARTNERSHIP)
- WJYS (Channel 62; HAMMOND, IN; Owner: JOVON BROADCASTING CORPORATION)
- WSNS-TV (Channel 44; CHICAGO, IL; Owner: TELEMUNDO OF CHICAGO, INC.)
- WOCH-LP (Channel 28; CHICAGO, IL; Owner: KM LPTV OF CHICAGO-28, L.L.C.)
- WYCC (Channel 20; CHICAGO, IL; Owner: COLLEGE DIST. #508, COUNTY OF COOK)
- WOCK-CA (Channel 13; CHICAGO, IL; Owner: KM LPTV OF CHICAGO-13, L.L.C.)
- W57DN (Channel 57; ELGIN, IL; Owner: TRINITY BROADCASTING NETWORK)
- WYIN (Channel 56; GARY, IN; Owner: NORTHWEST INDIANA PUBLIC BROADCASTING, INC.)
- W64CQ (Channel 64; ARLINGTON HEIGHTS, IL; Owner: TRINITY BROADCASTING NETWORK)
- WSPY-LP (Channel 30; PLANO, IL; Owner: WSPY-TV, INC.)
- W54AP (Channel 54; BLUE ISLAND, IL; Owner: CATHOLIC VIEWS BROADCASTS, INC.)
- National Bridge Inventory (NBI) Statistics
- 47Number of bridges
- 479ft / 146mTotal length
- $5,102,000Total costs
- 1,609,125Total average daily traffic
- 269,891Total average daily truck traffic
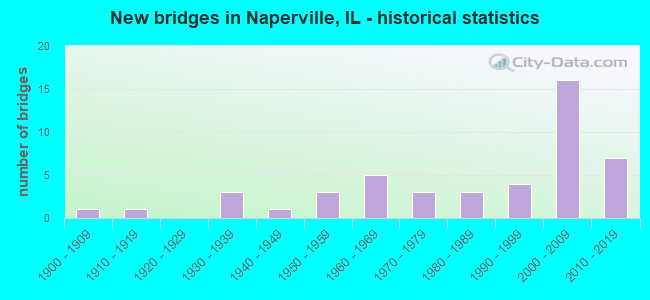
- New bridges - historical statistics
- 11900-1909
- 11910-1919
- 31930-1939
- 11940-1949
- 31950-1959
- 51960-1969
- 31970-1979
- 31980-1989
- 41990-1999
- 162000-2009
- 72010-2019
FCC Registered Commercial Land Mobile Towers: 1 (See the full list of FCC Registered Commercial Land Mobile Towers in Naperville, IL)
FCC Registered Private Land Mobile Towers: 3 (See the full list of FCC Registered Private Land Mobile Towers)
FCC Registered Broadcast Land Mobile Towers: 93 (See the full list of FCC Registered Broadcast Land Mobile Towers)
FCC Registered Microwave Towers: 159 (See the full list of FCC Registered Microwave Towers in this town)
FCC Registered Paging Towers: 4 (See the full list of FCC Registered Paging Towers)
FCC Registered Amateur Radio Licenses: 626 (See the full list of FCC Registered Amateur Radio Licenses in Naperville)
FAA Registered Aircraft: 160 (See the full list of FAA Registered Aircraft in Naperville)
| Home Mortgage Disclosure Act Aggregated Statistics For Year 2009 (Based on 6 full and 16 partial tracts) | ||||||||||||||
| A) FHA, FSA/RHS & VA Home Purchase Loans | B) Conventional Home Purchase Loans | C) Refinancings | D) Home Improvement Loans | E) Loans on Dwellings For 5+ Families | F) Non-occupant Loans on < 5 Family Dwellings (A B C & D) | G) Loans On Manufactured Home Dwelling (A B C & D) | ||||||||
|---|---|---|---|---|---|---|---|---|---|---|---|---|---|---|
| Number | Average Value | Number | Average Value | Number | Average Value | Number | Average Value | Number | Average Value | Number | Average Value | Number | Average Value | |
| LOANS ORIGINATED | 285 | $239,878 | 712 | $297,155 | 5,164 | $260,159 | 121 | $171,799 | 1 | $943,270 | 126 | $216,674 | 13 | $264,042 |
| APPLICATIONS APPROVED, NOT ACCEPTED | 14 | $247,868 | 67 | $380,526 | 348 | $277,953 | 19 | $82,415 | 0 | $0 | 11 | $180,842 | 1 | $201,100 |
| APPLICATIONS DENIED | 50 | $227,264 | 73 | $337,765 | 811 | $293,923 | 35 | $96,763 | 0 | $0 | 38 | $203,020 | 0 | $0 |
| APPLICATIONS WITHDRAWN | 17 | $194,594 | 57 | $287,975 | 538 | $270,574 | 13 | $225,154 | 0 | $0 | 16 | $222,289 | 0 | $0 |
| FILES CLOSED FOR INCOMPLETENESS | 12 | $228,001 | 16 | $303,103 | 192 | $272,276 | 5 | $195,136 | 0 | $0 | 6 | $179,807 | 0 | $0 |
Detailed mortgage data for all 21 tracts in Naperville, IL
| Private Mortgage Insurance Companies Aggregated Statistics For Year 2009 (Based on 6 full and 16 partial tracts) | ||||
| A) Conventional Home Purchase Loans | B) Refinancings | |||
|---|---|---|---|---|
| Number | Average Value | Number | Average Value | |
| LOANS ORIGINATED | 112 | $277,858 | 84 | $273,286 |
| APPLICATIONS APPROVED, NOT ACCEPTED | 21 | $274,615 | 31 | $294,218 |
| APPLICATIONS DENIED | 16 | $259,966 | 29 | $279,703 |
| APPLICATIONS WITHDRAWN | 7 | $189,400 | 16 | $276,157 |
| FILES CLOSED FOR INCOMPLETENESS | 5 | $281,160 | 2 | $281,355 |

2002 - 2018 National Fire Incident Reporting System (NFIRS) incidents
- Fire incident types reported to NFIRS in Naperville, IL
- 1,79143.4%Outside Fires
- 1,63939.7%Structure Fires
- 60014.5%Mobile Property/Vehicle Fires
- 982.4%Other
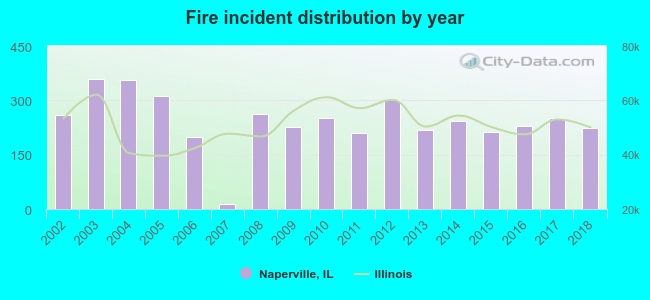 Based on the data from the years 2002 - 2018 the average number of fire incidents per year is 243. The highest number of fires - 359 took place in 2003, and the least - 14 in 2007. The data has a decreasing trend.
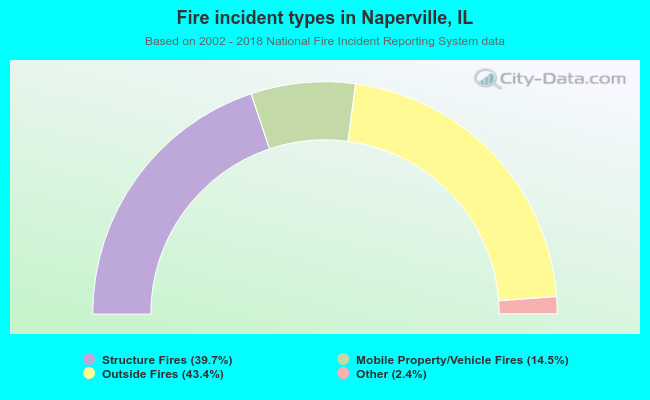 When looking into fire subcategories, the most reports belonged to: Outside Fires (43.4%), and Structure Fires (39.7%).
Fire-safe hotels and motels in Naperville, Illinois:
- Travelodge, 1585 Naperville Wheaton Rd, Naperville, Illinois 60563 , Phone: (630) 357-0022, Fax: (630) 357-9817
- Courtyard Inn By Marriott, 1155 E Diehl Rd, Naperville, Illinois 60563 , Phone: (630) 505-0550
- Country Inn & Suites By Carlson, 1837 Ctr Point Cir, Naperville, Illinois 60563 , Phone: (630) 505-3353, Fax: (630) 505-0176
- Travelodge, 1617 N Naperville Wheaton Rd, Naperville, Illinois 60563 , Phone: (630) 505-0200, Fax: (630) 505-0200
- Chicago Marriott Naperville, 1801 N Naper Blvd, Naperville, Illinois 60563 , Phone: (630) 505-4900, Fax: (630) 687-6561
- Extended Stay America - Chicago - Naperville - West, 1575 Bond St, Naperville, Illinois 60563 , Phone: (630) 983-0000, Fax: (630) 983-8088
- Fairfield Inn By Marriott Naperville, 1820 Abriter CT, Naperville, Illinois 60563 , Phone: (630) 577-1820
- Extended Stay America - Chicago - Naperville - East, 1827 Ctr Point Dr, Naperville, Illinois 60563 , Phone: (603) 577-0200, Fax: (603) 577-0260
- 8 other hotels and motels
| Most common first names in Naperville, IL among deceased individuals | ||
| Name | Count | Lived (average) |
|---|---|---|
| John | 366 | 75.8 years |
| Mary | 357 | 81.6 years |
| Helen | 233 | 85.0 years |
| Robert | 225 | 73.0 years |
| William | 225 | 74.6 years |
| James | 204 | 72.4 years |
| Margaret | 185 | 80.1 years |
| Joseph | 182 | 78.5 years |
| Dorothy | 163 | 81.7 years |
| Edward | 158 | 76.8 years |
| Most common last names in Naperville, IL among deceased individuals | ||
| Last name | Count | Lived (average) |
|---|---|---|
| Johnson | 75 | 80.0 years |
| Miller | 66 | 80.4 years |
| Smith | 65 | 75.9 years |
| Brown | 54 | 74.4 years |
| Anderson | 53 | 73.4 years |
| Martin | 36 | 82.6 years |
| Nelson | 35 | 78.2 years |
| Schultz | 30 | 79.6 years |
| Novak | 27 | 79.7 years |
| Peterson | 27 | 81.7 years |
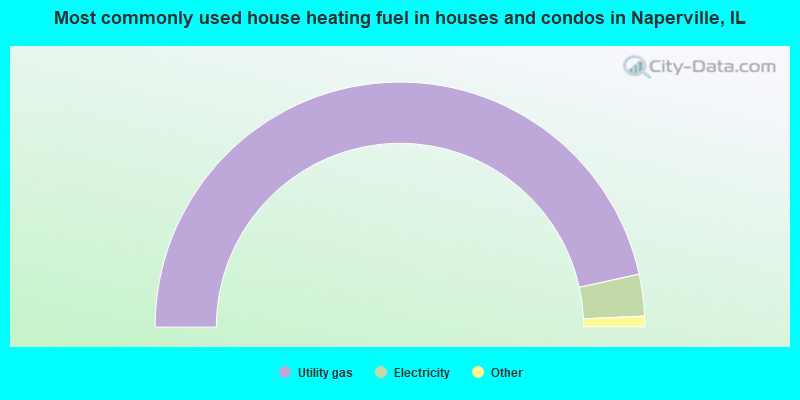
- 93.1%Utility gas
- 5.5%Electricity
- 0.9%Bottled, tank, or LP gas
- 0.3%No fuel used
- 0.2%Other fuel
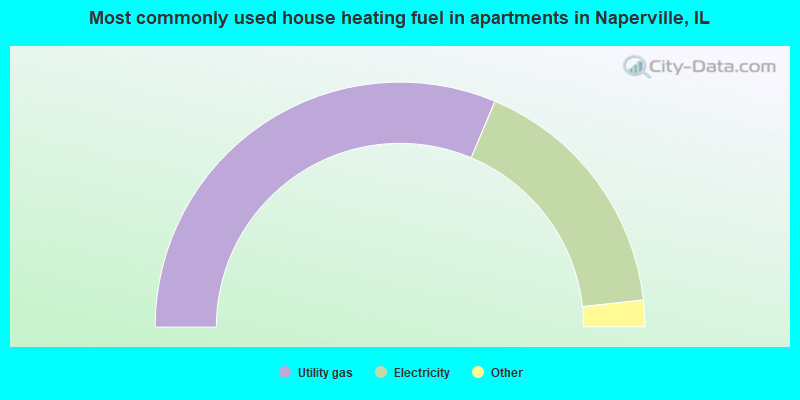
- 62.7%Utility gas
- 33.8%Electricity
- 1.5%Bottled, tank, or LP gas
- 1.3%No fuel used
- 0.7%Other fuel
Naperville compared to Illinois state average:
- Median household income above state average.
- Median house value above state average.
- Unemployed percentage significantly below state average.
- Black race population percentage below state average.
- Hispanic race population percentage below state average.
- Foreign-born population percentage above state average.
- Length of stay since moving in below state average.
- Number of rooms per house above state average.
- House age below state average.
- Percentage of population with a bachelor's degree or higher significantly above state average.
Naperville, IL compared to other similar cities:
Naperville on our top lists:
- #7 on the list of "Top 101 cities with the largest racial income disparity between any two races with at least 2,000 householders"
- #8 on the list of "Top 101 cities with the least people below 50% of the poverty level (population 50,000+)"
- #9 on the list of "Top 101 cities with the lowest percentage of single-parent households, population 50,000+"
- #11 on the list of "Top 101 cities with the lowest number of auto thefts per 100,000 residents (population 50,000+)"
- #11 on the list of "Top 100 cities with biggest houses (pop. 50,000+)"
- #12 on the list of "Top 101 cities with the lowest number of burglaries per 100,000 residents (population 50,000+)"
- #18 on the list of "Top 100 safest cities (lowest city-data.com crime index) (pop. 50,000+)"
- #20 on the list of "Top 101 cities with the lowest city-data.com crime index (population 50,000+)"
- #21 on the list of "Top 100 cities with highest median household income (pop. 50,000+)"
- #24 on the list of "Top 101 cities with the least people below the poverty level (population 50,000+)"
- #25 on the list of "Top 101 cities with largest percentage of males in occupations: management occupations (population 50,000+)"
- #28 on the list of "Top 101 cities with largest percentage of females in occupations: computer and mathematical occupations (population 50,000+)"
- #28 on the list of "Top 100 best educated cities (highest percentage of bachelor degree holding residents) (pop. 50,000+)"
- #32 on the list of "Top 101 cities with the most people having Master's or Doctorate degrees (population 50,000+)"
- #33 on the list of "Top 101 cities with the most local government spending on current operations of libraries per resident (population 10,000+)"
- #34 on the list of "Top 101 cities with the lowest number of rapes per 100,000 residents (population 50,000+)"
- #38 on the list of "Top 101 cities with the lowest number of robberies per 100,000 residents (population 50,000+)"
- #38 on the list of "Top 101 cities with largest percentage of males in occupations: business and financial operations occupations (population 50,000+)"
- #41 on the list of "Top 101 cities with largest percentage of females in occupations: fire fighting and prevention workers including supervisors (population 50,000+)"
- #42 on the list of "Top 101 cities with largest percentage of males in industries: professional, scientific, and technical services (population 50,000+)"
- #14 on the list of "Top 101 counties with the largest number of people without health insurance coverage in 2000 (pop. 50,000+)"
- #19 on the list of "Top 101 counties with the highest percentage of residents that visited a dentist within the past year"
- #23 on the list of "Top 101 counties with the most Catholic adherents"
- #25 on the list of "Top 101 counties with the best general health status score of residents (1-5), 3 years of data"
- #26 on the list of "Top 101 counties with the largest number of children under 18 without health insurance coverage in 2000 (pop. 50,000+)"

|
|
Total of 5022 patent applications in 2008-2024.