Bolingbrook, Illinois Submit your own pictures of this village and show them to the world
OSM Map
General Map
Google Map
MSN Map
OSM Map
General Map
Google Map
MSN Map
OSM Map
General Map
Google Map
MSN Map
OSM Map
General Map
Google Map
MSN Map
Please wait while loading the map...
Population in 2022: 74,031 (100% urban, 0% rural). Population change since 2000: +31.4%Males: 37,251 Females: 36,780
March 2022 cost of living index in Bolingbrook: 101.6 (near average, U.S. average is 100) Percentage of residents living in poverty in 2022: 8.6%for White Non-Hispanic residents , 24.9% for Black residents , 4.6% for Hispanic or Latino residents , 5.4% for American Indian residents , 5.0% for other race residents , 6.4% for two or more races residents )
Profiles of local businesses
Business Search - 14 Million verified businesses
Data:
Median household income ($)
Median household income (% change since 2000)
Household income diversity
Ratio of average income to average house value (%)
Ratio of average income to average rent
Median household income ($) - White
Median household income ($) - Black or African American
Median household income ($) - Asian
Median household income ($) - Hispanic or Latino
Median household income ($) - American Indian and Alaska Native
Median household income ($) - Multirace
Median household income ($) - Other Race
Median household income for houses/condos with a mortgage ($)
Median household income for apartments without a mortgage ($)
Races - White alone (%)
Races - White alone (% change since 2000)
Races - Black alone (%)
Races - Black alone (% change since 2000)
Races - American Indian alone (%)
Races - American Indian alone (% change since 2000)
Races - Asian alone (%)
Races - Asian alone (% change since 2000)
Races - Hispanic (%)
Races - Hispanic (% change since 2000)
Races - Native Hawaiian and Other Pacific Islander alone (%)
Races - Native Hawaiian and Other Pacific Islander alone (% change since 2000)
Races - Two or more races (%)
Races - Two or more races (% change since 2000)
Races - Other race alone (%)
Races - Other race alone (% change since 2000)
Racial diversity
Unemployment (%)
Unemployment (% change since 2000)
Unemployment (%) - White
Unemployment (%) - Black or African American
Unemployment (%) - Asian
Unemployment (%) - Hispanic or Latino
Unemployment (%) - American Indian and Alaska Native
Unemployment (%) - Multirace
Unemployment (%) - Other Race
Population density (people per square mile)
Population - Males (%)
Population - Females (%)
Population - Males (%) - White
Population - Males (%) - Black or African American
Population - Males (%) - Asian
Population - Males (%) - Hispanic or Latino
Population - Males (%) - American Indian and Alaska Native
Population - Males (%) - Multirace
Population - Males (%) - Other Race
Population - Females (%) - White
Population - Females (%) - Black or African American
Population - Females (%) - Asian
Population - Females (%) - Hispanic or Latino
Population - Females (%) - American Indian and Alaska Native
Population - Females (%) - Multirace
Population - Females (%) - Other Race
Coronavirus confirmed cases (Apr 27, 2024)
Deaths caused by coronavirus (Apr 27, 2024)
Coronavirus confirmed cases (per 100k population) (Apr 27, 2024)
Deaths caused by coronavirus (per 100k population) (Apr 27, 2024)
Daily increase in number of cases (Apr 27, 2024)
Weekly increase in number of cases (Apr 27, 2024)
Cases doubled (in days) (Apr 27, 2024)
Hospitalized patients (Apr 18, 2022)
Negative test results (Apr 18, 2022)
Total test results (Apr 18, 2022)
COVID Vaccine doses distributed (per 100k population) (Sep 19, 2023)
COVID Vaccine doses administered (per 100k population) (Sep 19, 2023)
COVID Vaccine doses distributed (Sep 19, 2023)
COVID Vaccine doses administered (Sep 19, 2023)
Likely homosexual households (%)
Likely homosexual households (% change since 2000)
Likely homosexual households - Lesbian couples (%)
Likely homosexual households - Lesbian couples (% change since 2000)
Likely homosexual households - Gay men (%)
Likely homosexual households - Gay men (% change since 2000)
Cost of living index
Median gross rent ($)
Median contract rent ($)
Median monthly housing costs ($)
Median house or condo value ($)
Median house or condo value ($ change since 2000)
Mean house or condo value by units in structure - 1, detached ($)
Mean house or condo value by units in structure - 1, attached ($)
Mean house or condo value by units in structure - 2 ($)
Mean house or condo value by units in structure by units in structure - 3 or 4 ($)
Mean house or condo value by units in structure - 5 or more ($)
Mean house or condo value by units in structure - Boat, RV, van, etc. ($)
Mean house or condo value by units in structure - Mobile home ($)
Median house or condo value ($) - White
Median house or condo value ($) - Black or African American
Median house or condo value ($) - Asian
Median house or condo value ($) - Hispanic or Latino
Median house or condo value ($) - American Indian and Alaska Native
Median house or condo value ($) - Multirace
Median house or condo value ($) - Other Race
Median resident age
Resident age diversity
Median resident age - Males
Median resident age - Females
Median resident age - White
Median resident age - Black or African American
Median resident age - Asian
Median resident age - Hispanic or Latino
Median resident age - American Indian and Alaska Native
Median resident age - Multirace
Median resident age - Other Race
Median resident age - Males - White
Median resident age - Males - Black or African American
Median resident age - Males - Asian
Median resident age - Males - Hispanic or Latino
Median resident age - Males - American Indian and Alaska Native
Median resident age - Males - Multirace
Median resident age - Males - Other Race
Median resident age - Females - White
Median resident age - Females - Black or African American
Median resident age - Females - Asian
Median resident age - Females - Hispanic or Latino
Median resident age - Females - American Indian and Alaska Native
Median resident age - Females - Multirace
Median resident age - Females - Other Race
Commute - mean travel time to work (minutes)
Travel time to work - Less than 5 minutes (%)
Travel time to work - Less than 5 minutes (% change since 2000)
Travel time to work - 5 to 9 minutes (%)
Travel time to work - 5 to 9 minutes (% change since 2000)
Travel time to work - 10 to 19 minutes (%)
Travel time to work - 10 to 19 minutes (% change since 2000)
Travel time to work - 20 to 29 minutes (%)
Travel time to work - 20 to 29 minutes (% change since 2000)
Travel time to work - 30 to 39 minutes (%)
Travel time to work - 30 to 39 minutes (% change since 2000)
Travel time to work - 40 to 59 minutes (%)
Travel time to work - 40 to 59 minutes (% change since 2000)
Travel time to work - 60 to 89 minutes (%)
Travel time to work - 60 to 89 minutes (% change since 2000)
Travel time to work - 90 or more minutes (%)
Travel time to work - 90 or more minutes (% change since 2000)
Marital status - Never married (%)
Marital status - Now married (%)
Marital status - Separated (%)
Marital status - Widowed (%)
Marital status - Divorced (%)
Median family income ($)
Median family income (% change since 2000)
Median non-family income ($)
Median non-family income (% change since 2000)
Median per capita income ($)
Median per capita income (% change since 2000)
Median family income ($) - White
Median family income ($) - Black or African American
Median family income ($) - Asian
Median family income ($) - Hispanic or Latino
Median family income ($) - American Indian and Alaska Native
Median family income ($) - Multirace
Median family income ($) - Other Race
Median year house/condo built
Median year apartment built
Year house built - Built 2005 or later (%)
Year house built - Built 2000 to 2004 (%)
Year house built - Built 1990 to 1999 (%)
Year house built - Built 1980 to 1989 (%)
Year house built - Built 1970 to 1979 (%)
Year house built - Built 1960 to 1969 (%)
Year house built - Built 1950 to 1959 (%)
Year house built - Built 1940 to 1949 (%)
Year house built - Built 1939 or earlier (%)
Average household size
Household density (households per square mile)
Average household size - White
Average household size - Black or African American
Average household size - Asian
Average household size - Hispanic or Latino
Average household size - American Indian and Alaska Native
Average household size - Multirace
Average household size - Other Race
Occupied housing units (%)
Vacant housing units (%)
Owner occupied housing units (%)
Renter occupied housing units (%)
Vacancy status - For rent (%)
Vacancy status - For sale only (%)
Vacancy status - Rented or sold, not occupied (%)
Vacancy status - For seasonal, recreational, or occasional use (%)
Vacancy status - For migrant workers (%)
Vacancy status - Other vacant (%)
Residents with income below the poverty level (%)
Residents with income below 50% of the poverty level (%)
Children below poverty level (%)
Poor families by family type - Married-couple family (%)
Poor families by family type - Male, no wife present (%)
Poor families by family type - Female, no husband present (%)
Poverty status for native-born residents (%)
Poverty status for foreign-born residents (%)
Poverty among high school graduates not in families (%)
Poverty among people who did not graduate high school not in families (%)
Residents with income below the poverty level (%) - White
Residents with income below the poverty level (%) - Black or African American
Residents with income below the poverty level (%) - Asian
Residents with income below the poverty level (%) - Hispanic or Latino
Residents with income below the poverty level (%) - American Indian and Alaska Native
Residents with income below the poverty level (%) - Multirace
Residents with income below the poverty level (%) - Other Race
Air pollution - Air Quality Index (AQI)
Air pollution - CO
Air pollution - NO2
Air pollution - SO2
Air pollution - Ozone
Air pollution - PM10
Air pollution - PM25
Air pollution - Pb
Crime - Murders per 100,000 population
Crime - Rapes per 100,000 population
Crime - Robberies per 100,000 population
Crime - Assaults per 100,000 population
Crime - Burglaries per 100,000 population
Crime - Thefts per 100,000 population
Crime - Auto thefts per 100,000 population
Crime - Arson per 100,000 population
Crime - City-data.com crime index
Crime - Violent crime index
Crime - Property crime index
Crime - Murders per 100,000 population (5 year average)
Crime - Rapes per 100,000 population (5 year average)
Crime - Robberies per 100,000 population (5 year average)
Crime - Assaults per 100,000 population (5 year average)
Crime - Burglaries per 100,000 population (5 year average)
Crime - Thefts per 100,000 population (5 year average)
Crime - Auto thefts per 100,000 population (5 year average)
Crime - Arson per 100,000 population (5 year average)
Crime - City-data.com crime index (5 year average)
Crime - Violent crime index (5 year average)
Crime - Property crime index (5 year average)
1996 Presidential Elections Results (%) - Democratic Party (Clinton)
1996 Presidential Elections Results (%) - Republican Party (Dole)
1996 Presidential Elections Results (%) - Other
2000 Presidential Elections Results (%) - Democratic Party (Gore)
2000 Presidential Elections Results (%) - Republican Party (Bush)
2000 Presidential Elections Results (%) - Other
2004 Presidential Elections Results (%) - Democratic Party (Kerry)
2004 Presidential Elections Results (%) - Republican Party (Bush)
2004 Presidential Elections Results (%) - Other
2008 Presidential Elections Results (%) - Democratic Party (Obama)
2008 Presidential Elections Results (%) - Republican Party (McCain)
2008 Presidential Elections Results (%) - Other
2012 Presidential Elections Results (%) - Democratic Party (Obama)
2012 Presidential Elections Results (%) - Republican Party (Romney)
2012 Presidential Elections Results (%) - Other
2016 Presidential Elections Results (%) - Democratic Party (Clinton)
2016 Presidential Elections Results (%) - Republican Party (Trump)
2016 Presidential Elections Results (%) - Other
2020 Presidential Elections Results (%) - Democratic Party (Biden)
2020 Presidential Elections Results (%) - Republican Party (Trump)
2020 Presidential Elections Results (%) - Other
Ancestries Reported - Arab (%)
Ancestries Reported - Czech (%)
Ancestries Reported - Danish (%)
Ancestries Reported - Dutch (%)
Ancestries Reported - English (%)
Ancestries Reported - French (%)
Ancestries Reported - French Canadian (%)
Ancestries Reported - German (%)
Ancestries Reported - Greek (%)
Ancestries Reported - Hungarian (%)
Ancestries Reported - Irish (%)
Ancestries Reported - Italian (%)
Ancestries Reported - Lithuanian (%)
Ancestries Reported - Norwegian (%)
Ancestries Reported - Polish (%)
Ancestries Reported - Portuguese (%)
Ancestries Reported - Russian (%)
Ancestries Reported - Scotch-Irish (%)
Ancestries Reported - Scottish (%)
Ancestries Reported - Slovak (%)
Ancestries Reported - Subsaharan African (%)
Ancestries Reported - Swedish (%)
Ancestries Reported - Swiss (%)
Ancestries Reported - Ukrainian (%)
Ancestries Reported - United States (%)
Ancestries Reported - Welsh (%)
Ancestries Reported - West Indian (%)
Ancestries Reported - Other (%)
Educational Attainment - No schooling completed (%)
Educational Attainment - Less than high school (%)
Educational Attainment - High school or equivalent (%)
Educational Attainment - Less than 1 year of college (%)
Educational Attainment - 1 or more years of college (%)
Educational Attainment - Associate degree (%)
Educational Attainment - Bachelor's degree (%)
Educational Attainment - Master's degree (%)
Educational Attainment - Professional school degree (%)
Educational Attainment - Doctorate degree (%)
School Enrollment - Nursery, preschool (%)
School Enrollment - Kindergarten (%)
School Enrollment - Grade 1 to 4 (%)
School Enrollment - Grade 5 to 8 (%)
School Enrollment - Grade 9 to 12 (%)
School Enrollment - College undergrad (%)
School Enrollment - Graduate or professional (%)
School Enrollment - Not enrolled in school (%)
School enrollment - Public schools (%)
School enrollment - Private schools (%)
School enrollment - Not enrolled (%)
Median number of rooms in houses and condos
Median number of rooms in apartments
Housing units lacking complete plumbing facilities (%)
Housing units lacking complete kitchen facilities (%)
Density of houses
Urban houses (%)
Rural houses (%)
Households with people 60 years and over (%)
Households with people 65 years and over (%)
Households with people 75 years and over (%)
Households with one or more nonrelatives (%)
Households with no nonrelatives (%)
Population in households (%)
Family households (%)
Nonfamily households (%)
Population in families (%)
Family households with own children (%)
Median number of bedrooms in owner occupied houses
Mean number of bedrooms in owner occupied houses
Median number of bedrooms in renter occupied houses
Mean number of bedrooms in renter occupied houses
Median number of vehichles in owner occupied houses
Mean number of vehichles in owner occupied houses
Median number of vehichles in renter occupied houses
Mean number of vehichles in renter occupied houses
Mortgage status - with mortgage (%)
Mortgage status - with second mortgage (%)
Mortgage status - with home equity loan (%)
Mortgage status - with both second mortgage and home equity loan (%)
Mortgage status - without a mortgage (%)
Average family size
Average family size - White
Average family size - Black or African American
Average family size - Asian
Average family size - Hispanic or Latino
Average family size - American Indian and Alaska Native
Average family size - Multirace
Average family size - Other Race
Geographical mobility - Same house 1 year ago (%)
Geographical mobility - Moved within same county (%)
Geographical mobility - Moved from different county within same state (%)
Geographical mobility - Moved from different state (%)
Geographical mobility - Moved from abroad (%)
Place of birth - Born in state of residence (%)
Place of birth - Born in other state (%)
Place of birth - Native, outside of US (%)
Place of birth - Foreign born (%)
Housing units in structures - 1, detached (%)
Housing units in structures - 1, attached (%)
Housing units in structures - 2 (%)
Housing units in structures - 3 or 4 (%)
Housing units in structures - 5 to 9 (%)
Housing units in structures - 10 to 19 (%)
Housing units in structures - 20 to 49 (%)
Housing units in structures - 50 or more (%)
Housing units in structures - Mobile home (%)
Housing units in structures - Boat, RV, van, etc. (%)
House/condo owner moved in on average (years ago)
Renter moved in on average (years ago)
Year householder moved into unit - Moved in 1999 to March 2000 (%)
Year householder moved into unit - Moved in 1995 to 1998 (%)
Year householder moved into unit - Moved in 1990 to 1994 (%)
Year householder moved into unit - Moved in 1980 to 1989 (%)
Year householder moved into unit - Moved in 1970 to 1979 (%)
Year householder moved into unit - Moved in 1969 or earlier (%)
Means of transportation to work - Drove car alone (%)
Means of transportation to work - Carpooled (%)
Means of transportation to work - Public transportation (%)
Means of transportation to work - Bus or trolley bus (%)
Means of transportation to work - Streetcar or trolley car (%)
Means of transportation to work - Subway or elevated (%)
Means of transportation to work - Railroad (%)
Means of transportation to work - Ferryboat (%)
Means of transportation to work - Taxicab (%)
Means of transportation to work - Motorcycle (%)
Means of transportation to work - Bicycle (%)
Means of transportation to work - Walked (%)
Means of transportation to work - Other means (%)
Working at home (%)
Industry diversity
Most Common Industries - Agriculture, forestry, fishing and hunting, and mining (%)
Most Common Industries - Agriculture, forestry, fishing and hunting (%)
Most Common Industries - Mining, quarrying, and oil and gas extraction (%)
Most Common Industries - Construction (%)
Most Common Industries - Manufacturing (%)
Most Common Industries - Wholesale trade (%)
Most Common Industries - Retail trade (%)
Most Common Industries - Transportation and warehousing, and utilities (%)
Most Common Industries - Transportation and warehousing (%)
Most Common Industries - Utilities (%)
Most Common Industries - Information (%)
Most Common Industries - Finance and insurance, and real estate and rental and leasing (%)
Most Common Industries - Finance and insurance (%)
Most Common Industries - Real estate and rental and leasing (%)
Most Common Industries - Professional, scientific, and management, and administrative and waste management services (%)
Most Common Industries - Professional, scientific, and technical services (%)
Most Common Industries - Management of companies and enterprises (%)
Most Common Industries - Administrative and support and waste management services (%)
Most Common Industries - Educational services, and health care and social assistance (%)
Most Common Industries - Educational services (%)
Most Common Industries - Health care and social assistance (%)
Most Common Industries - Arts, entertainment, and recreation, and accommodation and food services (%)
Most Common Industries - Arts, entertainment, and recreation (%)
Most Common Industries - Accommodation and food services (%)
Most Common Industries - Other services, except public administration (%)
Most Common Industries - Public administration (%)
Occupation diversity
Most Common Occupations - Management, business, science, and arts occupations (%)
Most Common Occupations - Management, business, and financial occupations (%)
Most Common Occupations - Management occupations (%)
Most Common Occupations - Business and financial operations occupations (%)
Most Common Occupations - Computer, engineering, and science occupations (%)
Most Common Occupations - Computer and mathematical occupations (%)
Most Common Occupations - Architecture and engineering occupations (%)
Most Common Occupations - Life, physical, and social science occupations (%)
Most Common Occupations - Education, legal, community service, arts, and media occupations (%)
Most Common Occupations - Community and social service occupations (%)
Most Common Occupations - Legal occupations (%)
Most Common Occupations - Education, training, and library occupations (%)
Most Common Occupations - Arts, design, entertainment, sports, and media occupations (%)
Most Common Occupations - Healthcare practitioners and technical occupations (%)
Most Common Occupations - Health diagnosing and treating practitioners and other technical occupations (%)
Most Common Occupations - Health technologists and technicians (%)
Most Common Occupations - Service occupations (%)
Most Common Occupations - Healthcare support occupations (%)
Most Common Occupations - Protective service occupations (%)
Most Common Occupations - Fire fighting and prevention, and other protective service workers including supervisors (%)
Most Common Occupations - Law enforcement workers including supervisors (%)
Most Common Occupations - Food preparation and serving related occupations (%)
Most Common Occupations - Building and grounds cleaning and maintenance occupations (%)
Most Common Occupations - Personal care and service occupations (%)
Most Common Occupations - Sales and office occupations (%)
Most Common Occupations - Sales and related occupations (%)
Most Common Occupations - Office and administrative support occupations (%)
Most Common Occupations - Natural resources, construction, and maintenance occupations (%)
Most Common Occupations - Farming, fishing, and forestry occupations (%)
Most Common Occupations - Construction and extraction occupations (%)
Most Common Occupations - Installation, maintenance, and repair occupations (%)
Most Common Occupations - Production, transportation, and material moving occupations (%)
Most Common Occupations - Production occupations (%)
Most Common Occupations - Transportation occupations (%)
Most Common Occupations - Material moving occupations (%)
People in Group quarters - Institutionalized population (%)
People in Group quarters - Correctional institutions (%)
People in Group quarters - Federal prisons and detention centers (%)
People in Group quarters - Halfway houses (%)
People in Group quarters - Local jails and other confinement facilities (including police lockups) (%)
People in Group quarters - Military disciplinary barracks (%)
People in Group quarters - State prisons (%)
People in Group quarters - Other types of correctional institutions (%)
People in Group quarters - Nursing homes (%)
People in Group quarters - Hospitals/wards, hospices, and schools for the handicapped (%)
People in Group quarters - Hospitals/wards and hospices for chronically ill (%)
People in Group quarters - Hospices or homes for chronically ill (%)
People in Group quarters - Military hospitals or wards for chronically ill (%)
People in Group quarters - Other hospitals or wards for chronically ill (%)
People in Group quarters - Hospitals or wards for drug/alcohol abuse (%)
People in Group quarters - Mental (Psychiatric) hospitals or wards (%)
People in Group quarters - Schools, hospitals, or wards for the mentally retarded (%)
People in Group quarters - Schools, hospitals, or wards for the physically handicapped (%)
People in Group quarters - Institutions for the deaf (%)
People in Group quarters - Institutions for the blind (%)
People in Group quarters - Orthopedic wards and institutions for the physically handicapped (%)
People in Group quarters - Wards in general hospitals for patients who have no usual home elsewhere (%)
People in Group quarters - Wards in military hospitals for patients who have no usual home elsewhere (%)
People in Group quarters - Juvenile institutions (%)
People in Group quarters - Long-term care (%)
People in Group quarters - Homes for abused, dependent, and neglected children (%)
People in Group quarters - Residential treatment centers for emotionally disturbed children (%)
People in Group quarters - Training schools for juvenile delinquents (%)
People in Group quarters - Short-term care, detention or diagnostic centers for delinquent children (%)
People in Group quarters - Type of juvenile institution unknown (%)
People in Group quarters - Noninstitutionalized population (%)
People in Group quarters - College dormitories (includes college quarters off campus) (%)
People in Group quarters - Military quarters (%)
People in Group quarters - On base (%)
People in Group quarters - Barracks, unaccompanied personnel housing (UPH), (Enlisted/Officer), ;and similar group living quarters for military personnel (%)
People in Group quarters - Transient quarters for temporary residents (%)
People in Group quarters - Military ships (%)
People in Group quarters - Group homes (%)
People in Group quarters - Homes or halfway houses for drug/alcohol abuse (%)
People in Group quarters - Homes for the mentally ill (%)
People in Group quarters - Homes for the mentally retarded (%)
People in Group quarters - Homes for the physically handicapped (%)
People in Group quarters - Other group homes (%)
People in Group quarters - Religious group quarters (%)
People in Group quarters - Dormitories (%)
People in Group quarters - Agriculture workers' dormitories on farms (%)
People in Group quarters - Job Corps and vocational training facilities (%)
People in Group quarters - Other workers' dormitories (%)
People in Group quarters - Crews of maritime vessels (%)
People in Group quarters - Other nonhousehold living situations (%)
People in Group quarters - Other noninstitutional group quarters (%)
Residents speaking English at home (%)
Residents speaking English at home - Born in the United States (%)
Residents speaking English at home - Native, born elsewhere (%)
Residents speaking English at home - Foreign born (%)
Residents speaking Spanish at home (%)
Residents speaking Spanish at home - Born in the United States (%)
Residents speaking Spanish at home - Native, born elsewhere (%)
Residents speaking Spanish at home - Foreign born (%)
Residents speaking other language at home (%)
Residents speaking other language at home - Born in the United States (%)
Residents speaking other language at home - Native, born elsewhere (%)
Residents speaking other language at home - Foreign born (%)
Class of Workers - Employee of private company (%)
Class of Workers - Self-employed in own incorporated business (%)
Class of Workers - Private not-for-profit wage and salary workers (%)
Class of Workers - Local government workers (%)
Class of Workers - State government workers (%)
Class of Workers - Federal government workers (%)
Class of Workers - Self-employed workers in own not incorporated business and Unpaid family workers (%)
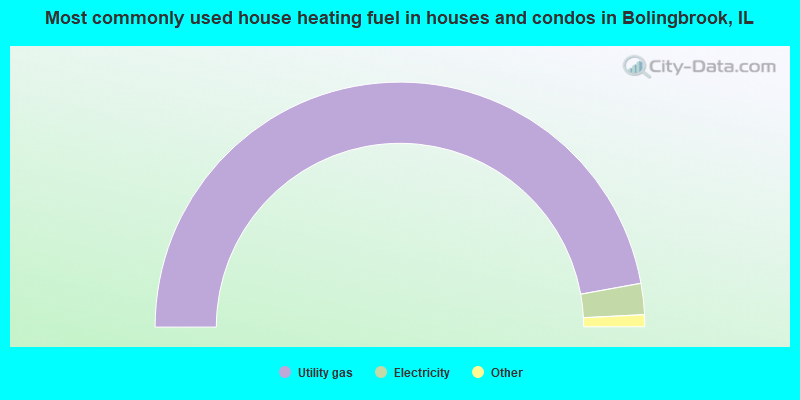
House heating fuel used in houses and condos - Utility gas (%)
House heating fuel used in houses and condos - Bottled, tank, or LP gas (%)
House heating fuel used in houses and condos - Electricity (%)
House heating fuel used in houses and condos - Fuel oil, kerosene, etc. (%)
House heating fuel used in houses and condos - Coal or coke (%)
House heating fuel used in houses and condos - Wood (%)
House heating fuel used in houses and condos - Solar energy (%)
House heating fuel used in houses and condos - Other fuel (%)
House heating fuel used in houses and condos - No fuel used (%)
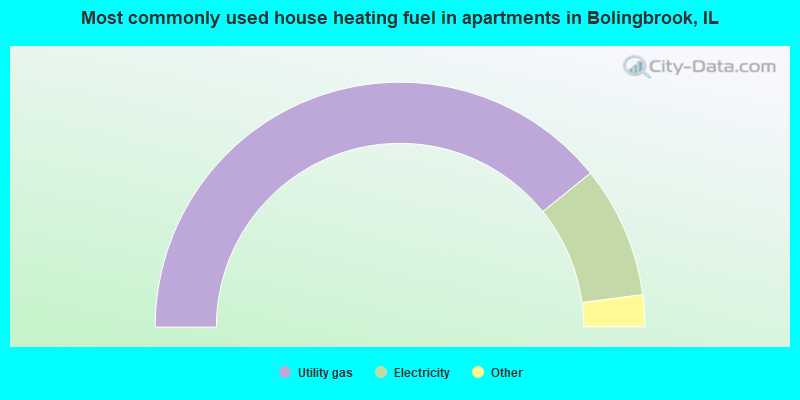
House heating fuel used in apartments - Utility gas (%)
House heating fuel used in apartments - Bottled, tank, or LP gas (%)
House heating fuel used in apartments - Electricity (%)
House heating fuel used in apartments - Fuel oil, kerosene, etc. (%)
House heating fuel used in apartments - Coal or coke (%)
House heating fuel used in apartments - Wood (%)
House heating fuel used in apartments - Solar energy (%)
House heating fuel used in apartments - Other fuel (%)
House heating fuel used in apartments - No fuel used (%)
Armed forces status - In Armed Forces (%)
Armed forces status - Civilian (%)
Armed forces status - Civilian - Veteran (%)
Armed forces status - Civilian - Nonveteran (%)
Fatal accidents locations in years 2005-2021
Fatal accidents locations in 2005
Fatal accidents locations in 2006
Fatal accidents locations in 2007
Fatal accidents locations in 2008
Fatal accidents locations in 2009
Fatal accidents locations in 2010
Fatal accidents locations in 2011
Fatal accidents locations in 2012
Fatal accidents locations in 2013
Fatal accidents locations in 2014
Fatal accidents locations in 2015
Fatal accidents locations in 2016
Fatal accidents locations in 2017
Fatal accidents locations in 2018
Fatal accidents locations in 2019
Fatal accidents locations in 2020
Fatal accidents locations in 2021
Alcohol use - People drinking some alcohol every month (%)
Alcohol use - People not drinking at all (%)
Alcohol use - Average days/month drinking alcohol
Alcohol use - Average drinks/week
Alcohol use - Average days/year people drink much
Audiometry - Average condition of hearing (%)
Audiometry - People that can hear a whisper from across a quiet room (%)
Audiometry - People that can hear normal voice from across a quiet room (%)
Audiometry - Ears ringing, roaring, buzzing (%)
Audiometry - Had a job exposure to loud noise (%)
Audiometry - Had off-work exposure to loud noise (%)
Blood Pressure & Cholesterol - Has high blood pressure (%)
Blood Pressure & Cholesterol - Checking blood pressure at home (%)
Blood Pressure & Cholesterol - Frequently checking blood cholesterol (%)
Blood Pressure & Cholesterol - Has high cholesterol level (%)
Consumer Behavior - Money monthly spent on food at supermarket/grocery store
Consumer Behavior - Money monthly spent on food at other stores
Consumer Behavior - Money monthly spent on eating out
Consumer Behavior - Money monthly spent on carryout/delivered foods
Consumer Behavior - Income spent on food at supermarket/grocery store (%)
Consumer Behavior - Income spent on food at other stores (%)
Consumer Behavior - Income spent on eating out (%)
Consumer Behavior - Income spent on carryout/delivered foods (%)
Current Health Status - General health condition (%)
Current Health Status - Blood donors (%)
Current Health Status - Has blood ever tested for HIV virus (%)
Current Health Status - Left-handed people (%)
Dermatology - People using sunscreen (%)
Diabetes - Diabetics (%)
Diabetes - Had a blood test for high blood sugar (%)
Diabetes - People taking insulin (%)
Diet Behavior & Nutrition - Diet health (%)
Diet Behavior & Nutrition - Milk product consumption (# of products/month)
Diet Behavior & Nutrition - Meals not home prepared (#/week)
Diet Behavior & Nutrition - Meals from fast food or pizza place (#/week)
Diet Behavior & Nutrition - Ready-to-eat foods (#/month)
Diet Behavior & Nutrition - Frozen meals/pizza (#/month)
Drug Use - People that ever used marijuana or hashish (%)
Drug Use - Ever used hard drugs (%)
Drug Use - Ever used any form of cocaine (%)
Drug Use - Ever used heroin (%)
Drug Use - Ever used methamphetamine (%)
Health Insurance - People covered by health insurance (%)
Kidney Conditions-Urology - Avg. # of times urinating at night
Medical Conditions - People with asthma (%)
Medical Conditions - People with anemia (%)
Medical Conditions - People with psoriasis (%)
Medical Conditions - People with overweight (%)
Medical Conditions - Elderly people having difficulties in thinking or remembering (%)
Medical Conditions - People who ever received blood transfusion (%)
Medical Conditions - People having trouble seeing even with glass/contacts (%)
Medical Conditions - People with arthritis (%)
Medical Conditions - People with gout (%)
Medical Conditions - People with congestive heart failure (%)
Medical Conditions - People with coronary heart disease (%)
Medical Conditions - People with angina pectoris (%)
Medical Conditions - People who ever had heart attack (%)
Medical Conditions - People who ever had stroke (%)
Medical Conditions - People with emphysema (%)
Medical Conditions - People with thyroid problem (%)
Medical Conditions - People with chronic bronchitis (%)
Medical Conditions - People with any liver condition (%)
Medical Conditions - People who ever had cancer or malignancy (%)
Mental Health - People who have little interest in doing things (%)
Mental Health - People feeling down, depressed, or hopeless (%)
Mental Health - People who have trouble sleeping or sleeping too much (%)
Mental Health - People feeling tired or having little energy (%)
Mental Health - People with poor appetite or overeating (%)
Mental Health - People feeling bad about themself (%)
Mental Health - People who have trouble concentrating on things (%)
Mental Health - People moving or speaking slowly or too fast (%)
Mental Health - People having thoughts they would be better off dead (%)
Oral Health - Average years since last visit a dentist
Oral Health - People embarrassed because of mouth (%)
Oral Health - People with gum disease (%)
Oral Health - General health of teeth and gums (%)
Oral Health - Average days a week using dental floss/device
Oral Health - Average days a week using mouthwash for dental problem
Oral Health - Average number of teeth
Pesticide Use - Households using pesticides to control insects (%)
Pesticide Use - Households using pesticides to kill weeds (%)
Physical Activity - People doing vigorous-intensity work activities (%)
Physical Activity - People doing moderate-intensity work activities (%)
Physical Activity - People walking or bicycling (%)
Physical Activity - People doing vigorous-intensity recreational activities (%)
Physical Activity - People doing moderate-intensity recreational activities (%)
Physical Activity - Average hours a day doing sedentary activities
Physical Activity - Average hours a day watching TV or videos
Physical Activity - Average hours a day using computer
Physical Functioning - People having limitations keeping them from working (%)
Physical Functioning - People limited in amount of work they can do (%)
Physical Functioning - People that need special equipment to walk (%)
Physical Functioning - People experiencing confusion/memory problems (%)
Physical Functioning - People requiring special healthcare equipment (%)
Prescription Medications - Average number of prescription medicines taking
Preventive Aspirin Use - Adults 40+ taking low-dose aspirin (%)
Reproductive Health - Vaginal deliveries (%)
Reproductive Health - Cesarean deliveries (%)
Reproductive Health - Deliveries resulted in a live birth (%)
Reproductive Health - Pregnancies resulted in a delivery (%)
Reproductive Health - Women breastfeeding newborns (%)
Reproductive Health - Women that had a hysterectomy (%)
Reproductive Health - Women that had both ovaries removed (%)
Reproductive Health - Women that have ever taken birth control pills (%)
Reproductive Health - Women taking birth control pills (%)
Reproductive Health - Women that have ever used Depo-Provera or injectables (%)
Reproductive Health - Women that have ever used female hormones (%)
Sexual Behavior - People 18+ that ever had sex (vaginal, anal, or oral) (%)
Sexual Behavior - Males 18+ that ever had vaginal sex with a woman (%)
Sexual Behavior - Males 18+ that ever performed oral sex on a woman (%)
Sexual Behavior - Males 18+ that ever had anal sex with a woman (%)
Sexual Behavior - Males 18+ that ever had any sex with a man (%)
Sexual Behavior - Females 18+ that ever had vaginal sex with a man (%)
Sexual Behavior - Females 18+ that ever performed oral sex on a man (%)
Sexual Behavior - Females 18+ that ever had anal sex with a man (%)
Sexual Behavior - Females 18+ that ever had any kind of sex with a woman (%)
Sexual Behavior - Average age people first had sex
Sexual Behavior - Average number of female sex partners in lifetime (males 18+)
Sexual Behavior - Average number of female vaginal sex partners in lifetime (males 18+)
Sexual Behavior - Average age people first performed oral sex on a woman (18+)
Sexual Behavior - Average number of woman performed oral sex on in lifetime (18+)
Sexual Behavior - Average number of male sex partners in lifetime (males 18+)
Sexual Behavior - Average number of male anal sex partners in lifetime (males 18+)
Sexual Behavior - Average age people first performed oral sex on a man (18+)
Sexual Behavior - Average number of male oral sex partners in lifetime (18+)
Sexual Behavior - People using protection when performing oral sex (%)
Sexual Behavior - Average number of times people have vaginal or anal sex a year
Sexual Behavior - People having sex without condom (%)
Sexual Behavior - Average number of male sex partners in lifetime (females 18+)
Sexual Behavior - Average number of male vaginal sex partners in lifetime (females 18+)
Sexual Behavior - Average number of female sex partners in lifetime (females 18+)
Sexual Behavior - Circumcised males 18+ (%)
Sleep Disorders - Average hours sleeping at night
Sleep Disorders - People that has trouble sleeping (%)
Smoking-Cigarette Use - People smoking cigarettes (%)
Taste & Smell - People 40+ having problems with smell (%)
Taste & Smell - People 40+ having problems with taste (%)
Taste & Smell - People 40+ that ever had wisdom teeth removed (%)
Taste & Smell - People 40+ that ever had tonsils teeth removed (%)
Taste & Smell - People 40+ that ever had a loss of consciousness because of a head injury (%)
Taste & Smell - People 40+ that ever had a broken nose or other serious injury to face or skull (%)
Taste & Smell - People 40+ that ever had two or more sinus infections (%)
Weight - Average height (inches)
Weight - Average weight (pounds)
Weight - Average BMI
Weight - People that are obese (%)
Weight - People that ever were obese (%)
Weight - People trying to lose weight (%)
According to our research of Illinois and other state lists, there were 35 registered sex offenders living in Bolingbrook, Illinois as of April 27, 2024 . The ratio of all residents to sex offenders in Bolingbrook is 2,136 to 1.The ratio of registered sex offenders to all residents in this city is much lower than the state average.
Officers per 1,000 residents here:
1.50Illinois average:
3.04
Latest news from Bolingbrook, IL collected exclusively by city-data.com from local newspapers, TV, and radio stations
Ancestries: German (5.3%), Polish (4.5%), African (3.1%), Irish (2.5%), Italian (2.4%), American (2.1%).
Current Local Time:
Incorporated on 12/16/1965
Land area: 20.5 square miles.
Population density: 3,610 people per square mile (average).
15,796 residents are foreign born (10.1% Latin America , 8.1% Asia ).
This village:
21.4%Illinois:
14.1%
Median real estate property taxes paid for housing units with mortgages in 2022: $7,877 (2.5%)Median real estate property taxes paid for housing units with no mortgage in 2022: $6,266 (2.5%)
Nearest city with pop. 200,000+: Chicago, IL
Nearest cities:
Latitude: 41.70 N, Longitude: 88.09 W
Daytime population change due to commuting: +3,023 (+4.0%)Workers who live and work in this village: 13,964 (35.2%)
Area code commonly used in this area: 630
Property values in Bolingbrook, IL
Single-family new house construction building permits:
2022: 83 buildings , average cost: $294,9002021: 63 buildings , average cost: $245,3002020: 61 buildings , average cost: $174,9002019: 66 buildings , average cost: $165,1002018: 22 buildings , average cost: $126,0002017: 13 buildings , average cost: $154,1002016: 27 buildings , average cost: $188,4002015: 124 buildings , average cost: $163,6002014: 124 buildings , average cost: $164,9002013: 108 buildings , average cost: $169,5002012: 68 buildings , average cost: $200,9002011: 53 buildings , average cost: $169,4002010: 37 buildings , average cost: $201,9002009: 19 buildings , average cost: $193,9002008: 70 buildings , average cost: $208,9002007: 125 buildings , average cost: $218,3002006: 200 buildings , average cost: $193,3002005: 496 buildings , average cost: $162,7002004: 724 buildings , average cost: $144,1002003: 1108 buildings , average cost: $129,5002002: 846 buildings , average cost: $118,9002001: 637 buildings , average cost: $117,6002000: 457 buildings , average cost: $108,0001999: 554 buildings , average cost: $92,3001998: 495 buildings , average cost: $100,2001997: 364 buildings , average cost: $96,300Unemployment in December 2023:
Population change in the 1990s: +15,057 (+36.5%).
Most common occupations in Bolingbrook, IL (%)
Both Males Females
Cooks and food preparation workers (6.3%)
Building and grounds cleaning and maintenance occupations (4.3%)
Other management occupations, except farmers and farm managers (3.9%)
Other production occupations, including supervisors (3.4%)
Other office and administrative support workers, including supervisors (3.0%)
Computer specialists (2.9%)
Laborers and material movers, hand (2.9%)
Cooks and food preparation workers (6.9%)
Building and grounds cleaning and maintenance occupations (6.4%)
Other production occupations, including supervisors (4.7%)
Driver/sales workers and truck drivers (4.5%)
Laborers and material movers, hand (4.5%)
Other management occupations, except farmers and farm managers (3.9%)
Electrical equipment mechanics and other installation, maintenance, and repair workers, including supervisors (3.5%)
Cooks and food preparation workers (5.5%)
Other office and administrative support workers, including supervisors (4.7%)
Registered nurses (4.4%)
Other management occupations, except farmers and farm managers (3.9%)
Secretaries and administrative assistants (3.6%)
Customer service representatives (3.6%)
Cashiers (3.3%)
Tornado activity:
Bolingbrook-area historical tornado activity is near Illinois state average. It is 55% greater than the overall U.S. average.
On 8/28/1990, a category F5 (max. wind speeds 261-318 mph) tornado 12.4 miles away from the Bolingbrook village center killed 29 people and injured 350 people and caused between $50,000 and $500,000 in damages.
On 6/13/1976, a category F4 (max. wind speeds 207-260 mph) tornado 5.0 miles away from the village center killed 2 people and injured 23 people and caused between $500,000 and $5,000,000 in damages.
Earthquake activity:
Bolingbrook-area historical earthquake activity is significantly above Illinois state average. It is 51% greater than the overall U.S. average. On 4/18/2008 at 09:36:59, a magnitude 5.4 (5.1 MB, 4.8 MS, 5.4 MW, 5.2 MW, Class: Moderate, Intensity: VI - VII) earthquake occurred 224.8 miles away from Bolingbrook center On 6/10/1987 at 23:48:54, a magnitude 5.1 (4.9 MB, 4.4 MS, 4.6 MS, 5.1 LG) earthquake occurred 199.3 miles away from Bolingbrook center On 4/18/2008 at 09:36:59, a magnitude 5.2 (5.2 MW, Depth: 8.9 mi) earthquake occurred 224.8 miles away from Bolingbrook center On 6/28/2004 at 06:10:52, a magnitude 4.2 (4.2 MW, Depth: 6.2 mi, Class: Light, Intensity: IV - V) earthquake occurred 45.1 miles away from Bolingbrook center On 6/18/2002 at 17:37:15, a magnitude 5.0 (4.3 MB, 4.6 MW, 5.0 LG) earthquake occurred 257.2 miles away from the city center On 4/18/2008 at 15:14:16, a magnitude 4.8 (4.5 MB, 4.8 MW, 4.6 MW) earthquake occurred 223.3 miles away from Bolingbrook center Magnitude types: regional Lg-wave magnitude (LG), body-wave magnitude (MB), surface-wave magnitude (MS), moment magnitude (MW) Natural disasters: The number of natural disasters in Will County (17) is near the US average (15).Major Disasters (Presidential) Declared: 12Emergencies Declared: 4Storms: 9, Floods: 7, Tornadoes: 5, Snowstorms: 2, Winds: 2, Winter Storms: 2, Blizzard: 1, Hurricane: 1, Snow: 1, Other: 1 (Note: some incidents may be assigned to more than one category). Hospitals in Bolingbrook: ADVENTIST BOLINGBROOK HOSPITAL (Voluntary non-profit - Private, provides emergency services, 500 REMINGTON BOULEVARD) Nursing Homes in Bolingbrook: MEADOWBROOK MANOR - BOLINGBROOK (431 WEST REMINGTON BOULEVARD) Dialysis Facilities in Bolingbrook: FMC - BOLINGBROOK DIALYSIS (329 REMINGTON BLVD, STE 110) Home Health Centers in Bolingbrook: ADVANCED PROFESSIONALS HEALTHCARE, LLC (440 W BOUGHTON ROAD, STE D) AVANT CARE HOME HEALTH CARE, INC (440 W BOUGHTON ROAD, SUITE 209) BOLINGBROOK HOME HEALTH, LLC (217 CHRISTINE WAY) D AND D HOME HEALTHCARE, INC (101 ROYCE ROAD, STE 7) LMR HOME HEALTH CARE, INC (167 W BOUGHTON ROAD) OMNICARE HOME HEALTH, INC (550 EAST BOUGHTON ROAD, STE 130) RAINBOW HEALTH CARE SERVICES, P C (101 ROYCE ROAD, STE 20) SPECTRUM NURSES, INC (481 W BOUGHTON ROAD, #400) WELLSPRING HEALTHCARE SERVICES, INC (494 W BOUGHTON ROAD, STE 4D) Amtrak stations near Bolingbrook: 7 miles: NAPERVILLE (E. 4TH & ELLSWORTH AVE.) Services: ticket office, partially wheelchair accessible, enclosed waiting area, public restrooms, public payphones, free short-term parking, free long-term parking, call for taxi service, public transit connection.
13 miles: JOLIET (50 E. JEFFERSON ST.) Services: ticket office, partially wheelchair accessible, enclosed waiting area, public restrooms, public payphones, vending machines, paid short-term parking, paid long-term parking, public transit connection.
14 miles: LA GRANGE ROAD (LA GRANGE, 25 W. BURLINGTON AVE.) Services: enclosed waiting area, public payphones, taxi stand, public transit connection.
Colleges/universities with over 2000 students nearest to Bolingbrook:
Benedictine University (about 6 miles; Lisle, IL ; Full-time enrollment: 5,694)
North Central College (about 7 miles; Naperville, IL ; FT enrollment: 2,860)
Lewis University (about 7 miles; Romeoville, IL ; FT enrollment: 5,739)
College of DuPage (about 10 miles; Glen Ellyn, IL ; FT enrollment: 18,910)
University of St Francis (about 12 miles; Joliet, IL ; FT enrollment: 2,454)
Wheaton College (about 12 miles; Wheaton, IL ; FT enrollment: 2,948)
Moraine Valley Community College (about 14 miles; Palos Hills, IL ; FT enrollment: 12,008)
Public high schools in Bolingbrook:
Biggest public elementary/middle schools in Bolingbrook: HUBERT H HUMPHREY MIDDLE SCHOOL Students: 759, Location: 777 FALCON RIDGE WAY, Grades: 6-8)OAK VIEW ELEM SCHOOL Students: 733, Location: 150 N SCHMIDT RD, Grades: KG-5)JANE ADDAMS MIDDLE SCHOOL Students: 727, Location: 905 LILY CACHE LN, Grades: 6-8)JOHN R TIBBOTT ELEM SCHOOL Students: 714, Location: 520 GARY DR, Grades: PK-5)WAYNE BUILTA ELEMENTARY SCHOOL Students: 705, Location: 1835 APPLE VALLEY RD, Grades: KG-5)INDEPENDENCE ELEM SCHOOL Students: 676, Location: 230 S ORCHARD DR, Grades: KG-5)JAMIE MCGEE ELEMENTARY SCHOOL Students: 596, Location: 179 COMMONWEALTH DR, Grades: KG-5)BERNARD J WARD ELEM SCHOOL Students: 575, Location: 200 RECREATION DR, Grades: KG-5)JONAS E SALK ELEM SCHOOL Students: 566, Location: 500 KING ARTHUR WAY, Grades: KG-5)WOOD VIEW ELEM SCHOOL Students: 528, Location: 197 WINSTON DR, Grades: KG-5)Private elementary/middle schools in Bolingbrook: ST DOMINIC ELEMENTARY SCHOOL Students: 279, Location: 420 E BRIARCLIFF RD, Grades: PK-8)
MIDWEST CHRISTIAN MONTESSORI ACADEMY Students: 85, Location: 151 E BRIARCLIFF RD, Grades: PK-8)
FURQAAN ACADEMY Students: 68, Location: 519 E BRIARCLIFF RD, Grades: UG-8)
See full list of schools located in Bolingbrook Library in Bolingbrook: FOUNTAINDALE PUBLIC LIBRARY DISTRICT Operating income: $8,230,572; Location: 300 WEST BRIARCLIFF ROAD; 314,836 books ; 7,456 e-books ; 24,559 audio materials ; 19,974 video materials ; 53 local licensed databases ; 21 state licensed databases ; 8 other licensed databases ; 722 print serial subscriptions ; 6 electronic serial subscriptions )
User-submitted facts and corrections:
Bolingbrook opened a new high school in Aug. of 2004. It is located on the intersection of Shcmidt Rd. and Lilly Cache Dr. The actual address is 635 Raider Way, Bolingbrook, IL, 60440. There are aproximatly 3100 hundred students currently enrolled there. The old high school building in now a Middle school. It was named Brooks Middle School. That is the building at 350 W. Blair Ln. Visitors to your site can find more info on Valley View School Dist. at vvsd.org.
Notable locations in Bolingbrook: (A) , Crossroads Business Park (B) , Remington Lake Business Center (C) , Carlow Corporate Center (D) , Fountaindale Public Library (E) , Bolingbrook Fire Department Station 5 (F) , Bolingbrook Fire Department Station 2 (G) , Bolingbrook Fire Department Station 4 (H) , Bolingbrook Fire Department Station 1 (I) , Bolingbrook Fire Department Station 3 (J) , Air Angels (K) , Ron George Round Barn (L) . Display/hide their locations on the map
Shopping Centers: (1) , Two Rivers Plaza Shopping Center (2) , South Commons Shopping Center (3) , Riverwoods Plaza Shopping Center (4) , Marketplace At Barbers Corners Shopping Center (5) , Market Park Place Shopping Center (6) , Country Aire Shopping Center (7) , Briar Square Shopping Center (8) , Boughton Square Shopping Center (9) . Display/hide their locations on the map
Churches in Bolingbrook include: (A) , Seventh Day Adventist Church (B) , Saint Dominics Catholic Church (C) , Divine Shepherd Lutheran Church (D) , First Baptist Church (E) , Westbrook Christian Church (F) , Celebration Fellowship Church (G) , Independent Church (H) , Living Water Assembly of God Church (I) . Display/hide their locations on the map
Cemetery: (1) . Display/hide its location on the map
River: (A) . Display/hide its location on the map
Parks in Bolingbrook include: (1) , Blackhawk Pond Park (2) , Barbers Corners County Forest Preserve (3) , Pathways Pond Park (4) , Rotary Park (5) , Erickson Park (6) , Winston Woods Park (7) , Wipfler Park (8) , Jaycee Park (9) . Display/hide their locations on the map
Tourist attractions: (1) , Amf Bolingbrook Lanes (Amusement & Theme Parks; 401 West Boughton Road) (2) , Four Star Entertainment- Ltd (Arcades & Amusements; 160 South Bolingbrook Drive) (3) . Display/hide their approximate locations on the map
Hotels: (1) , AmericInn Chicago/Bolingbrook (175 West Remington Boulevard) (2) , Hampton Inn & Suites (165 Remington Boulevard) (3) , Holiday Inn Hotel & Suites (205 Remington Boulevard) (4) . Display/hide their approximate locations on the map
Court: (1) . Display/hide its approximate location on the map
Birthplace of: Anthony Herron - Football player.
Will County has a predicted average indoor radon screening level between 2 and 4 pCi/L (pico curies per liter) - Moderate Potential Average household size: This village:
3.3 peopleIllinois:
2.6 people
Percentage of family households: This village:
81.8%Whole state:
65.8%
Percentage of households with unmarried partners: This village:
5.6%Whole state:
6.3%
Likely homosexual households (counted as self-reported same-sex unmarried-partner households)
Lesbian couples: 0.5% of all households Gay men: 0.3% of all households
279 people in nursing facilities/skilled-nursing facilities in 2010People in group quarters in Bolingbrook in 2000:
270 people in nursing homes
7 people in other nonhousehold living situations
2 people in religious group quarters
Banks with most branches in Bolingbrook (2011 data):
JPMorgan Chase Bank, National Association: Bolingbrook/Weber Banking Center Bra, Bolingbrook Branch, Boughton & James Banking Center. Info updated 2011/11/10: Bank assets: $1,811,678.0 mil, Deposits: $1,190,738.0 mil, headquarters in Columbus, OH, positive income , International Specialization, 5577 total offices , Holding Company: Jpmorgan Chase & Co.
Bank of America, National Association: Bolingbrook Janes & Boughton Branch, Bolingbrook Branch, Bolingbrook Banking Ctr. Branch. Info updated 2009/11/18: Bank assets: $1,451,969.3 mil, Deposits: $1,077,176.8 mil, headquarters in Charlotte, NC, positive income , 5782 total offices , Holding Company: Bank Of America Corporation
U.S. Bank National Association: E. Boughton Road Meijer Branch, Bolingbrook Branch, Bolingbrook Meijer Branch. Info updated 2012/01/30: Bank assets: $330,470.8 mil, Deposits: $236,091.5 mil, headquarters in Cincinnati, OH, positive income , 3121 total offices , Holding Company: U.S. Bancorp
BMO Harris Bank National Association: Harris Bolingbrook Weber at 710 South Weber Road, branch established on 2007/10/08; 225 Lily Cache Lane Branch at 225 Lily Cache Lane, branch established on 1980/02/07. Info updated 2011/07/14: Bank assets: $97,264.0 mil, Deposits: $75,624.6 mil, headquarters in Chicago, IL, positive income , 717 total offices , Holding Company: Bank Of Montreal
First American Bank: Bolingbrook Branch at 1290 W. Boughton Road, branch established on 1999/02/09; Bolingbrook Ii Branch at 739 E. Boughton Road, branch established on 2005/12/19. Info updated 2010/01/19: Bank assets: $2,710.6 mil, Deposits: $2,213.4 mil, headquarters in Elk Grove Village, IL, negative income in the last year , Commercial Lending Specialization, 50 total offices , Holding Company: First American Bank Corporation
West Suburban Bank: Bolingbrook East Facility at 672 East Boughton Road, branch established on 1991/07/30; Bolingbrook West Facility at 1104 West Boughton, branch established on 1995/04/03. Info updated 2011/02/23: Bank assets: $1,927.7 mil, Deposits: $1,744.7 mil, headquarters in Lombard, IL, positive income , Commercial Lending Specialization, 44 total offices , Holding Company: West Suburban Bancorp, Inc.
Firstmerit Bank, National Association: Bolingbrook Branch at 333 Quadrangle Drive, branch established on 1997/02/03. Info updated 2010/05/17: Bank assets: $14,420.6 mil, Deposits: $11,497.6 mil, headquarters in Akron, OH, positive income , Commercial Lending Specialization, 213 total offices , Holding Company: Firstmerit Corporation
Citizens Financial Bank: Bolingbrook Branch at 310 Weber Road, branch established on 2001/06/14. Info updated 2011/07/21: Bank assets: $1,149.8 mil, Deposits: $986.7 mil, headquarters in Munster, IN, negative income in the last year , Commercial Lending Specialization, 22 total offices
Standard Bank and Trust Company: Bolingbrook Facility Branch at 282 N Weber Road, branch established on 2002/12/27. Info updated 2006/11/03: Bank assets: $2,140.2 mil, Deposits: $1,872.8 mil, headquarters in Hickory Hills, IL, positive income , Commercial Lending Specialization, 43 total offices , Holding Company: Standard Bancshares, Inc.
6 other banks with 6 local branches
For population 15 years and over in Bolingbrook:
Never married: 32.1%Now married: 54.1%Separated: 2.0%Widowed: 4.0%Divorced: 7.7% For population 25 years and over in Bolingbrook:
High school or higher: 87.4%Bachelor's degree or higher: 38.4%Graduate or professional degree: 10.0%Unemployed: 3.3%Mean travel time to work (commute): 26.0 minutes
Education Gini index (Inequality in education) Here:
13.3Illinois average:
12.5
Religion statistics for Bolingbrook, IL (based on Will County data)
Religion Adherents Congregations Catholic 212,252 39 Evangelical Protestant 46,404 188 Mainline Protestant 31,313 73 Other 12,574 20 Black Protestant 7,426 16 Orthodox 1,536 6 None 366,055 -
Source: Clifford Grammich, Kirk Hadaway, Richard Houseal, Dale E.Jones, Alexei Krindatch, Richie Stanley and Richard H.Taylor. 2012. 2010 U.S.Religion Census: Religious Congregations & Membership Study. Association of Statisticians of American Religious Bodies. Jones, Dale E., et al. 2002. Congregations and Membership in the United States 2000. Nashville, TN: Glenmary Research Center. Graphs represent county-level data
Food Environment Statistics: Number of grocery stores : 85Will County :
1.27 / 10,000 pop.Illinois :
2.24 / 10,000 pop.
Number of supercenters and club stores : 5This county :
0.07 / 10,000 pop.Illinois :
0.08 / 10,000 pop.
Number of convenience stores (no gas) : 32Here :
0.48 / 10,000 pop.Illinois :
0.75 / 10,000 pop.
Number of convenience stores (with gas) : 122Here :
1.82 / 10,000 pop.Illinois :
2.61 / 10,000 pop.
Number of full-service restaurants : 286Will County :
4.26 / 10,000 pop.Illinois :
6.86 / 10,000 pop.
Adult diabetes rate : Will County :
7.7%Illinois :
8.3%
Adult obesity rate : Will County :
26.3%Illinois :
25.2%
Low-income preschool obesity rate : Will County :
13.4%Illinois :
14.5%
Health and Nutrition: Healthy diet rate : This city:
48.5%Illinois:
49.5%
Average overall health of teeth and gums : Bolingbrook:
46.7%Illinois:
47.2%
Average BMI : This city:
28.9Illinois:
28.6
People feeling badly about themselves : Bolingbrook:
20.8%Illinois:
20.5%
People not drinking alcohol at all : Bolingbrook:
11.3%Illinois:
10.8%
Average hours sleeping at night : This city:
6.7Illinois:
6.8
General health condition : Bolingbrook:
56.8%Illinois:
56.4%
Average condition of hearing : Bolingbrook:
82.0%Illinois:
79.9%
More about Health and Nutrition of Bolingbrook, IL Residents
Local government employment and payroll (March 2022)
Function
Full-time employees
Monthly full-time payroll
Average yearly full-time wage
Part-time employees
Monthly part-time payroll
Police Protection - Officers
109 $1,155,376 $127,197 0 $0 Firefighters
86 $830,778 $115,923 0 $0 Streets and Highways
25 $207,713 $99,702 0 $0 Other and Unallocable
21 $212,156 $121,232 1 $1,956 Sewerage
16 $130,891 $98,168 1 $1,236 Financial Administration
16 $99,430 $74,573 2 $2,126 Other Government Administration
14 $97,908 $83,921 76 $47,819 Police - Other
9 $106,348 $141,797 8 $10,055 Natural Resources
7 $50,920 $87,291 0 $0 Fire - Other
2 $24,504 $147,024 0 $0 Solid Waste Management
2 $18,041 $108,246 0 $0 Health
2 $10,414 $62,484 0 $0
Totals for Government
309 $2,944,479 $114,349 88 $63,192
Bolingbrook government finances - Expenditure in 2021 (per resident):
Construction - Regular Highways: $5,079,000 ($68.61)
General - Other: $520,000 ($7.02)Solid Waste Management: $12,000 ($0.16)Current Operations - Police Protection: $27,767,000 ($375.07)
Local Fire Protection: $19,770,000 ($267.05)Central Staff Services: $16,022,000 ($216.42)Regular Highways: $12,423,000 ($167.81)Parks and Recreation: $6,578,000 ($88.85)Solid Waste Management: $5,889,000 ($79.55)General - Other: $5,100,000 ($68.89)Protective Inspection and Regulation - Other: $562,000 ($7.59)Air Transportation: $290,000 ($3.92)Housing and Community Development: $23,000 ($0.31)General - Interest on Debt: $4,703,000 ($63.53)
Intergovernmental to Local - Other - General - Other: $1,209,000 ($16.33)
Other Capital Outlay - Police Protection: $360,000 ($4.86)
Regular Highways: $353,000 ($4.77)Local Fire Protection: $282,000 ($3.81)Solid Waste Management: $210,000 ($2.84)Water Utilities: $190,000 ($2.57)General - Other: $101,000 ($1.36)Total Salaries and Wages: $33,226,000 ($448.81)
Bolingbrook government finances - Revenue in 2021 (per resident):
Charges - Sewerage: $15,304,000 ($206.72)
Other: $11,000 ($0.15)Federal Intergovernmental - Housing and Community Development: $13,000 ($0.18)
Local Intergovernmental - Other: $2,821,000 ($38.11)
Miscellaneous - General Revenue - Other: $4,833,000 ($65.28)
Fines and Forfeits: $1,401,000 ($18.92)Interest Earnings: $630,000 ($8.51)State Intergovernmental - General Local Government Support: $30,482,000 ($411.75)
Highways: $5,265,000 ($71.12)Tax - Property: $26,727,000 ($361.02)
General Sales and Gross Receipts: $14,603,000 ($197.26)Other Selective Sales: $13,980,000 ($188.84)Other License: $2,115,000 ($28.57)Public Utilities Sales: $1,185,000 ($16.01)
Bolingbrook government finances - Debt in 2021 (per resident):
Long Term Debt - Beginning Outstanding - Unspecified Public Purpose: $222,278,000 ($3002.50)
Outstanding Unspecified Public Purpose: $216,836,000 ($2928.99)Retired Unspecified Public Purpose: $54,075,000 ($730.44)Issue, Unspecified Public Purpose: $48,632,000 ($656.91)
Bolingbrook government finances - Cash and Securities in 2021 (per resident):
Other Funds - Cash and Securities: $103,909,000 ($1403.59)
6.75% of this county's 2021 resident taxpayers lived in other counties in 2020 ($73,828 average adjusted gross income )
Here:
6.75%Illinois average:
5.09%
0.01% of residents moved from foreign countries ($43 average AGI )Will County:
0.01%Illinois average:
0.01%
Top counties from which taxpayers relocated into this county between 2020 and 2021:
6.85% of this county's 2020 resident taxpayers moved to other counties in 2021 ($78,688 average adjusted gross income )
Here:
6.85%Illinois average:
6.10%
0.01% of residents moved to foreign countries ($42 average AGI )Will County:
0.01%Illinois average:
0.01%
Top counties to which taxpayers relocated from this county between 2020 and 2021:
Businesses in Bolingbrook, IL
Name Count Name Count
7-Eleven 2 Just Tires 1 AMF Bowling 1 Justice 1 AT&T 2 KFC 1 Advance Auto Parts 1 Kohl's 1 Aeropostale 1 Kroger 1 AmericInn 1 LA Fitness 1 American Eagle Outfitters 1 La Quinta 1 Ann Taylor 1 La-Z-Boy 1 Ashley Furniture 1 Lane Bryant 1 AutoZone 1 LensCrafters 1 Avenue 1 Little Caesars Pizza 1 Bakers 1 Long John Silver's 1 Barnes & Noble 1 Lowe's 1 Baskin-Robbins 1 Macy's 1 Bath & Body Works 1 Marriott 1 Bed Bath & Beyond 1 Marshalls 1 Blockbuster 1 MasterBrand Cabinets 3 Brookstone 1 McDonald's 2 Buffalo Wild Wings 1 Meijer 2 Burger King 2 Men's Wearhouse 2 CVS 1 Menards 1 Caribou Coffee 1 Motherhood Maternity 1 Charlotte Russe 1 New York & Co 1 Chevrolet 1 Nike 6 Chipotle 1 OfficeMax 1 Circle K 2 Olive Garden 1 Coldwater Creek 1 Pac Sun 1 ColorTyme 1 Panda Express 2 Costco 1 Panera Bread 2 Cricket Wireless 2 Payless 2 Curves 1 Penske 1 DHL 1 PetSmart 1 Dairy Queen 2 Pier 1 Imports 1 Decora Cabinetry 2 Pizza Hut 1 Dennys 1 Popeyes 1 Discount Tire 1 Quiznos 1 Domino's Pizza 1 RadioShack 1 Dunkin Donuts 4 Ramada 1 Fashion Bug 1 Red Lobster 1 FedEx 7 Red Robin 1 Firestone Complete Auto Care 1 Sears 1 Foot Locker 1 Sprint Nextel 2 Forever 21 1 Staples 1 GNC 1 Starbucks 5 GameStop 2 Steak 'n Shake 1 Goodwill 1 Subway 4 Gymboree 1 T-Mobile 6 H&M 1 T.G.I. Driday's 1 H&R Block 1 Taco Bell 1 Hilton 1 Target 1 Hobby Lobby 1 The Athlete's Foot 1 Holiday Inn 1 U-Haul 2 Hollister Co. 1 U.S. Cellular 2 Home Depot 1 UPS 9 IHOP 1 Vans 2 IKEA 1 Verizon Wireless 2 J. Jill 1 Victoria's Secret 1 Jewel-Osco 1 Walgreens 1 Jimmy John's 2 Walmart 1 JoS. A. Bank 1 Wendy's 2 Johnny Rockets 1 Wet Seal 1 Journeys 1 White Castle 1
Strongest AM radio stations in Bolingbrook:
WMVP (1000 AM; 50 kW; CHICAGO, IL; Owner: ABC, INC.)
WYLL (1160 AM; 50 kW; CHICAGO, IL; Owner: SCA LICENSE CORPORATION)
WSCR (670 AM; 50 kW; CHICAGO, IL; Owner: INFINITY BROADCASTING OPERATIONS, INC.)
WLS (890 AM; 50 kW; CHICAGO, IL; Owner: WLS, INC.)
WBBM (780 AM; 50 kW; CHICAGO, IL; Owner: INFINITY BROADCASTING OPERATIONS, INC.)
WGN (720 AM; 50 kW; CHICAGO, IL; Owner: WGN CONTINENTAL BROADCASTING CO.)
WVIV (1200 AM; 20 kW; CHICAGO, IL; Owner: WLXX-AM LICENSE CORP.)
WMBI (1110 AM; daytime; 5 kW; CHICAGO, IL; Owner: THE MOODY BIBLE INSTITUTE OF CHICAGO)
WTMJ (620 AM; 50 kW; MILWAUKEE, WI; Owner: JOURNAL BROADCAST CORPORATION)
WRDZ (1300 AM; 4 kW; LA GRANGE, IL; Owner: ABC, INC.)
WAGG (610 AM; BIRMINGHAM, AL; Owner: CXR HOLDINGS, INC.)
WAUR (930 AM; 4 kW; SANDWICH, IL; Owner: CHRISTIAN BROADCASTING SYSTEM, LTD.)
WCSN (820 AM; 5 kW; CHICAGO, IL; Owner: WYPA, INC.)
Strongest FM radio stations in Bolingbrook:
WLEY-FM (107.9 FM; AURORA, IL; Owner: WLEY LICENSING, INC.)
WERV-FM (95.9 FM; AURORA, IL; Owner: NM LICENSING, LLC)
WCKG (105.9 FM; ELMWOOD PARK, IL; Owner: INFINITY HOLDINGS CORPORATION OF ORLANDO)
WLIT-FM (93.9 FM; CHICAGO, IL; Owner: AMFM RADIO LICENSES, L.L.C.)
WJMK (104.3 FM; CHICAGO, IL; Owner: INFINITY BROADCASTING CORP. OF ILLINOIS)
WNUA (95.5 FM; CHICAGO, IL; Owner: AMFM RADIO LICENSES, L.L.C.)
WTMX (101.9 FM; SKOKIE, IL; Owner: BONNEVILLE HOLDING COMPANY)
WBBM-FM (96.3 FM; CHICAGO, IL; Owner: INFINITY BROADCASTING OPERATIONS, INC.)
WKSC-FM (103.5 FM; CHICAGO, IL; Owner: AMFM RADIO LICENSES, L.L.C.)
WGCI-FM (107.5 FM; CHICAGO, IL; Owner: AMFM RADIO LICENSES, L.L.C.)
WFMT (98.7 FM; CHICAGO, IL; Owner: WINDOW TO THE WORLD COMMUNICATIONS)
WZZN (94.7 FM; CHICAGO, IL; Owner: ABC CHICAGO FM RADIO,INC.)
WBEZ (91.5 FM; CHICAGO, IL; Owner: THE WBEZ ALLIANCE, INC.)
WKQX (101.1 FM; CHICAGO, IL; Owner: EMMIS RADIO LICENSE CORPORATION)
WLUP-FM (97.9 FM; CHICAGO, IL; Owner: BONNEVILLE HOLDING COMPANY)
WNND (100.3 FM; CHICAGO, IL; Owner: BONNEVILLE HOLDING COMPANY)
WOJO (105.1 FM; EVANSTON, IL; Owner: TICHENOR LICENSE CORPORATION ("TLC"))
WUSN (99.5 FM; CHICAGO, IL; Owner: INFINITY BROADCASTING CORPORATION OF CHICAGO)
WVAZ (102.7 FM; OAK PARK, IL; Owner: AMFM RADIO LICENSES, L.L.C.)
WDRV (97.1 FM; CHICAGO, IL; Owner: BONNEVILLE HOLDING COMPANY)
TV broadcast stations around Bolingbrook:
WLS-TV (Channel 7; CHICAGO, IL; Owner: WLS TELEVISION, INC.)
WMAQ-TV (Channel 5; CHICAGO, IL; Owner: NBC SUBSIDIARY (WMAQ-TV), INC.)
WTTW (Channel 11; CHICAGO, IL; Owner: WINDOW TO THE WORLD COMMUNICATIONS, INC.)
WGN-TV (Channel 9; CHICAGO, IL; Owner: WGN CONTINENTAL BROADCASTING COMPANY)
WGBO-TV (Channel 66; JOLIET, IL; Owner: WGBO LICENSE PARTNERSHIP, G.P.)
WBBM-TV (Channel 2; CHICAGO, IL; Owner: CBS BROADCASTING INC.)
WPWR-TV (Channel 50; GARY, IN; Owner: FOX TELEVISION STATIONS, INC.)
WXFT (Channel 60; AURORA, IL; Owner: TELEFUTURA CHICAGO LLC)
WCIU-TV (Channel 26; CHICAGO, IL; Owner: WCIU-TV LIMITED PARTNERSHIP)
WCPX (Channel 38; CHICAGO, IL; Owner: PAXSON CHICAGO LICENSE, INC.)
WFLD (Channel 32; CHICAGO, IL; Owner: FOX TELEVISION STATIONS, INC.)
W68DO (Channel 68; PALATINE, IL; Owner: TRINITY BROADCASTING NETWORK)
WFBT-CA (Channel 23; CHICAGO, IL; Owner: CHANNEL 23 LIMITED PARTNERSHIP)
WJYS (Channel 62; HAMMOND, IN; Owner: JOVON BROADCASTING CORPORATION)
WSNS-TV (Channel 44; CHICAGO, IL; Owner: TELEMUNDO OF CHICAGO, INC.)
W34CK (Channel 34; ARLINGTON HEIGHTS, IL; Owner: FIRST UNITED, INC.)
W24AJ (Channel 24; AURORA, IL; Owner: NELSON TV, INC.)
WOCH-LP (Channel 28; CHICAGO, IL; Owner: KM LPTV OF CHICAGO-28, L.L.C.)
WYCC (Channel 20; CHICAGO, IL; Owner: COLLEGE DIST. #508, COUNTY OF COOK)
WOCK-CA (Channel 13; CHICAGO, IL; Owner: KM LPTV OF CHICAGO-13, L.L.C.)
WYIN (Channel 56; GARY, IN; Owner: NORTHWEST INDIANA PUBLIC BROADCASTING, INC.)
W54AP (Channel 54; BLUE ISLAND, IL; Owner: CATHOLIC VIEWS BROADCASTS, INC.)
W64CQ (Channel 64; ARLINGTON HEIGHTS, IL; Owner: TRINITY BROADCASTING NETWORK)
W57DN (Channel 57; ELGIN, IL; Owner: TRINITY BROADCASTING NETWORK)
WSPY-LP (Channel 30; PLANO, IL; Owner: WSPY-TV, INC.)
National Bridge Inventory (NBI) Statistics 44 Number of bridges791ft / 241m Total length $2,492,000 Total costs1,217,850 Total average daily traffic145,271 Total average daily truck traffic
New bridges - historical statistics
1 1930-1939 4 1950-1959 2 1960-1969 3 1970-1979 8 1980-1989 4 1990-1999 16 2000-2009 4 2010-2019 2 2020-2022
See full National Bridge Inventory statistics for Bolingbrook, IL
Home Mortgage Disclosure Act Aggregated Statistics For Year 2009(Based on 8 full and 6 partial tracts) A) FHA, FSA/RHS & VA B) Conventional C) Refinancings D) Home Improvement Loans E) Loans on Dwellings For 5+ Families F) Non-occupant Loans on G) Loans On Manufactured Number Average Value Number Average Value Number Average Value Number Average Value Number Average Value Number Average Value Number Average Value
LOANS ORIGINATED 351 $178,096 227 $197,510 1,969 $215,923 54 $91,651 1 $1,378,550 63 $132,010 4 $238,802 APPLICATIONS APPROVED, NOT ACCEPTED 33 $155,543 20 $216,112 185 $220,268 10 $27,387 0 $0 3 $119,753 0 $0 APPLICATIONS DENIED 59 $182,101 51 $176,671 591 $214,612 58 $66,630 0 $0 28 $125,629 0 $0 APPLICATIONS WITHDRAWN 27 $155,683 24 $177,878 304 $215,594 10 $91,388 0 $0 8 $115,145 0 $0 FILES CLOSED FOR INCOMPLETENESS 15 $173,531 6 $179,403 142 $207,863 6 $60,423 0 $0 3 $135,963 0 $0
Aggregated Statistics For Year 2008(Based on 8 full and 6 partial tracts) A) FHA, FSA/RHS & VA B) Conventional C) Refinancings D) Home Improvement Loans E) Loans on Dwellings For 5+ Families F) Non-occupant Loans on G) Loans On Manufactured Number Average Value Number Average Value Number Average Value Number Average Value Number Average Value Number Average Value Number Average Value
LOANS ORIGINATED 208 $200,523 379 $238,670 1,416 $210,573 90 $68,508 1 $131,070 85 $178,348 0 $0 APPLICATIONS APPROVED, NOT ACCEPTED 13 $224,096 55 $217,771 215 $209,325 36 $72,200 0 $0 11 $156,846 0 $0 APPLICATIONS DENIED 69 $200,083 88 $206,780 1,023 $206,633 164 $66,791 0 $0 36 $141,641 1 $58,250 APPLICATIONS WITHDRAWN 25 $183,639 50 $231,368 333 $211,462 25 $135,580 0 $0 16 $140,025 0 $0 FILES CLOSED FOR INCOMPLETENESS 11 $166,192 26 $213,939 145 $215,023 13 $121,804 0 $0 4 $183,070 0 $0
Aggregated Statistics For Year 2007(Based on 8 full and 6 partial tracts) A) FHA, FSA/RHS & VA B) Conventional C) Refinancings D) Home Improvement Loans E) Loans on Dwellings For 5+ Families F) Non-occupant Loans on G) Loans On Manufactured Number Average Value Number Average Value Number Average Value Number Average Value Number Average Value Number Average Value Number Average Value
LOANS ORIGINATED 57 $200,609 992 $196,027 2,029 $188,596 232 $73,663 1 $8,526,930 161 $148,183 0 $0 APPLICATIONS APPROVED, NOT ACCEPTED 1 $309,530 138 $199,856 415 $184,640 48 $66,323 0 $0 28 $173,043 0 $0 APPLICATIONS DENIED 9 $170,392 344 $191,484 1,447 $194,393 259 $78,965 1 $41,250 121 $158,495 2 $190,845 APPLICATIONS WITHDRAWN 7 $181,193 124 $188,135 533 $213,518 44 $127,495 0 $0 27 $152,001 0 $0 FILES CLOSED FOR INCOMPLETENESS 1 $207,000 51 $224,408 277 $214,433 10 $170,158 0 $0 17 $166,963 0 $0
Aggregated Statistics For Year 2006(Based on 8 full and 6 partial tracts) A) FHA, FSA/RHS & VA B) Conventional C) Refinancings D) Home Improvement Loans E) Loans on Dwellings For 5+ Families F) Non-occupant Loans on G) Loans On Manufactured Number Average Value Number Average Value Number Average Value Number Average Value Number Average Value Number Average Value Number Average Value
LOANS ORIGINATED 61 $193,544 2,047 $175,873 2,707 $175,244 286 $74,774 2 $2,090,040 294 $150,984 1 $204,120 APPLICATIONS APPROVED, NOT ACCEPTED 5 $217,150 305 $156,855 534 $182,613 77 $91,945 0 $0 43 $140,166 0 $0 APPLICATIONS DENIED 12 $184,334 617 $163,709 1,685 $188,620 269 $68,038 0 $0 107 $183,454 1 $22,920 APPLICATIONS WITHDRAWN 14 $178,586 319 $145,482 863 $190,267 43 $116,180 0 $0 61 $127,091 0 $0 FILES CLOSED FOR INCOMPLETENESS 2 $188,690 64 $162,931 271 $184,190 12 $83,342 0 $0 12 $130,520 0 $0
Aggregated Statistics For Year 2005(Based on 8 full and 6 partial tracts) A) FHA, FSA/RHS & VA B) Conventional C) Refinancings D) Home Improvement Loans E) Loans on Dwellings For 5+ Families F) Non-occupant Loans on G) Loans On Manufactured Number Average Value Number Average Value Number Average Value Number Average Value Number Average Value Number Average Value Number Average Value
LOANS ORIGINATED 129 $181,257 2,644 $168,035 3,190 $172,708 276 $83,985 1 $757,890 325 $131,278 4 $38,488 APPLICATIONS APPROVED, NOT ACCEPTED 11 $176,435 326 $163,600 564 $161,062 57 $73,400 0 $0 55 $143,835 0 $0 APPLICATIONS DENIED 20 $168,214 560 $147,887 1,707 $173,150 269 $60,597 1 $292,250 96 $143,613 3 $77,667 APPLICATIONS WITHDRAWN 13 $171,965 316 $160,309 1,052 $185,066 71 $211,433 0 $0 73 $138,726 0 $0 FILES CLOSED FOR INCOMPLETENESS 7 $197,003 70 $158,108 344 $180,024 14 $63,729 0 $0 9 $199,116 0 $0
Aggregated Statistics For Year 2004(Based on 8 full and 6 partial tracts) A) FHA, FSA/RHS & VA B) Conventional C) Refinancings D) Home Improvement Loans E) Loans on Dwellings For 5+ Families F) Non-occupant Loans on G) Loans On Manufactured Number Average Value Number Average Value Number Average Value Number Average Value Number Average Value Number Average Value Number Average Value
LOANS ORIGINATED 308 $162,512 2,272 $174,094 3,151 $163,781 253 $67,036 2 $2,444,080 273 $125,668 8 $47,188 APPLICATIONS APPROVED, NOT ACCEPTED 19 $163,731 298 $169,303 524 $157,265 49 $70,397 0 $0 42 $122,866 4 $48,720 APPLICATIONS DENIED 37 $166,350 357 $151,748 1,731 $153,098 277 $46,508 1 $125,650 79 $119,370 7 $38,453 APPLICATIONS WITHDRAWN 22 $174,565 218 $175,396 997 $160,973 51 $82,873 0 $0 33 $114,485 3 $78,673 FILES CLOSED FOR INCOMPLETENESS 10 $152,573 54 $167,473 322 $172,725 18 $60,536 0 $0 10 $190,718 0 $0
Aggregated Statistics For Year 2003(Based on 8 full and 6 partial tracts) A) FHA, FSA/RHS & VA B) Conventional C) Refinancings D) Home Improvement Loans E) Loans on Dwellings For 5+ Families F) Non-occupant Loans on Number Average Value Number Average Value Number Average Value Number Average Value Number Average Value Number Average Value
LOANS ORIGINATED 434 $155,415 1,855 $178,584 5,978 $154,049 149 $38,013 4 $167,528 216 $111,056 APPLICATIONS APPROVED, NOT ACCEPTED 18 $154,909 243 $184,210 734 $145,319 39 $28,106 0 $0 30 $125,055 APPLICATIONS DENIED 38 $156,673 237 $154,455 1,691 $133,281 217 $24,995 1 $20,000 60 $104,114 APPLICATIONS WITHDRAWN 30 $158,159 192 $166,066 1,382 $139,836 32 $46,277 0 $0 28 $113,816 FILES CLOSED FOR INCOMPLETENESS 9 $173,444 66 $167,635 242 $148,542 14 $26,104 0 $0 4 $127,135
Aggregated Statistics For Year 2002(Based on 8 full and 5 partial tracts) A) FHA, FSA/RHS & VA B) Conventional C) Refinancings D) Home Improvement Loans E) Loans on Dwellings For 5+ Families F) Non-occupant Loans on Number Average Value Number Average Value Number Average Value Number Average Value Number Average Value Number Average Value
LOANS ORIGINATED 487 $145,716 1,378 $170,367 3,739 $150,173 165 $22,728 4 $615,830 134 $111,731 APPLICATIONS APPROVED, NOT ACCEPTED 24 $139,747 114 $161,165 524 $134,104 38 $26,188 0 $0 14 $108,239 APPLICATIONS DENIED 52 $139,722 131 $146,032 1,089 $120,815 202 $17,100 0 $0 36 $99,737 APPLICATIONS WITHDRAWN 37 $151,800 103 $155,710 765 $134,240 25 $37,116 1 $772,000 20 $111,566 FILES CLOSED FOR INCOMPLETENESS 10 $139,532 25 $162,021 322 $140,079 4 $35,255 0 $0 6 $122,187
Aggregated Statistics For Year 2001(Based on 8 full and 5 partial tracts) A) FHA, FSA/RHS & VA B) Conventional C) Refinancings D) Home Improvement Loans F) Non-occupant Loans on Number Average Value Number Average Value Number Average Value Number Average Value Number Average Value
LOANS ORIGINATED 565 $135,456 1,165 $155,414 2,985 $137,840 197 $23,016 97 $96,621 APPLICATIONS APPROVED, NOT ACCEPTED 15 $126,840 95 $141,763 372 $105,736 48 $27,410 11 $92,690 APPLICATIONS DENIED 57 $132,754 125 $134,103 1,116 $101,657 229 $17,479 23 $74,801 APPLICATIONS WITHDRAWN 49 $136,187 94 $157,822 471 $117,541 65 $27,964 14 $70,055 FILES CLOSED FOR INCOMPLETENESS 12 $106,419 34 $138,973 169 $126,266 10 $21,395 4 $64,043
Aggregated Statistics For Year 2000(Based on 8 full and 5 partial tracts) A) FHA, FSA/RHS & VA B) Conventional C) Refinancings D) Home Improvement Loans E) Loans on Dwellings For 5+ Families F) Non-occupant Loans on Number Average Value Number Average Value Number Average Value Number Average Value Number Average Value Number Average Value
LOANS ORIGINATED 545 $124,370 1,096 $152,411 753 $99,036 261 $21,950 6 $188,443 71 $82,377 APPLICATIONS APPROVED, NOT ACCEPTED 28 $113,805 89 $133,178 187 $86,734 94 $24,832 1 $114,000 6 $88,278 APPLICATIONS DENIED 69 $119,178 198 $112,517 736 $80,640 244 $19,069 1 $101,000 29 $82,854 APPLICATIONS WITHDRAWN 41 $127,057 113 $136,504 299 $79,686 73 $21,405 0 $0 18 $77,256 FILES CLOSED FOR INCOMPLETENESS 7 $112,969 31 $104,964 166 $104,065 9 $27,459 0 $0 6 $66,527
Aggregated Statistics For Year 1999(Based on 8 full and 5 partial tracts) A) FHA, FSA/RHS & VA B) Conventional C) Refinancings D) Home Improvement Loans E) Loans on Dwellings For 5+ Families F) Non-occupant Loans on Number Average Value Number Average Value Number Average Value Number Average Value Number Average Value Number Average Value
LOANS ORIGINATED 623 $121,761 1,003 $144,691 1,367 $106,327 286 $18,188 2 $344,000 92 $70,267 APPLICATIONS APPROVED, NOT ACCEPTED 15 $124,455 87 $139,243 304 $92,252 68 $17,484 0 $0 5 $79,694 APPLICATIONS DENIED 67 $122,025 158 $116,759 743 $87,760 266 $16,179 0 $0 29 $71,691 APPLICATIONS WITHDRAWN 59 $128,145 94 $138,296 410 $96,389 85 $26,678 0 $0 16 $69,747 FILES CLOSED FOR INCOMPLETENESS 13 $107,632 22 $102,379 207 $108,110 5 $30,630 0 $0 5 $65,208
Detailed mortgage data for all 14 tracts in Bolingbrook, IL
Private Mortgage Insurance Companies Aggregated Statistics For Year 2009(Based on 8 full and 6 partial tracts) A) Conventional B) Refinancings C) Non-occupant Loans on Number Average Value Number Average Value Number Average Value
LOANS ORIGINATED 49 $194,045 33 $254,949 1 $76,250 APPLICATIONS APPROVED, NOT ACCEPTED 16 $217,374 35 $236,108 2 $118,500 APPLICATIONS DENIED 7 $190,096 10 $226,217 0 $0 APPLICATIONS WITHDRAWN 1 $185,790 10 $209,622 0 $0 FILES CLOSED FOR INCOMPLETENESS 2 $403,050 4 $218,980 0 $0
Aggregated Statistics For Year 2008(Based on 8 full and 6 partial tracts) A) Conventional B) Refinancings C) Non-occupant Loans on Number Average Value Number Average Value Number Average Value
LOANS ORIGINATED 163 $208,457 156 $229,314 15 $153,019 APPLICATIONS APPROVED, NOT ACCEPTED 74 $210,223 97 $228,558 9 $172,308 APPLICATIONS DENIED 19 $210,922 18 $240,206 6 $173,533 APPLICATIONS WITHDRAWN 13 $186,155 9 $242,083 1 $155,020 FILES CLOSED FOR INCOMPLETENESS 12 $246,849 13 $213,298 7 $232,799
Aggregated Statistics For Year 2007(Based on 8 full and 6 partial tracts) A) Conventional B) Refinancings C) Non-occupant Loans on D) Loans On Manufactured Number Average Value Number Average Value Number Average Value Number Average Value
LOANS ORIGINATED 340 $211,216 249 $220,410 21 $184,559 1 $126,000 APPLICATIONS APPROVED, NOT ACCEPTED 53 $204,843 69 $220,913 5 $198,460 0 $0 APPLICATIONS DENIED 16 $168,313 2 $281,445 0 $0 0 $0 APPLICATIONS WITHDRAWN 20 $224,826 34 $223,091 1 $223,980 0 $0 FILES CLOSED FOR INCOMPLETENESS 2 $168,885 2 $306,640 0 $0 0 $0
Aggregated Statistics For Year 2006(Based on 8 full and 6 partial tracts) A) Conventional B) Refinancings C) Non-occupant Loans on Number Average Value Number Average Value Number Average Value
LOANS ORIGINATED 263 $210,682 140 $217,541 18 $182,162 APPLICATIONS APPROVED, NOT ACCEPTED 61 $232,473 41 $220,514 3 $190,167 APPLICATIONS DENIED 1 $258,040 2 $282,655 0 $0 APPLICATIONS WITHDRAWN 8 $234,256 17 $206,385 0 $0 FILES CLOSED FOR INCOMPLETENESS 0 $0 4 $201,538 0 $0
Aggregated Statistics For Year 2005(Based on 8 full and 6 partial tracts) A) Conventional B) Refinancings C) Non-occupant Loans on Number Average Value Number Average Value Number Average Value
LOANS ORIGINATED 345 $222,324 218 $204,394 24 $174,728 APPLICATIONS APPROVED, NOT ACCEPTED 49 $213,760 84 $194,914 7 $149,901 APPLICATIONS DENIED 8 $167,684 7 $173,057 3 $143,917 APPLICATIONS WITHDRAWN 24 $220,872 23 $201,754 2 $242,570 FILES CLOSED FOR INCOMPLETENESS 4 $219,455 4 $168,605 1 $177,210
Aggregated Statistics For Year 2004(Based on 8 full and 6 partial tracts) A) Conventional B) Refinancings C) Non-occupant Loans on D) Loans On Manufactured Number Average Value Number Average Value Number Average Value Number Average Value
LOANS ORIGINATED 497 $201,955 268 $179,281 27 $150,951 1 $183,730 APPLICATIONS APPROVED, NOT ACCEPTED 99 $205,897 90 $179,149 1 $178,880 0 $0 APPLICATIONS DENIED 7 $180,509 10 $332,446 2 $116,760 0 $0 APPLICATIONS WITHDRAWN 16 $198,742 26 $166,337 1 $213,830 0 $0 FILES CLOSED FOR INCOMPLETENESS 7 $189,664 3 $217,023 1 $154,000 0 $0
Aggregated Statistics For Year 2003(Based on 8 full and 6 partial tracts) A) Conventional B) Refinancings C) Non-occupant Loans on Number Average Value Number Average Value Number Average Value
LOANS ORIGINATED 713 $195,125 666 $169,053 47 $124,284 APPLICATIONS APPROVED, NOT ACCEPTED 90 $189,837 153 $176,678 8 $120,864 APPLICATIONS DENIED 13 $197,368 9 $168,650 1 $178,790 APPLICATIONS WITHDRAWN 29 $191,146 53 $165,947 1 $202,800 FILES CLOSED FOR INCOMPLETENESS 0 $0 1 $144,250 0 $0
Aggregated Statistics For Year 2002(Based on 8 full and 5 partial tracts) A) Conventional B) Refinancings C) Non-occupant Loans on Number Average Value Number Average Value Number Average Value
LOANS ORIGINATED 486 $165,358 530 $158,189 25 $112,478 APPLICATIONS APPROVED, NOT ACCEPTED 61 $174,280 100 $148,829 4 $115,978 APPLICATIONS DENIED 8 $170,844 13 $163,569 3 $136,797 APPLICATIONS WITHDRAWN 22 $164,476 31 $150,089 2 $135,310 FILES CLOSED FOR INCOMPLETENESS 1 $140,600 2 $117,245 0 $0
Aggregated Statistics For Year 2001(Based on 8 full and 5 partial tracts) A) Conventional B) Refinancings C) Non-occupant Loans on Number Average Value Number Average Value Number Average Value
LOANS ORIGINATED 434 $159,367 436 $148,958 24 $104,340 APPLICATIONS APPROVED, NOT ACCEPTED 67 $172,802 75 $146,167 3 $122,560 APPLICATIONS DENIED 7 $192,046 11 $133,009 1 $168,750 APPLICATIONS WITHDRAWN 18 $174,655 15 $135,188 1 $94,000 FILES CLOSED FOR INCOMPLETENESS 4 $185,755 4 $167,092 0 $0
Aggregated Statistics For Year 2000(Based on 8 full and 5 partial tracts) A) Conventional B) Refinancings C) Non-occupant Loans on Number Average Value Number Average Value Number Average Value
LOANS ORIGINATED 414 $146,804 91 $130,946 20 $90,426 APPLICATIONS APPROVED, NOT ACCEPTED 49 $160,227 18 $131,798 4 $94,500 APPLICATIONS DENIED 17 $129,878 11 $169,010 3 $99,957 APPLICATIONS WITHDRAWN 9 $162,921 3 $180,117 0 $0 FILES CLOSED FOR INCOMPLETENESS 6 $131,328 5 $136,064 0 $0
Aggregated Statistics For Year 1999(Based on 8 full and 5 partial tracts) A) Conventional B) Refinancings C) Non-occupant Loans on Number Average Value Number Average Value Number Average Value
LOANS ORIGINATED 419 $145,768 213 $133,709 16 $74,427 APPLICATIONS APPROVED, NOT ACCEPTED 49 $147,953 50 $131,199 2 $85,085 APPLICATIONS DENIED 15 $131,901 13 $143,167 0 $0 APPLICATIONS WITHDRAWN 8 $150,691 7 $137,047 1 $54,380 FILES CLOSED FOR INCOMPLETENESS 2 $132,725 3 $208,783 0 $0
Fire-safe hotels and motels in Bolingbrook, Illinois:
Best Western Plus Bolingbrook, 225 W S Frontage Rd, Bolingbrook, Illinois 60440 Phone: (630) 226-0000, Fax: (630) 226-1111
Aloft Bolingbrook, 500 Janes Ave, Bolingbrook, Illinois 60440 Phone: (630) 410-6367, Fax: (630) 410-6368
Hampton Inn & Suites, 165 Remington Blvd, Bolingbrook, Illinois 60440 Phone: (630) 759-7100, Fax: (630) 771-1300
Hilton Garden Inn, 135 Remington Blvd, Bolingbrook, Illinois 60440 Phone: (630) 771-1500, Fax: (630) 771-1300
Quality Inn, 175 Remington Blvd, Bolingbrook, Illinois 60440 Phone: (630) 378-5300, Fax: (630) 378-5400
Residence Inn by Marriott, 180 Remington Blvd, Bolingbrook, Illinois 60440 Phone: (630) 332-5200
All 6 fire-safe hotels and motels in Bolingbrook, Illinois
Most common first names in Bolingbrook, IL among deceased individuals Name Count Lived (average)
Mary 83 78.4 years John 59 69.9 years Robert 59 68.9 years James 52 71.8 years Helen 48 82.9 years Dorothy 41 79.0 years William 40 74.5 years Margaret 38 82.2 years Joseph 37 72.4 years Frank 35 75.8 years
Most common last names in Bolingbrook, IL among deceased individuals Last name Count Lived (average)
Smith 29 75.3 years Anderson 17 75.0 years Johnson 12 66.3 years Miller 10 80.1 years Moore 10 75.5 years Jackson 9 63.7 years Brown 8 64.5 years Davis 8 78.3 years Lewis 7 69.7 years Martinez 7 70.8 years
Bolingbrook compared to Illinois state average:
Unemployed percentage significantly below state average. Black race population percentage above state average. Hispanic race population percentage above state average. Median age below state average. Foreign-born population percentage above state average. Renting percentage below state average. Number of rooms per house above state average. House age below state average. Bolingbrook on our top lists :
#13 on the list of "Top 101 cities with the smallest household incomes disparities (population 50,000+)"
#18 on the list of "Top 101 cities with largest percentage of females in occupations: business and financial operations occupations (population 50,000+)"
#28 on the list of "Top 101 cities with largest percentage of males in industries: wholesale trade (population 50,000+)"
#30 on the list of "Top 101 cities with the lowest number of burglaries per 100,000 residents (population 50,000+)"
#33 on the list of "Top 101 cities with largest percentage of males in occupations: health diagnosing and treating practitioners and other technical occupations (population 50,000+)"
#33 on the list of "Top 100 cities with highest median household income and median resident age less than 35 (pop. 50,000+)"
#34 on the list of "Top 101 cities with the lowest number of auto thefts per 100,000 residents (population 50,000+)"
#36 on the list of "Top 100 cities with biggest houses (pop. 50,000+)"
#40 on the list of "Top 100 most racially diverse cities (pop. 50,000+)"
#42 on the list of "Top 101 cities with largest percentage of males in occupations: material moving occupations (population 50,000+)"
#52 on the list of "Top 100 high-educated but low-earning cities (pop. 50,000+)"
#66 on the list of "Top 101 cities with largest percentage of males in industries: administrative and support and waste management services (population 50,000+)"
#67 on the list of "Top 101 cities with the largest temperature differences during a year (population 50,000+)"
#77 on the list of "Top 101 cities with largest percentage of females in industries: transportation and warehousing (population 50,000+)"
#80 on the list of "Top 101 cities with the highest ratio of rapes to murders between 2002 and 2012 (population 50,000+)"
#81 on the list of "Top 101 cities with the coldest winters (population 50,000+)"
#82 on the list of "Top 101 cities with the lowest daily low temperatures (population 50,000+)"
#84 on the list of "Top 101 cities with largest percentage of males in industries: transportation and warehousing (population 50,000+)"
#86 on the list of "Top 101 cities with the smallest city-data.com crime index per police officer (population 50,000+)"
#87 on the list of "Top 101 cities with the smallest percentage of high school students in private schools (3,000+ students)"
#54 (60439) on the list of "Top 101 zip codes with the largest percentage of Polish first ancestries (pop 5,000+)"
#71 (60439) on the list of "Top 101 zip codes with the largest percentage of Lithuanian first ancestries"
#7 on the list of "Top 101 counties with the lowest percentage of residents relocating from foreign countries between 2010 and 2011"
#10 on the list of "Top 101 counties with the highest percentage of residents that drank alcohol in the past 30 days"
#18 on the list of "Top 101 counties with the largest increase in the number of infant deaths per 1000 residents 2000-2006 to 2007-2013 (pop. 50,000+)"
#19 on the list of "Top 101 counties with the largest decrease in the number of births per 1000 residents 2000-2006 to 2007-2013 (pop 50,000+)"
#48 on the list of "Top 101 counties with the lowest surface withdrawal of fresh water for public supply (pop. 50,000+)"
Top Patent Applicants
Tonglin Shang (32)
Dayao Chen (21)
Zonghai Chen (16)
Ilias Belharouak (15)
Trevor Mason (12)
David A. Grattan (9)
Pengdi Han (8)
Raghubir S. Mutum (8)
Om Prakash Suthar (8)
Kennedy Amoako Darko (7)
Total of 555 patent applications in 2008-2024.
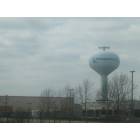


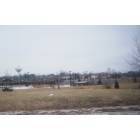
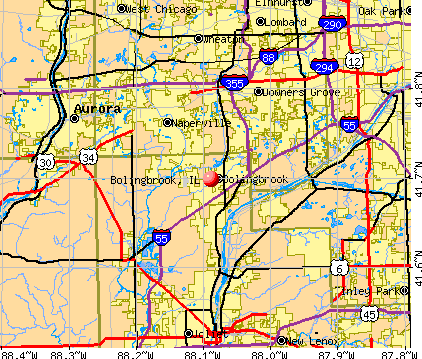


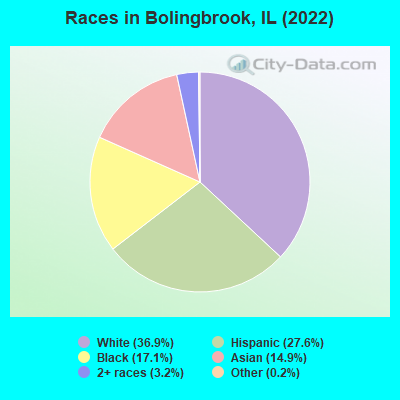
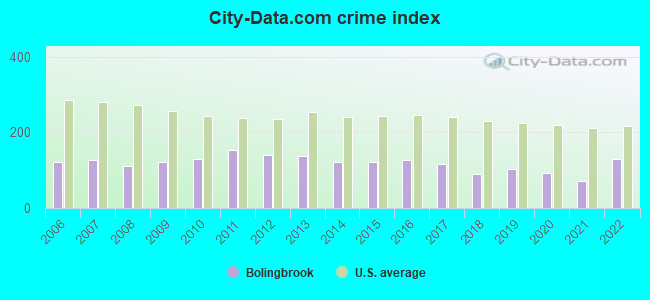
 Recent articles from our blog. Our writers, many of them Ph.D. graduates or candidates, create easy-to-read articles on a wide variety of topics.

 (23.3 miles
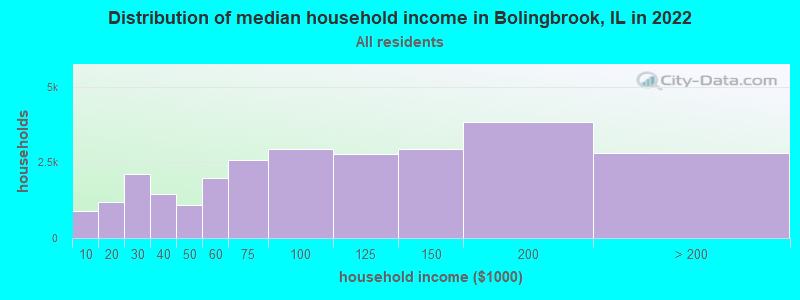
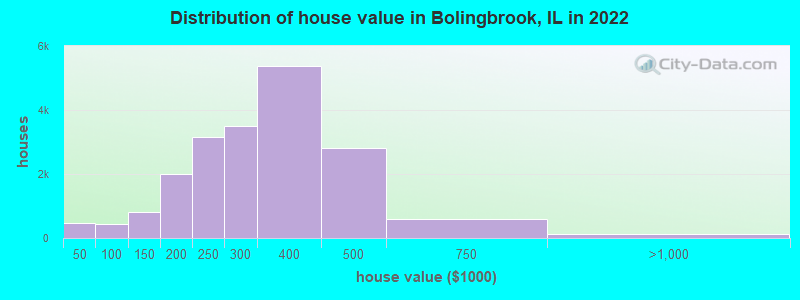

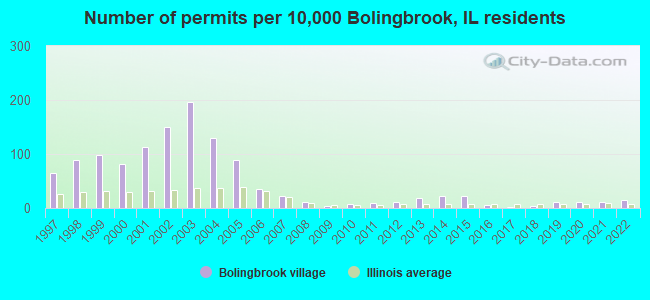
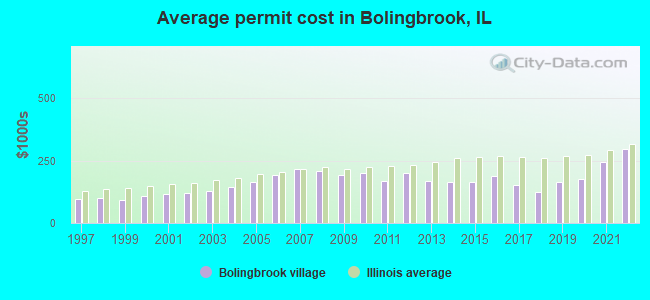

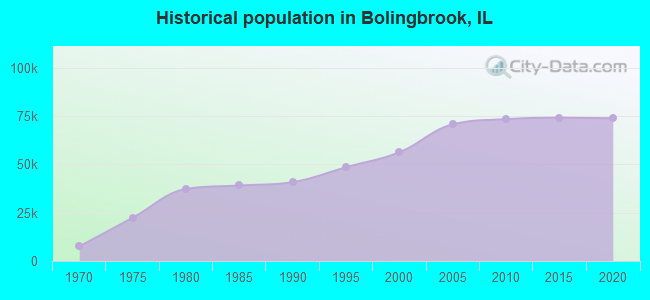
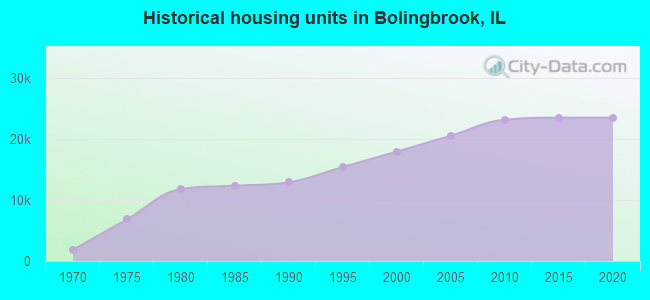
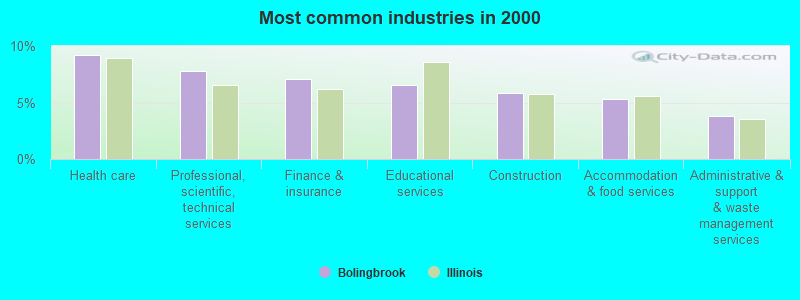
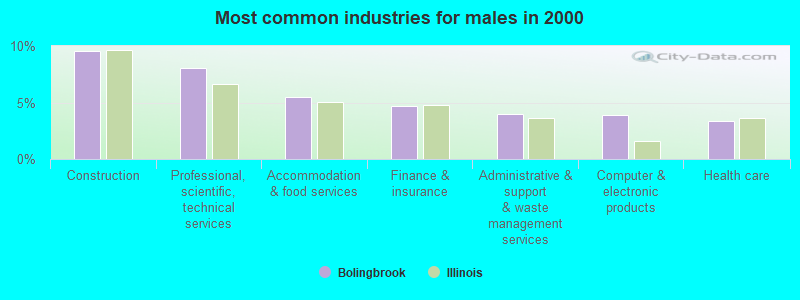
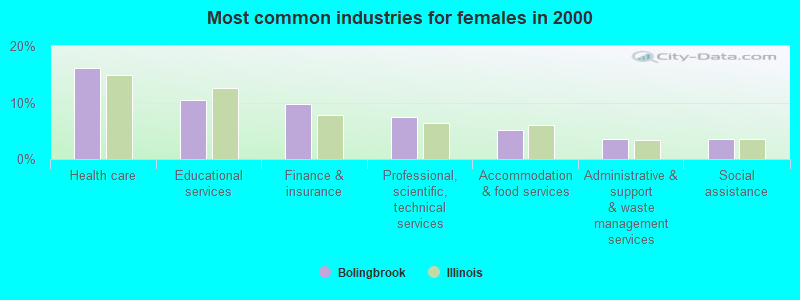
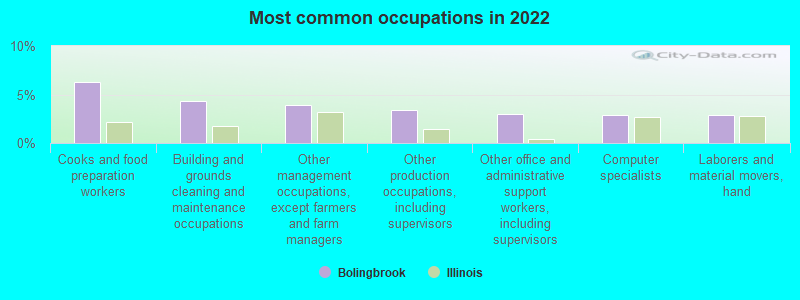
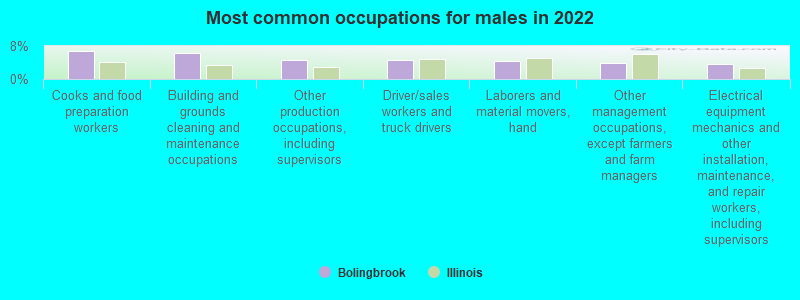
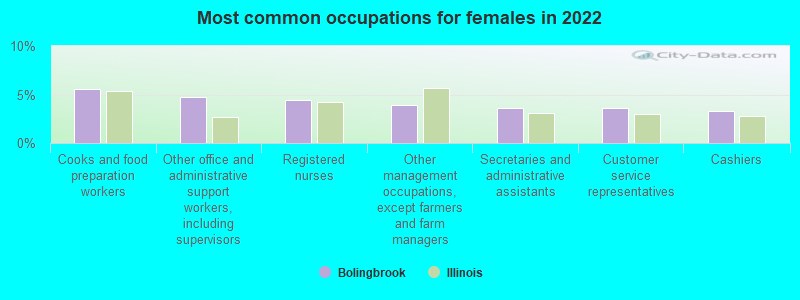
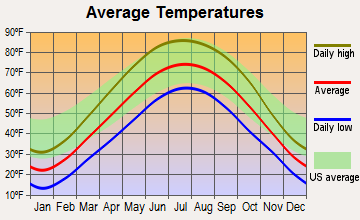
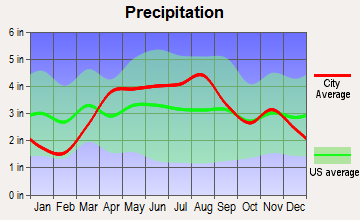
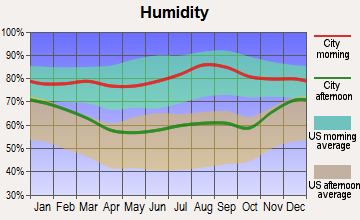
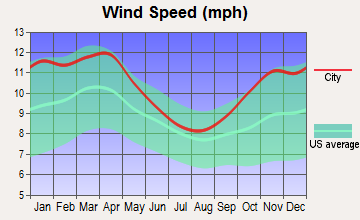
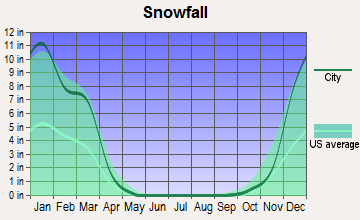
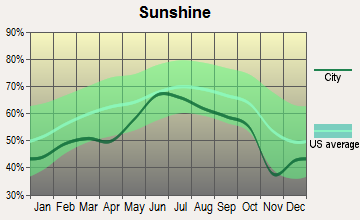
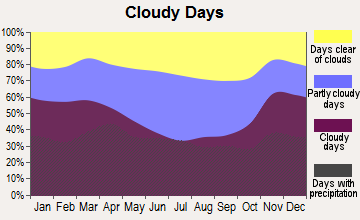
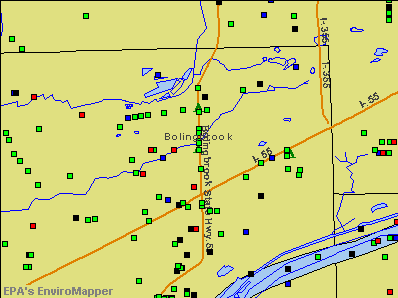

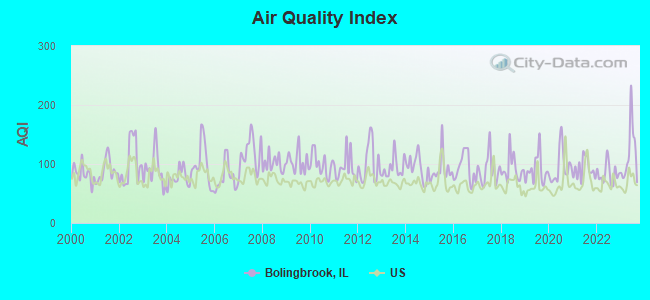
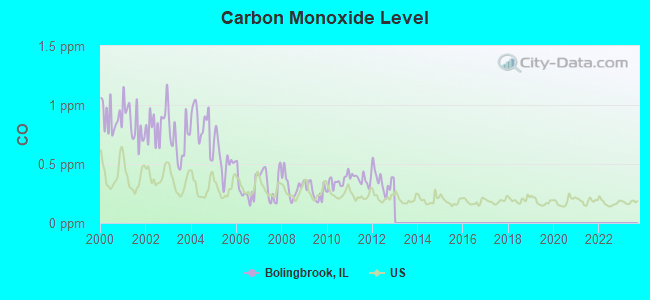
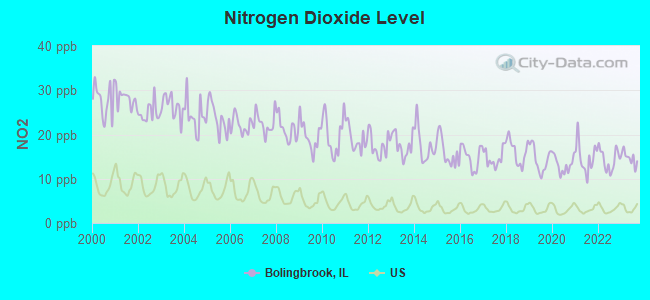
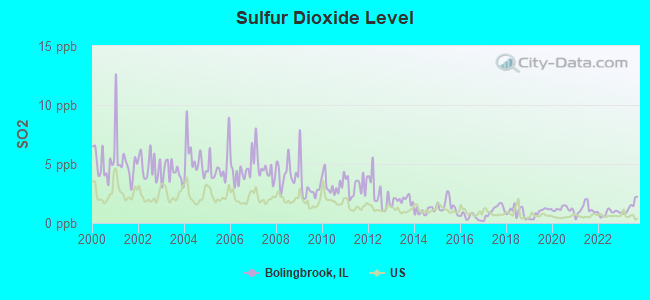
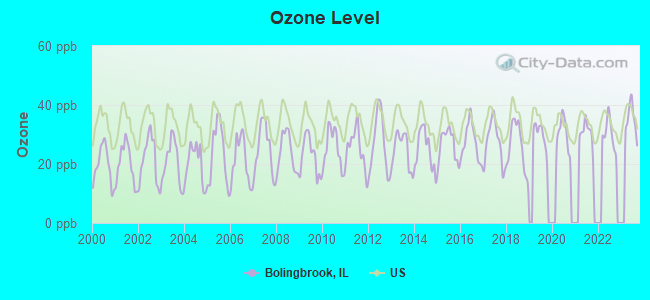
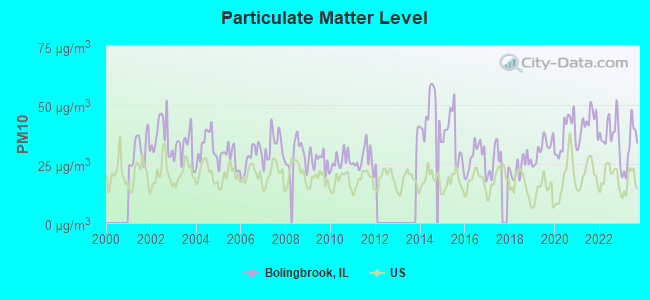
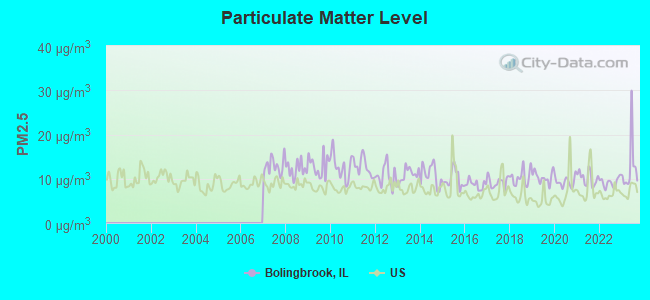
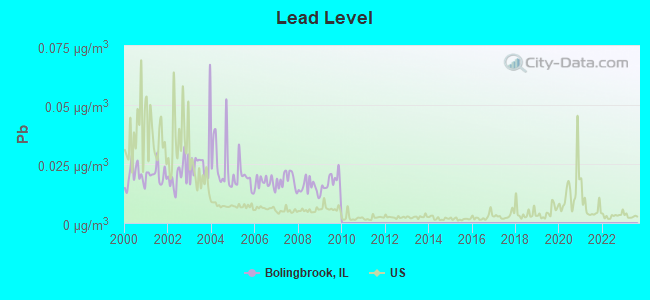
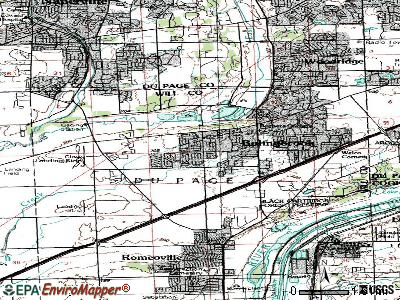
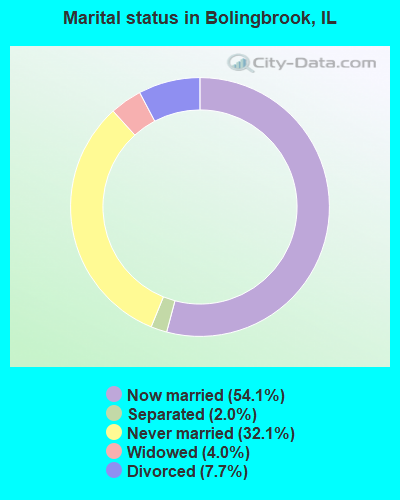
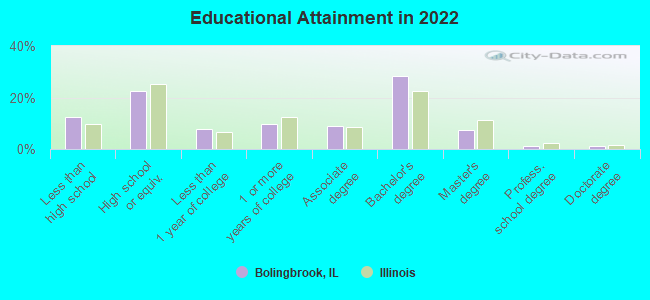
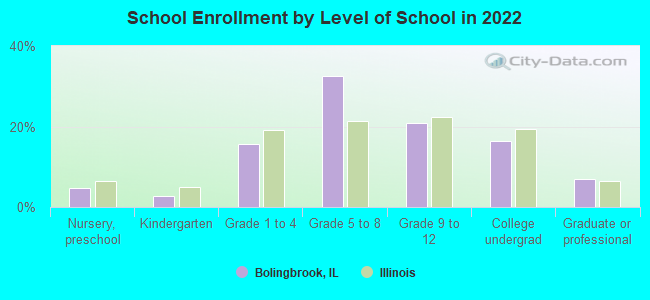
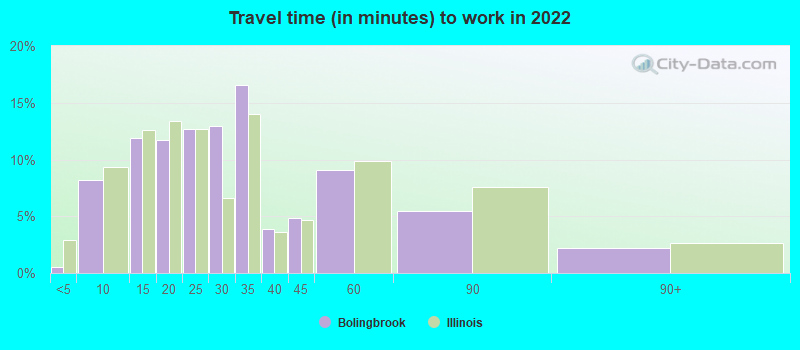
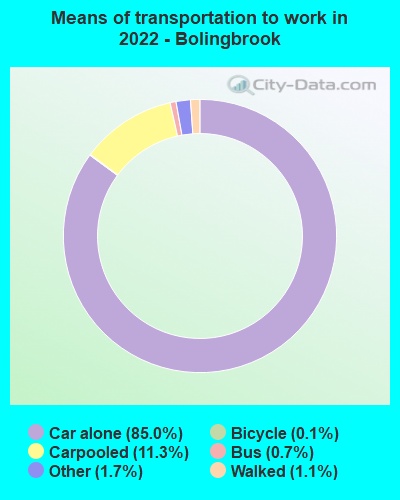
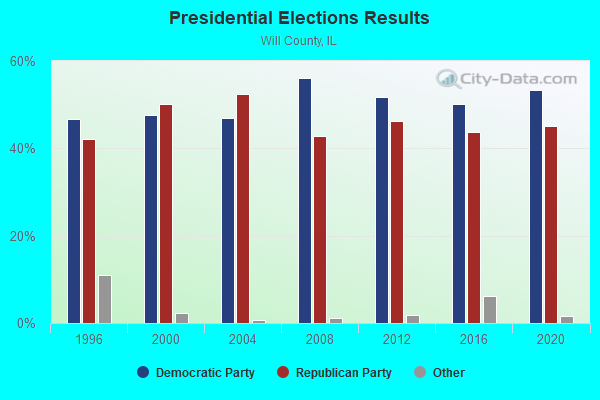
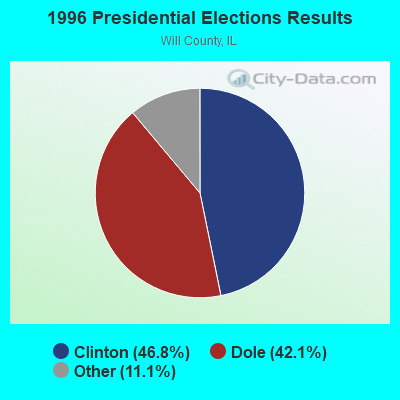
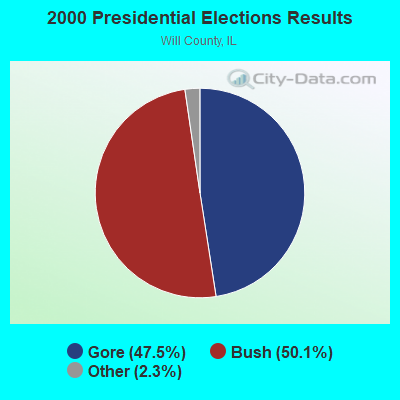
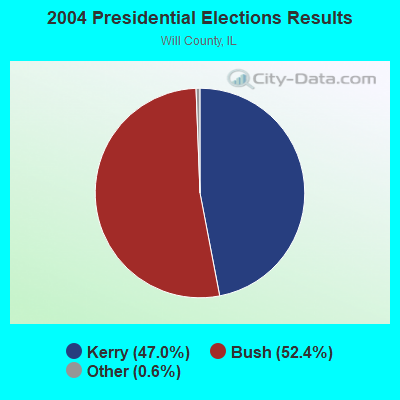
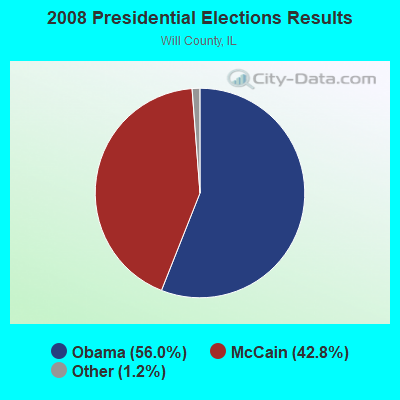
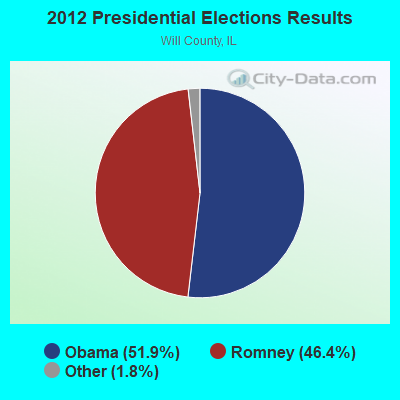
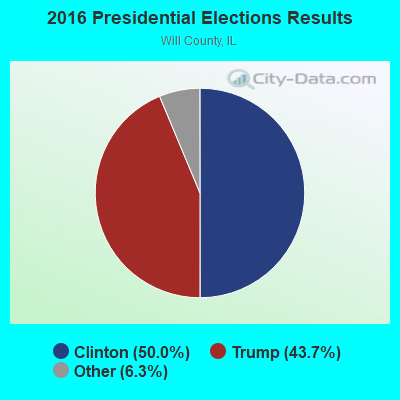
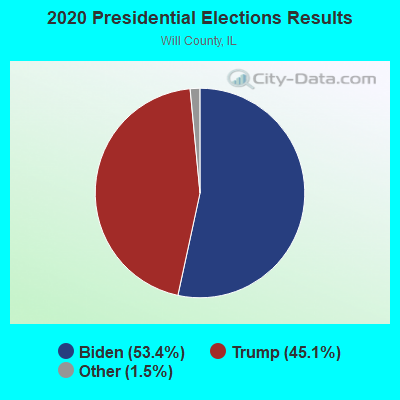
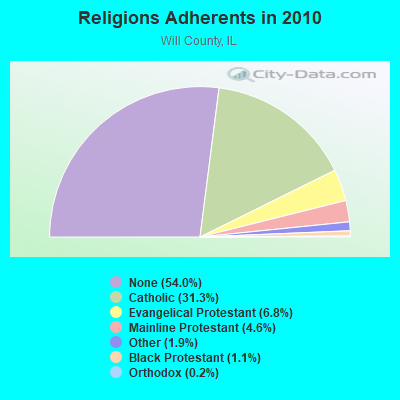
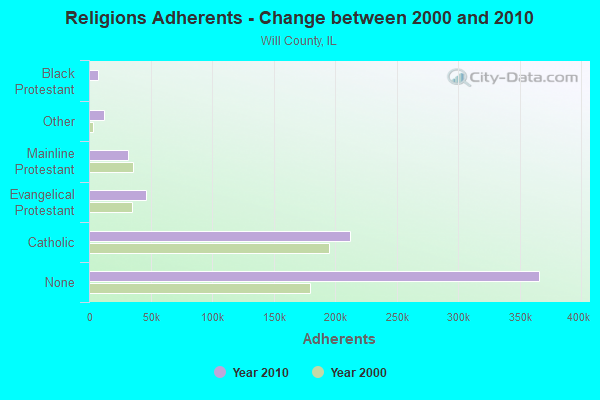
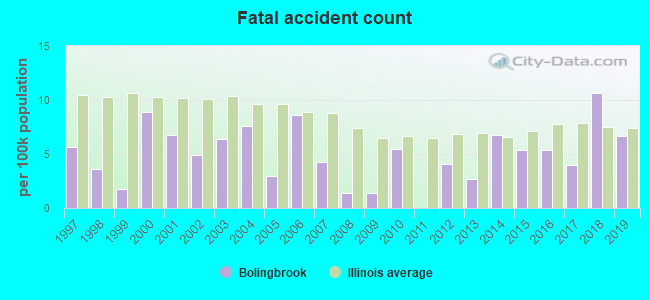
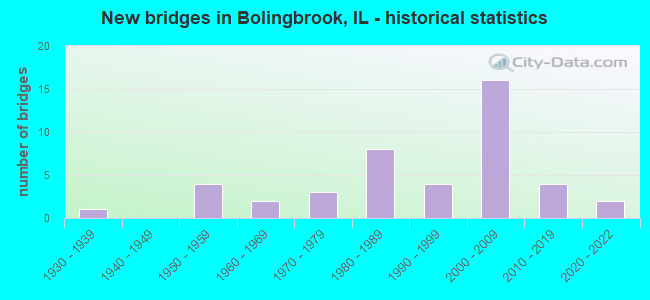
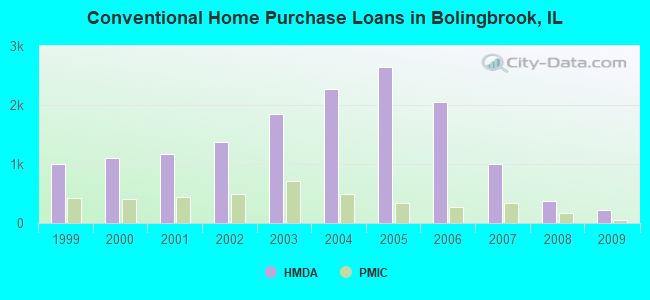
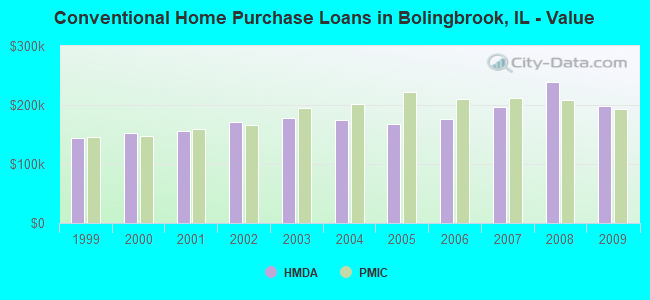
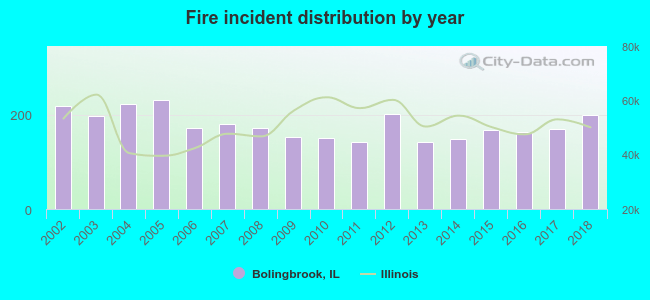 Based on the data from the years 2002 - 2018 the average number of fire incidents per year is 178. The highest number of fire incidents - 230 took place in 2005, and the least - 141 in 2011. The data has a decreasing trend.
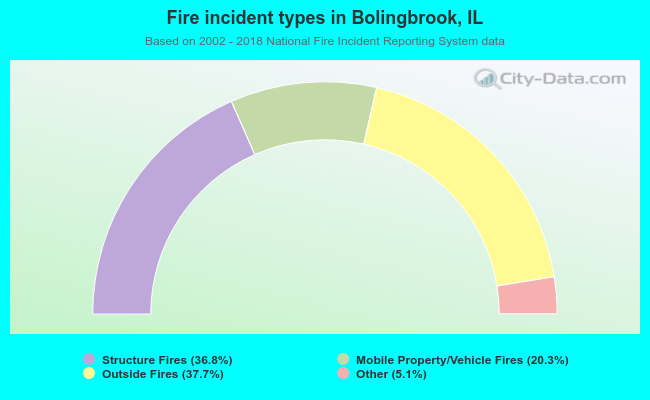 When looking into fire subcategories, the most reports belonged to: Outside Fires (37.7%), and Structure Fires (36.8%).